
A Review of Machine Learning Algorithms for Retinal Cyst Segmentation on Optical Coherence Tomography
Abstract
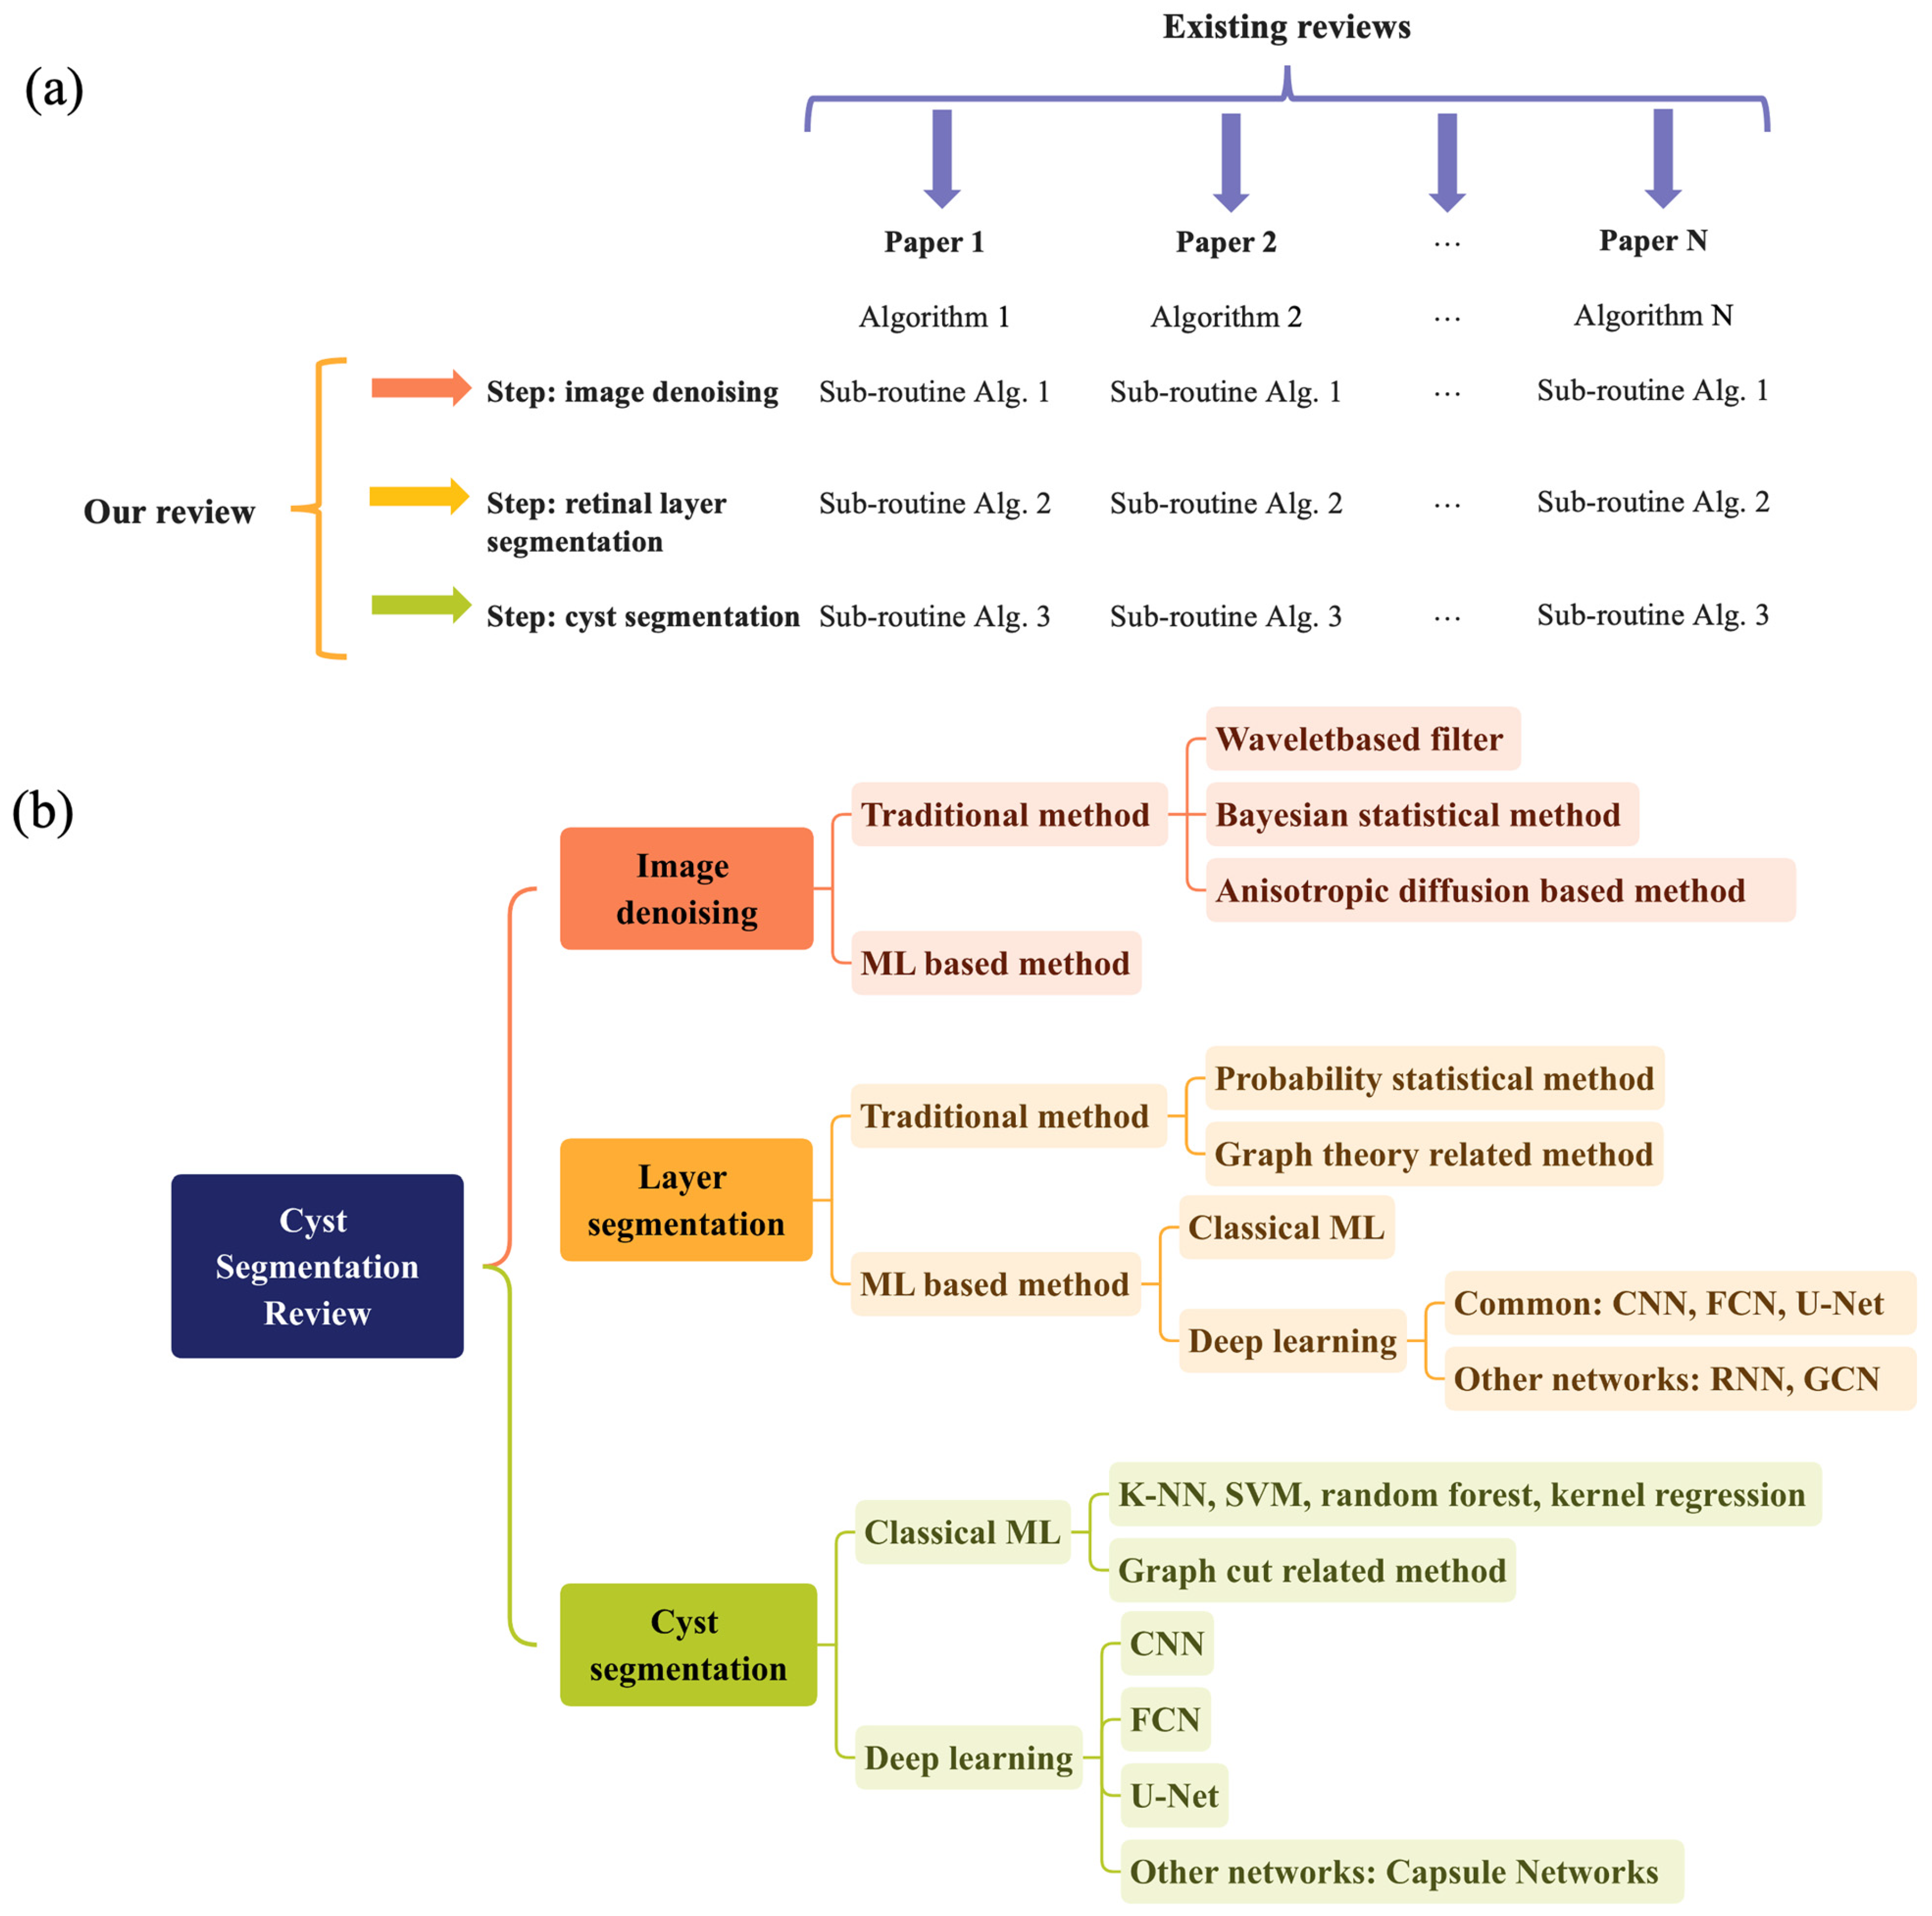
:1. Introduction
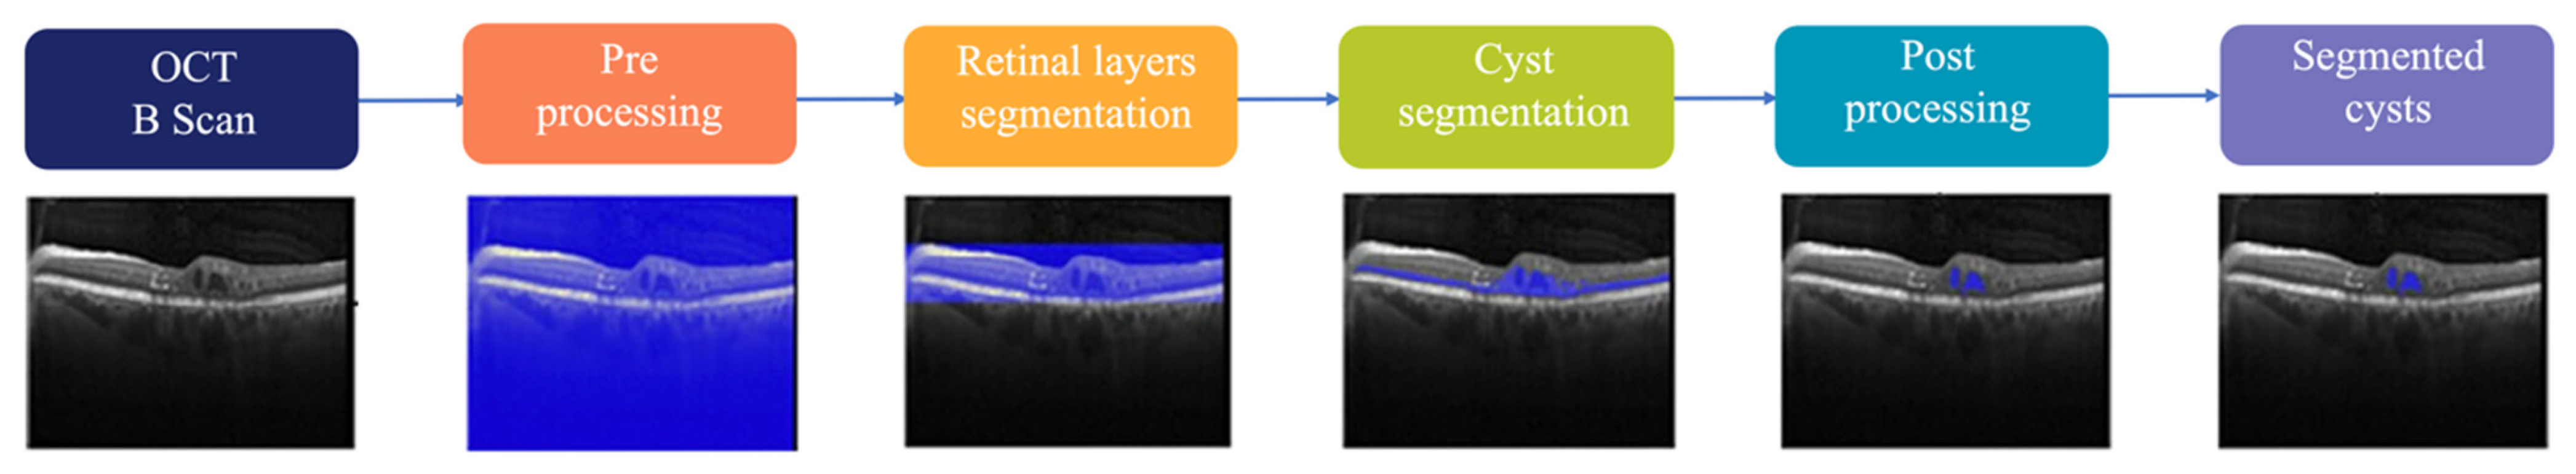
2. Cyst Segmentation System
2.1. Denoising Technique of Image
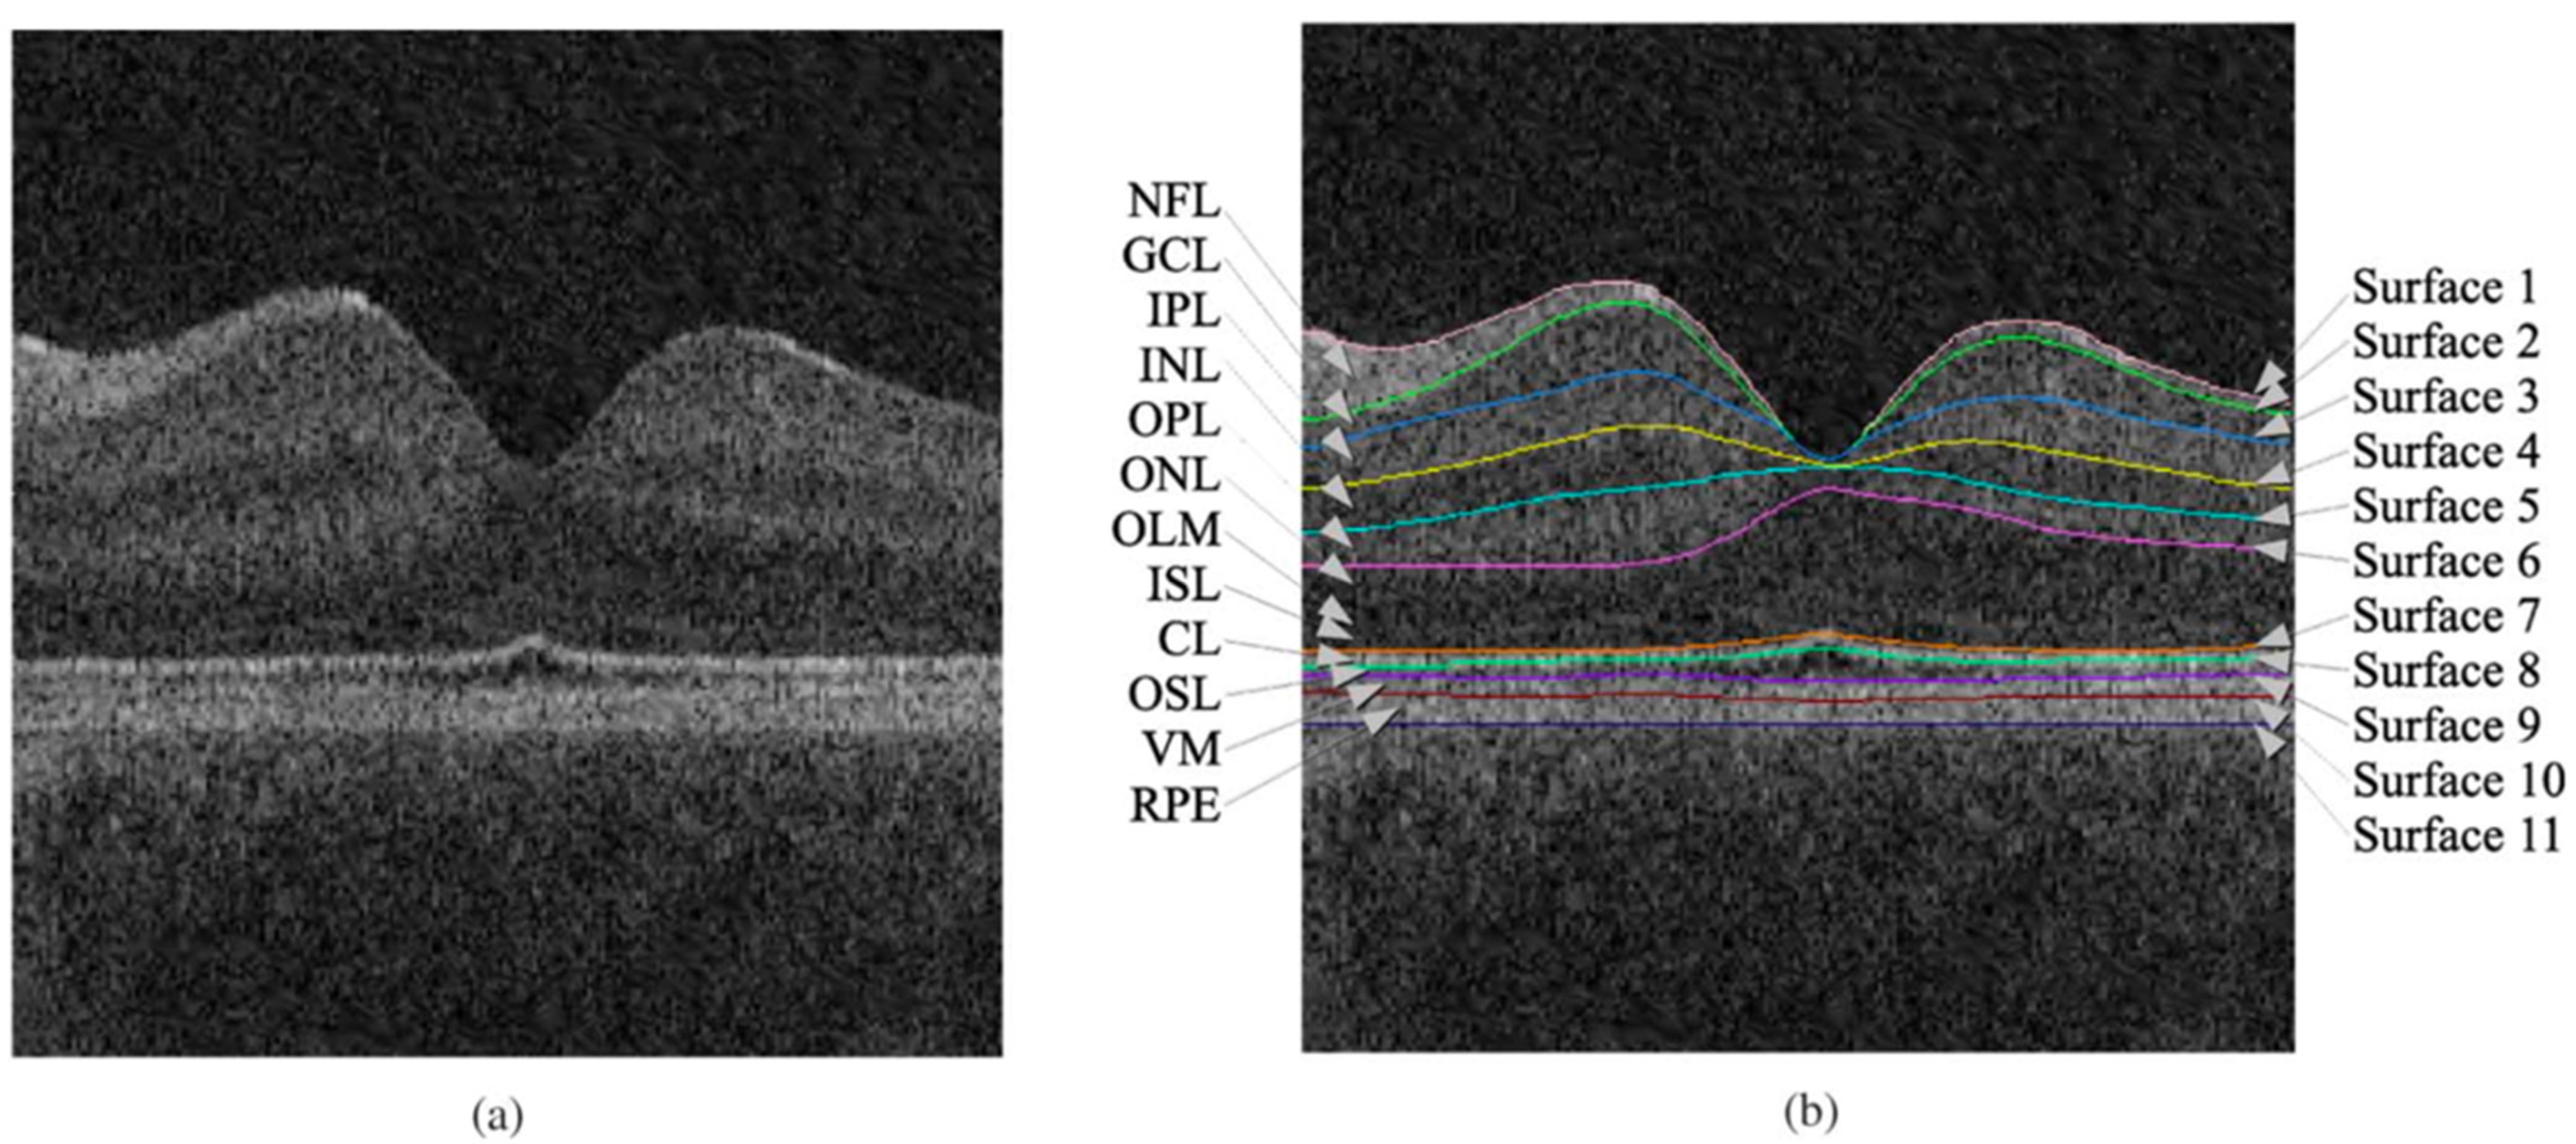
2.2. Retinal Layer Segmentation
2.3. Cyst/Fluid Segmentation
2.3.1. Classical Machine Learning Methods
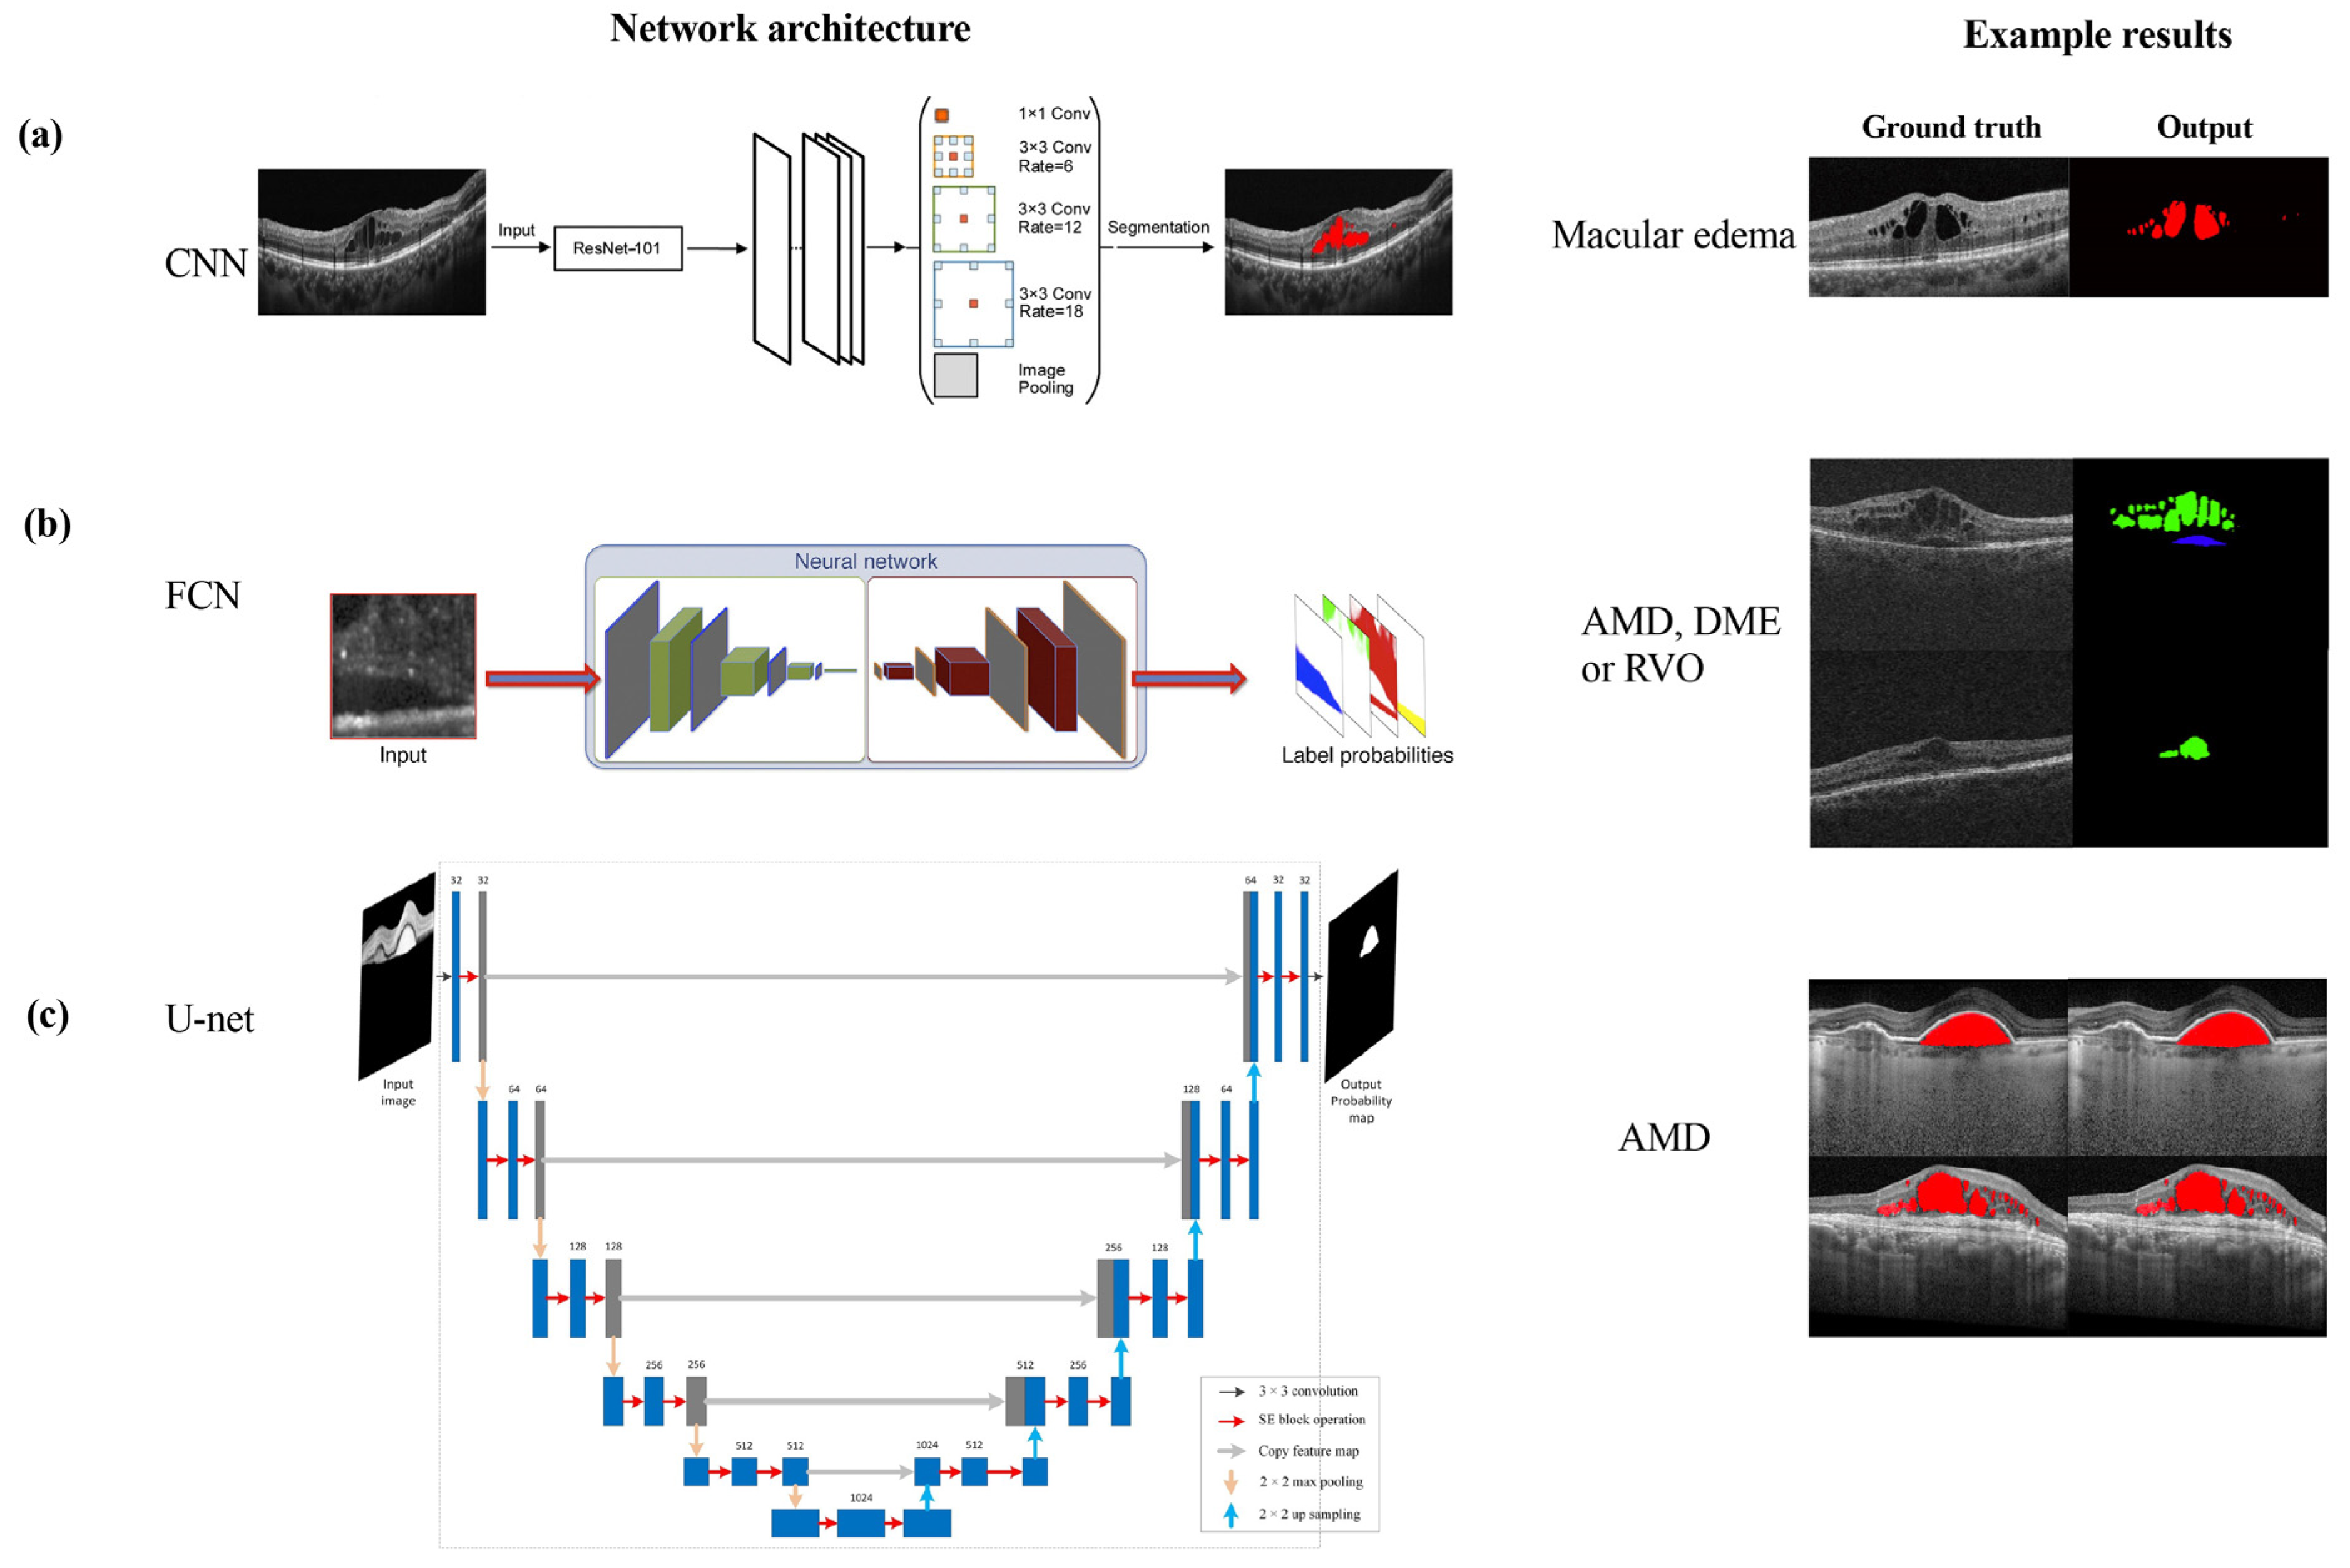
2.3.2. Deep-Learning-Based Segmentation Methods

| Architectures | CNN | FCN | U-Net |
|---|---|---|---|
| Fine-tuned structure | Chen et al. [62], Wang et al. [63] | Schlegl et al. [64], Sappa et al. [65] | Roy et al. [66], Kang et al. [67] |
| Modified loss function | NA | Liu et al. [68], Pawan et al. [69] | Tennakoon et al. [70], Liu et al. [71] |
| Adding modules/structure | NA | NA | Chen et al. [72], Ma et al. [73] |
| Paper | Algorithm | Data Set | Disease | Performance |
|---|---|---|---|---|
| Chen et al. [62] | Faster R-CNN | RETOUCH dataset | AMD, RVO | DC: 0.997 ACC: 0.665 |
| Wang et al. [63] | OCT-DeepLab | 8676 volumes OCT | Macular edema | AUC:0.963 |
| Schlegl et al. [64] | FCN | 1200 volumes OCT | AMD, DME, RVO | AUC: 0.94 |
| Sappa et al. [65] | RetFluidNet | 124 volumes OCT | AMD | DC: 0.885 |
| Roy et al. [66] | ReLayNet | Duke DME dataset | DME | DC: 0.77 |
| Kang et al. [67] | U-Net | RETOUCH dataset | AMD, RVO | ACC: 0.968, DC: 0.9 |
| Liu et al. [68] | FCN | RETOUCH dataset | AMD, RVO | DC: 0.744 |
| Pawan et al. [69] | DRIP-Caps | 25 volumes OCT | CSCR | DC: 0.927 |
| Tennakoon et al. [70] | U-Net | RETOUCH dataset | AMD, RVO | DC: 0.737 |
| Liu et al. [71] | SGNet | Duke DME dataset | DME | DC: 0.8 |
| Chen et al. [72] | SEUNet | UMN dataset | IRF, SRF, PED | DC: 0.9421 |
| Ma et al. [73] | LF-UNet | 58 volumes OCT | DME | DC: 0.5132 |

CNN and FCN Backbone
U-Net Backbone
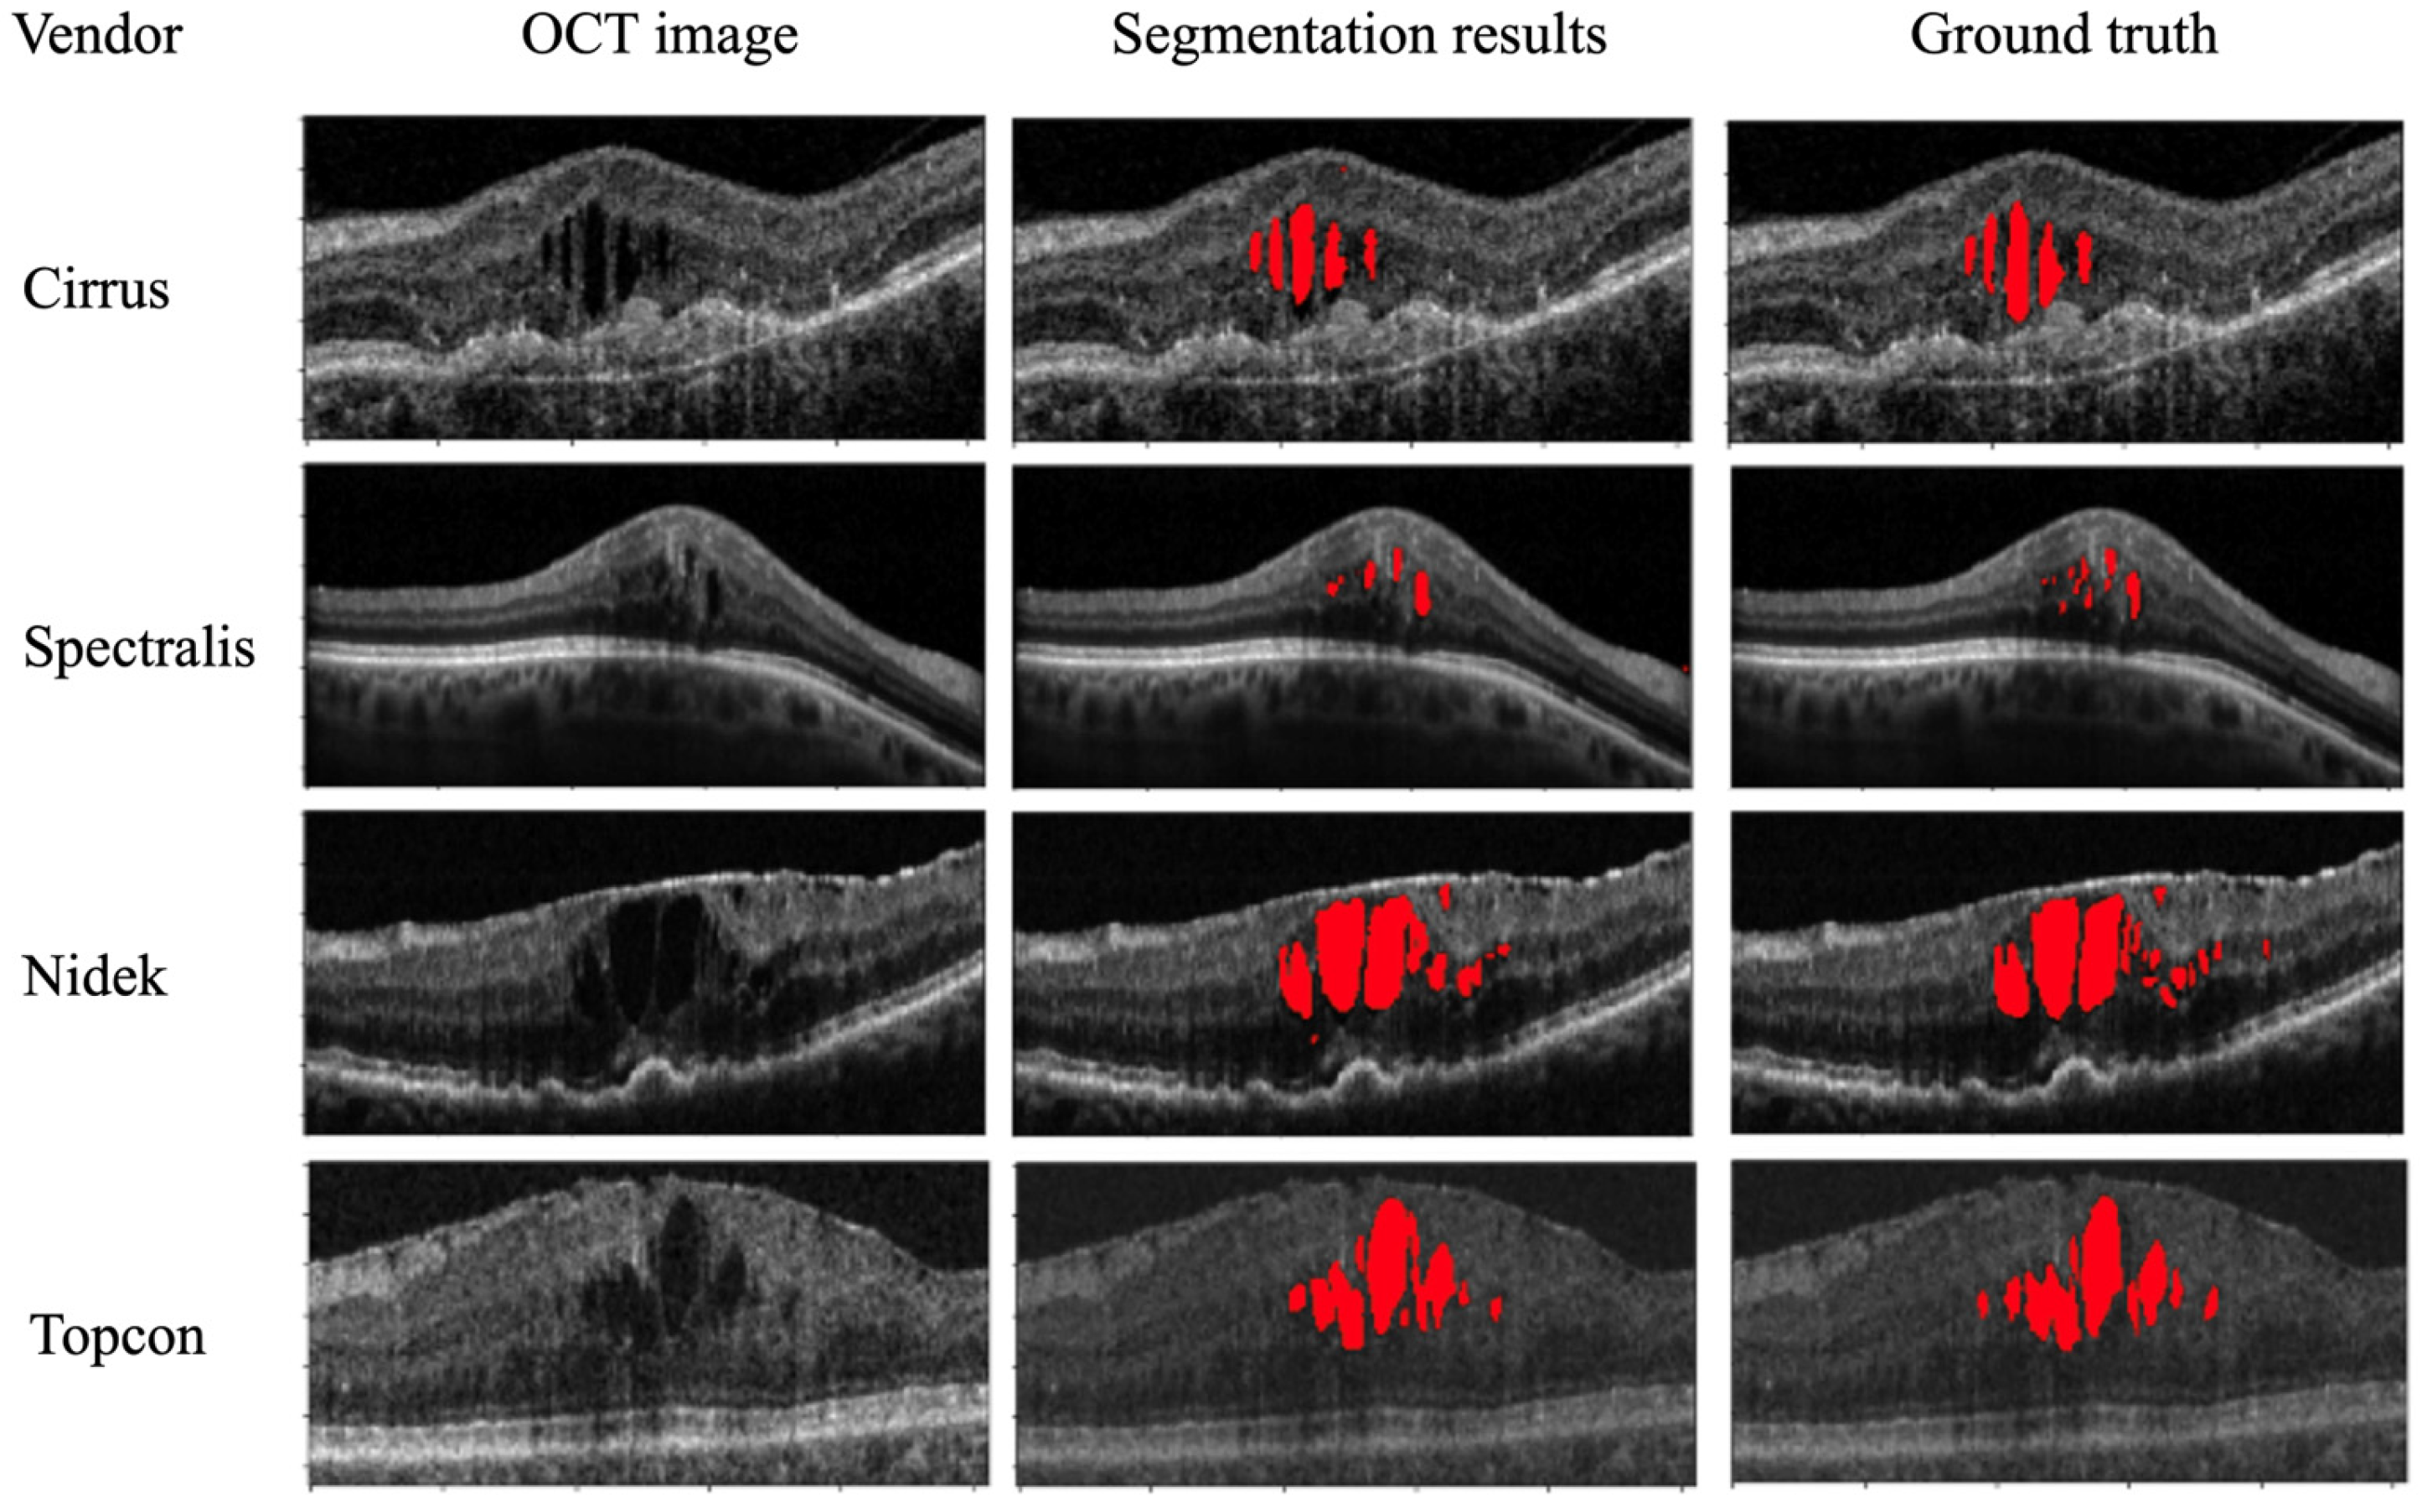
3. OCT Datasets for Cyst/Fluid Segmentation
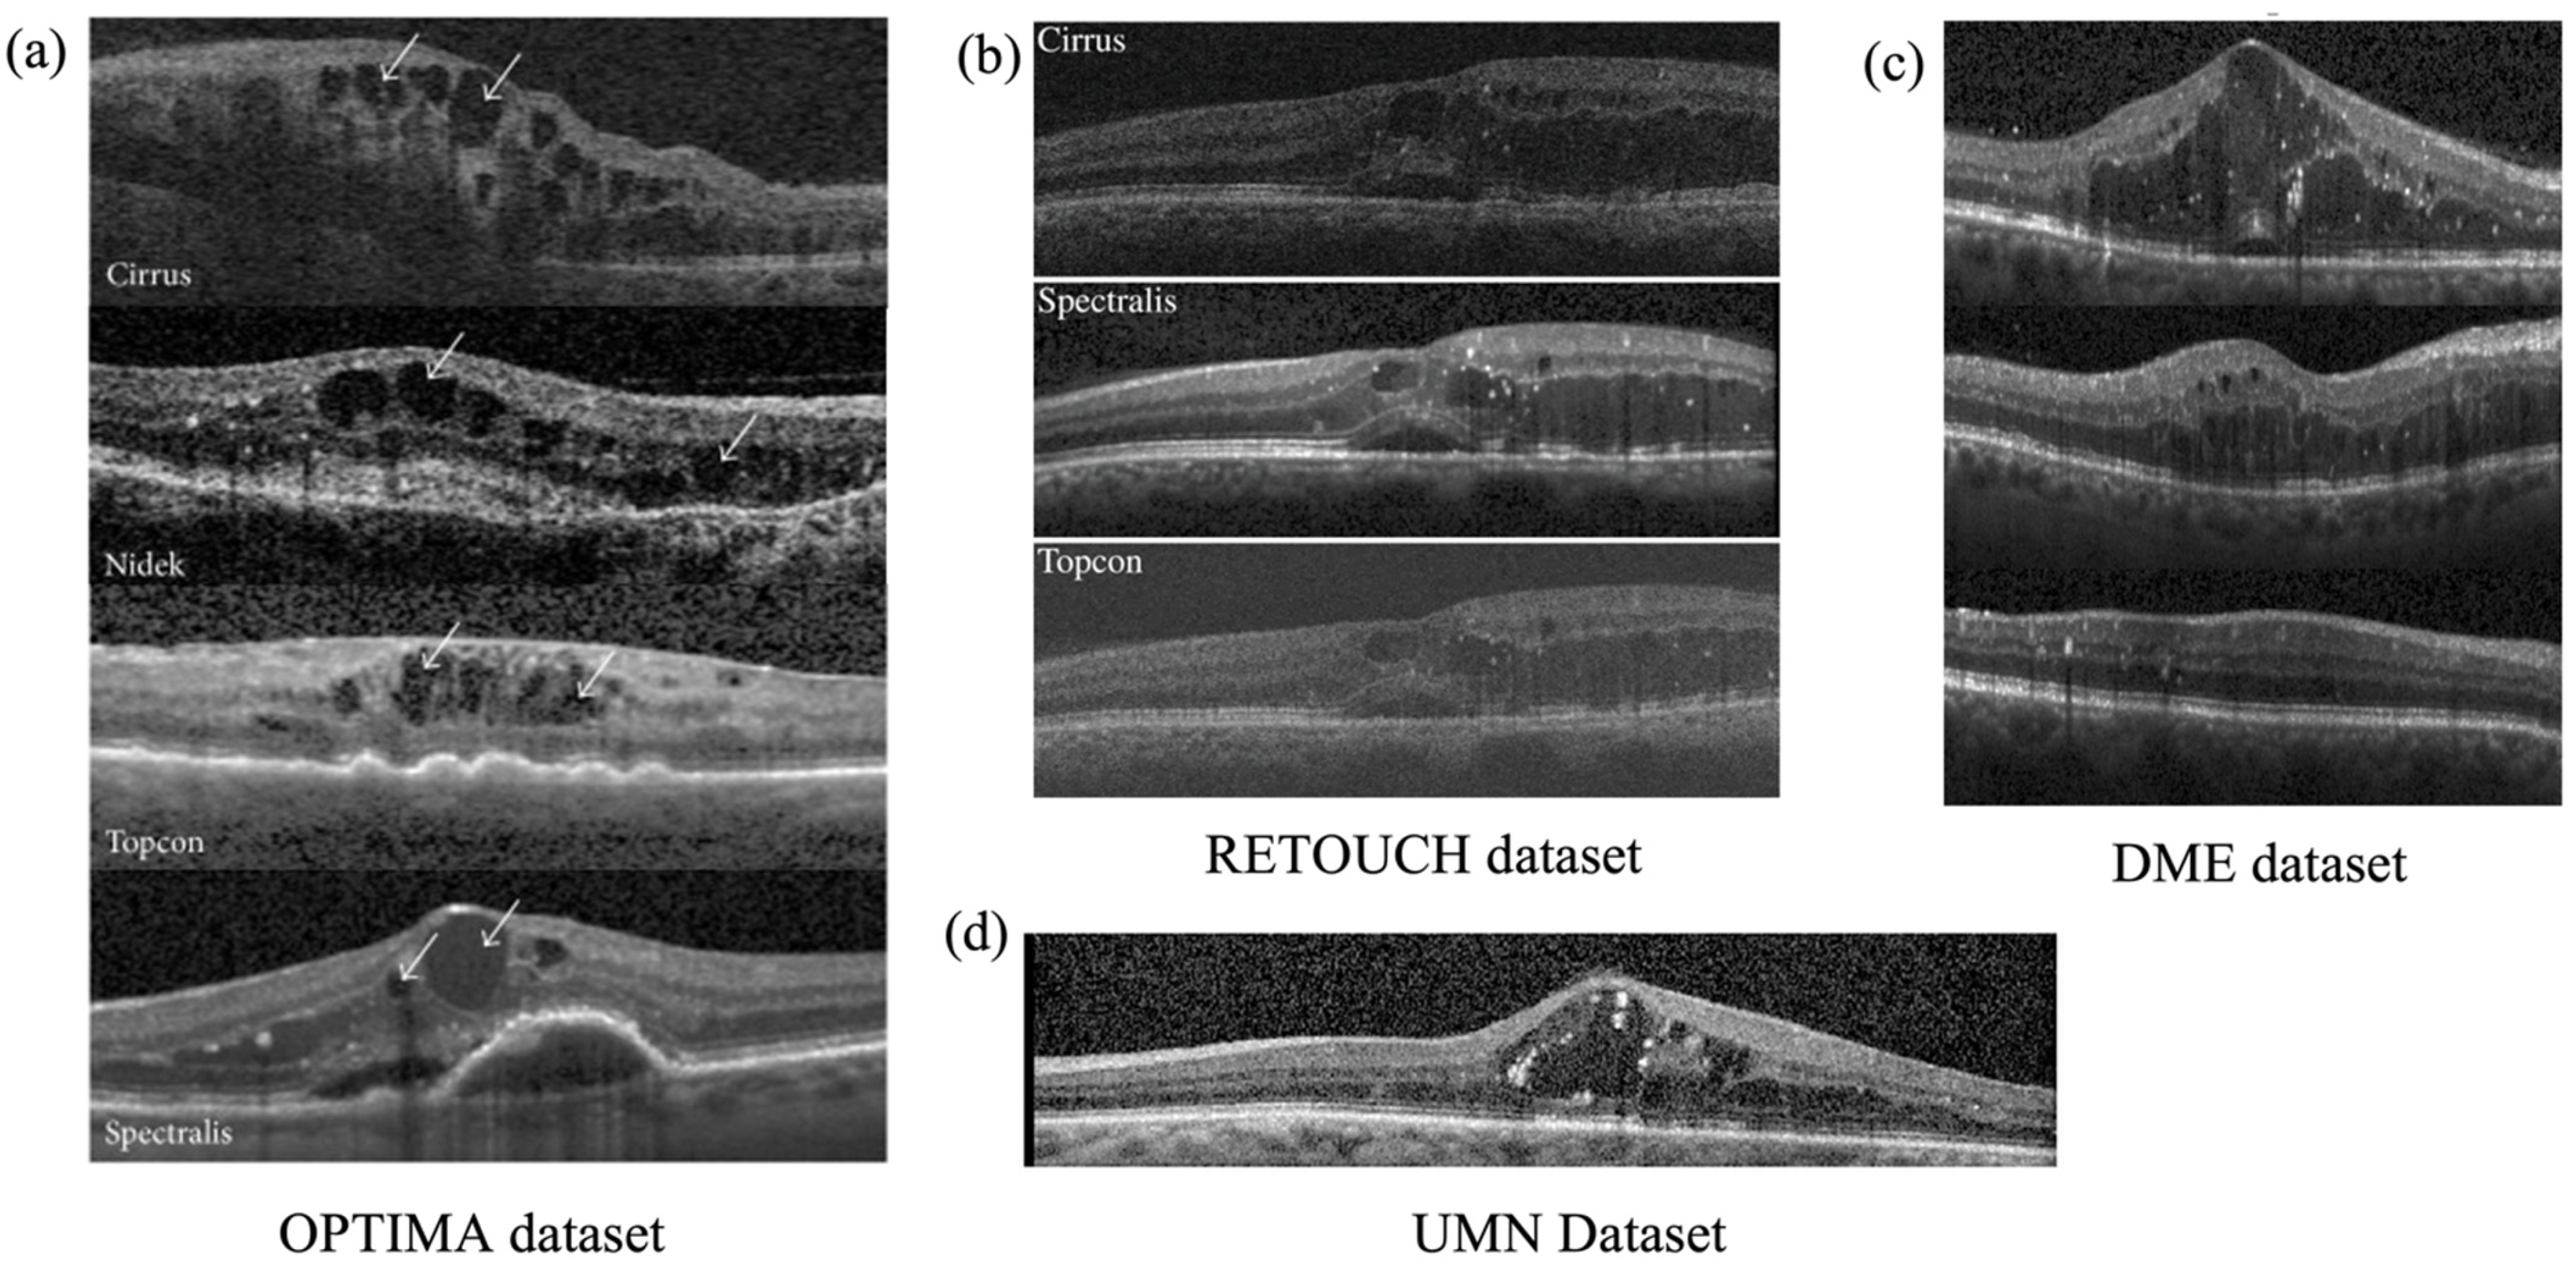
3.1. The OPTIMA Dataset
3.2. The RETOUCH Dataset
3.3. DME Dataset from Duke
3.4. UMN Dataset
4. Discussion
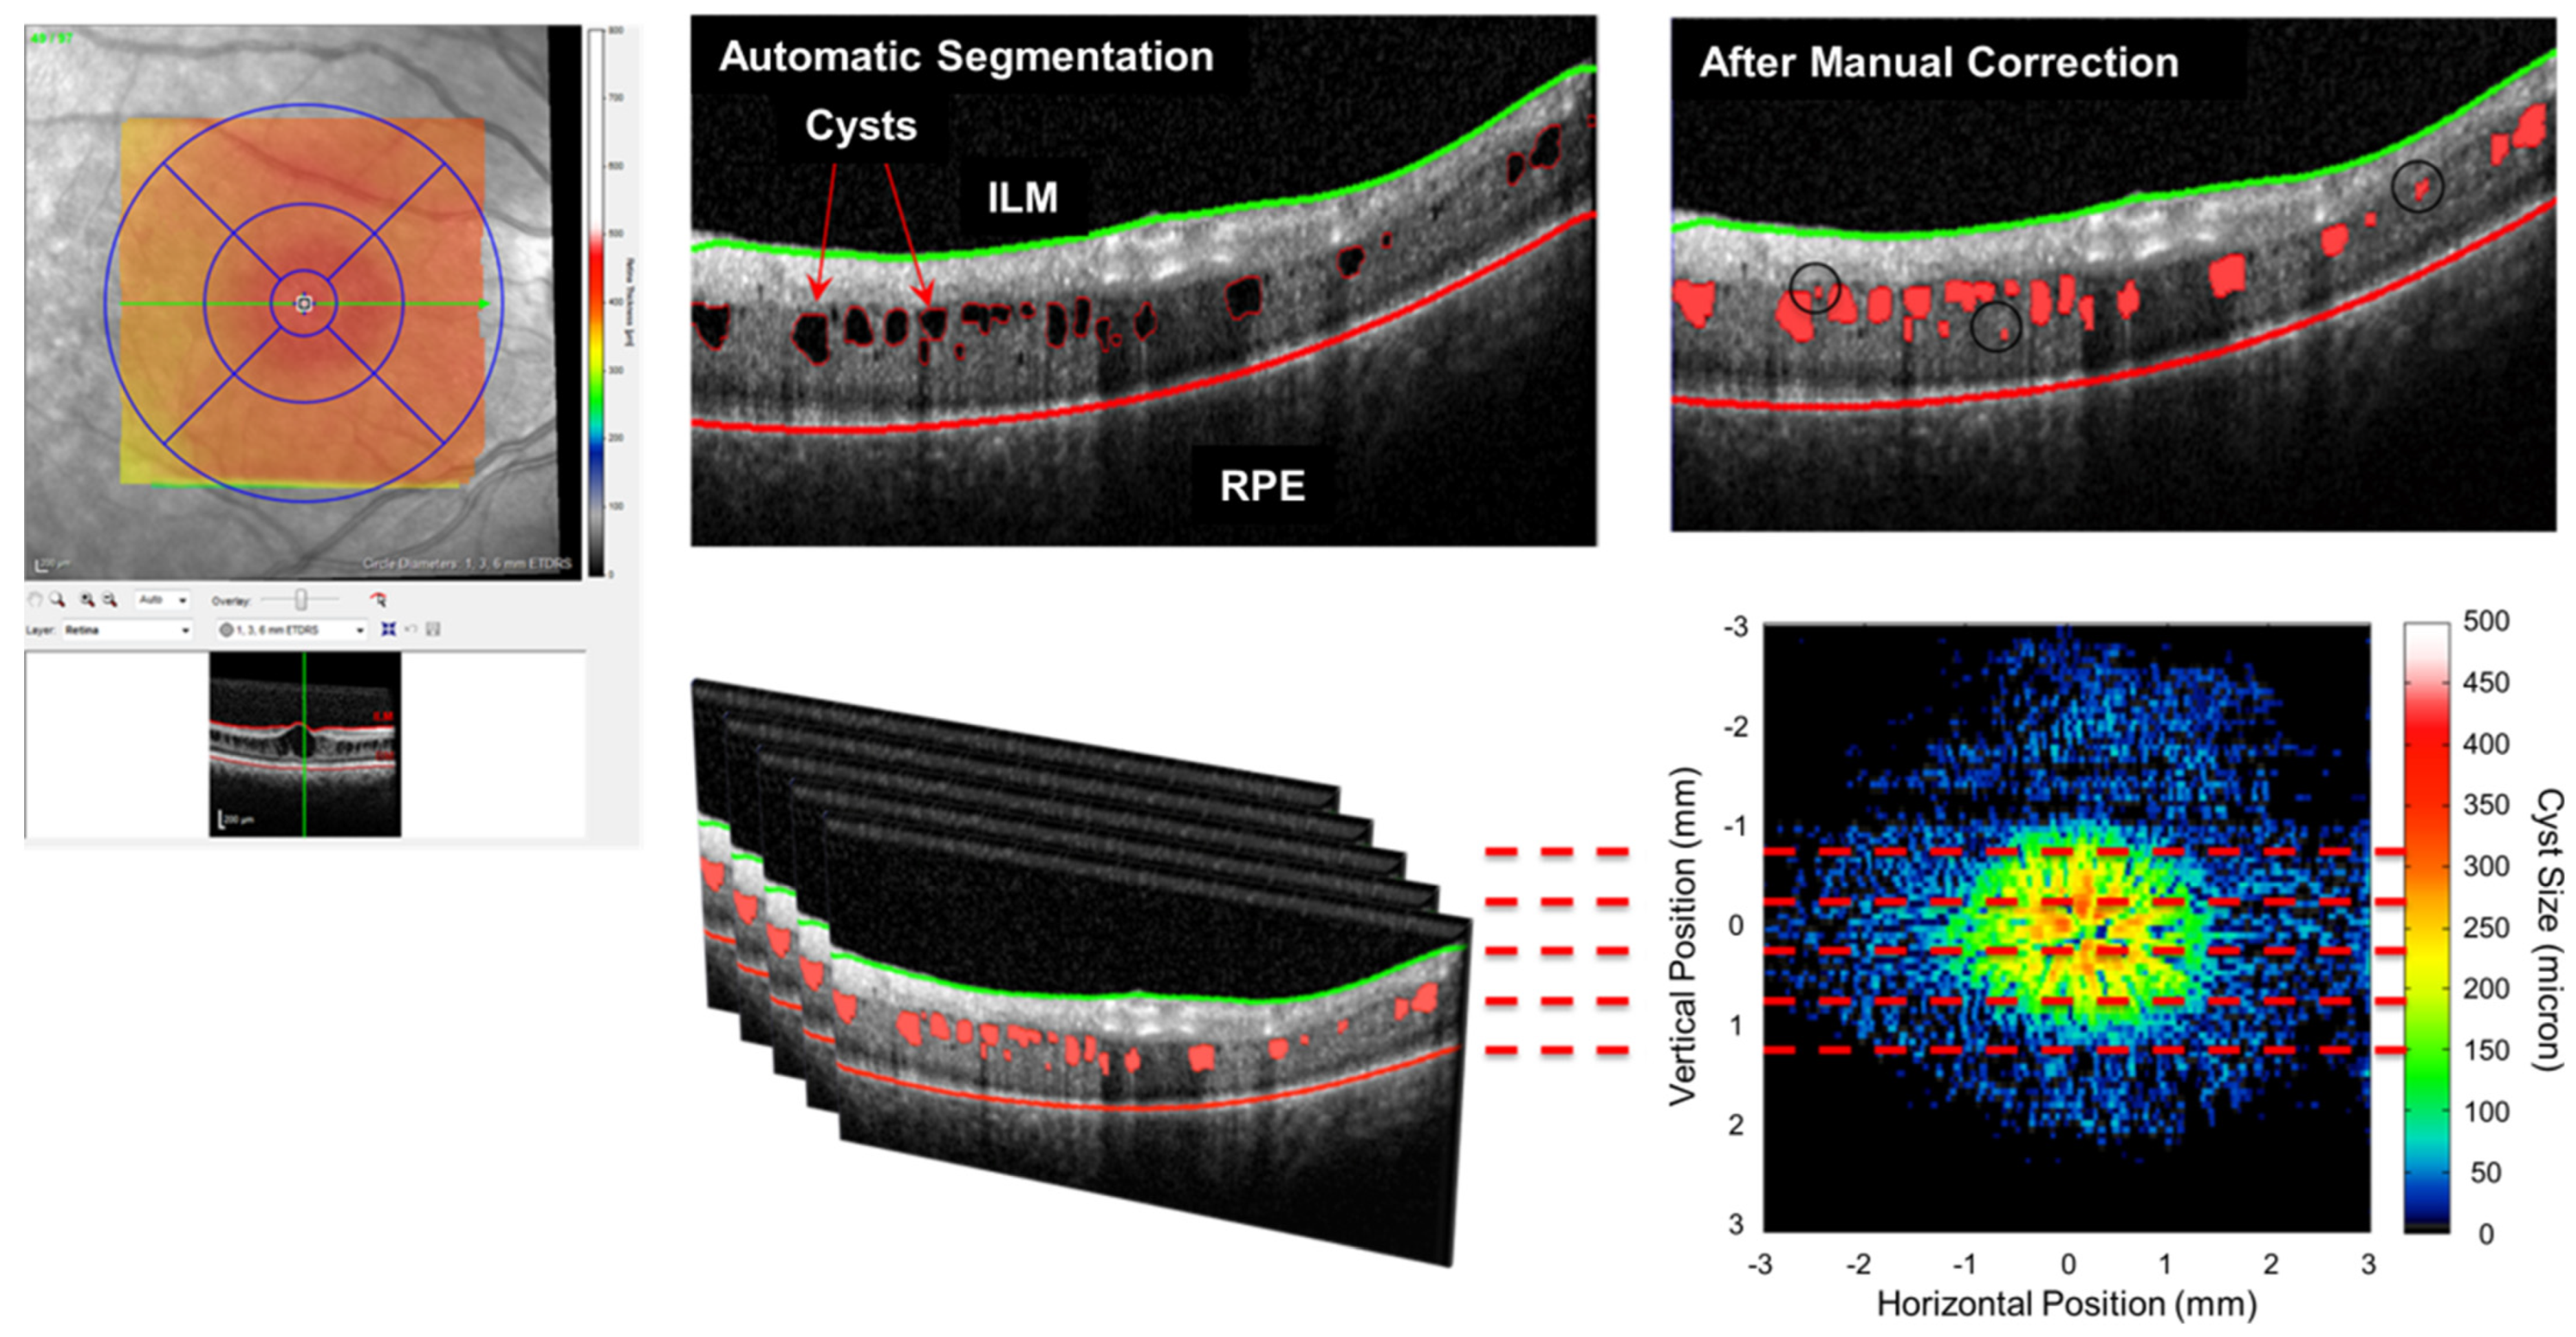
4.1. OCT Application and Cyst Segemation in Ophthalmology
4.2. The Connection between Image Denoising, Layer Segmentation, and Cyst Segmentation
4.3. Performance of Classical Machine Learning and Deep Learning
4.4. Challenges, Opportunities, and Future Direction
5. Conclusions
Author Contributions
Funding
Institutional Review Board Statement
Informed Consent Statement
Data Availability Statement
Conflicts of Interest
Abbreviations
| ACC | Accuracy rate |
| AI | Artificial intelligence |
| AMD | Age-related macular degeneration |
| ASPP | Atrous spatial pyramid pooling |
| AUC | Area under the curve |
| CL | Connecting cilia |
| CME | Cystoid macular edema |
| CNN | Convolutional neural network |
| DC | Dice coefficient |
| DR | Diabetic retinopathy |
| FC-CRF | Fully connected conditional random field |
| FCN | Fully Convolutional Network |
| FOM | Figure of merit |
| FPVF | False positive volume fraction |
| GCL | Ganglion cell layer |
| GCN | Graph convolutional network |
| GS-GC | Graph search-graph cut |
| INL | Inner nuclear layer |
| IPL | Inner plexiform layer |
| IRF | Intra-retinal fluid |
| ISL | Inner segment layer |
| k-NN | K-nearest neighbor |
| LDF | Learnable de-speckling framework |
| MH | Macular hole |
| MICCAI | Medical Image Computing and Computer-Assisted Intervention |
| MS | Multiple sclerosis |
| MSBTD | Multiscale sparsity-based tomographic denoising |
| NFL | Merve fiber layer |
| OCT | Optical coherence tomography |
| OLM | Outer limiting membrane |
| ONL | Outer nuclear layer |
| OPL | Outer plexiform layer |
| OSL | Outer segment layer |
| PED | Pigment epithelium detachment |
| RNN | Recurrent Neural Network |
| RPE | Retinal pigment epithelium |
| RVD | Relative volume difference ratio |
| RVO | Retinal vein occlusion |
| SAWF | Spatially adaptive wavelet filter |
| SNR | Signal-to-noise ratios |
| SRF | Sub-retinal fluid |
| SVM | Support vector machine |
| TPVF | True positive volume fraction |
| VM | Verhoeff’s membrane |
| XLRS | X-linked retinoschisis |
References
- Aumann, S.; Donner, S.; Fischer, J.; Müller, F. Optical Coherence Tomography (OCT): Principle and Technical Realization. In High Resolution Imaging in Microscopy and Ophthalmology: New Frontiers in Biomedical Optics; Bille, J.F., Ed.; Springer: Cham, Switzerland, 2019; pp. 59–85. [Google Scholar]
- Bille, J.F. High Resolution Imaging in Microscopy and Ophthalmology: New Frontiers in Biomedical Optics; Springer: Cham, Switzerland, 2019. [Google Scholar]
- Rotsos, T.G.; Moschos, M.M. Cystoid macular edema. Clin. Ophthalmol. 2008, 2, 919–930. [Google Scholar] [CrossRef] [PubMed] [Green Version]
- Kempen, J.H.; O’Colmain, B.J.; Leske, M.C.; Haffner, S.M.; Klein, R.; Moss, S.E.; Taylor, H.R.; Hamman, R.F. The prevalence of diabetic retinopathy among adults in the United States. Arch. Ophthalmol. 2004, 122, 552–563. [Google Scholar]
- Chalam, K.V.; Sambhav, K. Optical Coherence Tomography Angiography in Retinal Diseases. J. Ophthalmic. Vis. Res. 2016, 11, 84–92. [Google Scholar] [CrossRef]
- Sun, Z.; Yang, D.; Tang, Z.; Ng, D.S.; Cheung, C.Y. Optical coherence tomography angiography in diabetic retinopathy: An updated review. Eye 2021, 35, 149–161. [Google Scholar] [CrossRef] [PubMed]
- Wilkins, G.R.; Houghton, O.M.; Oldenburg, A.L. Automated segmentation of intraretinal cystoid fluid in optical coherence tomography. IEEE Trans. Biomed. Eng. 2012, 59, 1109–1114. [Google Scholar] [CrossRef] [PubMed] [Green Version]
- Pelosini, L.; Hull, C.C.; Boyce, J.F.; McHugh, D.; Stanford, M.R.; Marshall, J. Optical coherence tomography may be used to predict visual acuity in patients with macular edema. Invest. Ophthalmol. Vis. Sci. 2011, 52, 2741–2748. [Google Scholar] [CrossRef] [Green Version]
- Pappu, G.P.; Tankala, S.; Talabhaktula, K.; Biswal, B. EANet: Multiscale autoencoder based edge attention network for fluid segmentation from SD-OCT images. Int. J. Imaging Syst. Technol. 2022. [Google Scholar] [CrossRef]
- Esteva, A.; Robicquet, A.; Ramsundar, B.; Kuleshov, V.; DePristo, M.; Chou, K.; Cui, C.; Corrado, G.; Thrun, S.; Dean, J. A guide to deep learning in healthcare. Nat. Med. 2019, 25, 24–29. [Google Scholar] [CrossRef] [PubMed]
- Vaswani, A.; Shazeer, N.; Parmar, N.; Uszkoreit, J.; Jones, L.; Gomez, A.N.; Kaiser, Ł.; Polosukhin, I. Attention is All You Need. Advances in Neural Information Processing Systems 30. 2017. Available online: https://papers.nips.cc/paper/2017/hash/3f5ee243547dee91fbd053c1c4a845aa-Abstract.html (accessed on 1 February 2023).
- Krizhevsky, A.; Sutskever, I.; Hinton, G.E. Imagenet classification with deep convolutional neural networks. Commun. ACM 2017, 60, 84–90. [Google Scholar] [CrossRef] [Green Version]
- He, K.; Zhang, X.; Ren, S.; Sun, J. Deep residual learning for image recognition. In Proceedings of the IEEE Conference on Computer Vision and Pattern Recognition, Las Vegas, NV, USA, 27–30 June 2016; pp. 770–778. [Google Scholar]
- Mookiah, M.R.K.; Acharya, U.R.; Chua, C.K.; Lim, C.M.; Ng, E.; Laude, A. Computer-aided diagnosis of diabetic retinopathy: A review. Comput. Biol. Med. 2013, 43, 2136–2155. [Google Scholar] [CrossRef]
- Adler, D.C.; Ko, T.H.; Fujimoto, J.G. Speckle reduction in optical coherence tomography images by use of a spatially adaptive wavelet filter. Opt. Lett. 2004, 29, 2878–2880. [Google Scholar] [CrossRef] [PubMed]
- Wong, A.; Mishra, A.; Bizheva, K.; Clausi, D.A. General Bayesian estimation for speckle noise reduction in optical coherence tomography retinal imagery. Opt. Express 2010, 18, 8338–8352. [Google Scholar] [CrossRef] [PubMed]
- Fernández, D.C.; Salinas, H.M.; Puliafito, C.A. Automated detection of retinal layer structures on optical coherence tomography images. Opt. Express 2005, 13, 10200–10216. [Google Scholar] [CrossRef]
- Garvin, M.K.; Abràmoff, M.D.; Kardon, R.; Russell, S.R.; Wu, X.; Sonka, M. Intraretinal layer segmentation of macular optical coherence tomography images using optimal 3-D graph search. IEEE Trans. Med. Imaging 2008, 27, 1495–1505. [Google Scholar] [CrossRef] [Green Version]
- Puvanathasan, P.; Bizheva, K. Interval type-II fuzzy anisotropic diffusion algorithm for speckle noise reduction in optical coherence tomography images. Opt. Express 2009, 17, 733–746. [Google Scholar] [CrossRef] [PubMed]
- Aja, S.; Alberola, C.; Ruiz, A. Fuzzy anisotropic diffusion for speckle filtering. In Proceedings of the 2001 IEEE International Conference on Acoustics, Speech, and Signal Processing, Salt Lake City, UT, USA, 7–11 May 2001; pp. 1261–1264. [Google Scholar]
- Yu, Y.; Acton, S.T. Speckle reducing anisotropic diffusion. IEEE Trans. Image Process. 2002, 11, 1260–1270. [Google Scholar]
- Paris, S.; Durand, F. A fast approximation of the bilateral filter using a signal processing approach. In Proceedings of the European Conference on Computer Vision, Amsterdam, The Netherlands, 11–14 October 2006; pp. 568–580. [Google Scholar]
- Adabi, S.; Rashedi, E.; Clayton, A.; Mohebbi-Kalkhoran, H.; Chen, X.-W.; Conforto, S.; Nasiriavanaki, M. Learnable despeckling framework for optical coherence tomography images. J. Biomed. Opt. 2018, 23, 16013. [Google Scholar] [CrossRef] [Green Version]
- Pircher, M.; Gotzinger, E.; Leitgeb, R.; Fercher, A.F.; Hitzenberger, C.K. Speckle reduction in optical coherence tomography by frequency compounding. J. Biomed. Opt. 2003, 8, 565–569. [Google Scholar] [CrossRef]
- Rogowska, J.; Brezinski, M.E. Image processing techniques for noise removal, enhancement and segmentation of cartilage OCT images. Phys. Med. Biol. 2002, 47, 641–655. [Google Scholar] [CrossRef]
- Fang, L.; Li, S.; Nie, Q.; Izatt, J.A.; Toth, C.A.; Farsiu, S. Sparsity based denoising of spectral domain optical coherence tomography images. Biomed. Opt. Express 2012, 3, 927–942. [Google Scholar] [CrossRef] [PubMed] [Green Version]
- Quellec, G.; Lee, K.; Dolejsi, M.; Garvin, M.K.; Abràmoff, M.D.; Sonka, M. Three-dimensional analysis of retinal layer texture: Identification of fluid-filled regions in SD-OCT of the macula. IEEE Trans Med. Imaging 2010, 29, 1321–1330. [Google Scholar] [CrossRef] [Green Version]
- Hee, M.R.; Izatt, J.A.; Swanson, E.A.; Huang, D.; Schuman, J.S.; Lin, C.P.; Puliafito, C.A.; Fujimoto, J.G. Optical coherence tomography of the human retina. Arch Ophthalmol. 1995, 113, 325–332. [Google Scholar] [CrossRef]
- Herzog, A.; Boyer, K.L.; Roberts, C. Robust extraction of the optic nerve head in optical coherence tomography. In Proceedings of the Computer Vision and Mathematical Methods in Medical and Biomedical Image Analysis: ECCV 2004 Workshops CVAMIA and MMBIA, Prague, Czech Republic, 15 May 2004; Revised Selected Papers. pp. 395–407. [Google Scholar]
- Zongqing, L.; Qingmin, L.; Fan, Y. A variational approach to automatic segmentation of RNFL on OCT data sets of the retina. In Proceedings of the 2009 16th IEEE International Conference on Image Processing (ICIP), Cairo, Egypt, 7–10 November 2009; pp. 3345–3348. [Google Scholar]
- Wang, C.; Wang, Y.; Kaba, D.; Zhu, H.; Lv, Y.; Wang, Z.; Liu, X.; Li, Y. Segmentation of intra-retinal layers in 3d optic nerve head images. In Image and Graphics; Springer: Berlin/Heidelberg, Germany, 2015; pp. 321–332. [Google Scholar]
- Garvin, M.K.; Abramoff, M.D.; Wu, X.; Russell, S.R.; Burns, T.L.; Sonka, M. Automated 3-D intraretinal layer segmentation of macular spectral-domain optical coherence tomography images. IEEE Trans. Med. Imaging 2009, 28, 1436–1447. [Google Scholar] [CrossRef] [PubMed] [Green Version]
- Chiu, S.J.; Li, X.T.; Nicholas, P.; Toth, C.A.; Izatt, J.A.; Farsiu, S. Automatic segmentation of seven retinal layers in SDOCT images congruent with expert manual segmentation. Opt. Express 2010, 18, 19413–19428. [Google Scholar] [CrossRef] [PubMed] [Green Version]
- Gao, Z.; Bu, W.; Zheng, Y.; Wu, X. Automated layer segmentation of macular OCT images via graph-based SLIC superpixels and manifold ranking approach. Comput. Med. Imaging Graph. 2017, 55, 42–53. [Google Scholar] [CrossRef] [PubMed] [Green Version]
- Karri, S.P.K.; Chakraborthi, D.; Chatterjee, J. Learning layer-specific edges for segmenting retinal layers with large deformations. Biomed. Opt. Express 2016, 7, 2888–2901. [Google Scholar] [CrossRef] [PubMed] [Green Version]
- Fang, L.; Cunefare, D.; Wang, C.; Guymer, R.H.; Li, S.; Farsiu, S. Automatic segmentation of nine retinal layer boundaries in OCT images of non-exudative AMD patients using deep learning and graph search. Biomed. Opt. Express 2017, 8, 2732–2744. [Google Scholar] [CrossRef] [Green Version]
- Kugelman, J.; Alonso-Caneiro, D.; Read, S.A.; Vincent, S.J.; Collins, M.J. Automatic segmentation of OCT retinal boundaries using recurrent neural networks and graph search. Biomed. Opt. Express 2018, 9, 5759–5777. [Google Scholar] [CrossRef] [Green Version]
- He, Y.; Carass, A.; Liu, Y.; Jedynak, B.M.; Solomon, S.D.; Saidha, S.; Calabresi, P.A.; Prince, J.L. Fully convolutional boundary regression for retina OCT segmentation. In Proceedings of the International Conference on Medical Image Computing and Computer-Assisted Intervention, Shenzhen, China, 13–17 October 2019; pp. 120–128. [Google Scholar]
- Li, J.; Jin, P.; Zhu, J.; Zou, H.; Xu, X.; Tang, M.; Zhou, M.; Gan, Y.; He, J.; Ling, Y. Multi-scale GCN-assisted two-stage network for joint segmentation of retinal layers and discs in peripapillary OCT images. Biomed. Opt. Express 2021, 12, 2204–2220. [Google Scholar] [CrossRef]
- Cover, T.; Hart, P. Nearest neighbor pattern classification. IEEE Trans. Inf. Theory 1967, 13, 21–27. [Google Scholar] [CrossRef] [Green Version]
- Cortes, C.; Vapnik, V. Support-vector networks. Mach. Learn. 1995, 20, 273–297. [Google Scholar] [CrossRef]
- Breiman, L. Random forests. Mach. Learn. 2001, 45, 5–32. [Google Scholar] [CrossRef] [Green Version]
- Schölkopf, B.; Smola, A.J.; Bach, F. Learning with Kernels: Support Vector Machines, Regularization, Optimization, and Beyond; MIT Press: Cambridge, MA, USA, 2002. [Google Scholar]
- Boykov, Y.; Kolmogorov, V. An experimental comparison of min-cut/max-flow algorithms for energy minimization in vision. IEEE Trans. Pattern Anal. Mach. Intell. 2004, 26, 1124–1137. [Google Scholar] [CrossRef] [Green Version]
- Freund, Y.; Schapire, R.E. A decision-theoretic generalization of on-line learning and an application to boosting. J. Comput. Syst. Sci. 1997, 55, 119–139. [Google Scholar] [CrossRef] [Green Version]
- Ganjee, R.; Ebrahimi Moghaddam, M.; Nourinia, R. An unsupervised hierarchical approach for automatic intra-retinal cyst segmentation in spectral-domain optical coherence tomography images. Med. Phys. 2020, 47, 4872–4884. [Google Scholar] [CrossRef]
- Chitchian, S.; Fiddy, M.A.; Fried, N.M. Denoising during optical coherence tomography of the prostate nerves via wavelet shrinkage using dual-tree complex wavelet transform. J. Biomed. Opt. 2009, 14, 014031. [Google Scholar] [CrossRef]
- González, A.; Remeseiro, B.; Ortega, M.; Penedo, M.G.; Charlón, P. Automatic cyst detection in OCT retinal images combining region flooding and texture analysis. In Proceedings of the 26th IEEE International Symposium on Computer-Based Medical Systems, Porto, Portugal, 20–22 June 2013; pp. 397–400. [Google Scholar]
- Gopinath, K.; Sivaswamy, J. Domain knowledge assisted cyst segmentation in OCT retinal images. arXiv 2016, arXiv:1612.02675. [Google Scholar]
- Boyd, S.; Boyd, S.P.; Vandenberghe, L. Convex Optimization; Cambridge University Press: Cambridge, UK, 2004. [Google Scholar]
- Itti, L.; Koch, C.; Niebur, E. A model of saliency-based visual attention for rapid scene analysis. IEEE Trans. Pattern Anal. Mach. Intell. 1998, 20, 1254–1259. [Google Scholar] [CrossRef] [Green Version]
- Chiu, S.J.; Allingham, M.J.; Mettu, P.S.; Cousins, S.W.; Izatt, J.A.; Farsiu, S. Kernel regression based segmentation of optical coherence tomography images with diabetic macular edema. Biomed. Opt. Express 2015, 6, 1172–1194. [Google Scholar] [CrossRef] [PubMed] [Green Version]
- Huang, Y.; Danis, R.P.; Pak, J.W.; Luo, S.; White, J.; Zhang, X.; Narkar, A.; Domalpally, A. Development of a semi-automatic segmentation method for retinal OCT images tested in patients with diabetic macular edema. PLoS ONE 2013, 8, e82922. [Google Scholar] [CrossRef] [PubMed]
- Lee, J.Y.; Chiu, S.J.; Srinivasan, P.P.; Izatt, J.A.; Toth, C.A.; Farsiu, S.; Jaffe, G.J. Fully automatic software for retinal thickness in eyes with diabetic macular edema from images acquired by cirrus and spectralis systems. Investig. Ophthalmol. Vis. Sci. 2013, 54, 7595–7602. [Google Scholar] [CrossRef] [Green Version]
- Chen, X.; Niemeijer, M.; Zhang, L.; Lee, K.; Abràmoff, M.D.; Sonka, M. Three-dimensional segmentation of fluid-associated abnormalities in retinal OCT: Probability constrained graph-search-graph-cut. IEEE Trans. Med. Imaging 2012, 31, 1521–1531. [Google Scholar] [CrossRef] [PubMed] [Green Version]
- Zhu, W.; Zhang, L.; Shi, F.; Xiang, D.; Wang, L.; Guo, J.; Yang, X.; Chen, H.; Chen, X. Automated framework for intraretinal cystoid macular edema segmentation in three-dimensional optical coherence tomography images with macular hole. J. Biomed. Opt. 2017, 22, 076014. [Google Scholar] [CrossRef] [PubMed]
- Lee, K.M. Segmentations of the Intraretinal Surfaces, Optic Disc and Retinal Blood Vessels in 3D-OCT Scans; The University of Iowa: Iowa City, IA, USA, 2009. [Google Scholar]
- Haeker, M.; Sonka, M.; Kardon, R.; Shah, V.A.; Wu, X.; Abràmoff, M.D. Automated segmentation of intraretinal layers from macular optical coherence tomography images. In Medical Imaging 2007: Image Processing; SPIE: Bellingham, DC, USA, 2007; pp. 385–395. [Google Scholar]
- Vincent, L.; Soille, P. Watersheds in digital spaces: An efficient algorithm based on immersion simulations. IEEE Trans. Pattern Anal. Mach. Intell. 1991, 13, 583–598. [Google Scholar] [CrossRef] [Green Version]
- Medathati, N.K.; Sivaswamy, J. Local descriptor based on texture of projections. In Proceedings of the Seventh Indian Conference on Computer Vision, Graphics and Image Processing, Chennai, India, 12–15 December 2010; pp. 398–404. [Google Scholar]
- Niemeijer, M.; Garvin, M.K.; van Ginneken, B.; Sonka, M.; Abramoff, M.D. Vessel segmentation in 3D spectral OCT scans of the retina. In Medical Imaging 2008: Image Processing; SPIE: Bellingham, DC, USA, 2008; pp. 597–604. [Google Scholar]
- Chen, Q.; Ji, Z.; Wang, T.; Tand, Y.; Yu, C.; Paul, O.I.; Sappa, L.B. Automatic segmentation of fluid-associated abnormalities and pigment epithelial detachment in retinal SD-OCT images. In Proceedings of the MICCAI Retinal OCT Fluid Challenge (RETOUCH), Quebec City, QC, Canada, 14 September 2017; pp. 15–21. [Google Scholar]
- Wang, Z.; Zhong, Y.; Yao, M.; Ma, Y.; Zhang, W.; Li, C.; Tao, Z.; Jiang, Q.; Yan, B. Automated segmentation of macular edema for the diagnosis of ocular disease using deep learning method. Sci. Rep. 2021, 11, 13392. [Google Scholar] [CrossRef] [PubMed]
- Schlegl, T.; Waldstein, S.M.; Bogunovic, H.; Endstraßer, F.; Sadeghipour, A.; Philip, A.-M.; Podkowinski, D.; Gerendas, B.S.; Langs, G.; Schmidt-Erfurth, U. Fully automated detection and quantification of macular fluid in OCT using deep learning. Ophthalmology 2018, 125, 549–558. [Google Scholar] [CrossRef] [Green Version]
- Sappa, L.B.; Okuwobi, I.P.; Li, M.; Zhang, Y.; Xie, S.; Yuan, S.; Chen, Q. RetFluidNet: Retinal fluid segmentation for SD-OCT images using convolutional neural network. J. Digit. Imaging 2021, 34, 691–704. [Google Scholar] [CrossRef] [PubMed]
- Roy, A.G.; Conjeti, S.; Karri, S.P.K.; Sheet, D.; Katouzian, A.; Wachinger, C.; Navab, N. ReLayNet: Retinal layer and fluid segmentation of macular optical coherence tomography using fully convolutional networks. Biomed. Opt. Express 2017, 8, 3627–3642. [Google Scholar] [CrossRef] [Green Version]
- Kang, S.H.; Park, H.S.; Jang, J.; Jeon, K. Deep Neural Networks for the Detection and Segmentation of the Retinal Fluid in OCT Images. 2017. Available online: https://rumc-gcorg-p-public.s3.amazonaws.com/f/challenge/111/ec9f017b-9bb4-46fd-8189-4eeb1028efd6/RETOUCH-MABIC.pdf (accessed on 1 February 2023).
- Liu, X.; Wang, S. Uncertainty-aware semi-supervised framework for automatic segmentation of macular edema in OCT images. In Proceedings of the 2021 IEEE 18th International Symposium on Biomedical Imaging (ISBI), Nice, France, 13–16 April 2021; pp. 1453–1456. [Google Scholar]
- Pawan, S.; Sankar, R.; Jain, A.; Jain, M.; Darshan, D.; Anoop, B.; Kothari, A.R.; Venkatesan, M.; Rajan, J. Capsule Network–based architectures for the segmentation of sub-retinal serous fluid in optical coherence tomography images of central serous chorioretinopathy. Med. Biol. Eng. Comput. 2021, 59, 1245–1259. [Google Scholar] [CrossRef]
- Tennakoon, R.; Gostar, A.K.; Hoseinnezhad, R.; Bab-Hadiashar, A. Retinal fluid segmentation in OCT images using adversarial loss based convolutional neural networks. In Proceedings of the 2018 IEEE 15th International Symposium on Biomedical Imaging (ISBI 2018), Washington, DC, USA, 4–7 April 2018; pp. 1436–1440. [Google Scholar]
- Liu, X.; Cao, J.; Fu, T.; Pan, Z.; Hu, W.; Zhang, K.; Liu, J. Semi-supervised automatic segmentation of layer and fluid region in retinal optical coherence tomography images using adversarial learning. IEEE Access 2018, 7, 3046–3061. [Google Scholar] [CrossRef]
- Chen, Z.; Li, D.; Shen, H.; Mo, H.; Zeng, Z.; Wei, H. Automated segmentation of fluid regions in optical coherence tomography B-scan images of age-related macular degeneration. Opt. Laser Technol. 2020, 122, 105830. [Google Scholar] [CrossRef]
- Ma, D.; Lu, D.; Chen, S.; Heisler, M.; Dabiri, S.; Lee, S.; Lee, H.; Ding, G.W.; Sarunic, M.V.; Beg, M.F. LF-UNet–a novel anatomical-aware dual-branch cascaded deep neural network for segmentation of retinal layers and fluid from optical coherence tomography images. Comput. Med. Imaging Graph. 2021, 94, 101988. [Google Scholar] [CrossRef] [PubMed]
- LaLonde, R.; Xu, Z.; Irmakci, I.; Jain, S.; Bagci, U. Capsules for biomedical image segmentation. Med. Image Anal. 2021, 68, 101889. [Google Scholar] [CrossRef] [PubMed]
- Wu, J.; Philip, A.M.; Podkowinski, D.; Gerendas, B.S.; Langs, G.; Simader, C.; Waldstein, S.M.; Schmidt-Erfurth, U.M. Multivendor Spectral-Domain Optical Coherence Tomography Dataset, Observer Annotation Performance Evaluation, and Standardized Evaluation Framework for Intraretinal Cystoid Fluid Segmentation. J. Ophthalmol. 2016, 2016, 3898750. [Google Scholar] [CrossRef] [Green Version]
- Bogunović, H.; Venhuizen, F.; Klimscha, S.; Apostolopoulos, S.; Bab-Hadiashar, A.; Bagci, U.; Beg, M.F.; Bekalo, L.; Chen, Q.; Ciller, C. RETOUCH: The retinal OCT fluid detection and segmentation benchmark and challenge. IEEE Trans. Med. Imaging 2019, 38, 1858–1874. [Google Scholar] [CrossRef] [PubMed]
- Rashno, A.; Nazari, B.; Koozekanani, D.D.; Drayna, P.M.; Sadri, S.; Rabbani, H.; Parhi, K.K. Fully-automated segmentation of fluid regions in exudative age-related macular degeneration subjects: Kernel graph cut in neutrosophic domain. PLoS ONE 2017, 12, e0186949. [Google Scholar] [CrossRef] [PubMed] [Green Version]
- Pennesi, M.E.; Birch, D.G.; Jayasundera, K.T.; Parker, M.; Tan, O.; Gurses-Ozden, R.; Reichley, C.; Beasley, K.N.; Yang, P.; Weleber, R.G.; et al. Prospective Evaluation of Patients With X-Linked Retinoschisis During 18 Months. Invest. Ophthalmol. Vis. Sci. 2018, 59, 5941–5956. [Google Scholar] [CrossRef]


| Paper | Core Method | Preprocessing | Retinal Layer Segmentation | Cyst Segmentation | Post-Processing | Disease | Data | Performance |
|---|---|---|---|---|---|---|---|---|
| Quellec et al. [27] | K-nearest neighbor [40] | Wavelet transform [15] | Multiscale 3-D graph search technique [47] | K-nearest neighbor | None | AMD | 91 macula-centered 3-D OCT volumes | AUC: 0.961 |
| González [48] | Support vector machine [41] | None | ILM RPE | Watershed algorithm [20] naive-Bayes, SVM, random forest | Discarding invalid candidate regions by properties: size, location, etc. | DR | 30 HD-OCT retinal gray-scale images | ACC: 80% |
| Gopinath [49] | Random forest [42] | Image size standardized. Total variational denoising [50] | Graph theory-based segmentation approach [33] | The center-surround difference method [51], random forest | None | NA | 15 volumes of SD-OCT scans: MICCAI 2015 | ACC: 76.7% |
| Chiu [52] | Kernel regression [43] | DME algorithm [53,54], KR-based denoising | ILM and BM | KR-based kernel regression | None | DR | Duke Enterprise Data Q = 61 B-scans × N = 768 | DC: 0.79 |
| Chen [55] | Graph search-graph cut [44] | SVM | 11-surface segmentation | GS-GC method | DME | NA | 15 spectral domain OCT images | TPVF: 86.5%, FPVF:1.7%, RVDR: 12.8% |
| Zhu [56] | AdaBoost [45] | A SNR balancing, A 3-D curvature anisotropic diffusion filter | Multiscale 3-D graph search technique [47] | AdaBoost classifier | Macular edema, MH | NA | SD-OCT scan of 19 eyes with coexistence of CMEs and MH from 18 subjects. | TPVF: 81%, FPVF: 0.80%, ACC: 99.7%, DC: 0.809 |
| Dataset | Dataset Size | Fluid/Cyst Type | OCT Vendor | Disease |
|---|---|---|---|---|
| OPTIMA [75] | 30 volumes | IRF | Spectralis, Topcon, Cirrus, Nidek | AMD, RVO, DME |
| RETOUCH [76] | 70 volumes | PED | Spectralis, Topcon, Cirrus, Nidek | AMD, RVO |
| Duke DME [52] | 110 B-scan images | All fluid-filled regions | Spectralis | DME |
| UMN [77] | 600 B-scan images | IRF, SRF, PED | Spectralis | AMD |
Disclaimer/Publisher’s Note: The statements, opinions and data contained in all publications are solely those of the individual author(s) and contributor(s) and not of MDPI and/or the editor(s). MDPI and/or the editor(s) disclaim responsibility for any injury to people or property resulting from any ideas, methods, instructions or products referred to in the content. |
© 2023 by the authors. Licensee MDPI, Basel, Switzerland. This article is an open access article distributed under the terms and conditions of the Creative Commons Attribution (CC BY) license (https://creativecommons.org/licenses/by/4.0/).
Share and Cite
Wei, X.; Sui, R. A Review of Machine Learning Algorithms for Retinal Cyst Segmentation on Optical Coherence Tomography. Sensors 2023, 23, 3144. https://doi.org/10.3390/s23063144
Wei X, Sui R. A Review of Machine Learning Algorithms for Retinal Cyst Segmentation on Optical Coherence Tomography. Sensors. 2023; 23(6):3144. https://doi.org/10.3390/s23063144
Chicago/Turabian StyleWei, Xing, and Ruifang Sui. 2023. "A Review of Machine Learning Algorithms for Retinal Cyst Segmentation on Optical Coherence Tomography" Sensors 23, no. 6: 3144. https://doi.org/10.3390/s23063144