
Non-Intrusive Privacy-Preserving Approach for Presence Monitoring Based on WiFi Probe Requests


Abstract
:1. Introduction
- The design and implementation of a low-cost system for capturing, transferring and storing WiFi PRs and corresponding radio channel characteristics.
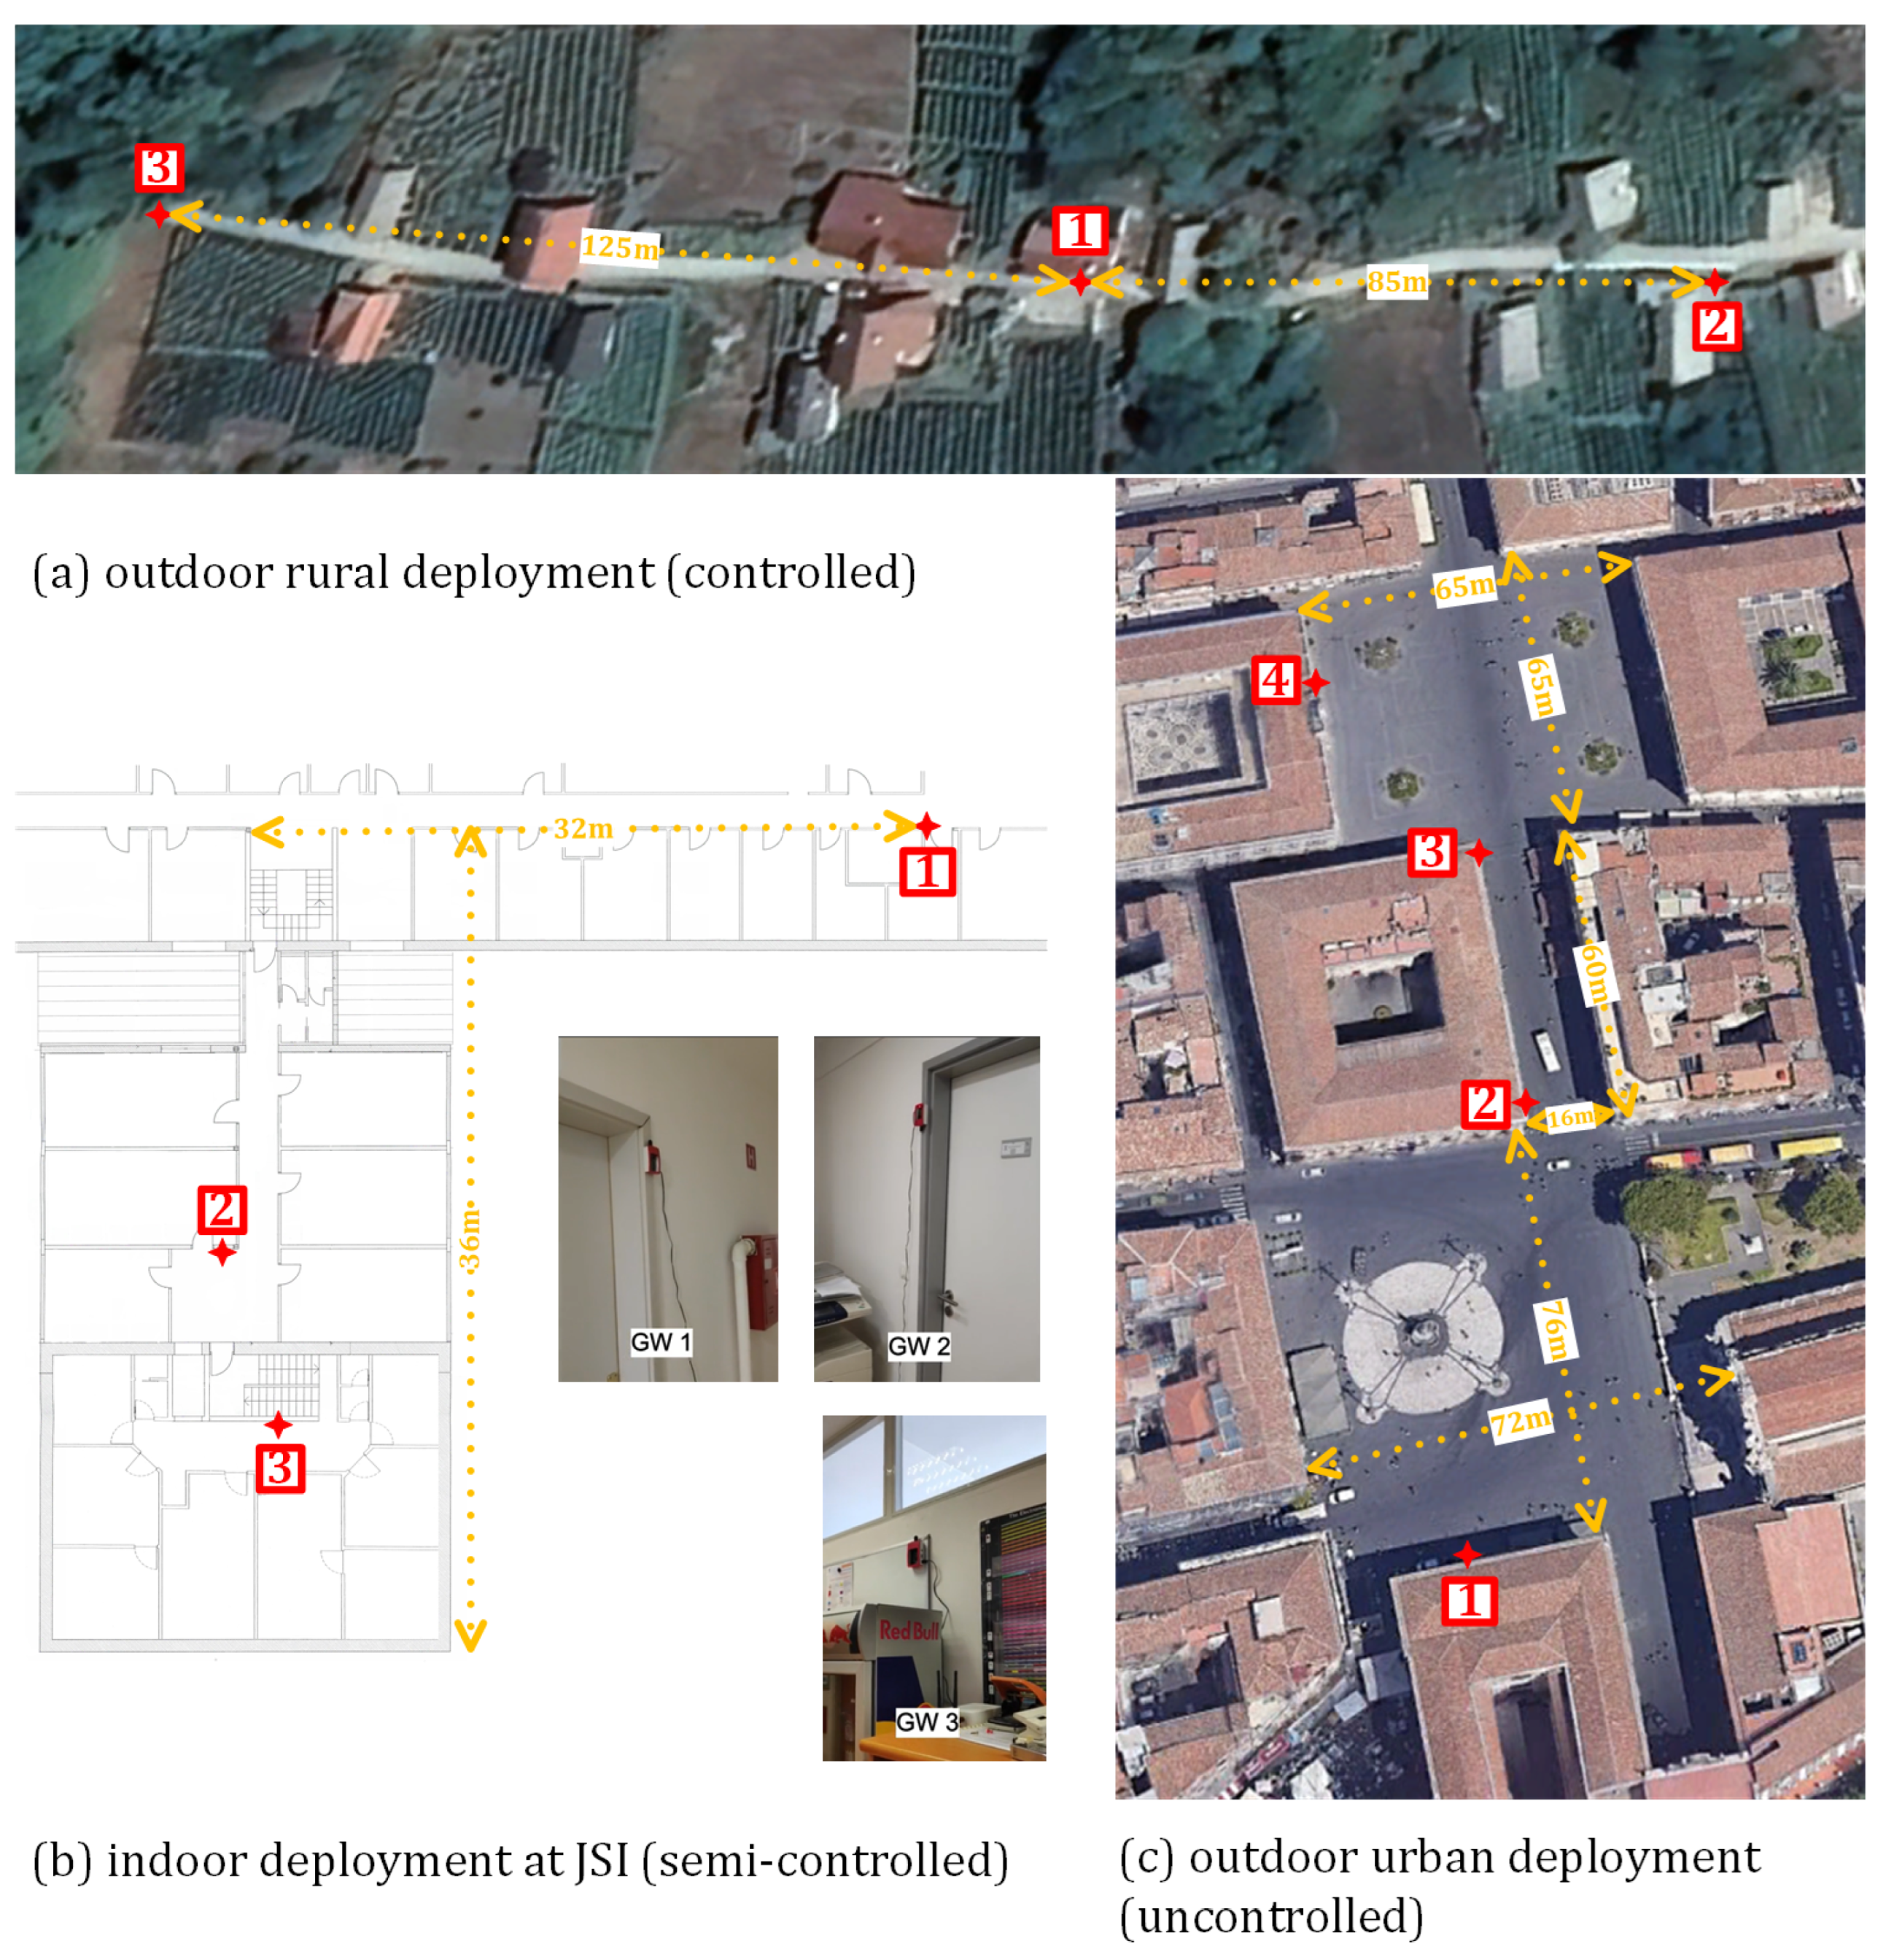
- Open datasets of the captured WiFi PRs and corresponding radio channel characteristics in a controlled rural outdoor, semi-controlled indoor and uncontrolled urban outdoor environments.
- A novel MAC de-randomization method for distinguishing individual WiFi-capable devices including new clustering and matching procedures based on PRs and corresponding radio channel characteristics.
- Validation of the proposed method by the measurements in controlled, semi-controlled and completely uncontrolled environments.
2. Background and Related Work
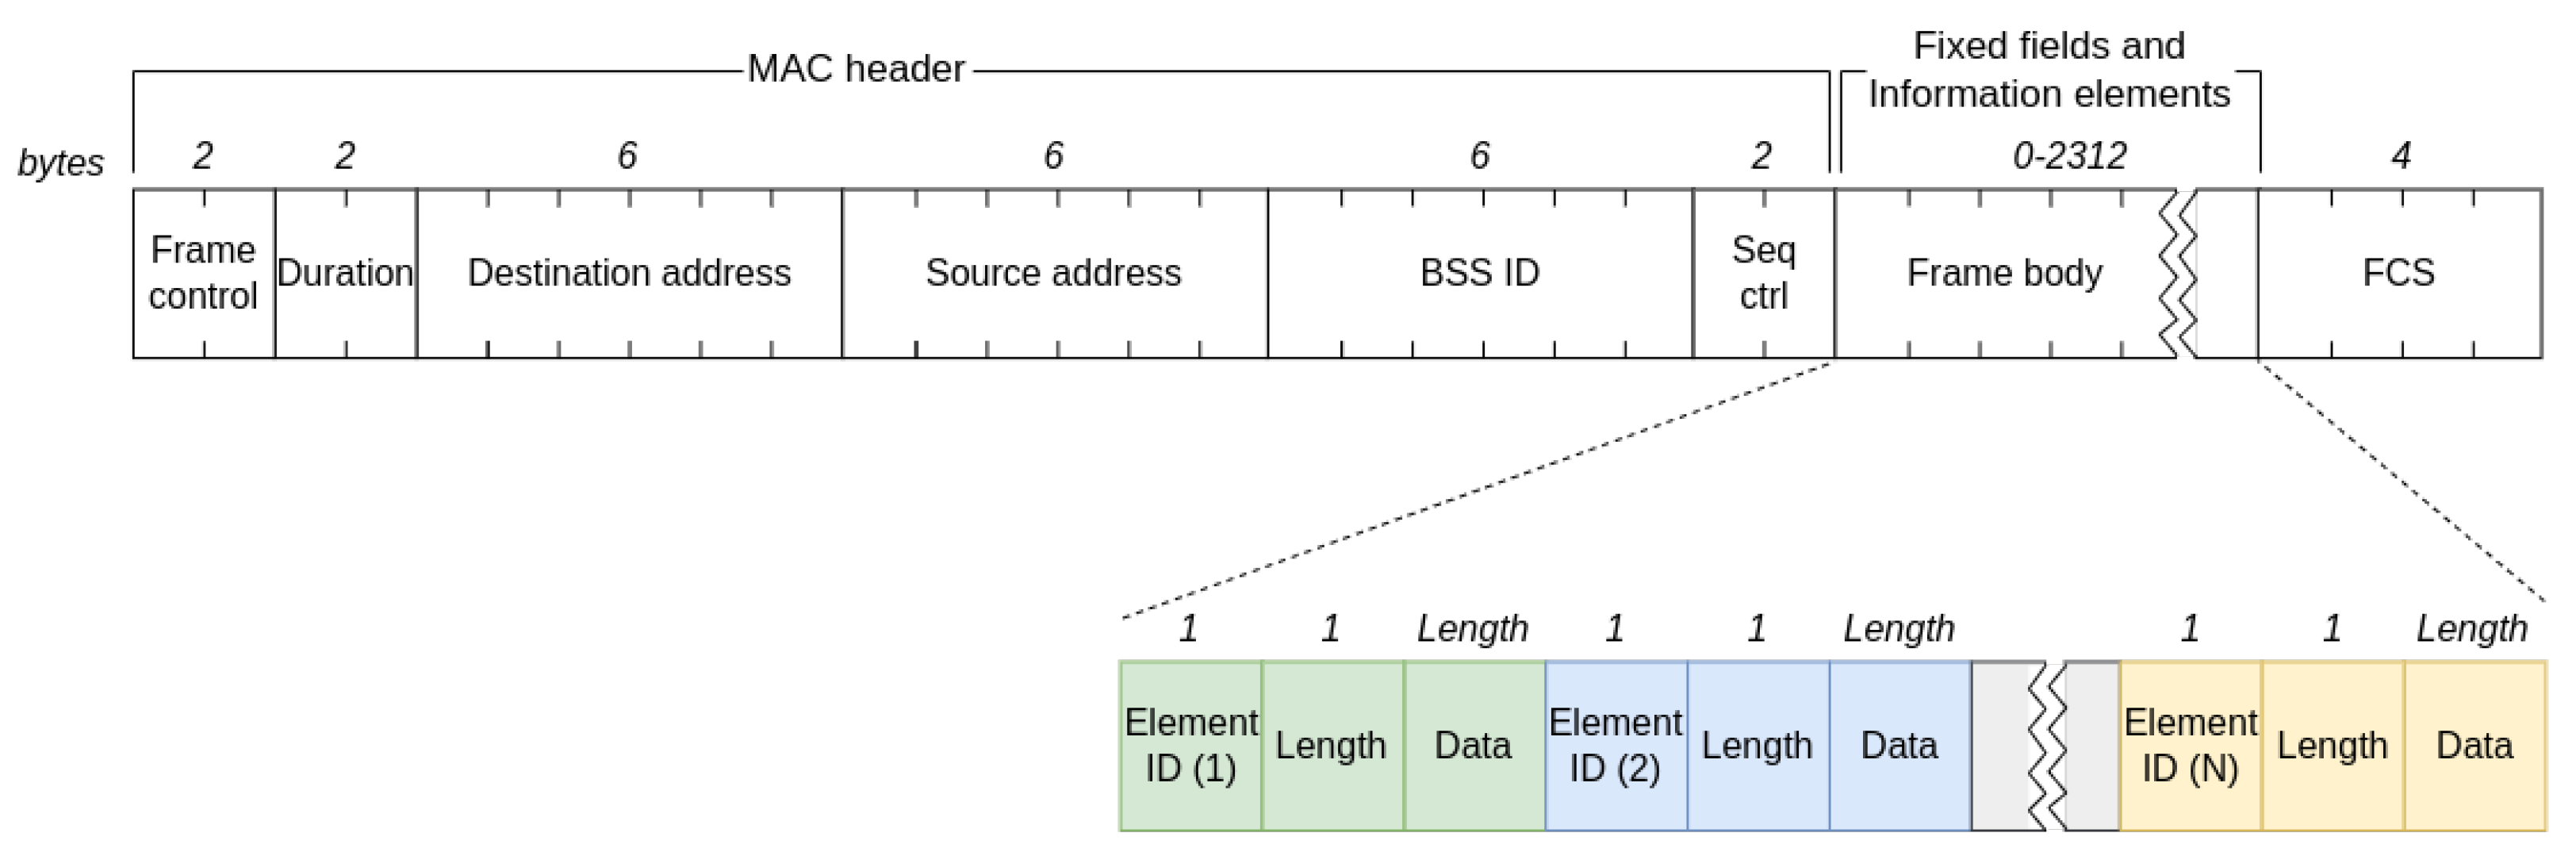
2.1. Probe Requests and MAC Randomization
2.2. Related Work
3. System Design, Implementation and Deployment
3.1. System Architecture
3.2. Capturing the WiFi Network Management Traffic
3.3. System Deployment
4. Detecting Unique WiFi Interfaces
4.1. Data Collection
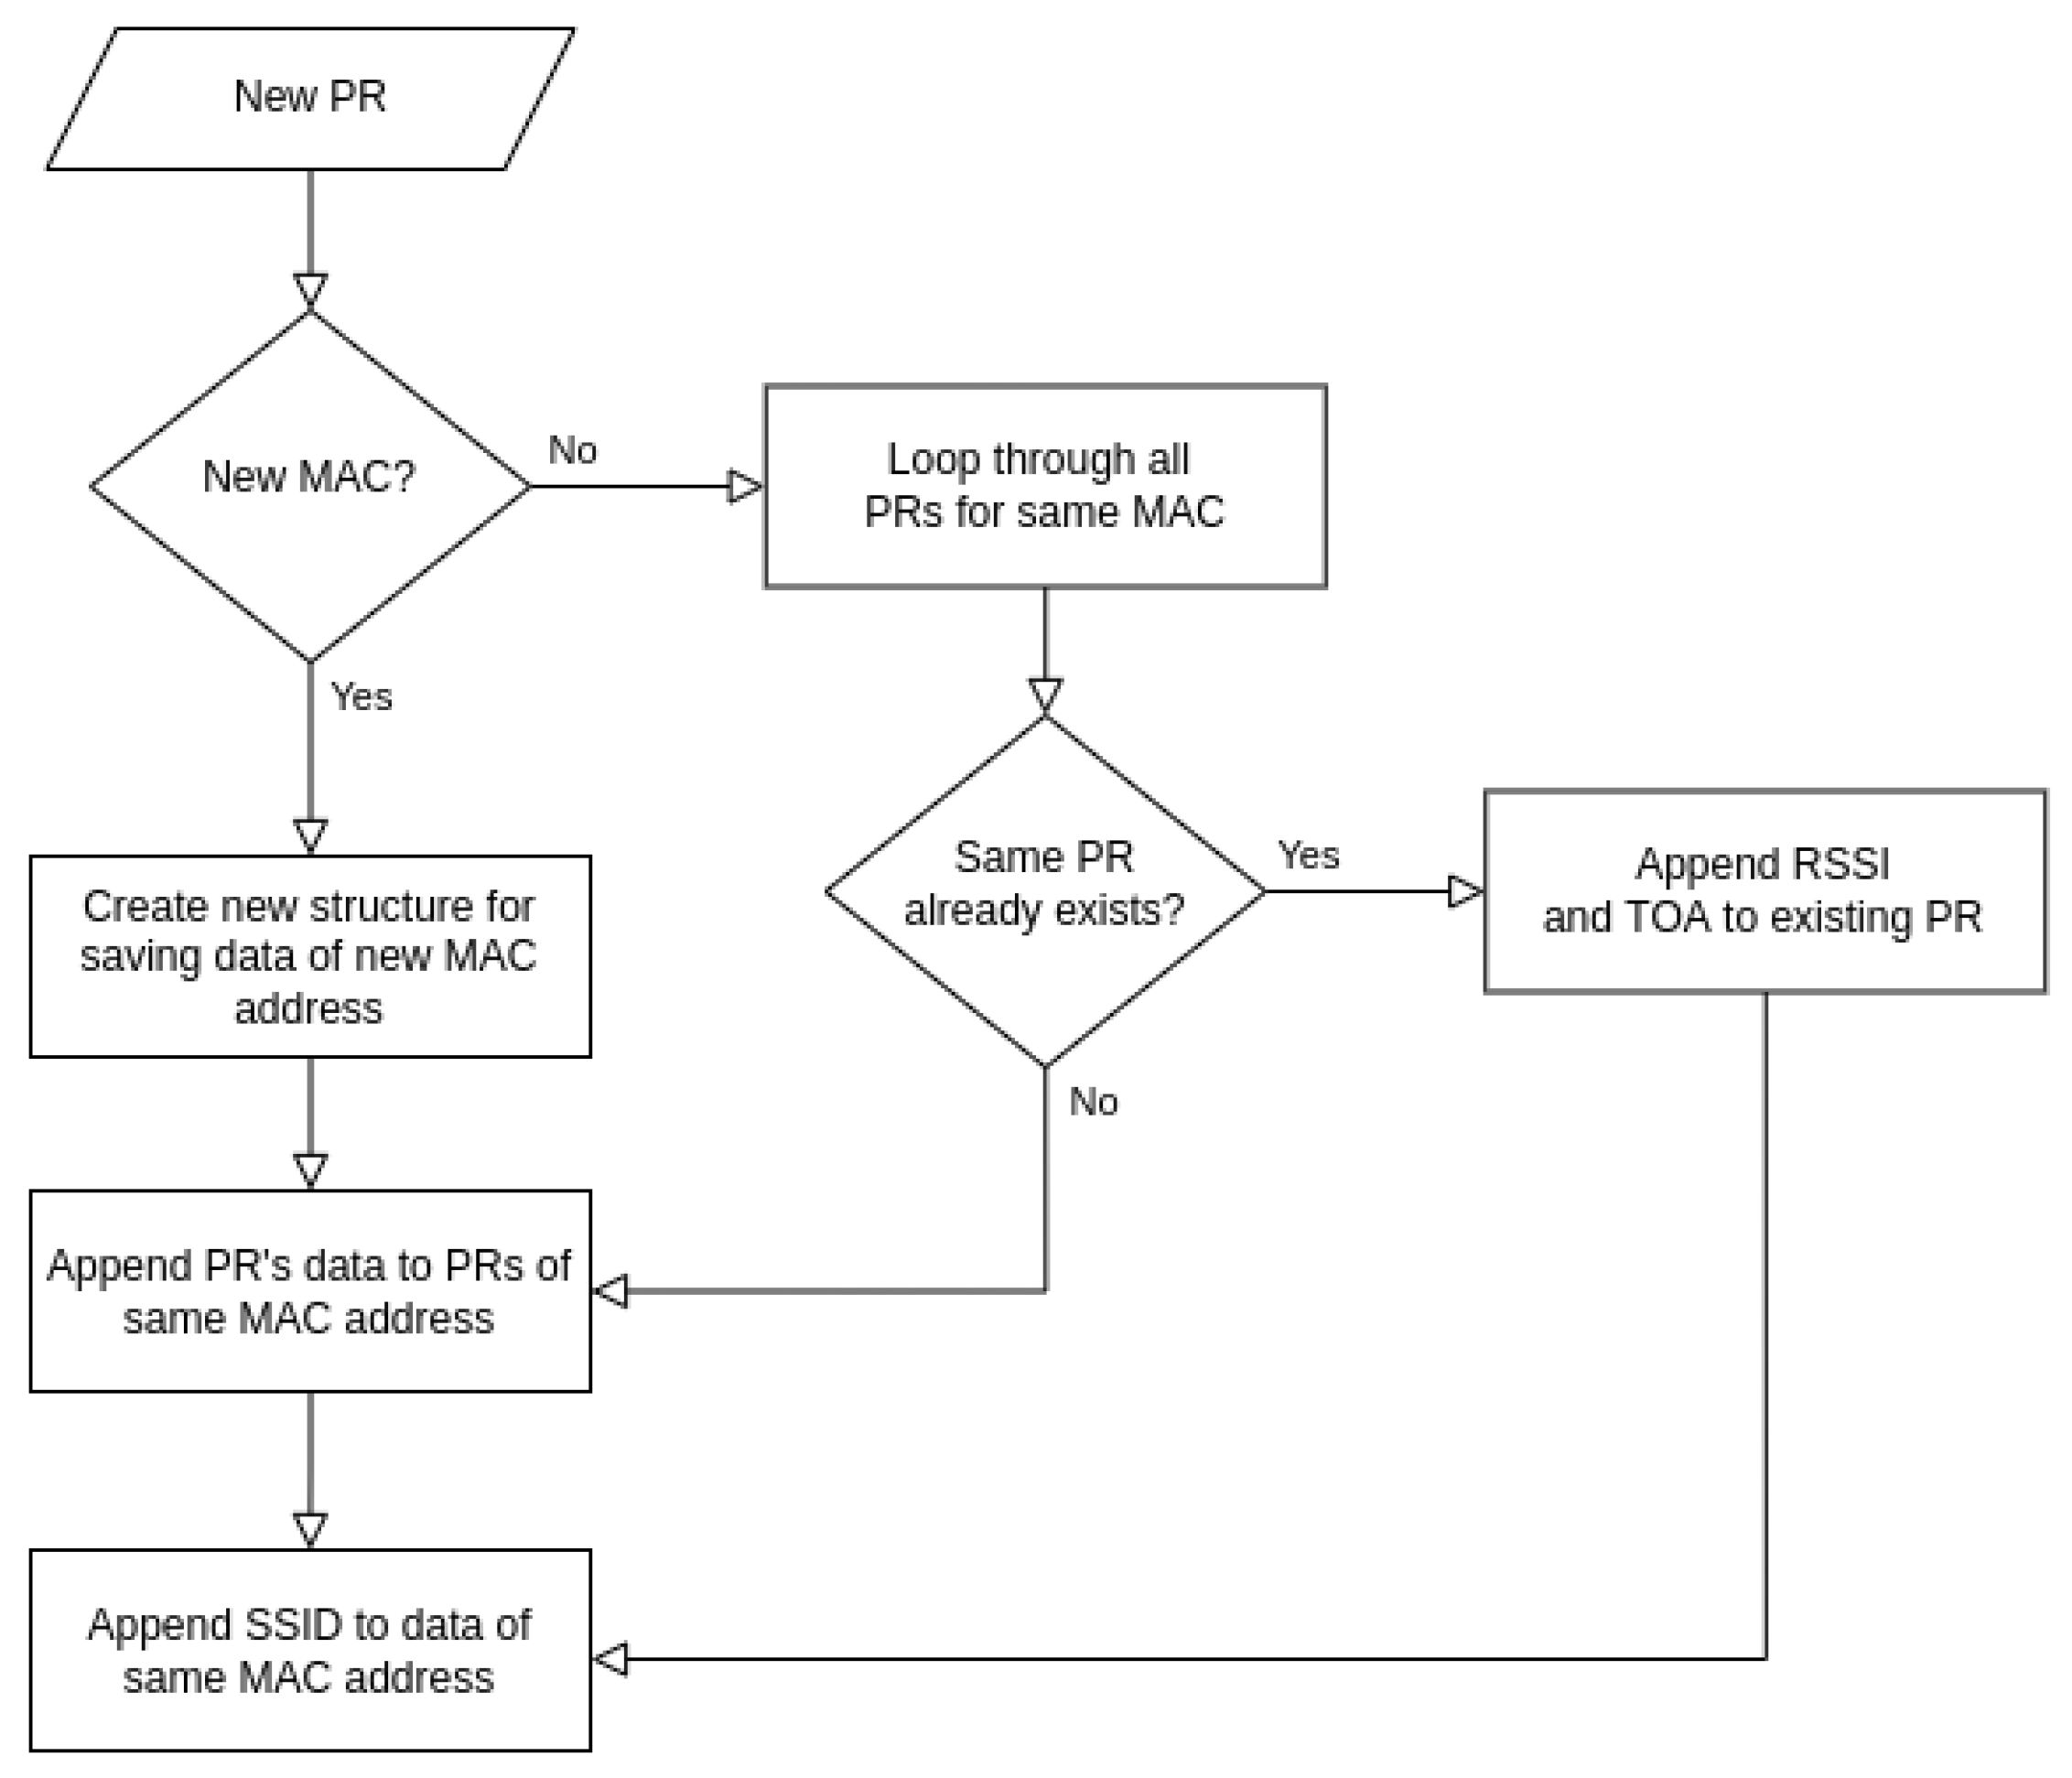
4.2. Data Pre-Processing and Storing
4.3. De-Randomization Method
- MAC addresses are first divided into two groups: global and random addresses. Additionally, random MAC addresses are also subgrouped with respect to the CID part of the MAC address.
- The clustering of random MAC addresses is applied to all groups with random MAC addresses to obtain clusters from individual WiFi-enabled devices.
- The clustering of global addresses with clusters of random addresses is applied to match global MAC addresses with clusters of random MAC addresses obtained in the previous step.
- The number of individual WiFi-enabled devices is estimated by counting the number of clusters.
4.3.1. Initial Grouping of MAC Addresses
4.3.2. Clustering of Random MAC Addresses
4.3.3. Matching of Global MAC Addresses with Clusters of Random MAC Addresses
5. Performance Evaluation and Discussion
5.1. Testing Scenarios and Methodology
5.2. MAC De-Randomization and Results Analysis
5.3. Discussion
6. Conclusions
Author Contributions
Funding
Institutional Review Board Statement
Informed Consent Statement
Data Availability Statement
Conflicts of Interest
Abbreviations
| CID | Company Identifier |
| GDPR | General Data Protection Regulation |
| HMM | Hidden Markov Models |
| HT | High Throughput |
| IE | Information Element |
| IFAT | Inter-Frame Arrival Time |
| IoT | Internet-of-Things |
| JSI | Jozef Stefan Institute |
| JSON | JavaScript Object Notation |
| MAC | medium access control |
| ML | Machine learning |
| NIC | Network Interface Controller |
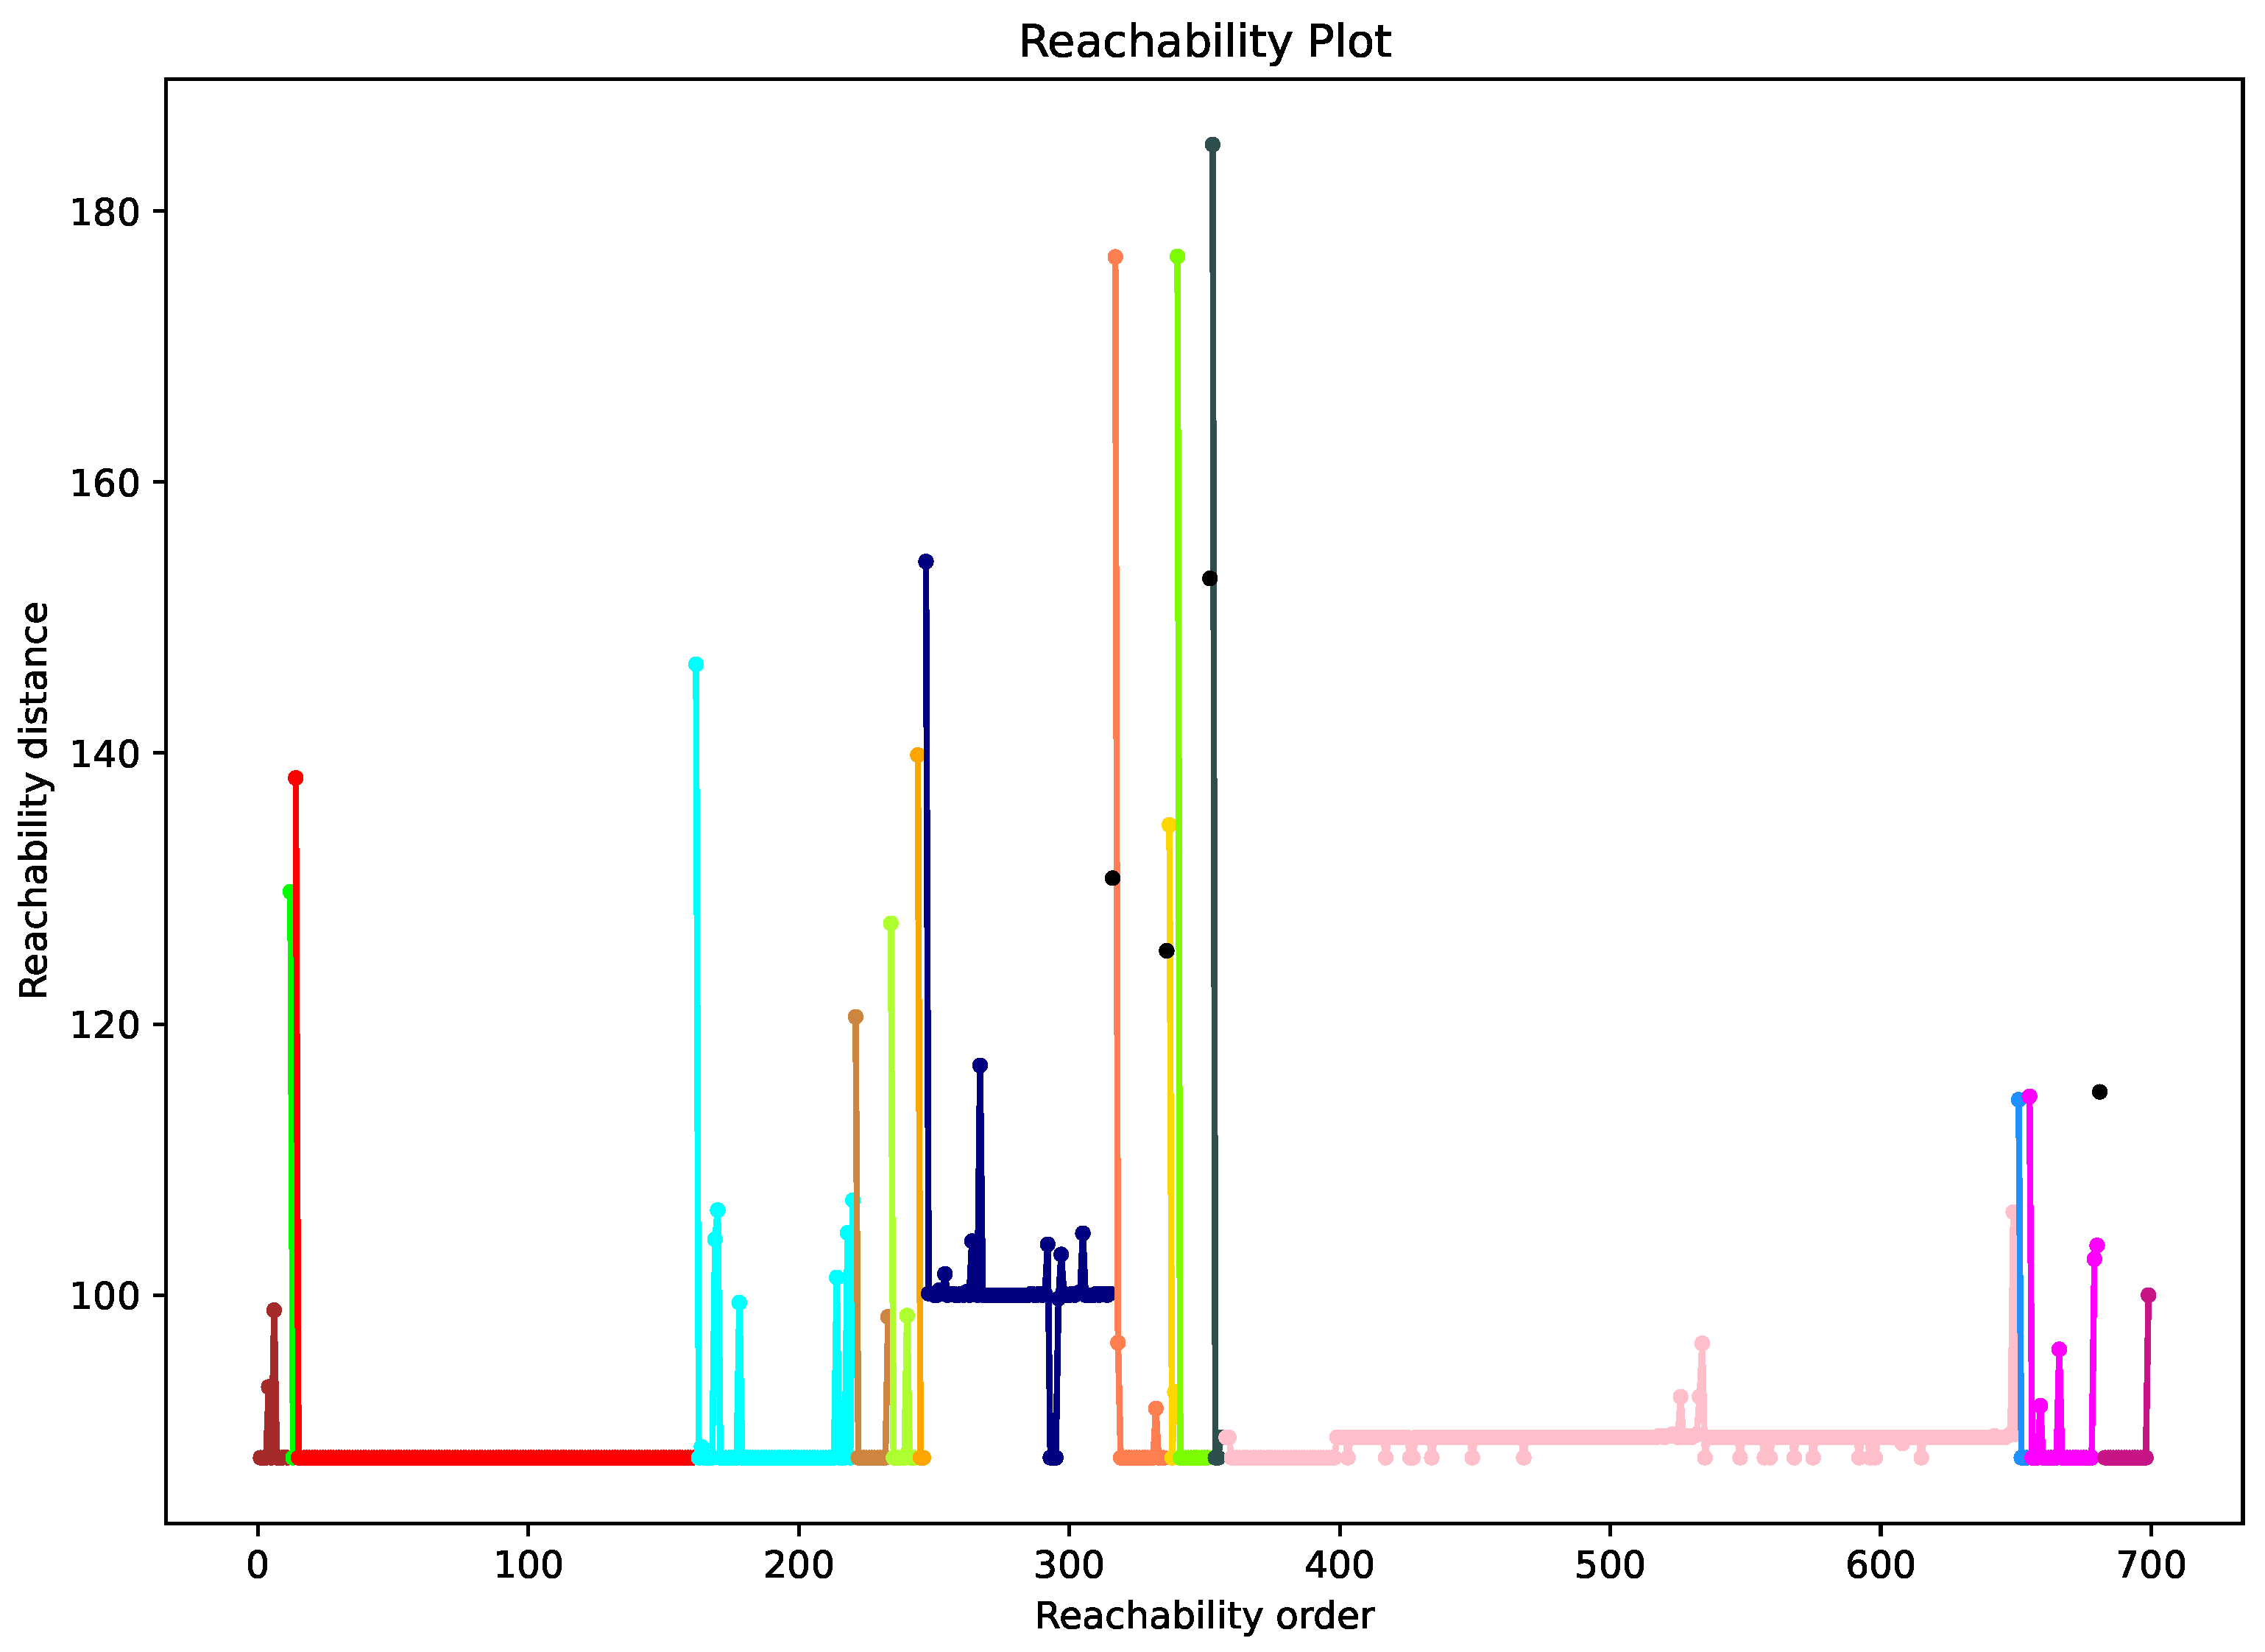
| OPTICS | Ordering Points to Identify the Clustering Structure |
| OS | Operating system |
| OUI | Organization Unique Identifier |
| PR | Probe Request |
| REST | Representational State Transfer |
| rPi | Raspberry Pi |
| RSSI | Received Signal Strength Indicator |
| SSID | Service Set Identifier |
| ToA | Time of Arrival |
| VHT | Very High Throughput |
| WSD | Wireless Sensor Device |
Appendix A. Structure of Stored Data from PR

Appendix B. Algorithms
| Algorithm A1 Algorithm for calculating distance between two probe requests |
|
| Algorithm A2 Reachability distance-based clustering |
|
References
- Covaci, A.I. Wi-Fi MAC Address Randomization vs. Crowd Monitoring. Bachelor’s Thesis, University of Twente, Enschede, The Netherlands, 2022. [Google Scholar]
- Ahmed, N.; Michelin, R.A.; Xue, W.; Ruj, S.; Malaney, R.; Kanhere, S.S.; Seneviratne, A.; Hu, W.; Janicke, H.; Jha, S.K. A survey of COVID-19 contact tracing apps. IEEE Access 2020, 8, 134577–134601. [Google Scholar] [CrossRef]
- Su, Z.; Pahlavan, K.; Agu, E. Performance evaluation of COVID-19 proximity detection using bluetooth LE signal. IEEE Access 2021, 9, 38891–38906. [Google Scholar] [CrossRef] [PubMed]
- Švigelj, A.; Hrovat, A.; Javornik, T. User-Centric Proximity Estimation Using Smartphone Radio Fingerprinting. Sensors 2022, 22, 5609. [Google Scholar] [CrossRef] [PubMed]
- Fenske, E.; Brown, D.; Martin, J.; Mayberry, T.; Ryan, P.; Rye, E. Three Years Later: A Study of MAC Address Randomization in Mobile Devices and When It Succeeds. Proc. Priv. Enhancing Technol. 2021, 2021, 164–181. [Google Scholar] [CrossRef]
- Bonne, B.; Barzan, A.; Quax, P.; Lamotte, W. WiFiPi: Involuntary tracking of visitors at mass events. In Proceedings of the 2013 IEEE 14th International Symposium on “A World of Wireless, Mobile and Multimedia Networks” (WoWMoM), Madrid, Spain, 4–7 June 2013; pp. 1–6. [Google Scholar] [CrossRef]
- Martin, J.; Mayberry, T.; Donahue, C.; Foppe, L.; Brown, L.; Riggins, C.; Rye, E.C.; Brown, D. A Study of MAC Address Randomization in Mobile Devices and When it Fails. arXiv 2017, arXiv:1703.02874. [Google Scholar] [CrossRef] [Green Version]
- Franklin, J.; McCoy, D. Passive Data Link Layer 802.11 Wireless Device Driver Fingerprinting. In Proceedings of the 15th USENIX Security Symposium (USENIX Security 06), Vancouver, BC, Canada, 31 July–4 August 2006. [Google Scholar]
- Desmond, L.C.C.; Yuan, C.C.; Pheng, T.C.; Lee, R.S. Identifying Unique Devices through Wireless Fingerprinting. In Proceedings of the First ACM Conference on Wireless Network Security, Alexandria, VA, USA, 31 March–2 April 2008; Association for Computing Machinery: New York, NY, USA, 2008; pp. 46–55. [Google Scholar] [CrossRef]
- Matte, C.; Cunche, M.; Rousseau, F.; Vanhoef, M. Defeating MAC Address Randomization Through Timing Attacks. In Proceedings of the 9th ACM Conference on Security & Privacy in Wireless and Mobile Networks, Darmstadt, Germany, 18–20 July 2016; pp. 15–20. [Google Scholar] [CrossRef] [Green Version]
- Uras, M.; Cossu, R.; Ferrara, E.; Bagdasar, O.; Liotta, A.; Atzori, L. WiFi Probes sniffing: An Artificial Intelligence based approach for MAC addresses de-randomization. In Proceedings of the 2020 IEEE 25th International Workshop on Computer Aided Modeling and Design of Communication Links and Networks (CAMAD), Pisa, Italy, 14–16 September 2020; pp. 1–6. [Google Scholar] [CrossRef]
- Vanhoef, M.; Matte, C.; Cunche, M.; Cardoso, L.S.; Piessens, F. Why MAC Address Randomization is not Enough: An Analysis of Wi-Fi Network Discovery Mechanisms. In Proceedings of the 11th ACM on Asia Conference on Computer and Communications Security, Xi’an, China, 30 May–3 June 2016; pp. 413–424. [Google Scholar] [CrossRef] [Green Version]
- Myrvoll, T.A.; Hakegard, J.E.; Matsui, T.; Septier, F. Counting public transport passenger using WiFi signatures of mobile devices. In Proceedings of the 2017 IEEE 20th International Conference on Intelligent Transportation Systems (ITSC), Yokohama, Japan, 16–19 October 2017; pp. 1–6. [Google Scholar] [CrossRef]
- Groba, C. Demonstrations and people-counting based on Wifi probe requests. In Proceedings of the 2019 IEEE 5th World Forum on Internet of Things (WF-IoT), Limerick, Ireland, 15–18 April 2019; pp. 596–600. [Google Scholar] [CrossRef]
- Guillen-Perez, A.; Cano Banos, M.D. A WiFi-based method to count and locate pedestrians in urban traffic scenarios. In Proceedings of the 2018 14th International Conference on Wireless and Mobile Computing, Networking and Communications (WiMob), Limassol, Cyprus, 15–17 October 2018; pp. 123–130. [Google Scholar] [CrossRef]
- Guillen-Perez, A.; Cano, M.D. Counting and locating people in outdoor environments: A comparative experimental study using WiFi-based passive methods. ITM Web Conf. 2019, 24, 01010. [Google Scholar] [CrossRef]
- Hong, H.; De Silva, G.D.; Chan, M.C. CrowdProbe: Non-invasive Crowd Monitoring with Wi-Fi Probe. In Proceedings of the ACM on Interactive, Mobile, Wearable and Ubiquitous Technologies, Singapore, 8–12 October 2018; Volume 2, pp. 1–23. [Google Scholar] [CrossRef]
- Shen, J.; Cao, J.; Liu, X. BaG: Behavior-Aware Group Detection in Crowded Urban Spaces Using WiFi Probes. IEEE Trans. Mob. Comput. 2021, 20, 3298–3310. [Google Scholar] [CrossRef]
- Oliveira, L.; Schneider, D.; De Souza, J.; Shen, W. Mobile Device Detection Through WiFi Probe Request Analysis. IEEE Access 2019, 7, 98579–98588. [Google Scholar] [CrossRef]
- Uras, M.; Cossu, R.; Atzori, L. PmA: A solution for people mobility monitoring and analysis based on WiFi probes. In Proceedings of the 2019 4th International Conference on Smart and Sustainable Technologies (SpliTech), Split, Croatia, 18–21 June 2019; pp. 1–6. [Google Scholar] [CrossRef]
- Wu, F.J.; Huang, Y.; Doring, L.; Althoff, S.; Bitterschulte, K.; Chai, K.Y.; Mao, L.; Grabarczyk, D.; Kovacs, E. PassengerFlows: A Correlation-Based Passenger Estimator in Automated Public Transport. IEEE Trans. Netw. Sci. Eng. 2020, 7, 2167–2181. [Google Scholar] [CrossRef]
- Vieira, T.; Almeida, P.; Meireles, M.; Ribeiro, R. Public Transport Occupancy Estimation using WLAN Probing and Mathematical Modeling. Transp. Res. Procedia 2020, 48, 3299–3309. [Google Scholar] [CrossRef]
- Furuya, Y.; Asahina, H.; Yoshida, M.; Sasase, I. Indoor Crowd Estimation Scheme Using the Number of Wi-Fi Probe Requests under MAC Address Randomization. IEICE Trans. Inf. Syst. 2021, E104.D, 1420–1426. [Google Scholar] [CrossRef]
- Yang, F.; Ahriz, I.; Denby, B. Statistical Approach to Estimating Audience from MAC-Randomized WiFi Probe Requests. Sensors 2022, 22, 8679. [Google Scholar] [CrossRef] [PubMed]
- Cai, Y.; Tsukada, M.; Ochiai, H.; Esaki, H. MAC address randomization tolerant crowd monitoring system using Wi-Fi packets. In Proceedings of the 16th Asian Internet Engineering Conference, Virtual Event, Japan, 14–16 December 2021; pp. 27–33. [Google Scholar] [CrossRef]
- Nitti, M.; Pinna, F.; Pintor, L.; Pilloni, V.; Barabino, B. iABACUS: A Wi-Fi-Based Automatic Bus Passenger Counting System. Energies 2020, 13, 1446. [Google Scholar] [CrossRef] [Green Version]
- Gebru, K. A Privacy-preserving Scheme for Passive Monitoring of People’s Flows through WiFi Beacons. In Proceedings of the 2022 IEEE 19th Annual Consumer Communications & Networking Conference (CCNC), Las Vegas, NV, USA, 8–11 January 2022; pp. 421–424. [Google Scholar] [CrossRef]
- Gebru, K.; Rapelli, M.; Rusca, R.; Casetti, C.; Chiasserini, C.F.; Giaccone, P. Edge-based passive crowd monitoring through WiFi Beacons. Comput. Commun. 2022, 192, 163–170. [Google Scholar] [CrossRef]
- Determe, J.F.; Azzagnuni, S.; Singh, U.; Horlin, F.; De Doncker, P. Monitoring Large Crowds With WiFi: A Privacy-Preserving Approach. IEEE Syst. J. 2022, 16, 2148–2159. [Google Scholar] [CrossRef]
- Berenguer, A.; Ros, D.F.; Gómez-Oliva, A.; Ivars-Baidal, J.A.; Jara, A.J.; Laborda, J.; Mazón, J.N.; Perles, A. Crowd Monitoring in Smart Destinations Based on GDPR-Ready Opportunistic RF Scanning and Classification of WiFi Devices to Identify and Classify Visitors’ Origins. Electronics 2022, 11, 835. [Google Scholar] [CrossRef]
- Vega-Barbas, M.; Álvarez Campana, M.; Rivera, D.; Sanz, M.; Berrocal, J. AFOROS: A Low-Cost Wi-Fi-Based Monitoring System for Estimating Occupancy of Public Spaces. Sensors 2021, 21, 3863. [Google Scholar] [CrossRef]
- Uras, M.; Ferrara, E.; Cossu, R.; Liotta, A.; Atzori, L. MAC Address De-Randomization for WiFi Device Counting: Combining Temporal- and Content-Based Fingerprints. Comput. Netw. 2022, 218, 109393. [Google Scholar] [CrossRef]
- Pintor, L.; Atzori, L. Analysis of Wi-Fi Probe Requests Towards Information Element Fingerprinting. In Proceedings of the 2022 IEEE Global Communications Conference GLOBECOM 2022, Rio de Janeiro, Brazil, 4–8 December 2022; pp. 3857–3862. [Google Scholar] [CrossRef]
- Pintor, L.; Atzori, L. A dataset of labelled device Wi-Fi probe requests for MAC address de-randomization. Comput. Netw. 2022, 205, 108783. [Google Scholar] [CrossRef]
- Robyns, P.; Bonné, B.; Quax, P.; Lamotte, W. Noncooperative 802.11 MAC Layer Fingerprinting and Tracking of Mobile Devices. Secur. Commun. Netw. 2017, 2017, 6235484. [Google Scholar] [CrossRef] [Green Version]
- Ankerst, M.; Breunig, M.M.; Kriegel, H.P.; Sander, J. OPTICS: Ordering points to identify the clustering structure. ACM Sigmod Rec. 1999, 28, 49–60. [Google Scholar] [CrossRef]
- Simončič, A.; Mohorčič, M.; Mohorčič, M.; Hrovat, A. Labeled Dataset of IEEE 802.11 Probe Requests; Zenodo: Geneva, Switzerland, 2023. [Google Scholar] [CrossRef]
- Mohorčič, M.; Simončič, A.; Mohorčič, M.; Hrovat, A. Dataset of IEEE 802.11 Probe Requests from an Uncontrolled Urban Environment; Zenodo: Geneva, Switzerland, 2023. [Google Scholar] [CrossRef]


| IE Name | Data Type | Data Length in Octets |
|---|---|---|
| SSID | UTF-8 encoded | Variable (max 32) |
| Supported Data Rates | Each data rate encoded as one octet | Variable (max 8) |
| Extended Supported Rates | Each data rate encoded as one octet | Variable (max 255) |
| HT Capabilities | Hex | 26 |
| Extended Capabilities | Hex | Variable |
| Interworking | Hex | 1–9 |
| VHT Capabilities | Hex | 12 |
| Vendor Specific Tag | Hex | Variable |
| Extended Tag | Hex | Variable |
| Device Name | OS | MAC Type | Assigned Group |
|---|---|---|---|
| Apple iPhone 12 Pro | iOS 16 | Random MAC only | 1 |
| Nokia 7 Plus | Android 10 | Random MAC only(CID: da:a1:19) | 1 |
| Samsung S10E | Android 12 | Random MAC only | 1 |
| Samsung J3 2016 | Android 5.1.1 | Global MAC only (d0:b1:28:d2:de:e5) | 2 |
| Samsung S3 | Android 4.4.4 | Global MAC only (34:23:ba:d5:34:1b) | 2 |
| Samung Galaxy Nexus | Android 4.3 | Global MAC only (a0:0b:ba:da:64:7e) | 2 |
| Samsung S10E | Android 12 | Random MAC only | 2 |
| Samsung S7 Edge | Android 8 | Random MAC only | 2 |
| Samsung J5 | Android 6 | Global MAC only (20:55:31:fc:4c:86) | 2 |
| Samsung S7 | Android 8 | Random MAC only | 2 |
| Samsung S7 | Android 8 | Random MAC only | 3 |
| Samsung Tab S8 | Android 12 | Random MAC only | 2 |
| Huawei Nexus 6P | Android 8.1.0 | Global MAC (dc:ee:06:fd:8c:9a) + Random MAC (CID: da:a1:19) | 3 |
| Huawei P20 | Android 10 | Global MAC (e4:34:93:b5:f0:74) + Random MAC (CID: da:a1:19) | 3 |
| Huawei P20 | Android 10 | Global MAC (e4:0e:ee:3e:3e:44) + Random MAC (CID: da:a1:19) | 3 |
| Huawei P30 Lite | Android 10 | Random MAC only (CID: da:a1:19) | 1 |
| Huawei P20 Lite | Android 9 | Random MAC only (CID: da:a1:19) | 3 |
| Asus Tab 8" | Android 5.0 | Global MAC only (54:a0:50:0e:8f:ee) | 1 |
| Asus Tab 7" | Android 4.2.2 | Global MAC only (08:62:66:72:ac:1f) | 3 |
| OnePlus 3 | Android 9 | Random MAC only (CID: da:a1:19) | 3 |
| OnePlus 6 | Android 11 | Global MAC only (64:a2:f9:28:98:6c) | 1 |
| Lenovo VIBE A7020 | Android 6 | Global MAC only (54:27:58:30:ac:5a) | 1 |
| Xiaomi Poco F1 | Android 10 | Random MAC only | 1 |
| Device | Global Addresses Detected | Random Addresses Detected | Devices Identified |
|---|---|---|---|
| Samsung Galaxy M31 | 0 | 15 | 1 |
| Xiaomi Redmi 4 | 0 | 531 | 2 |
| Samsung Galaxy S4 | 1 | 0 | 1 |
| Huawei ALE-L21 | 1 | 0 | 1 |
| Xiaomi Mi A2 Lite | 0 | 435 | 2 |
| Huawei CLT-L09 (P20) | 1 | 0 | 1 |
| Samsung Galaxy S6 edge (SM-G928F) | 1 | 0 | 1 |
| Samsung Galaxy S7 | 0 | 38 | 1 |
| Xiaomi Redmi 5 Plus | 0 | 253 | 2 |
| Samsung Galaxy J6 | 1 | 26 | 2 |
| Google Pixel 3A | 0 | 46 | 2 |
| Apple XS max | 0 | 103 | 1 |
| Apple iPhone 6 | 0 | 57 | 1 |
| One Plus Nord | 0 | 35 | 1 |
| Huawei VTR-L09 (P10) | 1 | 0 | 1 |
| Huawei STF-L09 (Honor 9) | 1 | 88 | 1 |
| Xiaomi Redmi Note 7 | 1 | 153 | 1 |
| Xiaomi Redmi Note 9S | 0 | 138 | 1 |
| Apple iPhone XR | 0 | 36 | 1 |
| Google Pixel 3A | 0 | 23 | 1 |
| Apple iPhone 12 | 0 | 1206 | 1 |
| Apple iPhone 7 | 0 | 19 | 1 |
| All devices combined | 8 | 3201 | 21/22 (95.5%) |
| Global Addresses Detected | Random Addresses Detected | Devices Identified/Devices Present | |||||
|---|---|---|---|---|---|---|---|
| Location | Rural | Indoor | Rural | Indoor | Rural | Indoor | |
| Device | |||||||
| Apple iPhone 12 Pro | 0 | 6 | 31 | 19 | 1/1 | 8/8 | |
| Nokia 7 Plus | 0 | 6 | 6 | 20 | 1/1 | 8/8 | |
| Samsung S10e | 0 | 5 | 6 | 15 | 1/1 | 8/9 | |
| Samsung J3 2016 | 1 | 7 | 0 | 7 | 1/1 | 8/8 | |
| Samsung S3 | 1 | 7 | 0 | 6 | 1/1 | 9/9 | |
| Samsung Galaxy Nexus | 1 | 6 | 0 | 10 | 1/1 | 8/9 | |
| Samsung S7 | 0 | 5 | 4 | 22 | 1/1 | 9/9 | |
| Huawei Nexus 6P | 1 | 6 | 2 | 14 | 1/1 | 8/8 | |
| Asus Tab 8" | 1 | 6 | 0 | 10 | 1/1 | 7/7 | |
| Asus Tab 7" | 1 | 6 | 0 | 11 | 1/1 | 7/7 | |
| OnePlus 3 | 0 | 5 | 1 | 16 | 1/1 | 7/9 | |
| Samsung S10e | 0 | 8 | 4 | 4 | 1/1 | 9/9 | |
| Samsung S7 Edge | 0 | 8 | 4 | 4 | 1/1 | 9/9 | |
| Samsung J5 | 1 | 8 | 0 | 0 | 1/1 | 8/8 | |
| Samsung S7 | 0 | 8 | 3 | 1 | 1/1 | 9/9 | |
| Samsung Tab S8 | 0 | 9 | 4 | 12 | 1/1 | 12/12 | |
| Huawei P20 | 1 | 8 | 3 | 0 | 1/1 | 8/8 | |
| Huawei P20 | 8 | 3 | 8/8 | ||||
| Huawei P30 Lite | 0 | 8 | 1 | 1 | 1/1 | 8/9 | |
| Huawei P20 Lite | 0 | 8 | 1 | 1 | 1/1 | 8/9 | |
| OnePlus 6 | 1 | 10 | 0 | 0 | 1/1 | 10/10 | |
| Lenovo VIBE A7020 | 1 | 8 | 0 | 7 | 1/1 | 9/10 | |
| Xiaomi Poco F1 | 0 | 7 | 2-5 | 16 | 1/1 | 10/10 | |
| Mean | 100% | 96.7 % | |||||
| Global Addresses Detected | Random Addresses Detected | Devices Identified | Devices Identified | |||||||||
|---|---|---|---|---|---|---|---|---|---|---|---|---|
| (Only Random MACs) | ||||||||||||
| Loc. | Group | Group | Group | Group | ||||||||
| 1 | 2 | 3 | 1 | 2 | 3 | 1 | 2 | 3 | 1 | 2 | 3 | |
| Rural 1 | 3 | 4 | 3 | 50 | 16 | 6 | 7/8 | 7/8 | 6/6 | 5/5 | 3/4 | 4/4 |
| Rural 3 | 3 | 4 | 3 | 92 | 17 | 7 | 8/8 | 7/8 | 6/6 | 5/5 | 3/4 | 3/3 |
| Rural 2 | 3 | 4 | 3 | 54 | 25 | 5 | 7/8 | 7/8 | 6/6 | 5/5 | 3/4 | 3/3 |
| Mean | 91.7% | 87.5% | 100% | 100% | 75% | 100% | ||||||
| Loc./Scenario | Global Addresses Detected | Random Addresses Detected | Devices Identified | Devices Identified (Only Random MACs) |
|---|---|---|---|---|
| Rural 2/screen on | 10 | 92 | 17/22 | 8/12 |
| Rural 2/screen off | 8 | 97 | 14/22 | 8/12 |
| Rural 2/screen on + screen off | 10 | 188 | 16/22 | 9/13 |
| Mean | 71.2 % | 67.5 % | ||
| Group/Loc | Global Addresses Detected | Random Addresses Detected | Devices Identified | Devices Identified (Only Random MACs) |
|---|---|---|---|---|
| Group 1/1 | 8 | 63 | 13/13 | 6/6 |
| Group 2/1 | 9 | 11 | 12/13 | 3/4 |
| Group 3/1 | 9 | 10 | 12/12 | 4/5 |
| Groups 1,3/2,3 | 18 | 54 | 24/26 | 7/8 |
| Groups 2,3/2,3 | 19 | 47 | 25/26 | 6/7 |
| Groups 1,2/2,3 | 16 | 57 | 22/25 | 7/9 |
| All devices/3 | 20 | 105 | 27/32 | 9/12 |
| Mean | 91.3 % | 83 % | ||
| Start of Hourly Interval | All PRs/ Unique PRs | Global Addresses Detected | Random Addresses Detected | Devices Identified |
|---|---|---|---|---|
| 00:00:00 | 18,980/5637 | 82 | 3112 | 124 |
| 01:00:00 | 16,531/4448 | 59 | 2055 | 91 |
| 02:00:00 | 14,895/3985 | 37 | 1657 | 61 |
| 03:00:00 | 13,973/3115 | 28 | 802 | 50 |
| 04:00:00 | 13,174/2655 | 24 | 598 | 50 |
| 05:00:00 | 13,700/2716 | 32 | 609 | 57 |
| 06:00:00 | 17,736/3902 | 50 | 1688 | 86 |
| 07:00:00 | 21,342/6141 | 124 | 3044 | 181 |
| 08:00:00 | 29,980/10,918 | 166 | 8121 | 232 |
| 09:00:00 | 48,273/21,079 | 237 | 17,606 | 385 |
| 10:00:00 | 46,029/21,150 | 347 | 17,225 | 485 |
| 11:00:00 | 76,586/38,601 | 520 | 32,869 | 793 |
| 12:00:00 | 58,161/26,319 | 401 | 22,234 | 572 |
| 13:00:00 | 72,632/35,171 | 305 | 30,214 | 544 |
| 14:00:00 | 42,608/20,848 | 257 | 17,938 | 370 |
| 15:00:00 | 33,156/14,899 | 160 | 12,673 | 231 |
| 16:00:00 | 54,233/25,086 | 405 | 20,621 | 556 |
| 17:00:00 | 59,599/28,587 | 356 | 23,853 | 547 |
| 18:00:00 | 74,070/33,673 | 508 | 27,763 | 745 |
| 19:00:00 | 67,298/31,440 | 592 | 25,821 | 777 |
| 20:00:00 | 43,776/20,274 | 254 | 16,735 | 366 |
| 21:00:00 | 50,731/23,810 | 409 | 19,629 | 518 |
| 22:00:00 | 32,345/15,197 | 228 | 12,855 | 325 |
| 23:00:00 | 44,087/21,058 | 259 | 17,792 | 372 |
Disclaimer/Publisher’s Note: The statements, opinions and data contained in all publications are solely those of the individual author(s) and contributor(s) and not of MDPI and/or the editor(s). MDPI and/or the editor(s) disclaim responsibility for any injury to people or property resulting from any ideas, methods, instructions or products referred to in the content. |
© 2023 by the authors. Licensee MDPI, Basel, Switzerland. This article is an open access article distributed under the terms and conditions of the Creative Commons Attribution (CC BY) license (https://creativecommons.org/licenses/by/4.0/).
Share and Cite
Simončič, A.; Mohorčič, M.; Mohorčič, M.; Hrovat, A. Non-Intrusive Privacy-Preserving Approach for Presence Monitoring Based on WiFi Probe Requests. Sensors 2023, 23, 2588. https://doi.org/10.3390/s23052588
Simončič A, Mohorčič M, Mohorčič M, Hrovat A. Non-Intrusive Privacy-Preserving Approach for Presence Monitoring Based on WiFi Probe Requests. Sensors. 2023; 23(5):2588. https://doi.org/10.3390/s23052588
Chicago/Turabian StyleSimončič, Aleš, Miha Mohorčič, Mihael Mohorčič, and Andrej Hrovat. 2023. "Non-Intrusive Privacy-Preserving Approach for Presence Monitoring Based on WiFi Probe Requests" Sensors 23, no. 5: 2588. https://doi.org/10.3390/s23052588