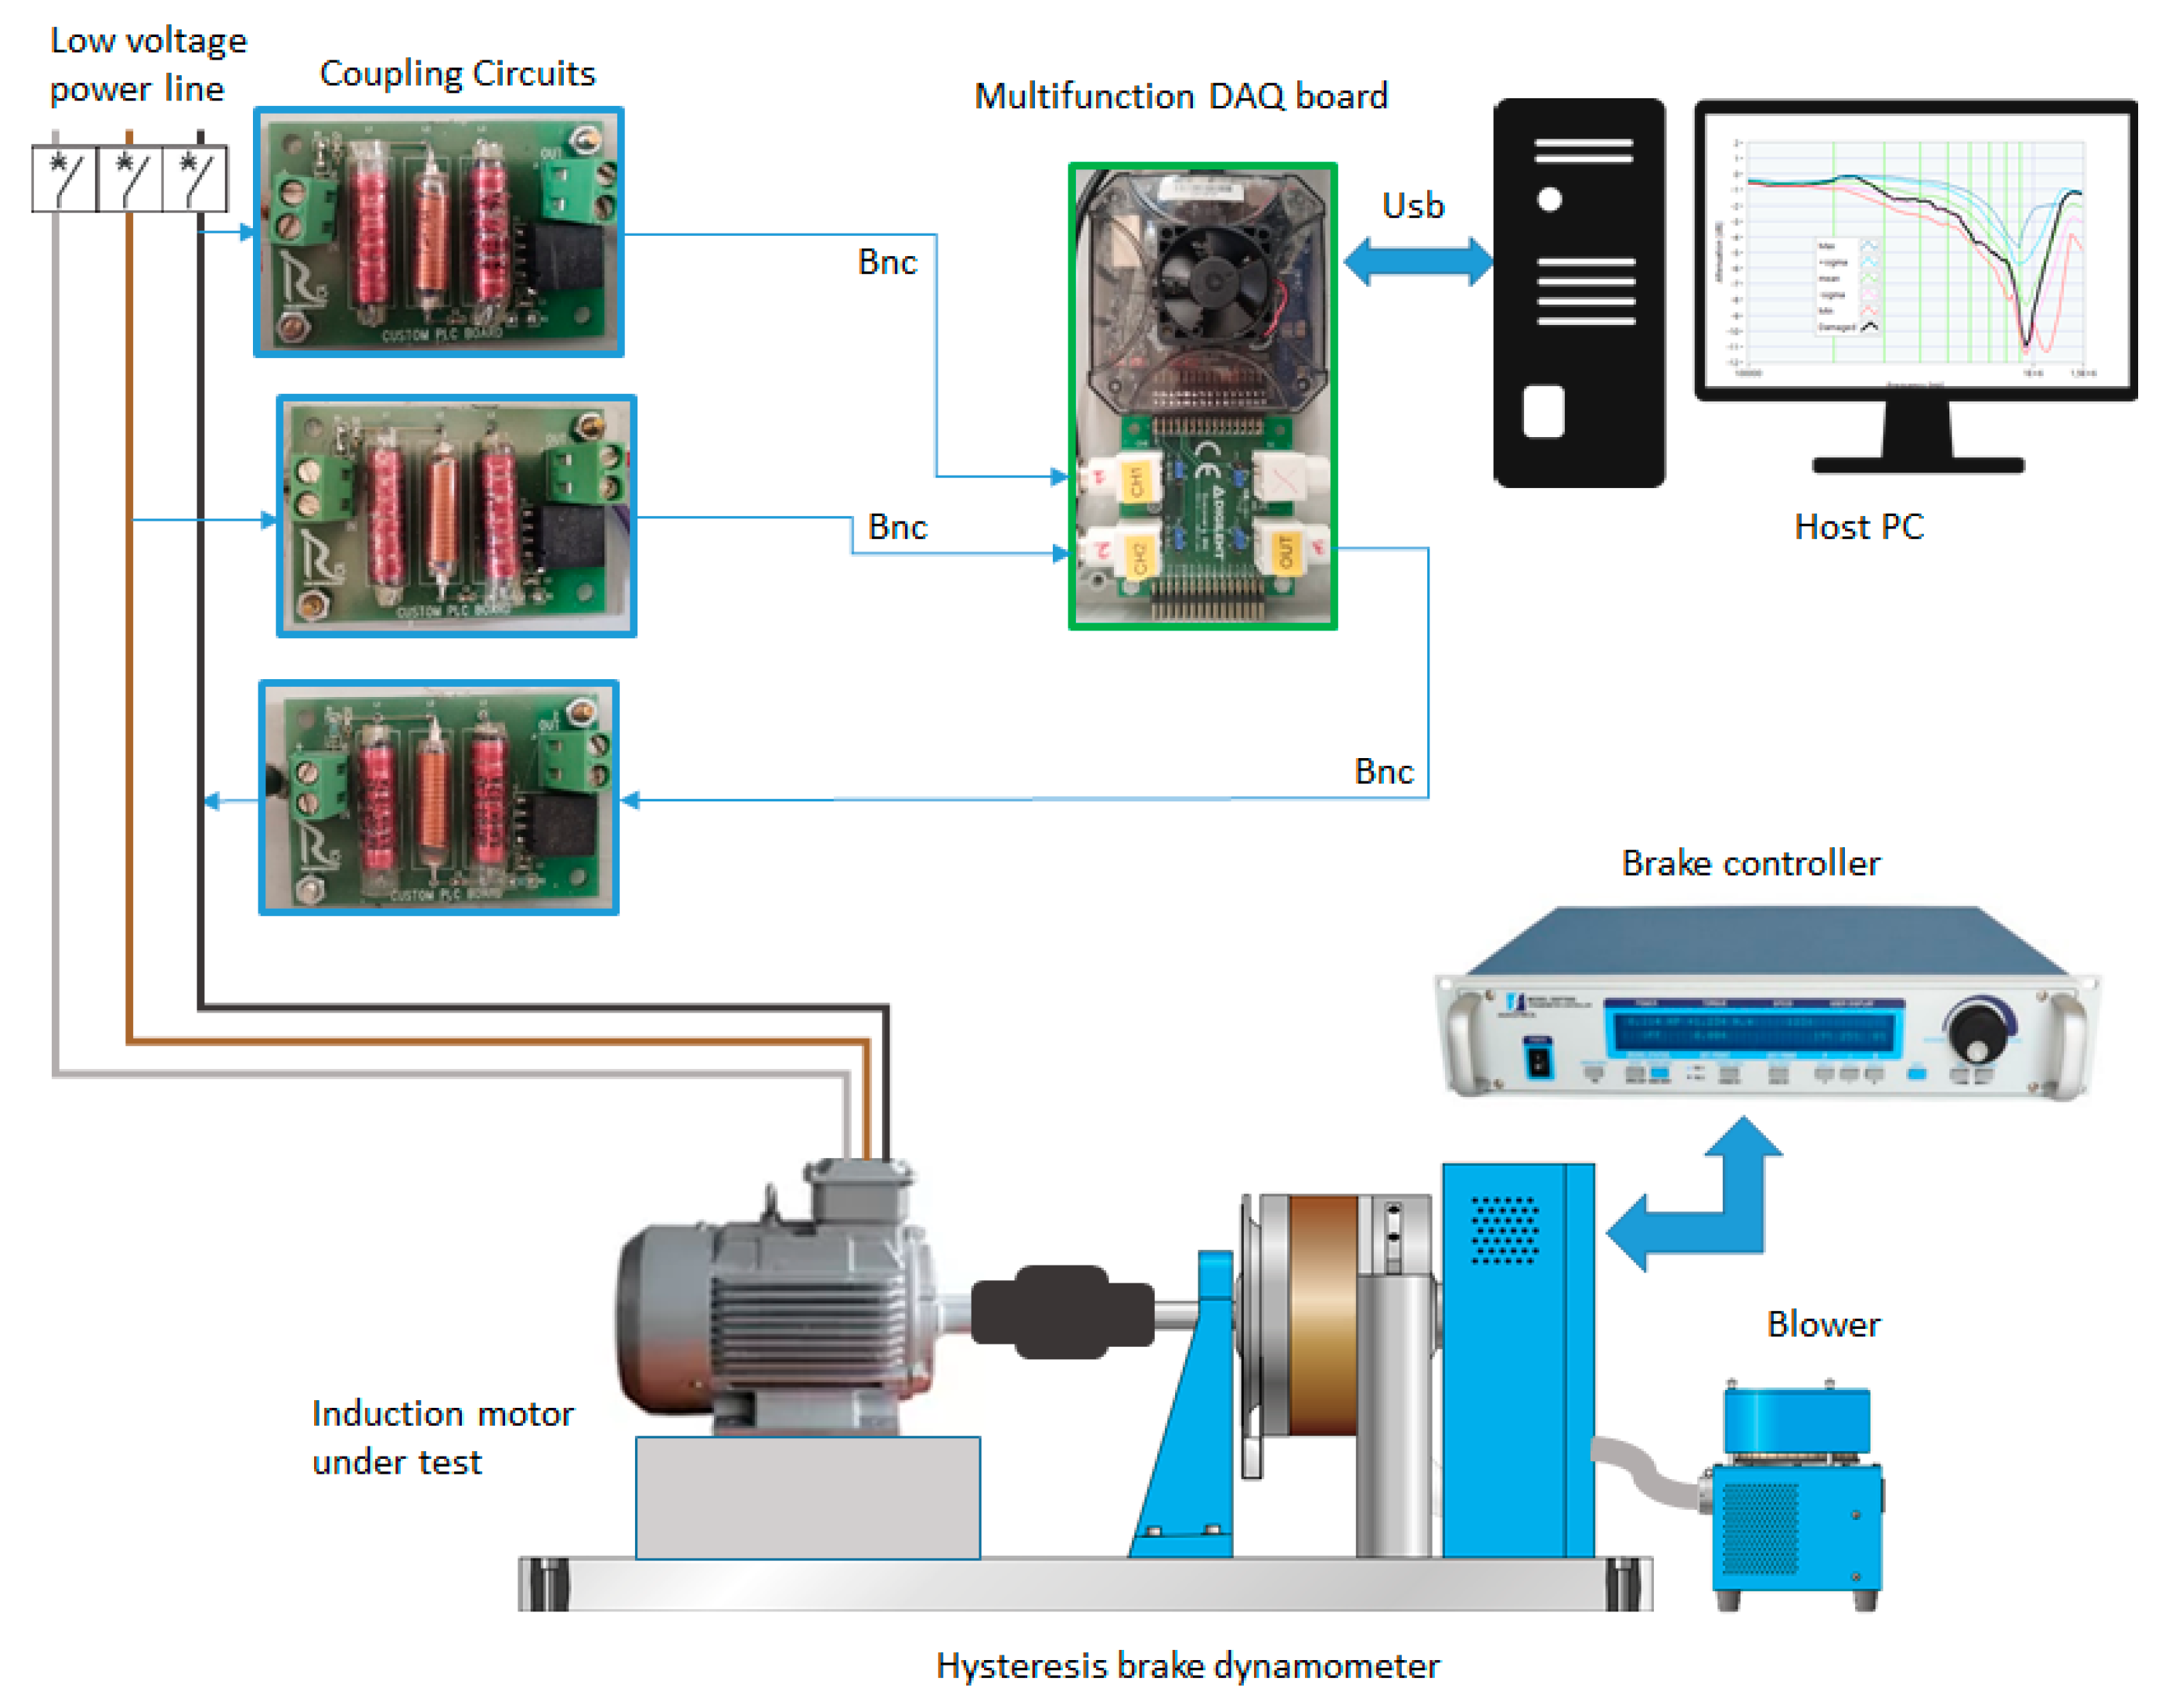
Figure 1.
Block diagram of the experimental setup.
Figure 1.
Block diagram of the experimental setup.
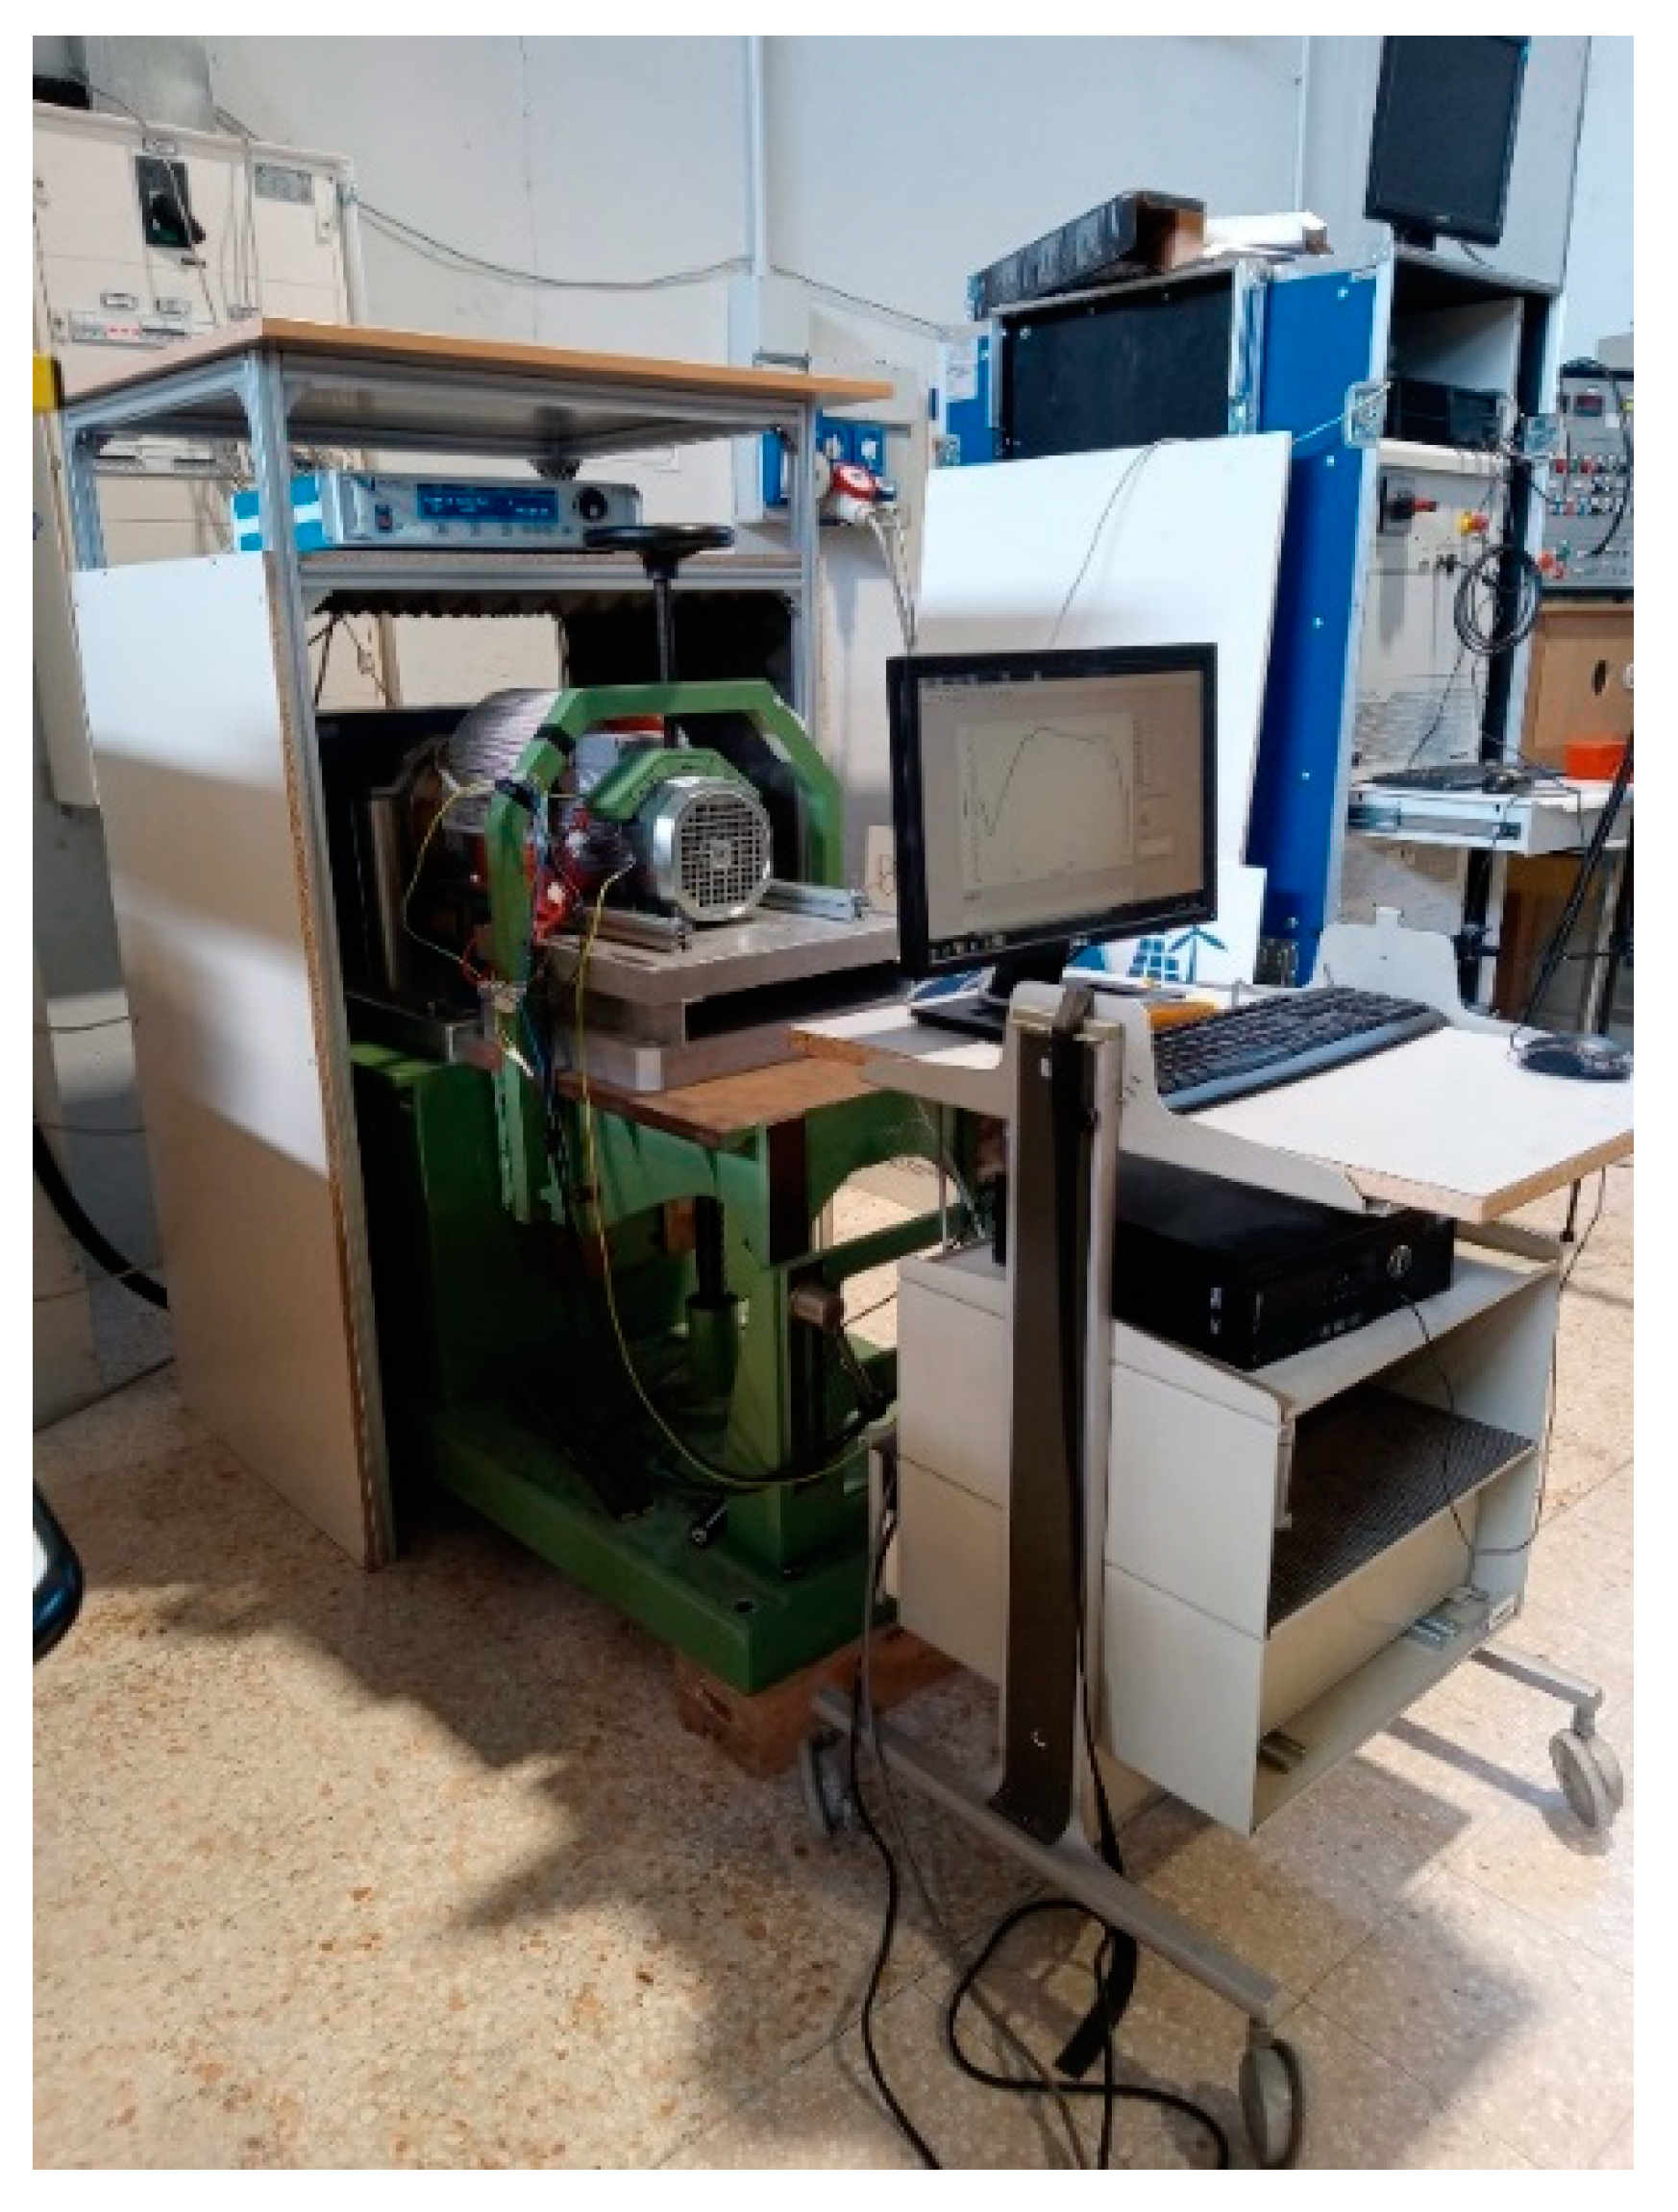
Figure 2.
The testing bench.
Figure 2.
The testing bench.
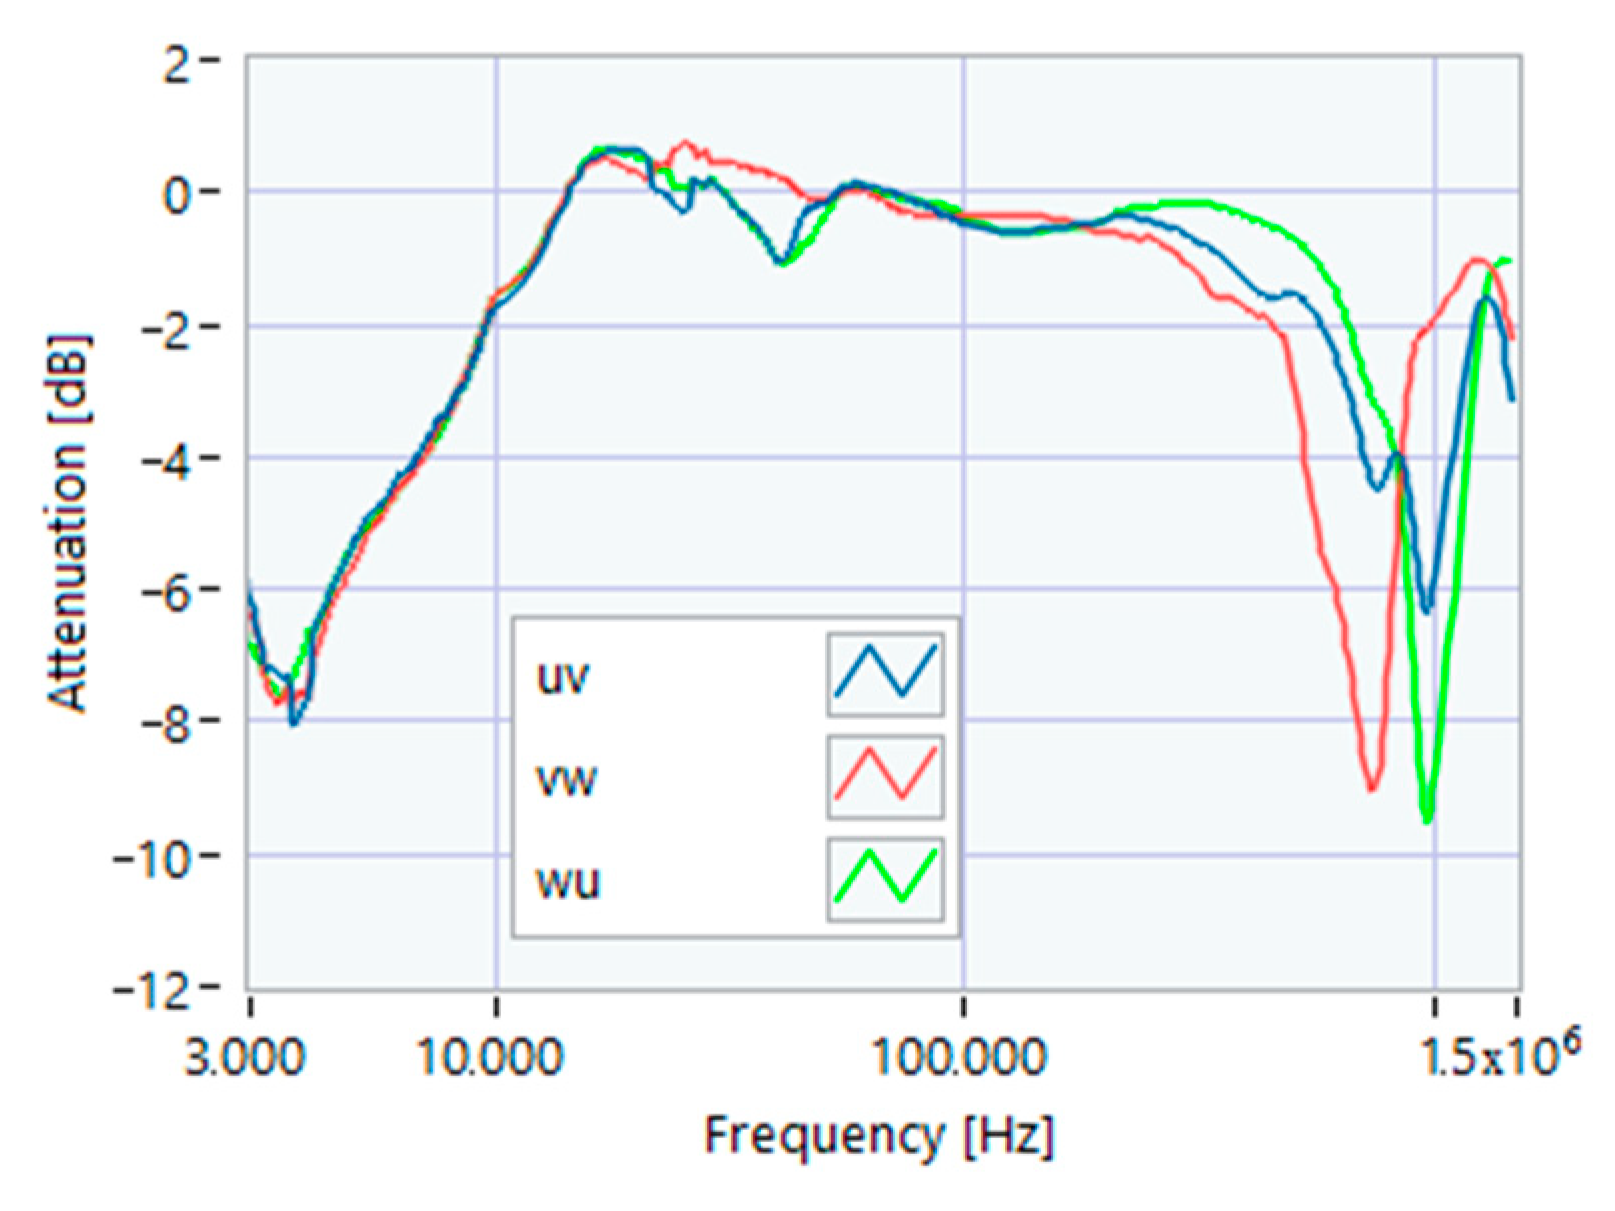
Figure 3.
SFRA online TF of the supply system only, measured on line-to-line terminals.
Figure 3.
SFRA online TF of the supply system only, measured on line-to-line terminals.
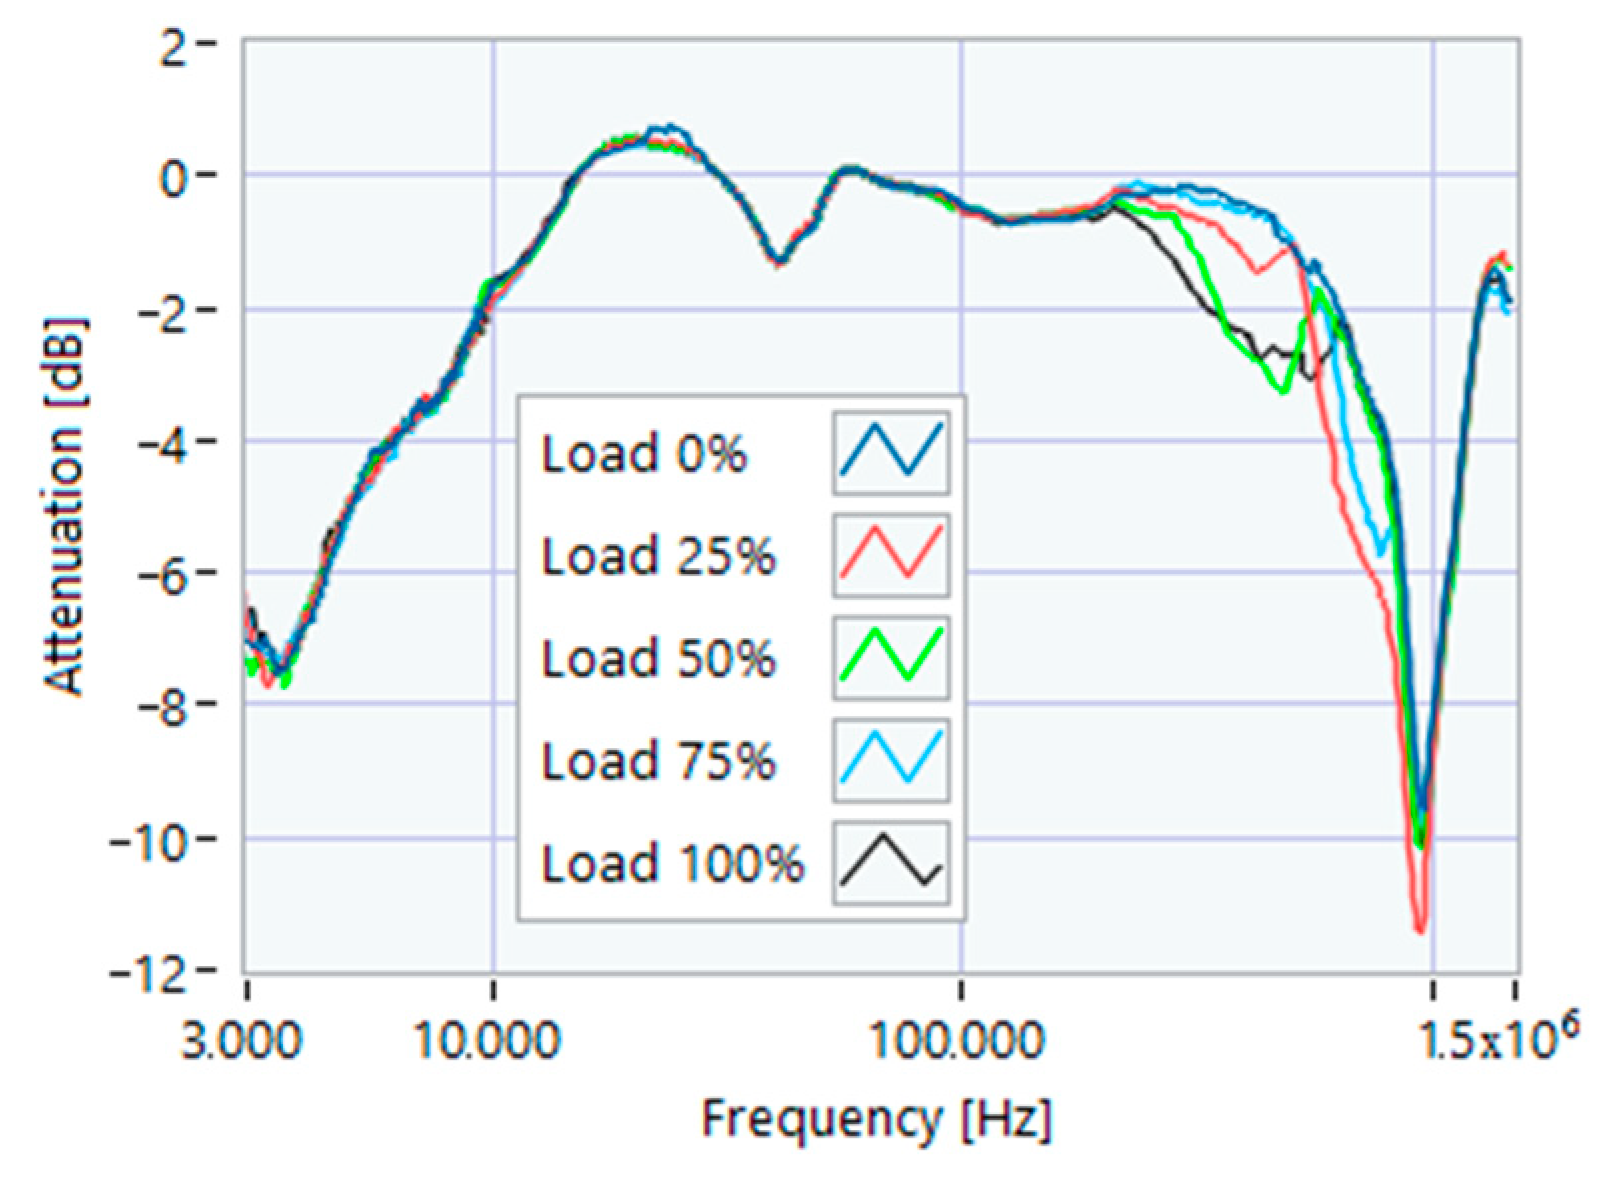
Figure 4.
SFRA online motor 1 at various load percentages after 1 h of full load service.
Figure 4.
SFRA online motor 1 at various load percentages after 1 h of full load service.
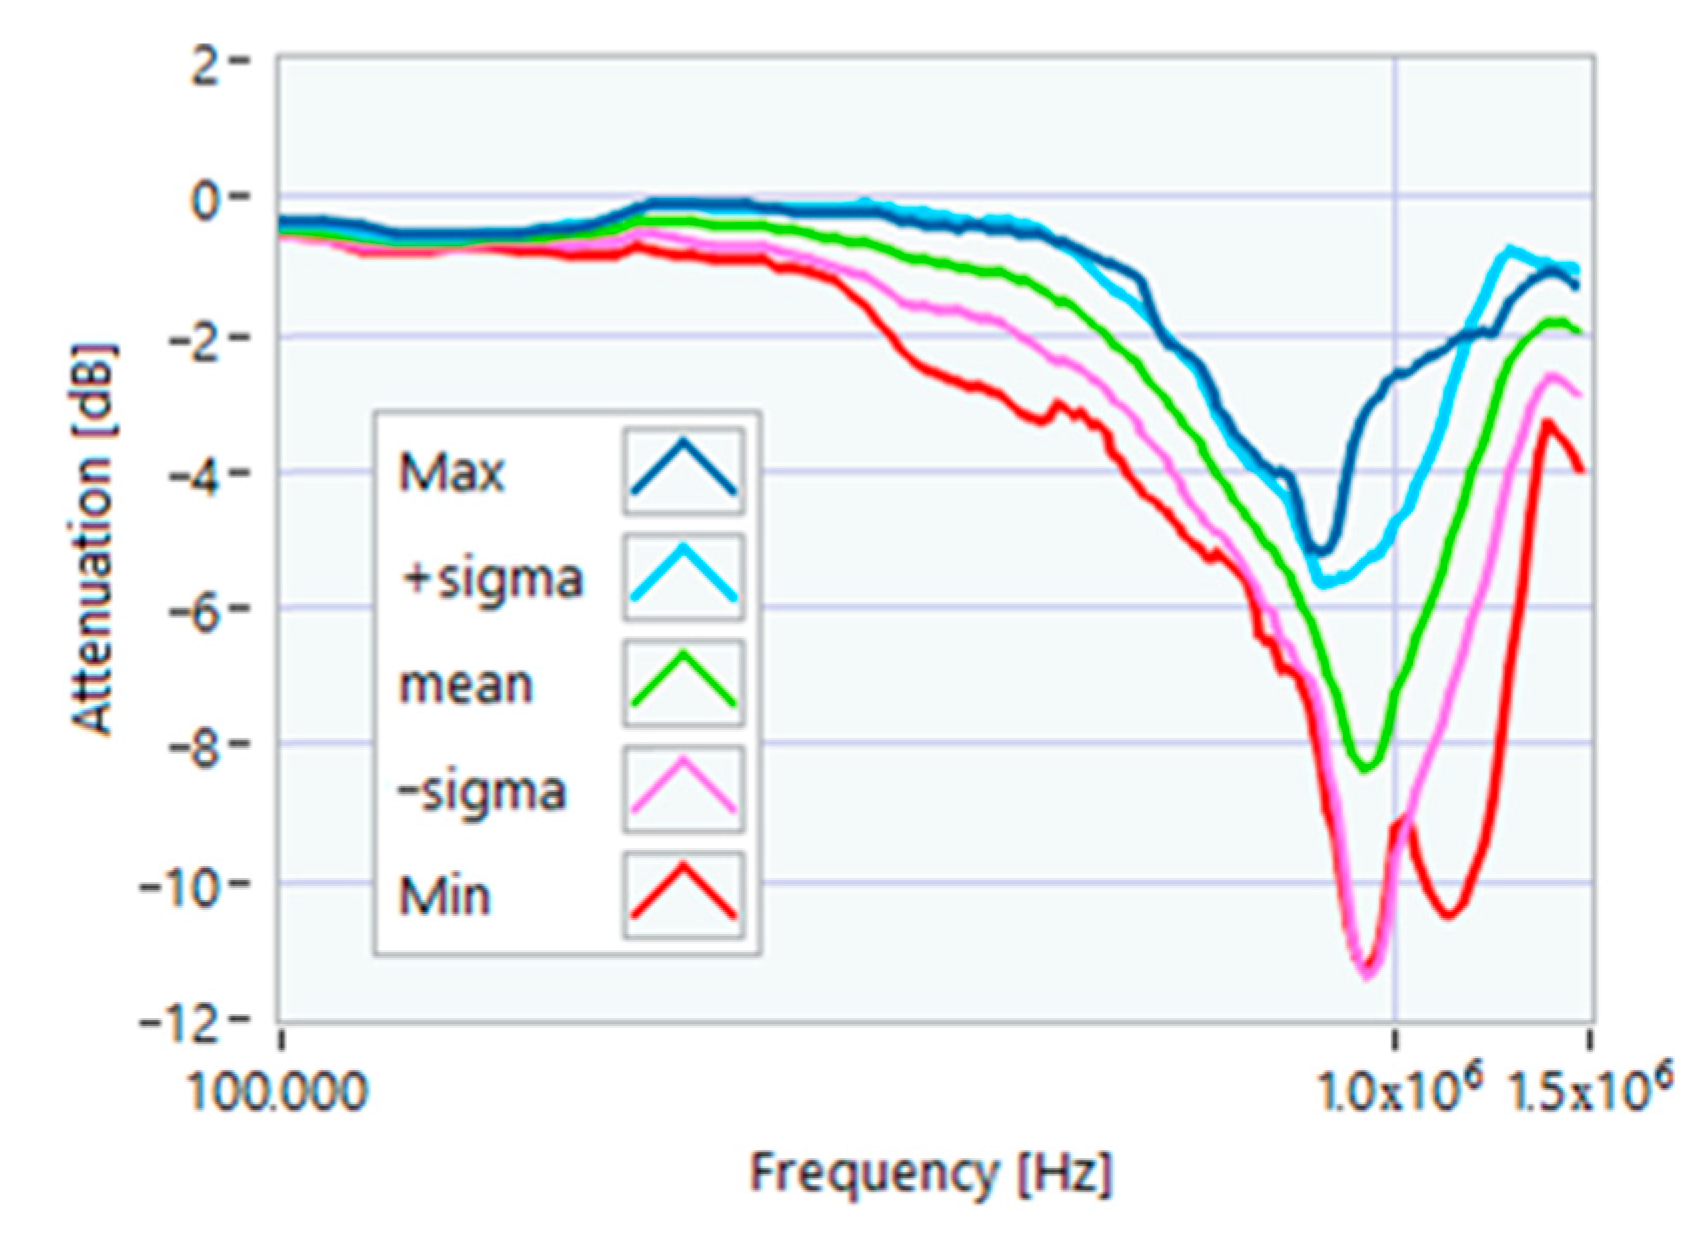
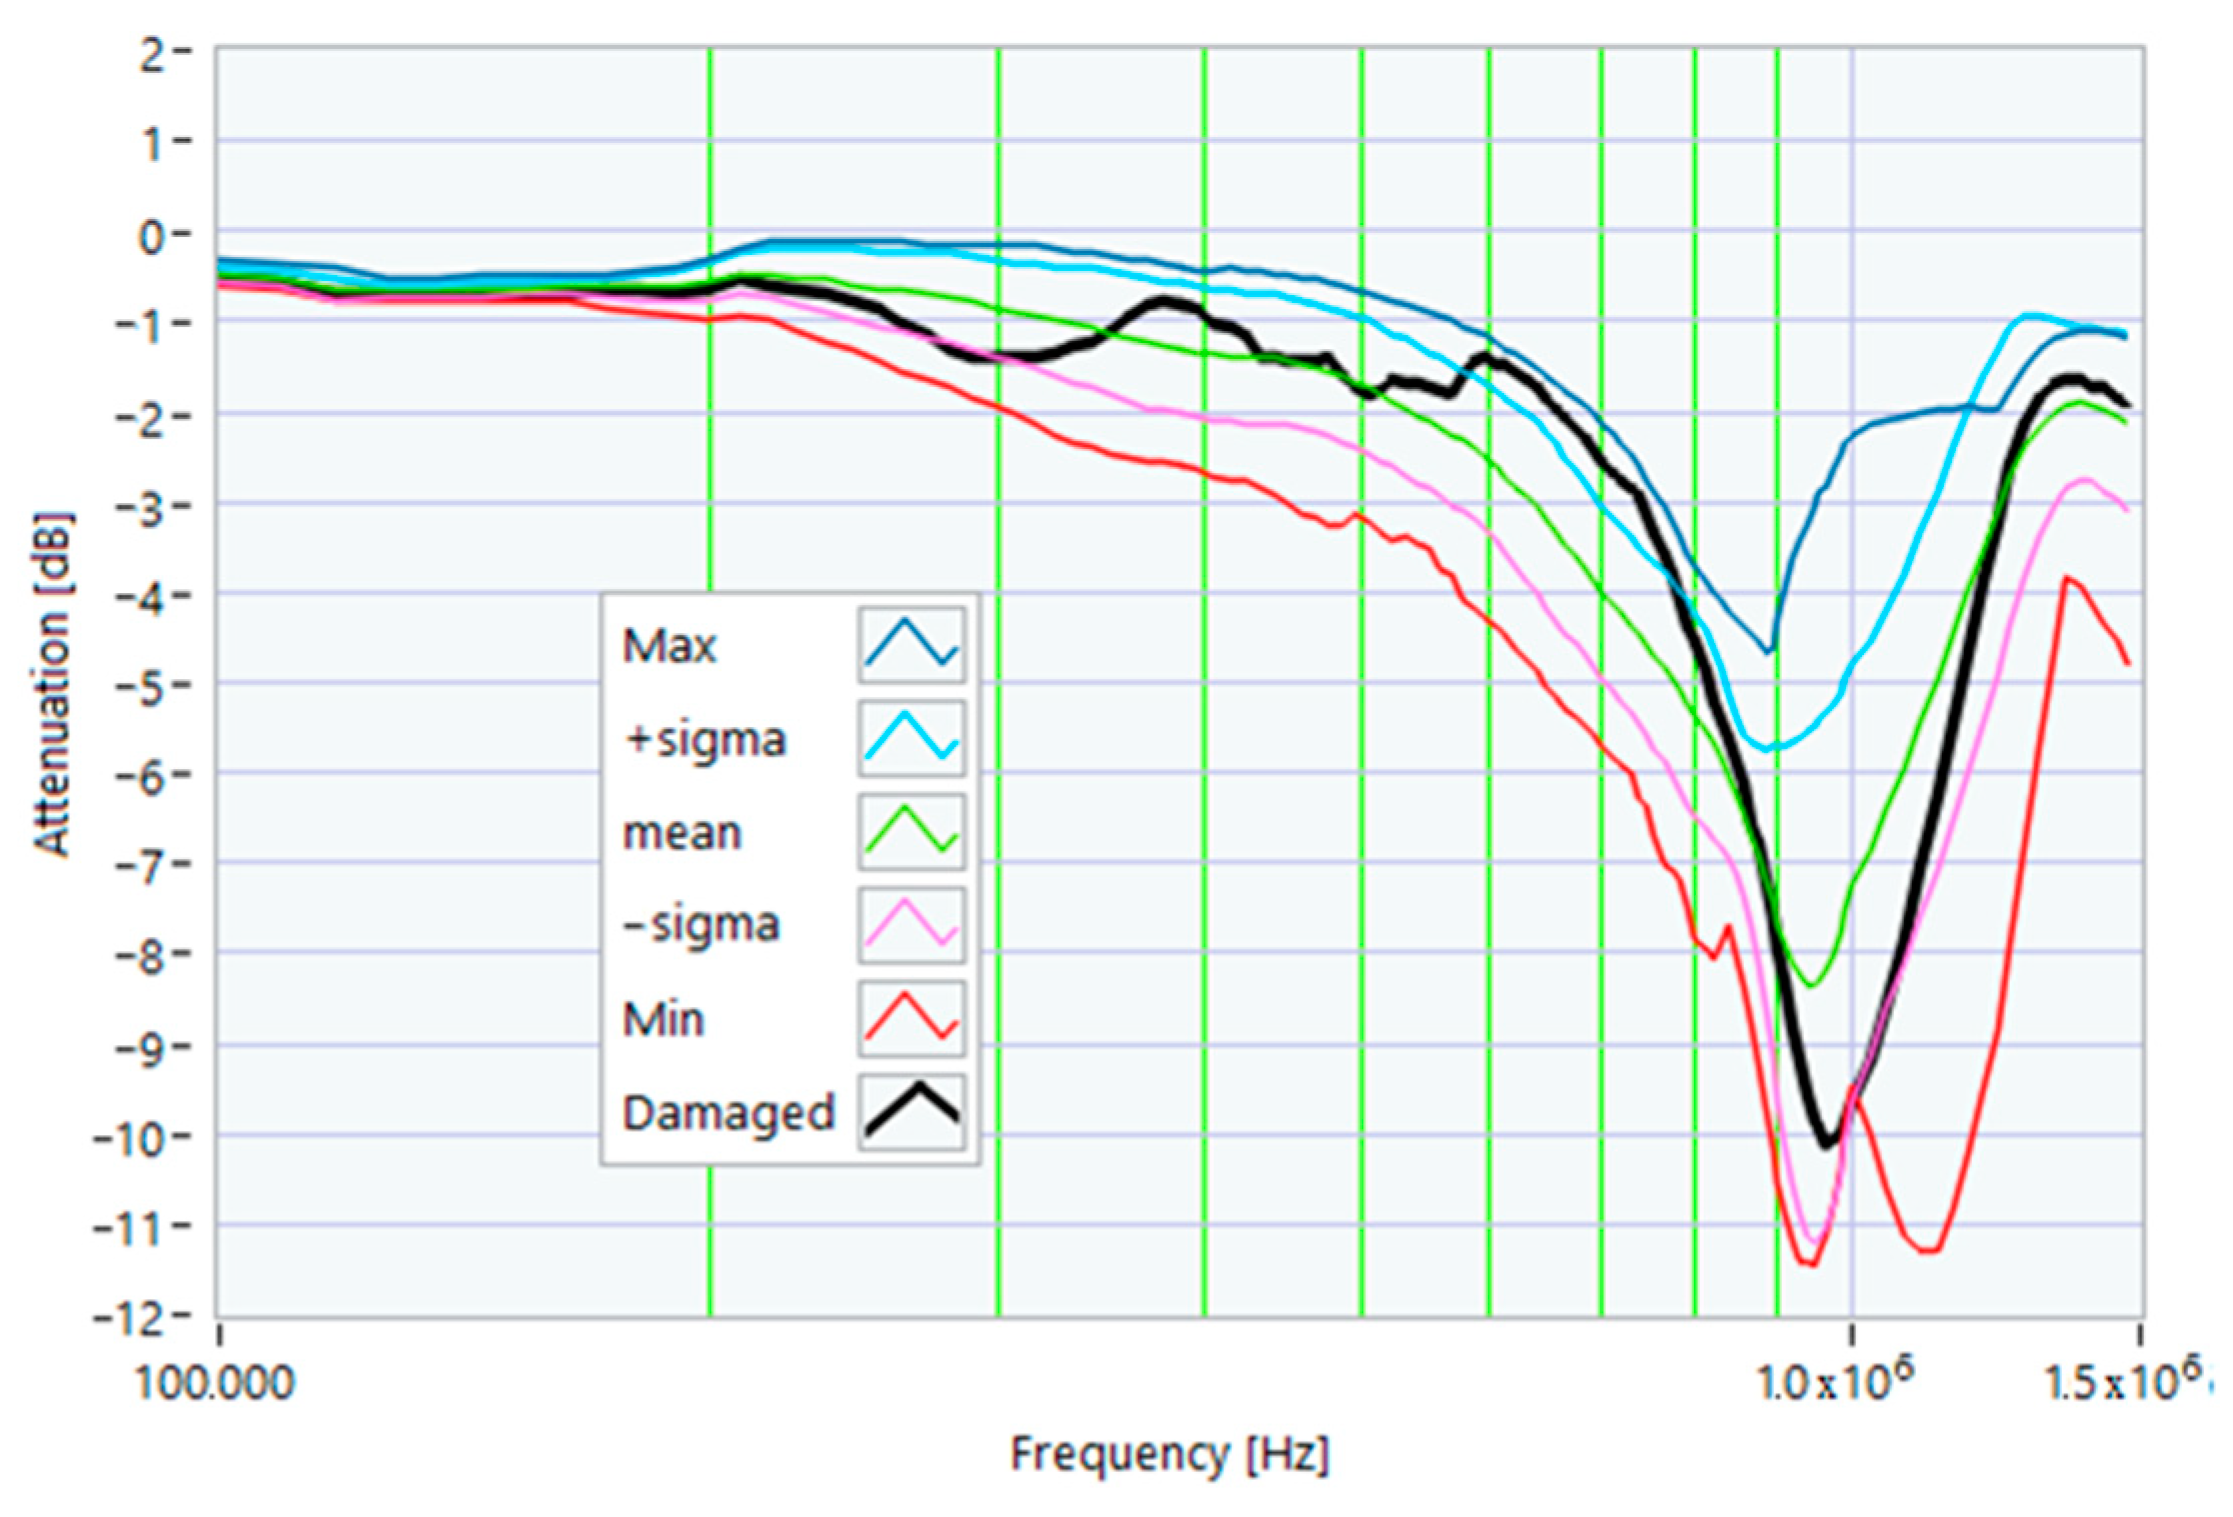
Figure 5.
Reference TF processed at 0% load.
Figure 5.
Reference TF processed at 0% load.
Figure 6.
Reference TF processed at 25% load.
Figure 6.
Reference TF processed at 25% load.
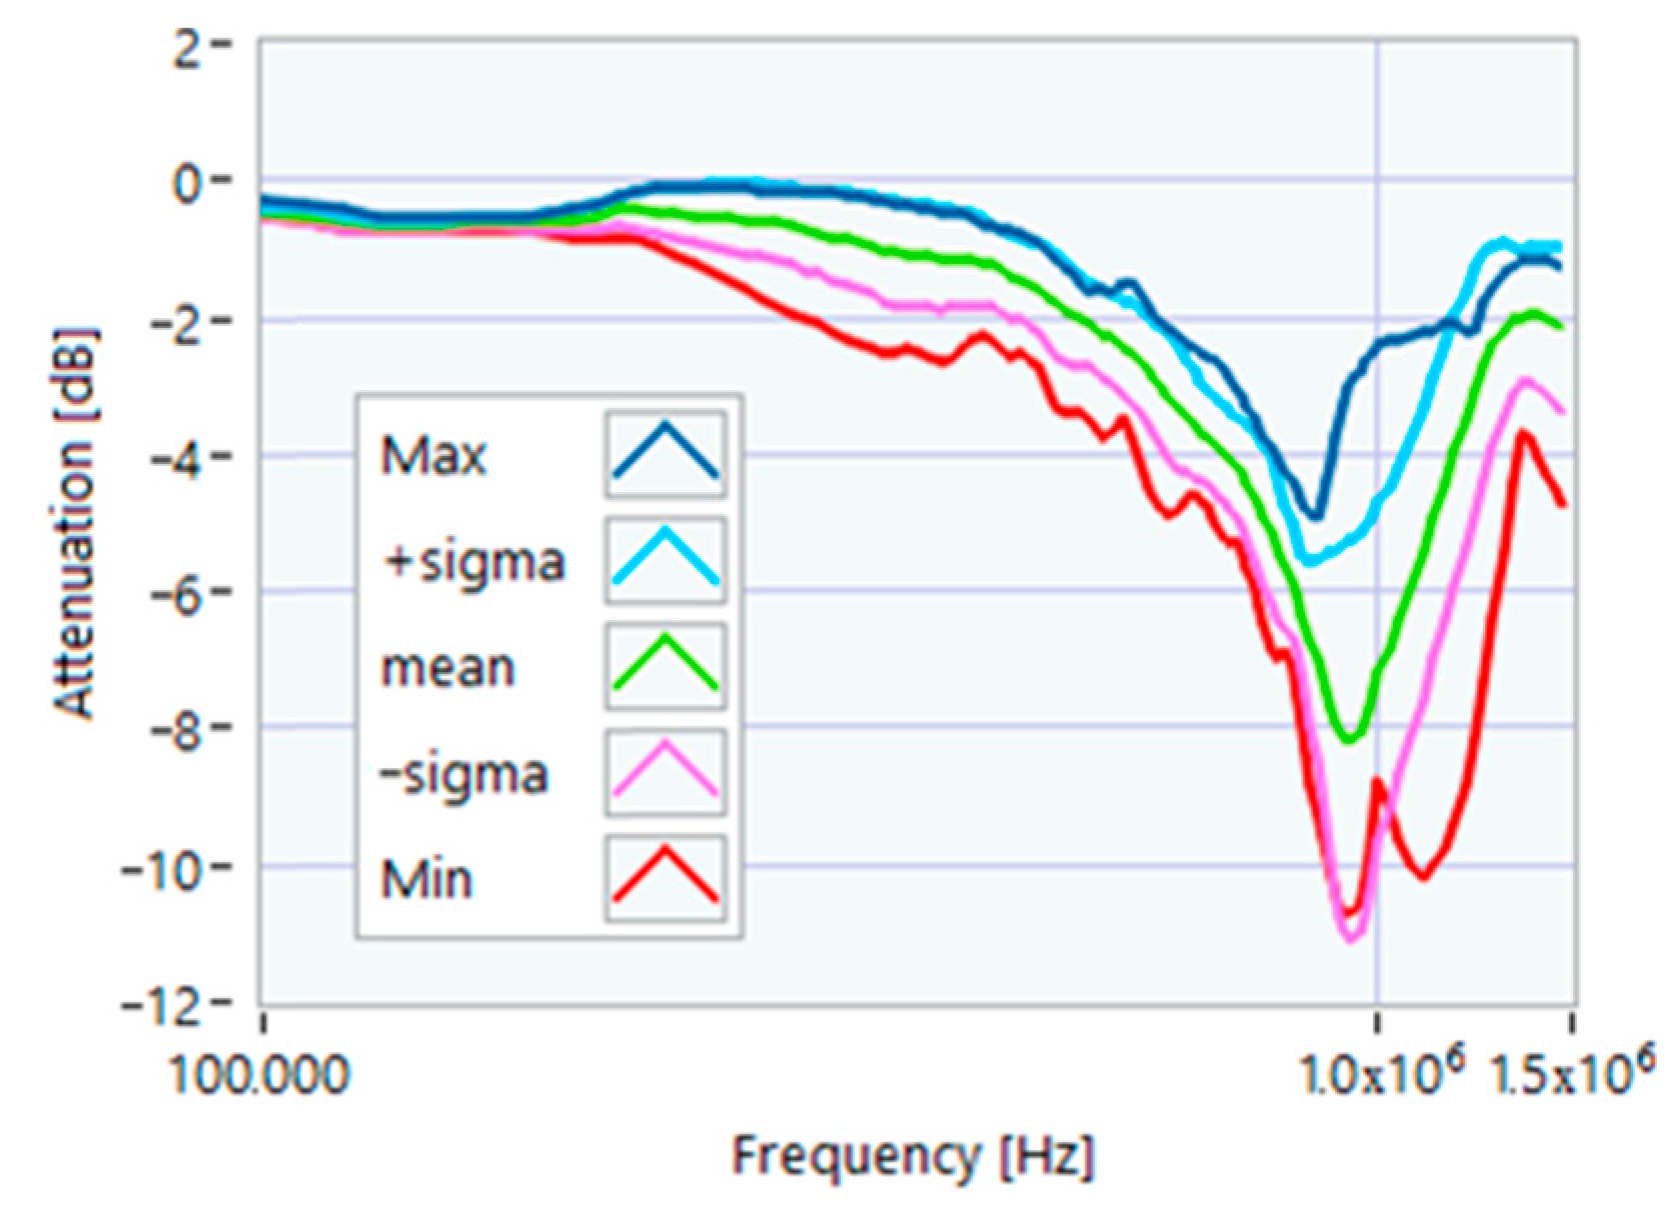
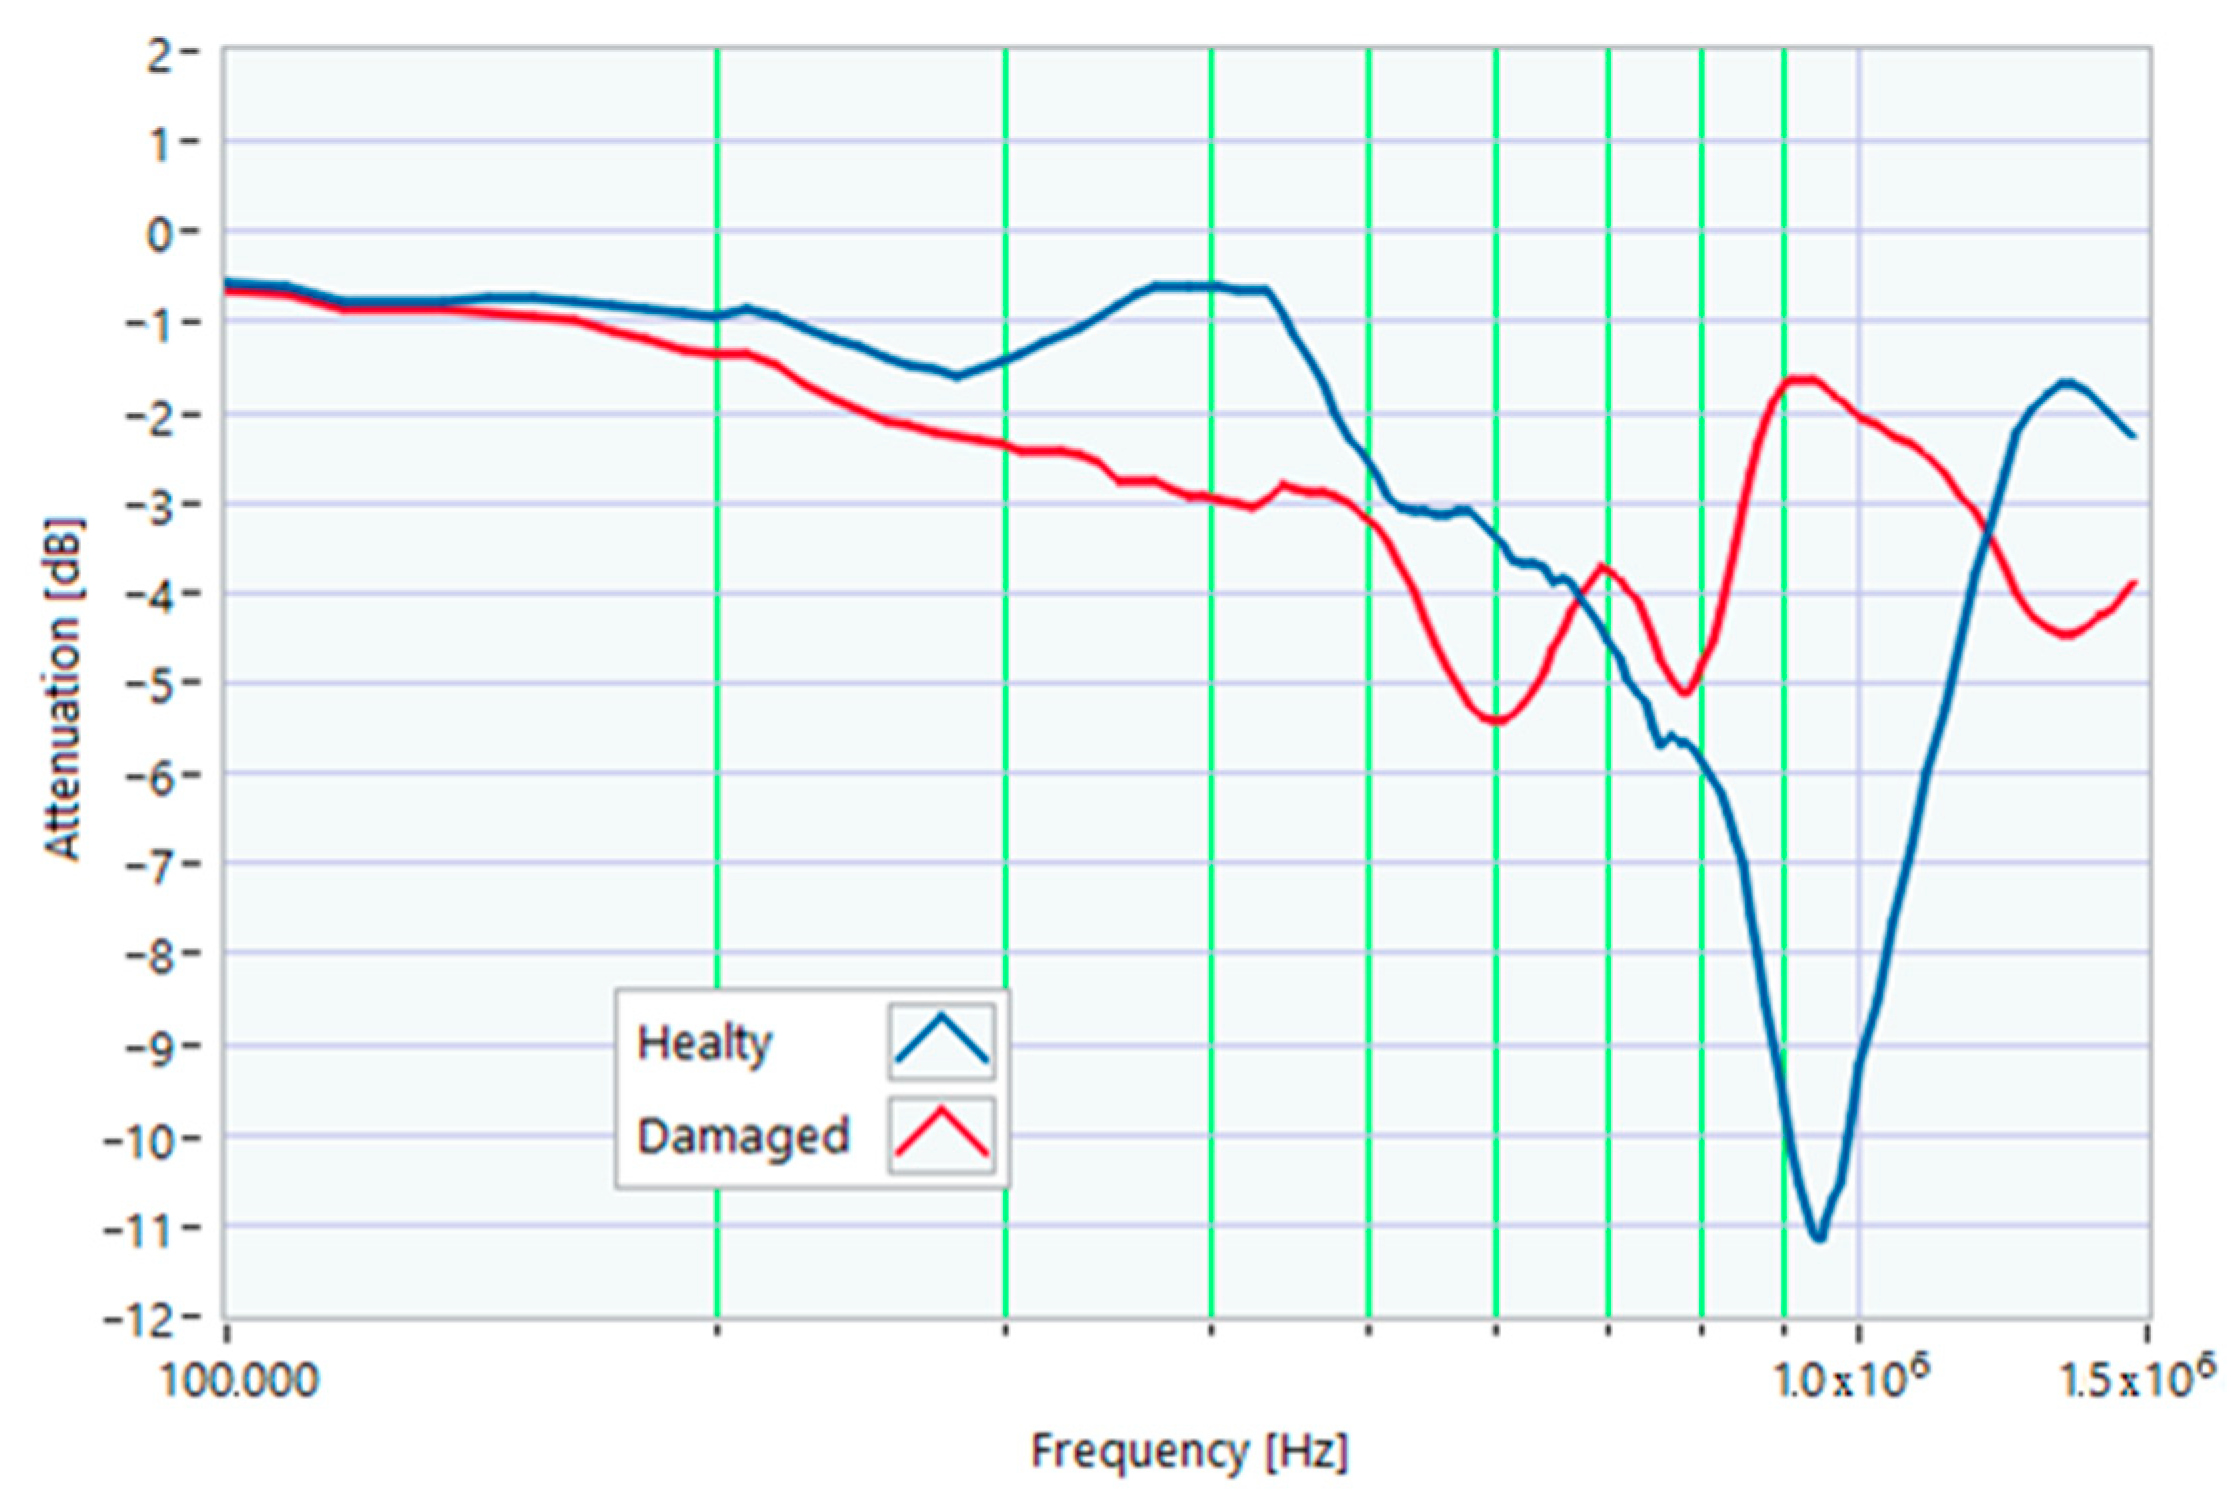
Figure 7.
Reference TF processed at 50% load.
Figure 7.
Reference TF processed at 50% load.
Figure 8.
Reference TF processed at 75% load.
Figure 8.
Reference TF processed at 75% load.
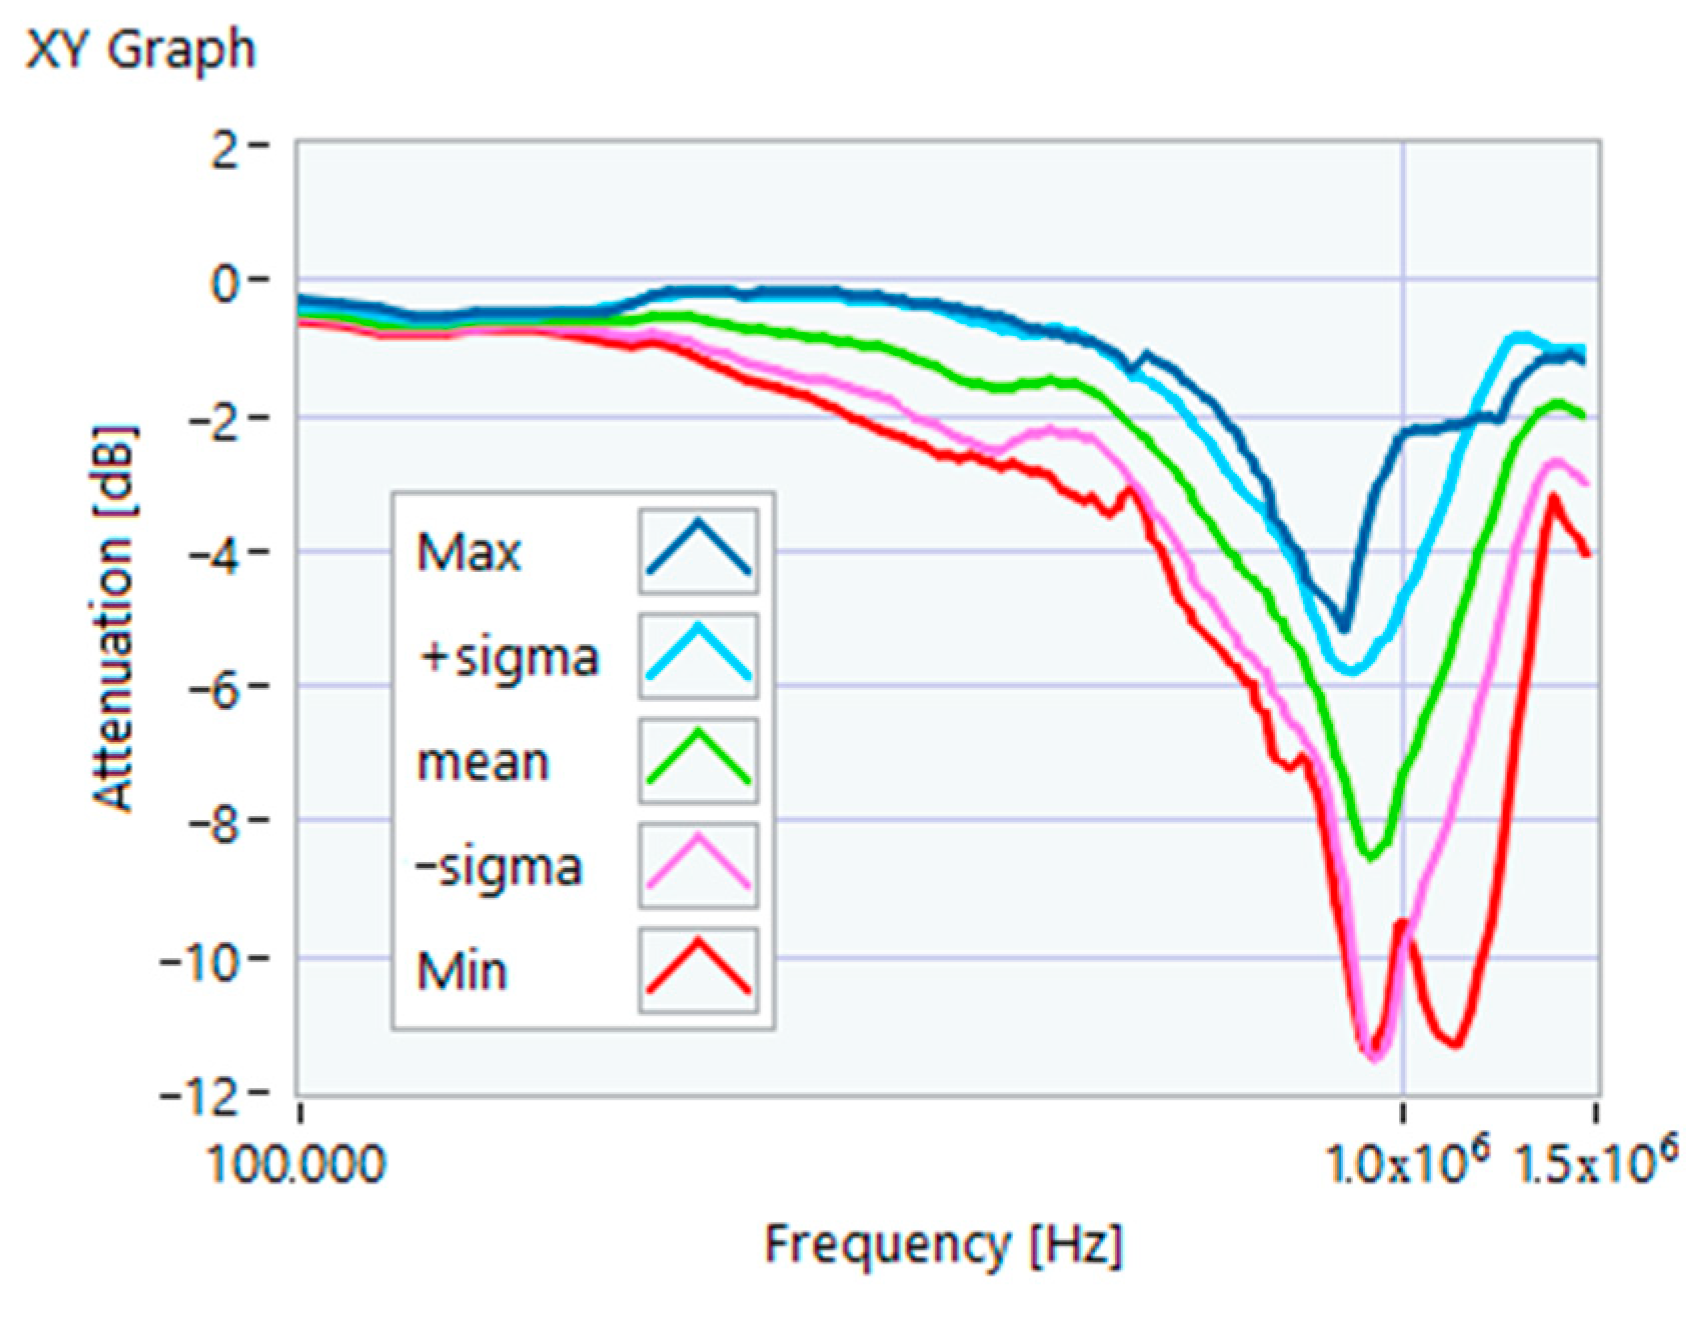
Figure 9.
Reference TF processed at 100% load.
Figure 9.
Reference TF processed at 100% load.
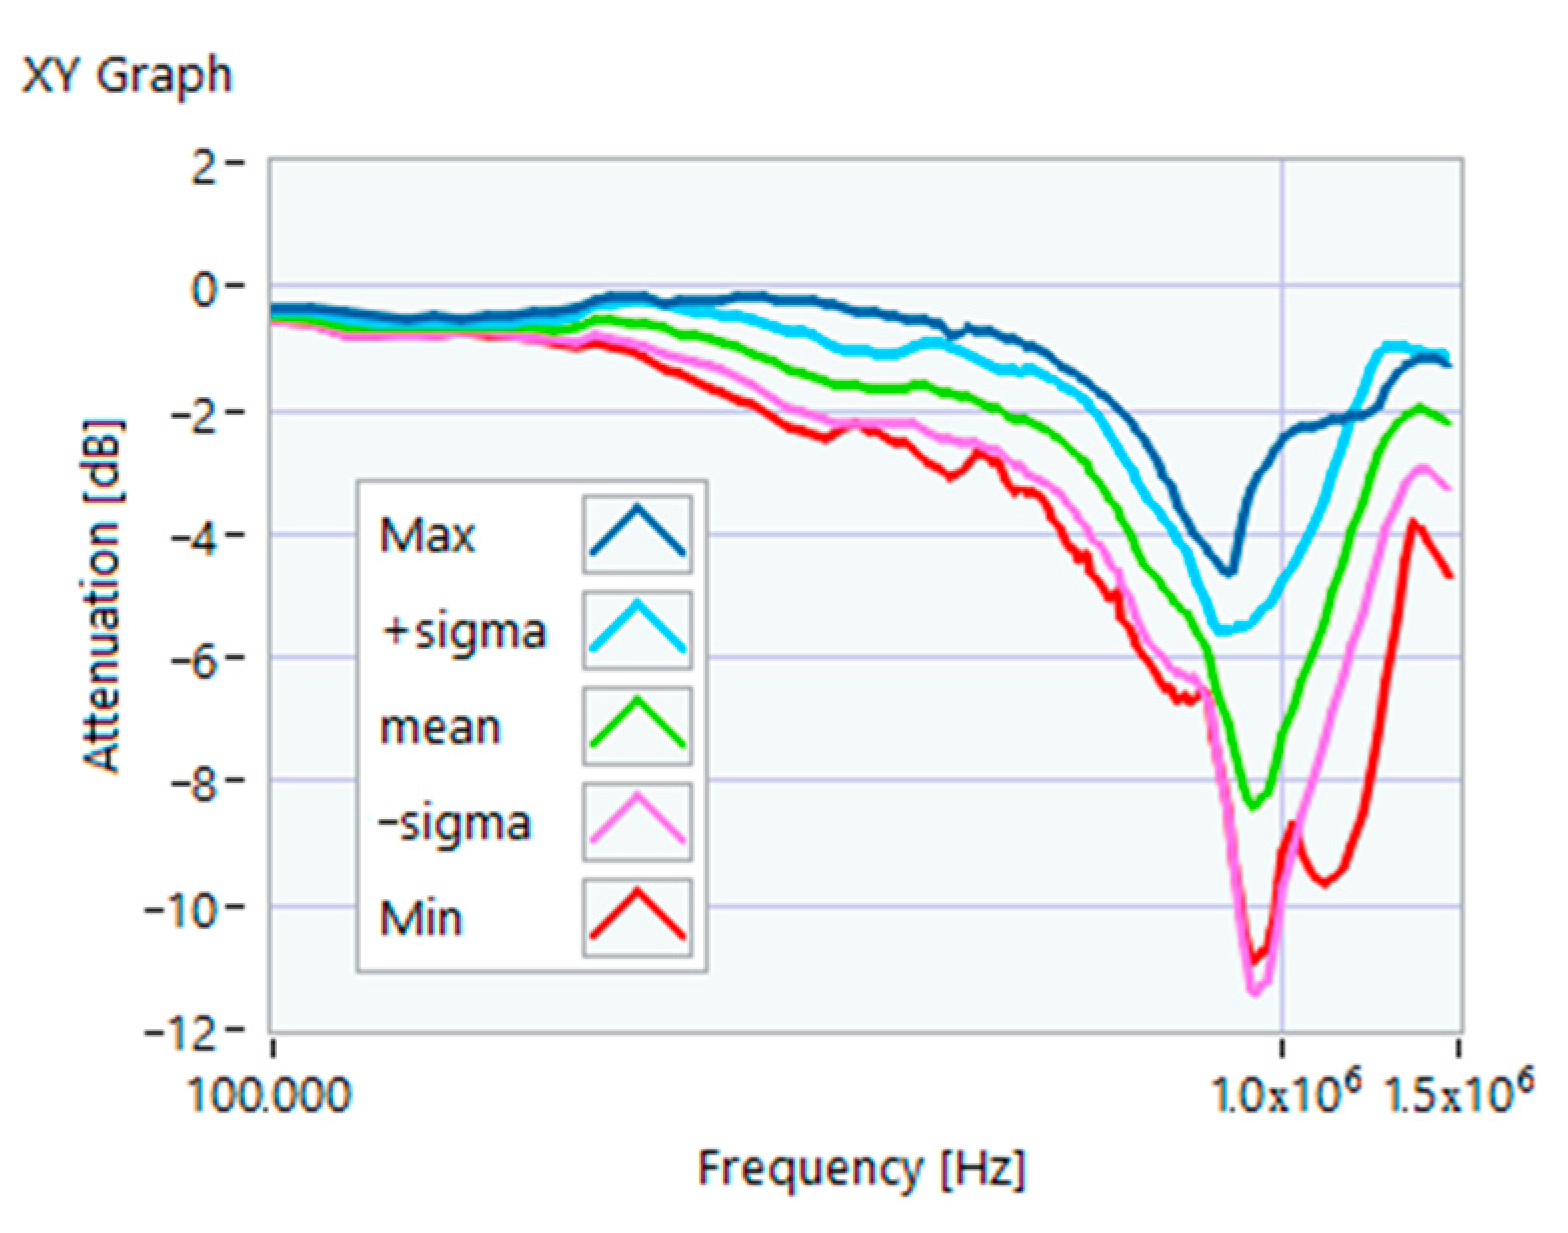
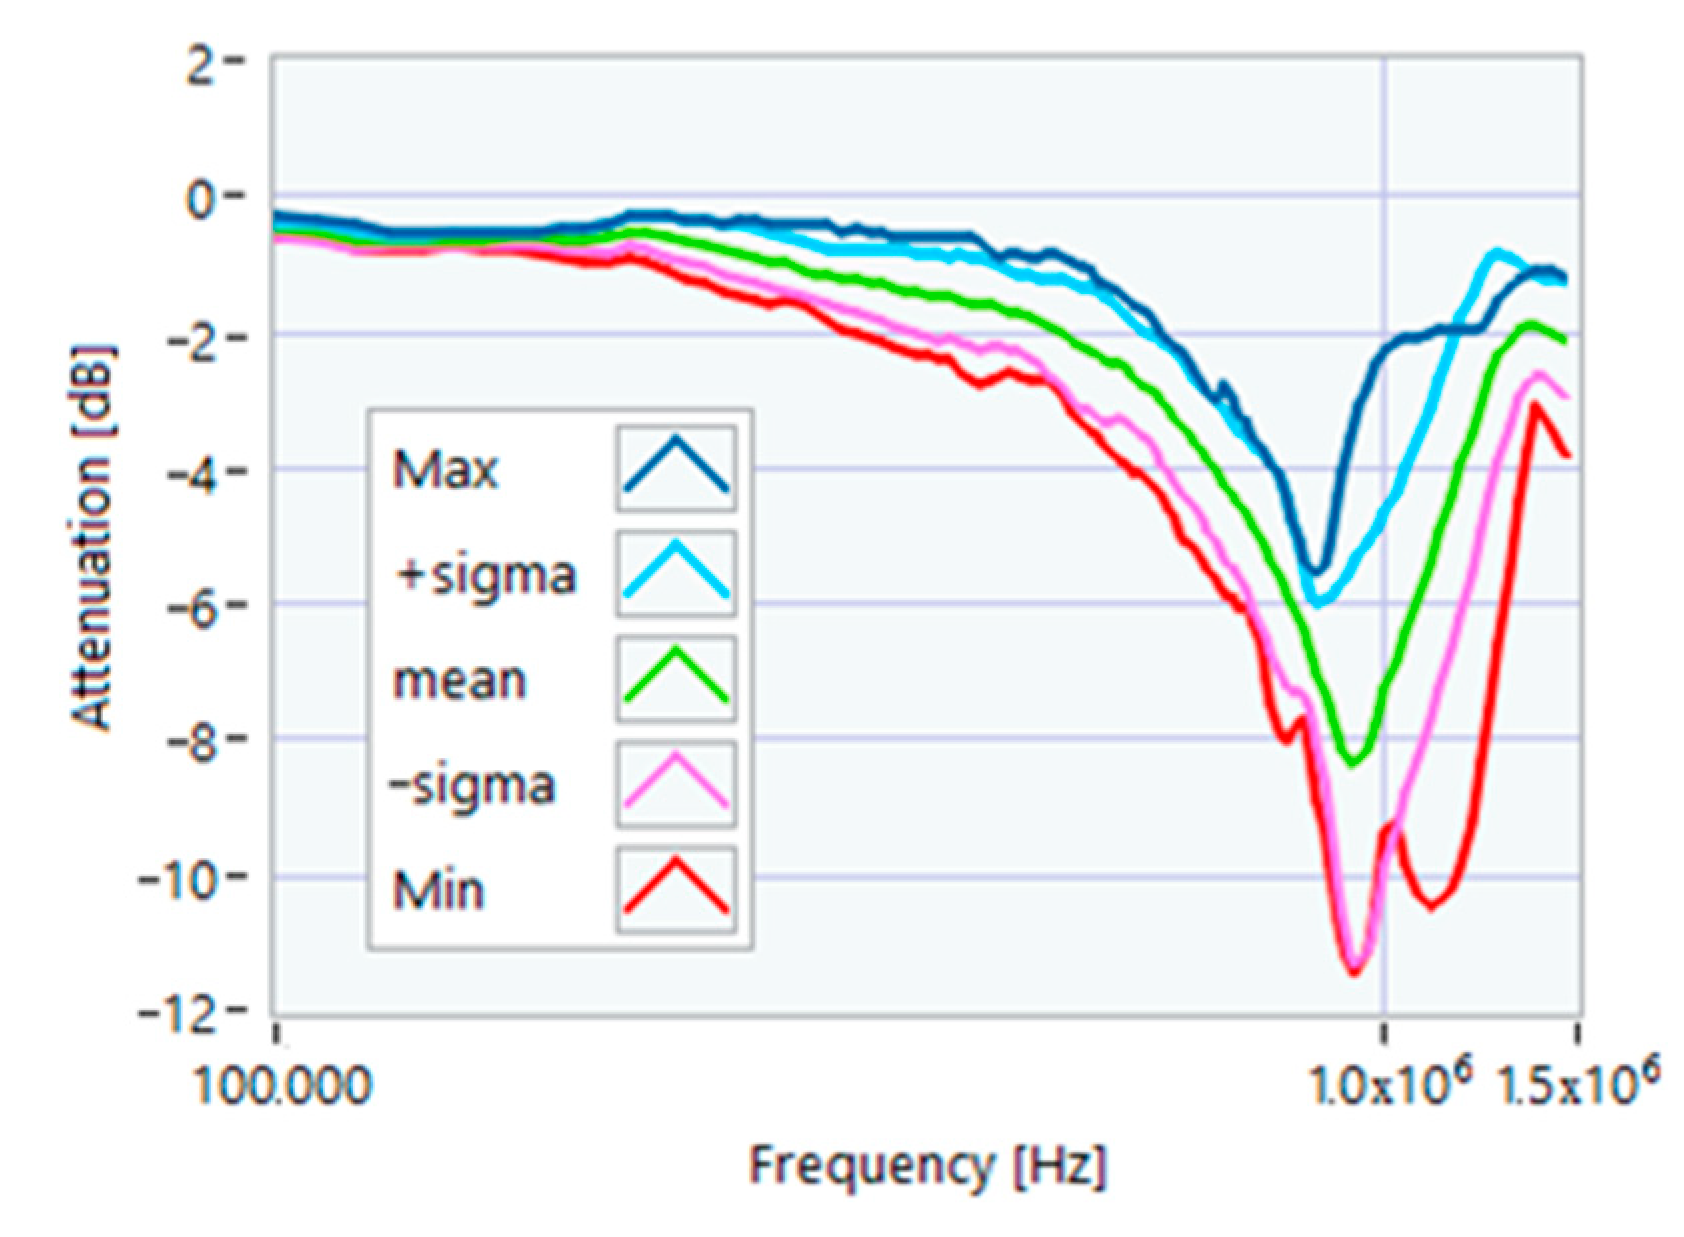
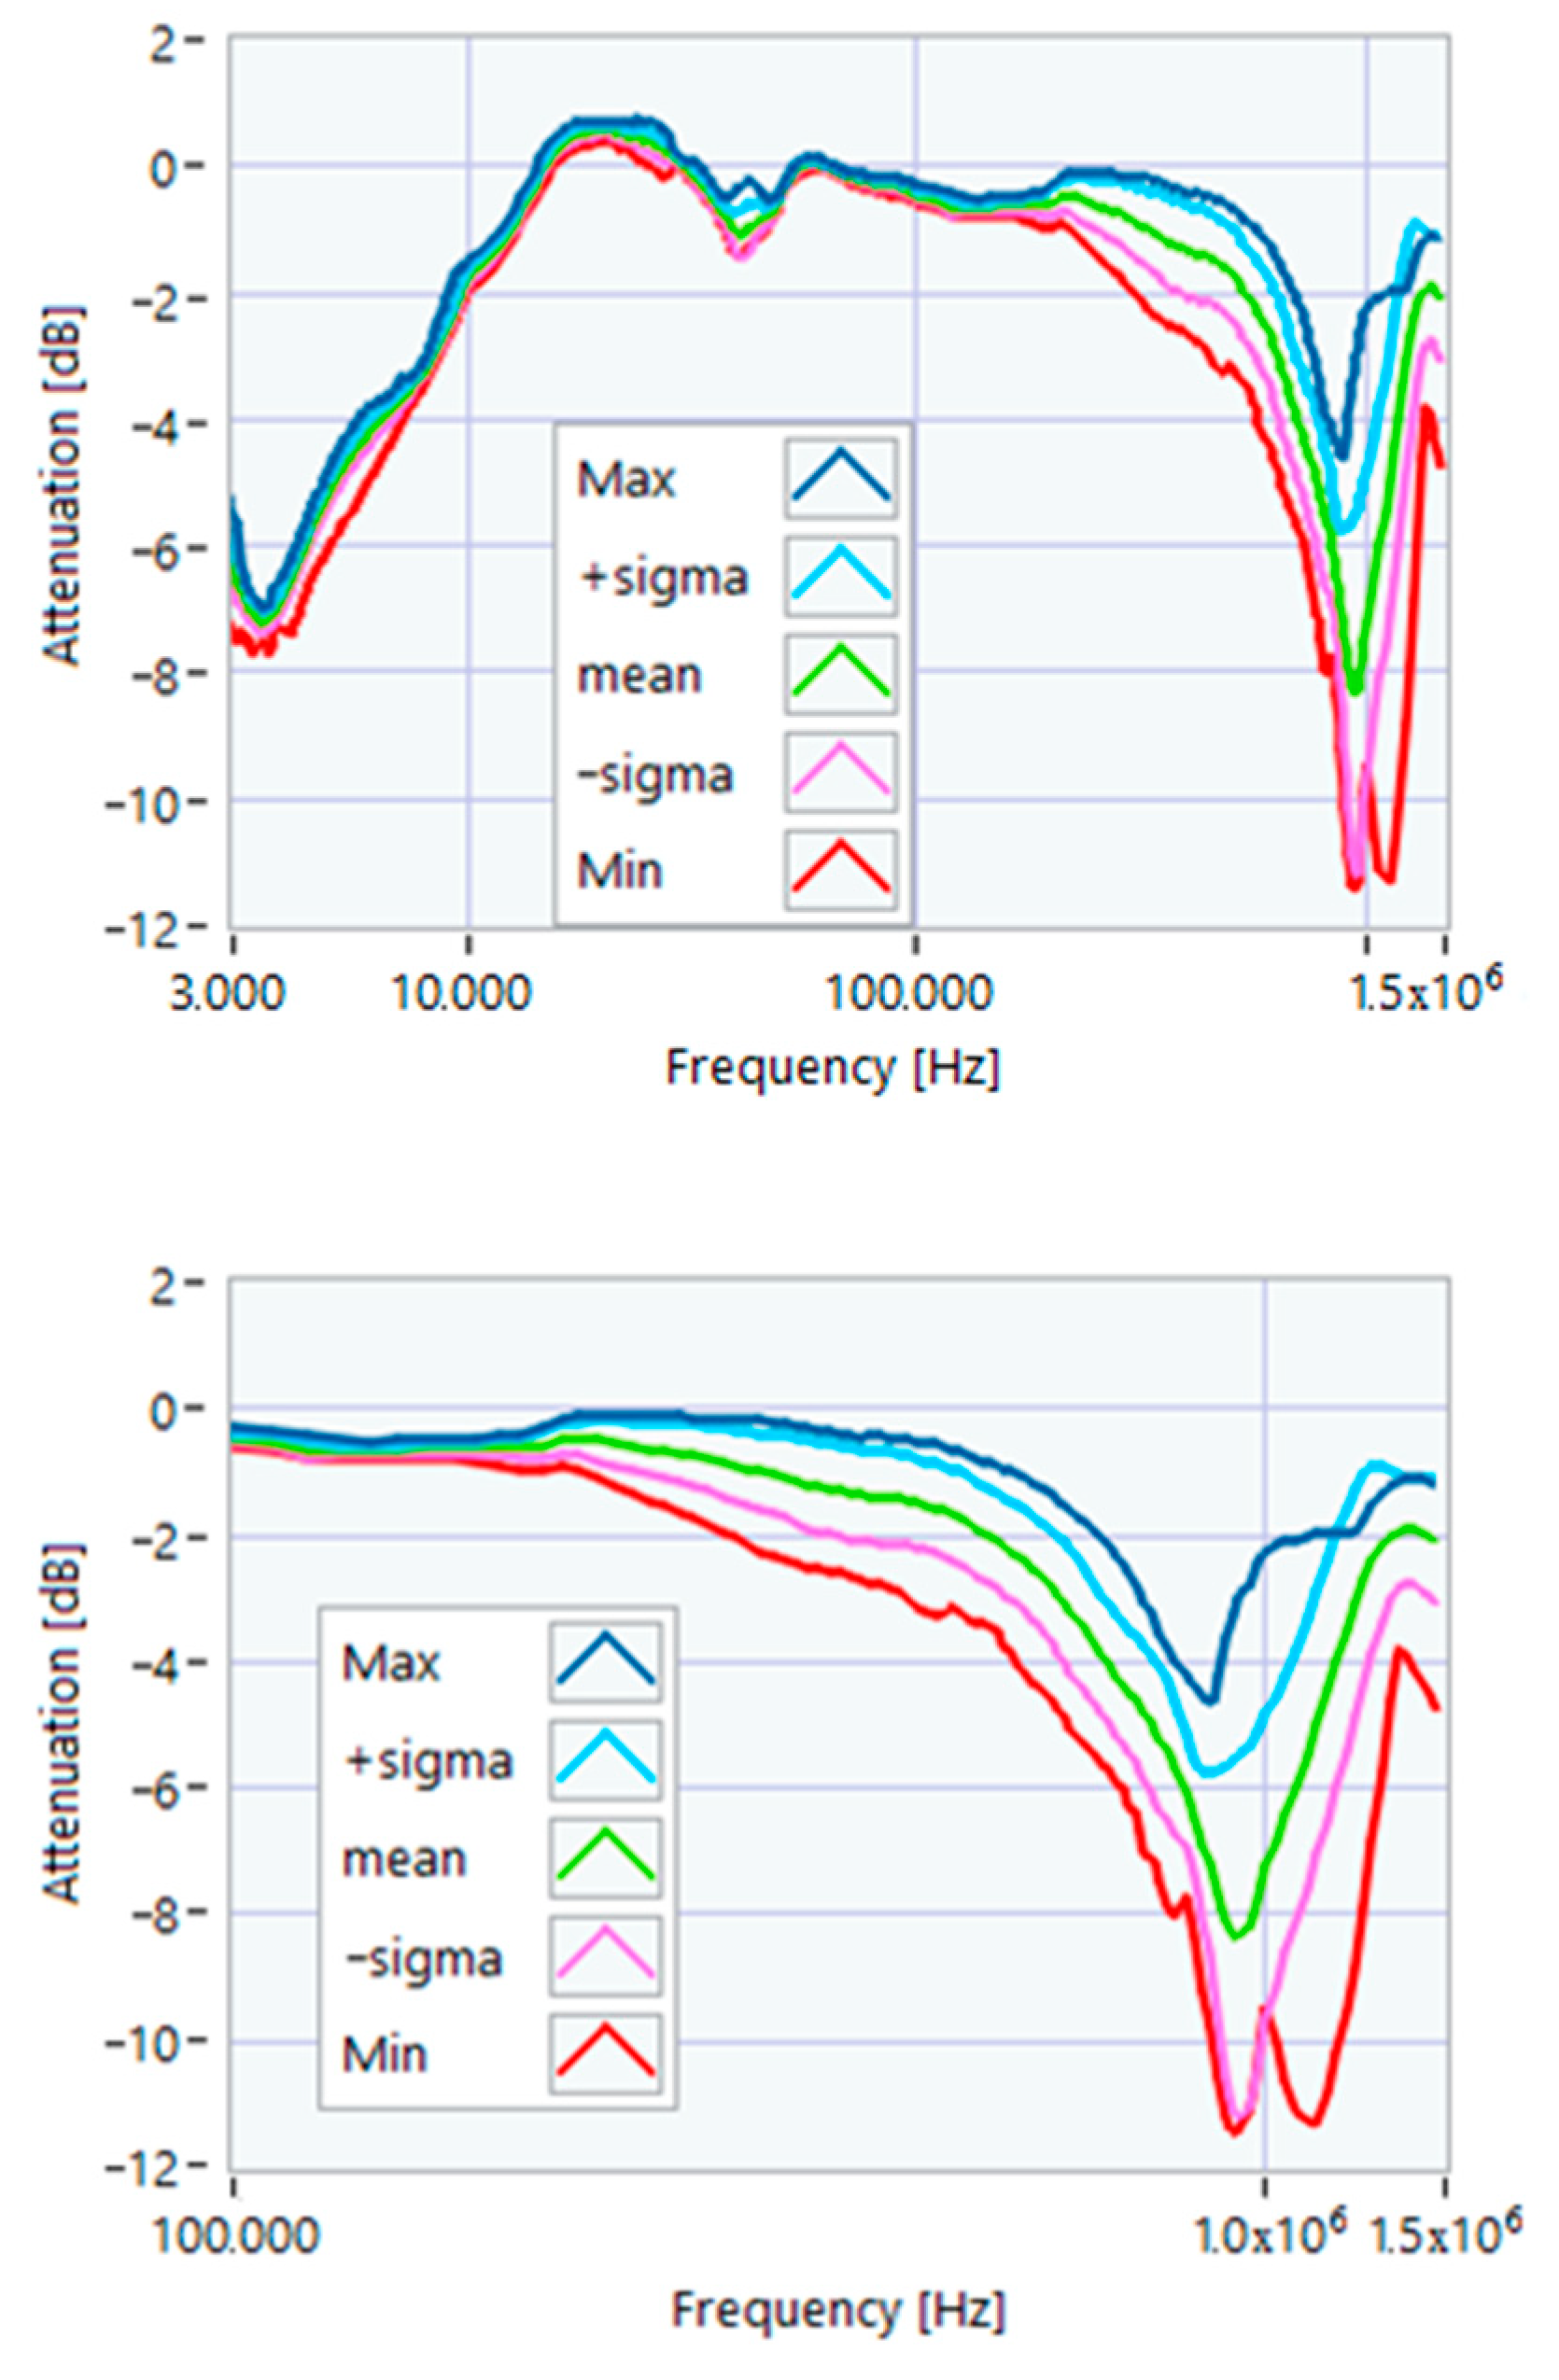
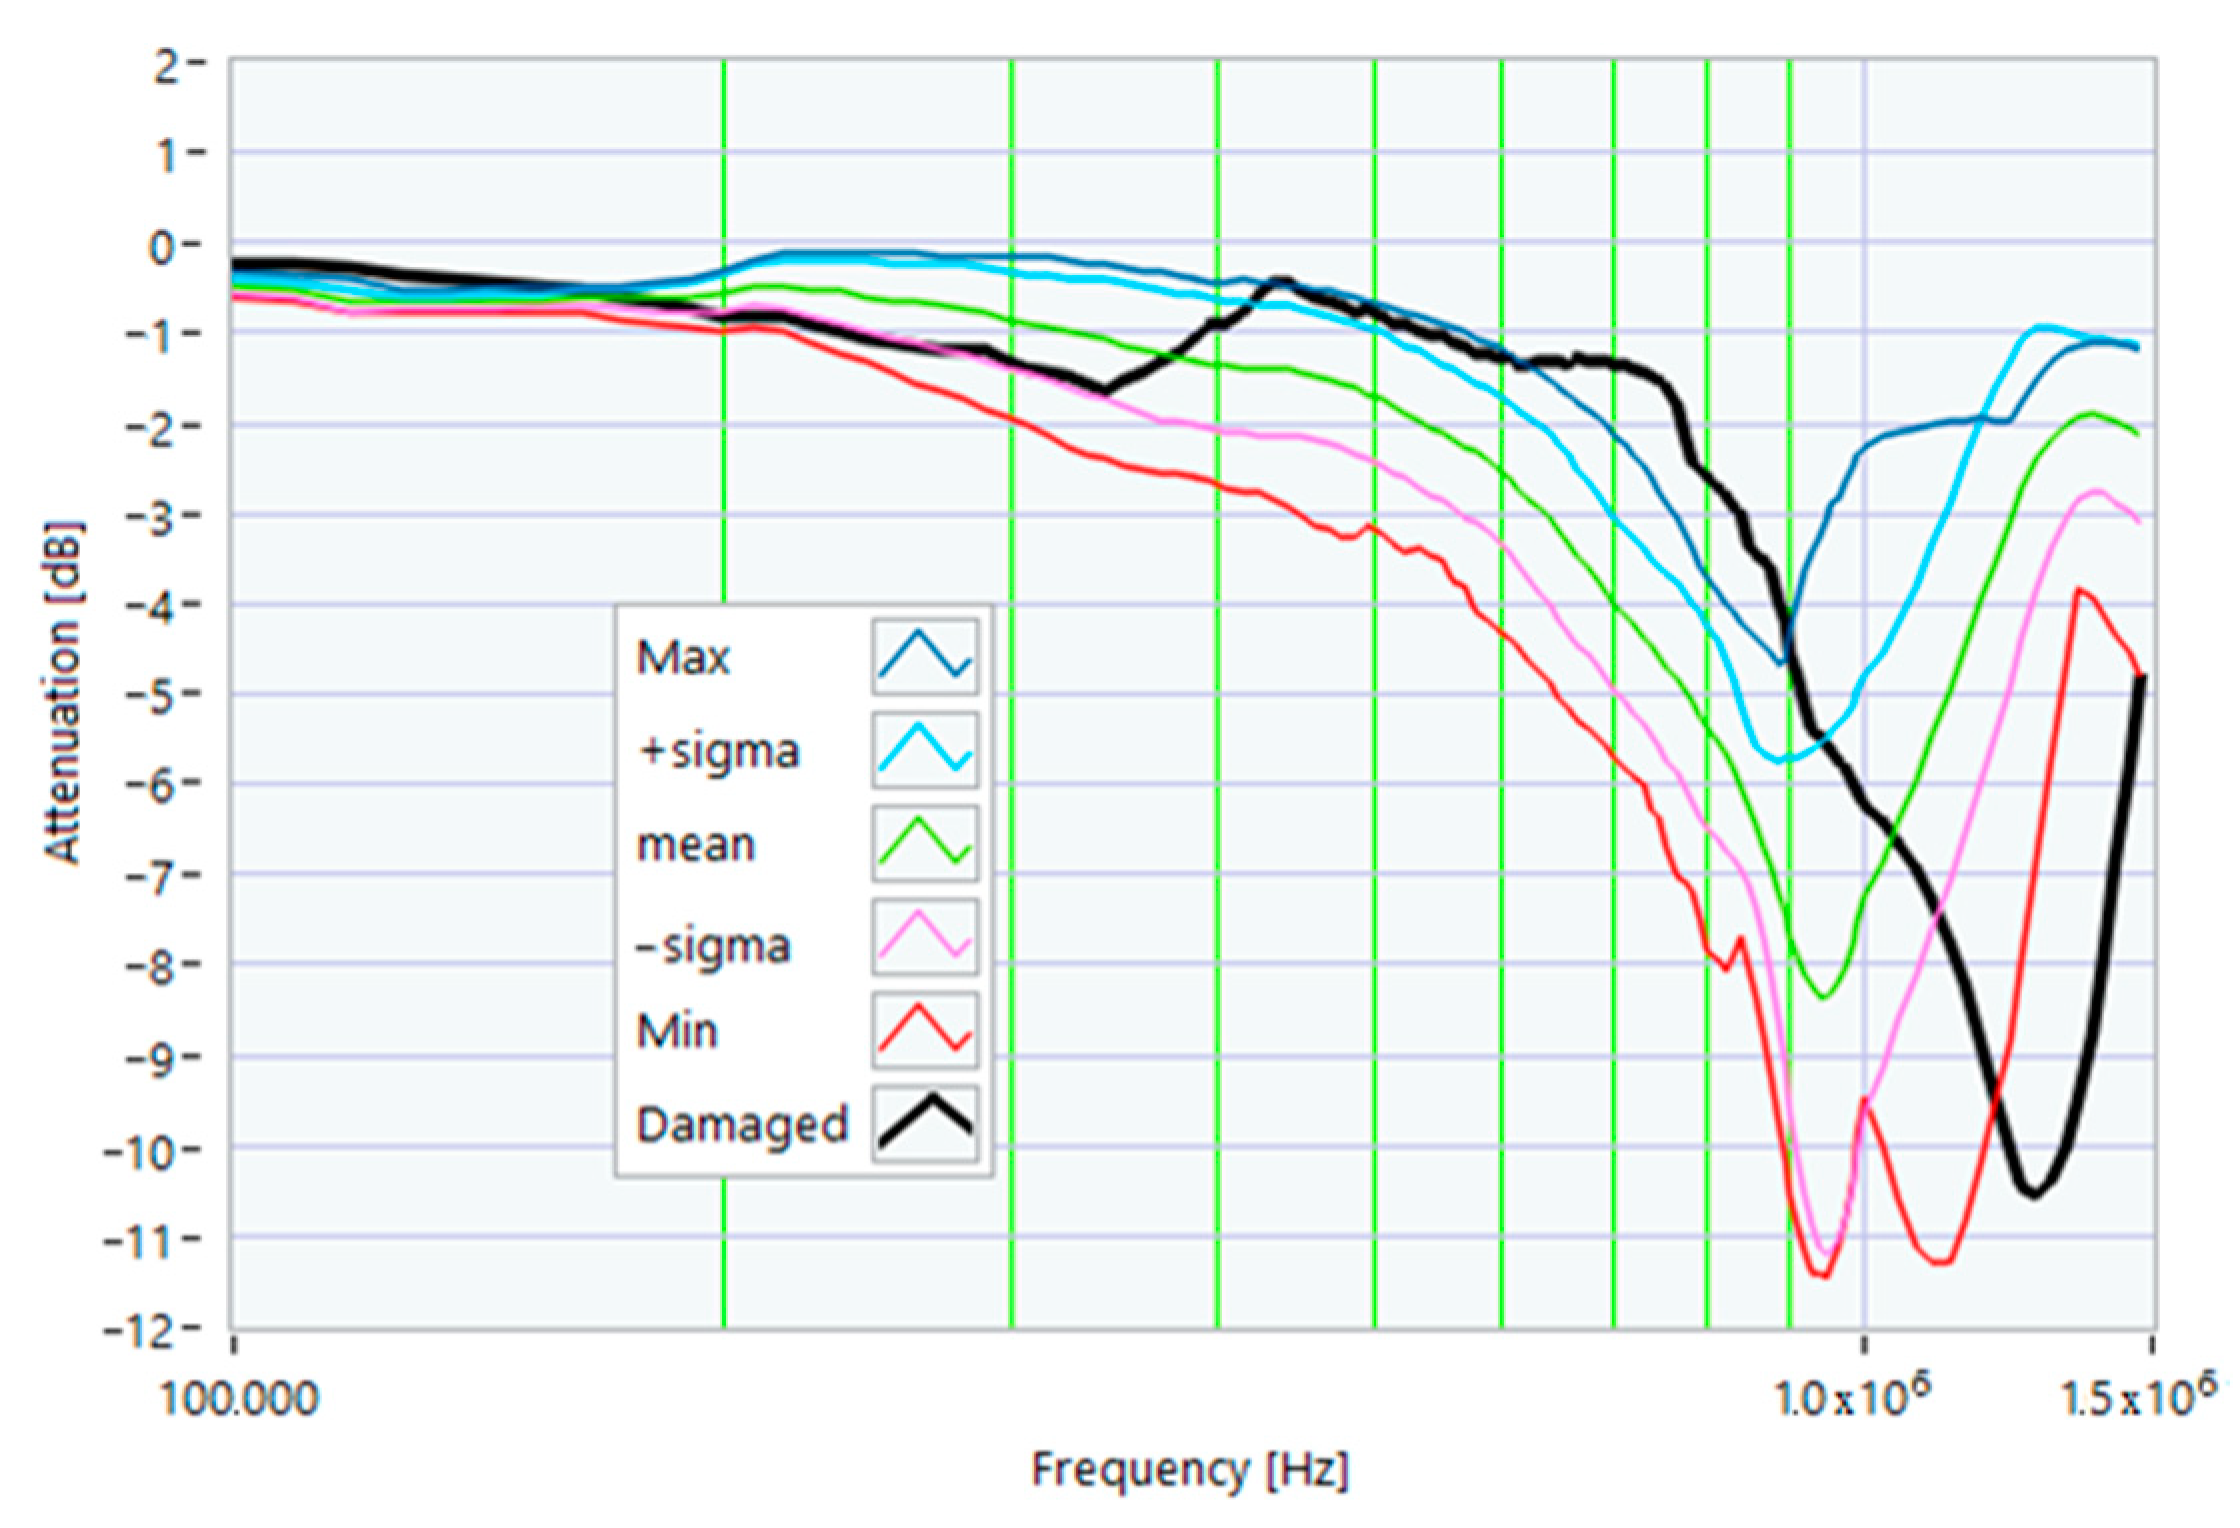
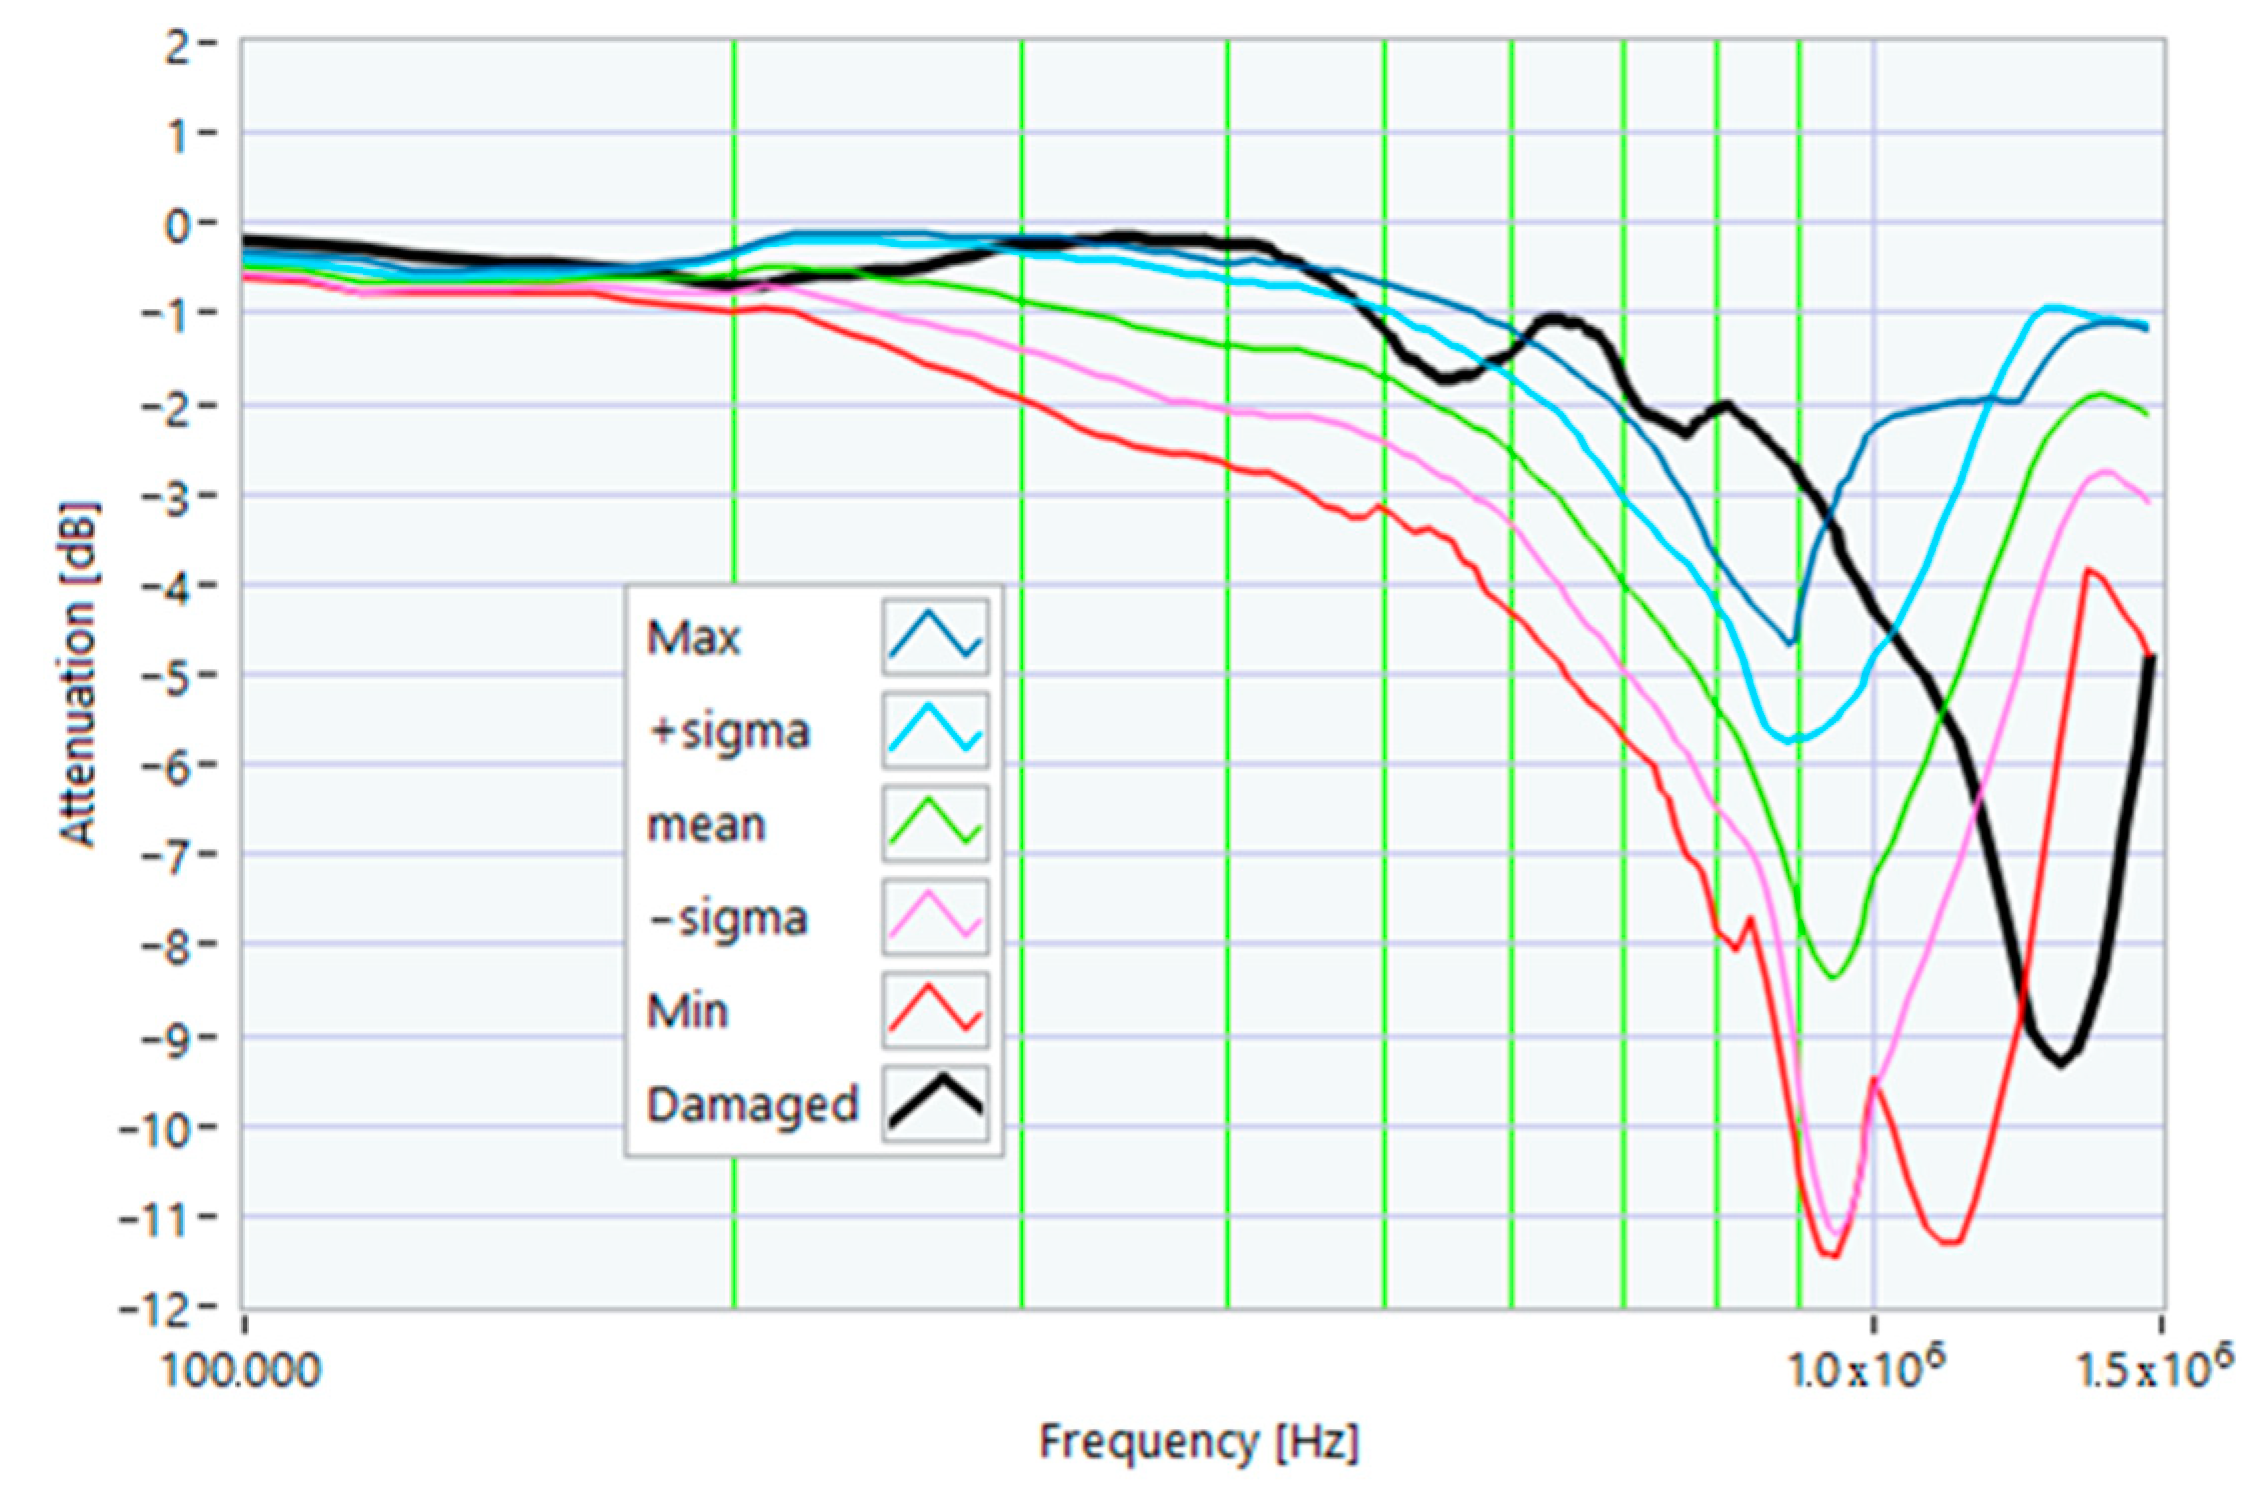
Figure 10.
Overall reference TFs processed with the whole dataset.
Figure 10.
Overall reference TFs processed with the whole dataset.
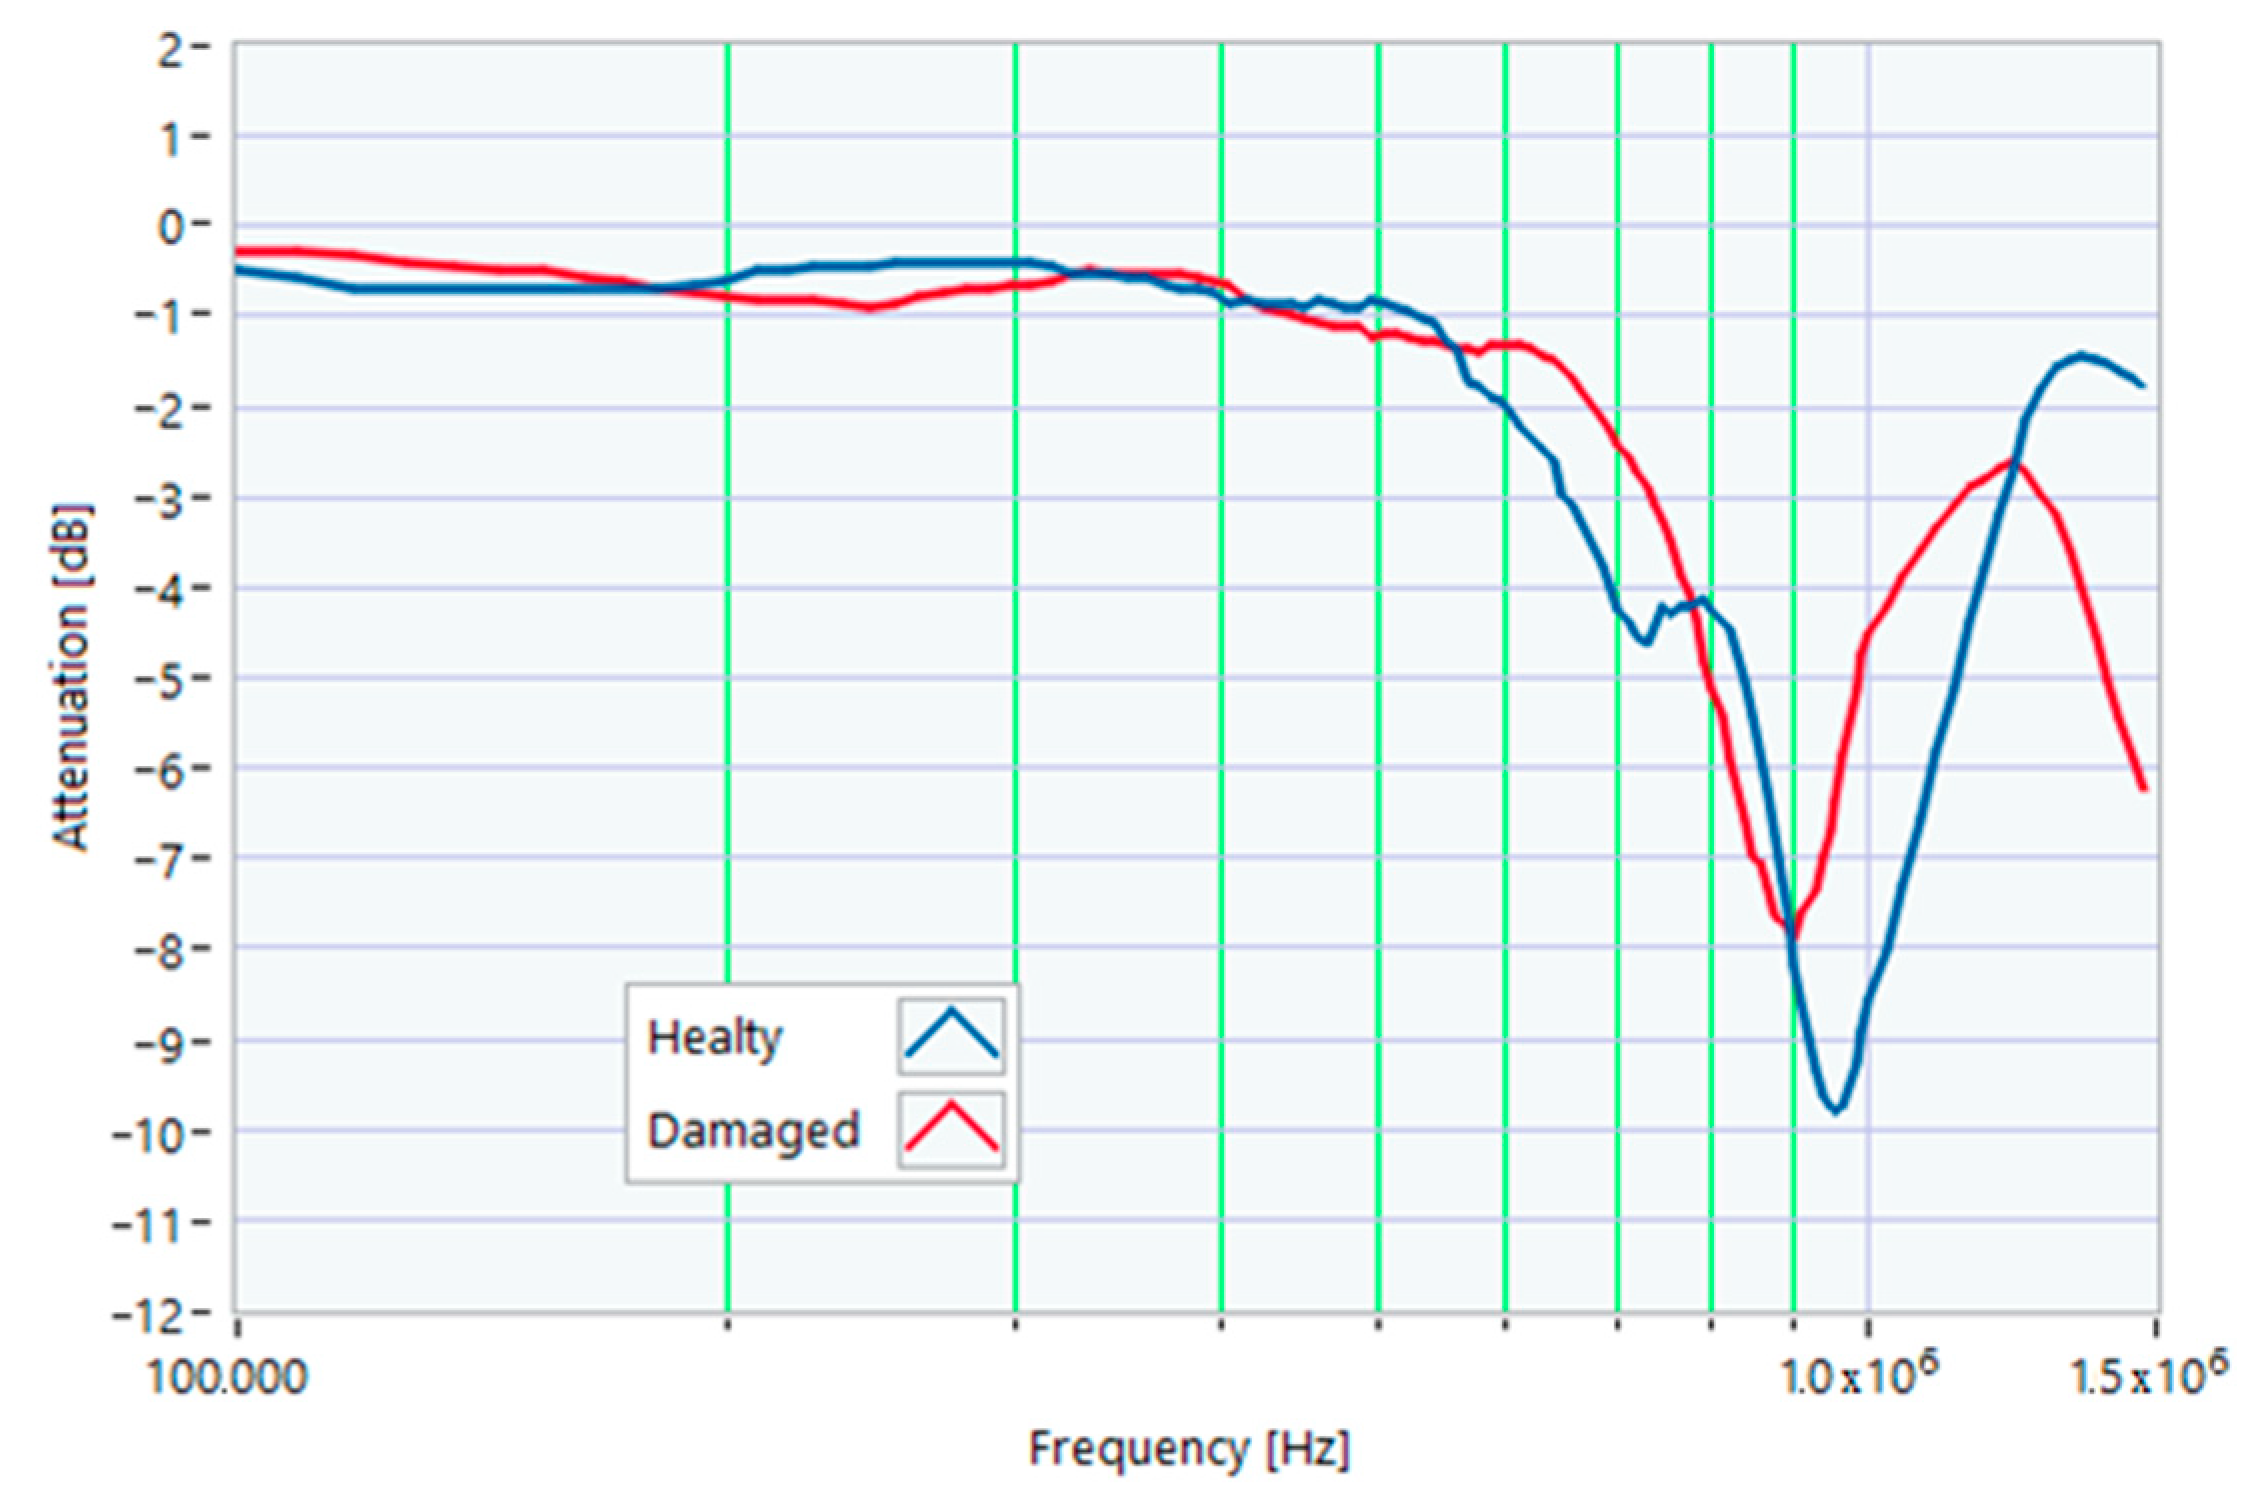
Figure 11.
Comparison between TFs of the same motor in healthy conditions and with a 1 Ω resistance-in-series on a phase conductor.
Figure 11.
Comparison between TFs of the same motor in healthy conditions and with a 1 Ω resistance-in-series on a phase conductor.
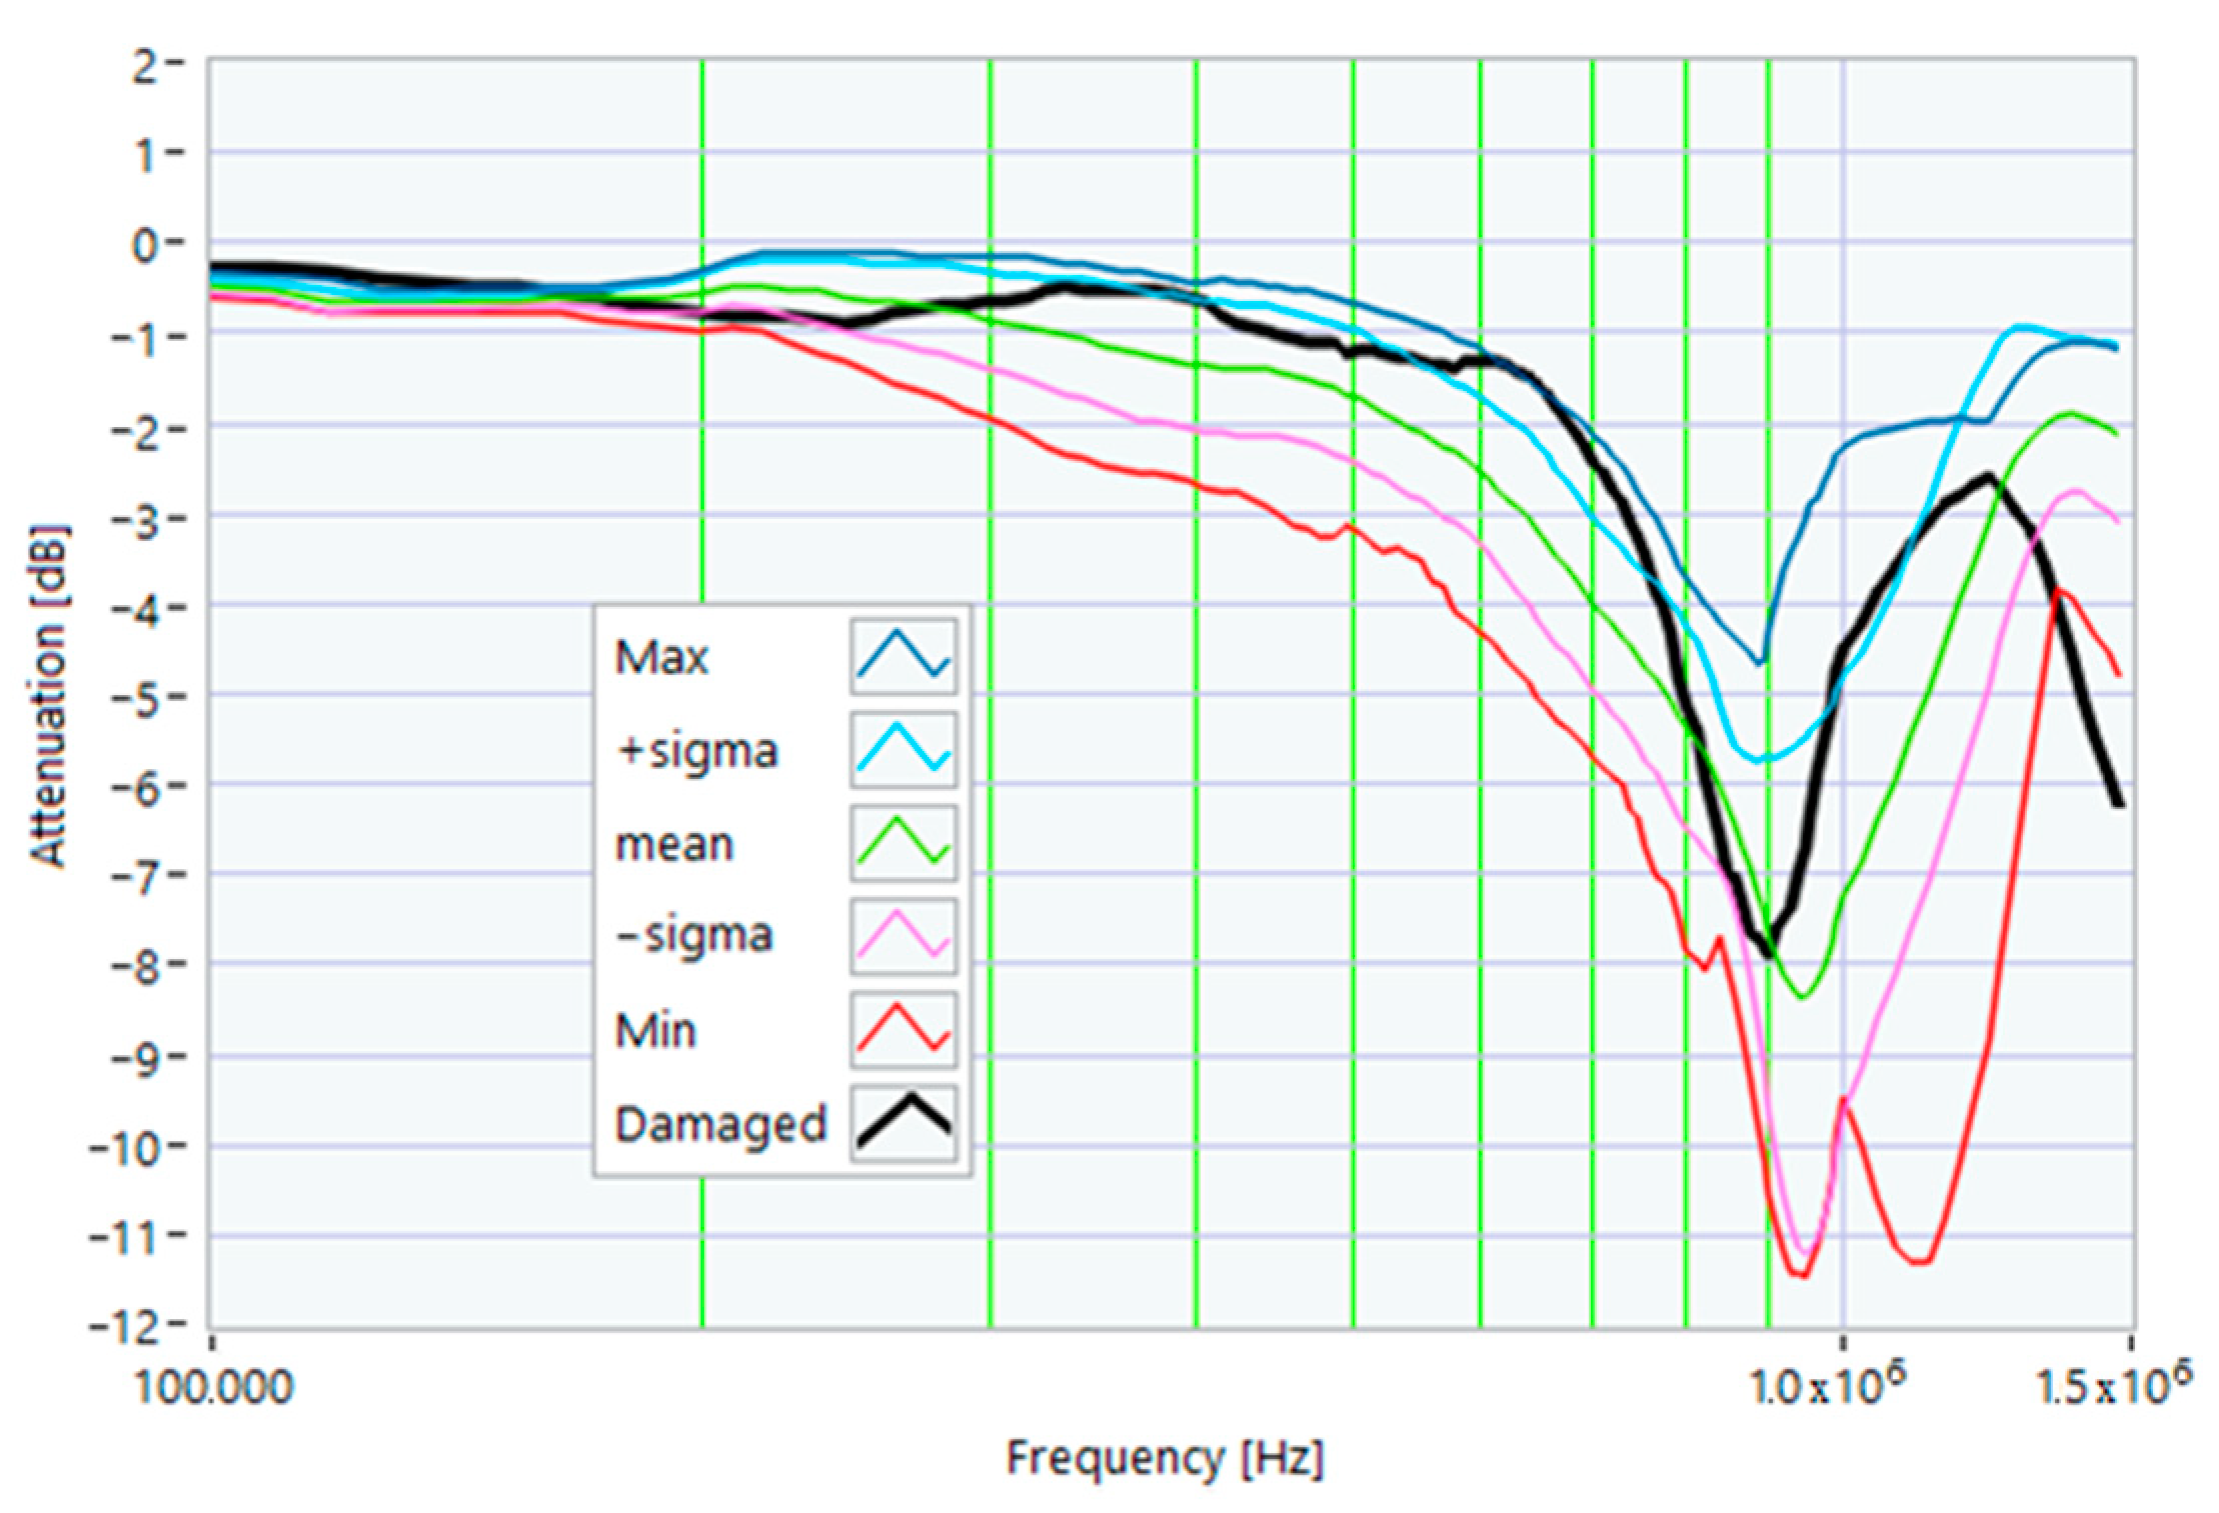
Figure 12.
Comparison of the TF of a motor with a 1 Ω resistance-in-series on a phase conductor with the reference TFs on the whole bandwidth.
Figure 12.
Comparison of the TF of a motor with a 1 Ω resistance-in-series on a phase conductor with the reference TFs on the whole bandwidth.
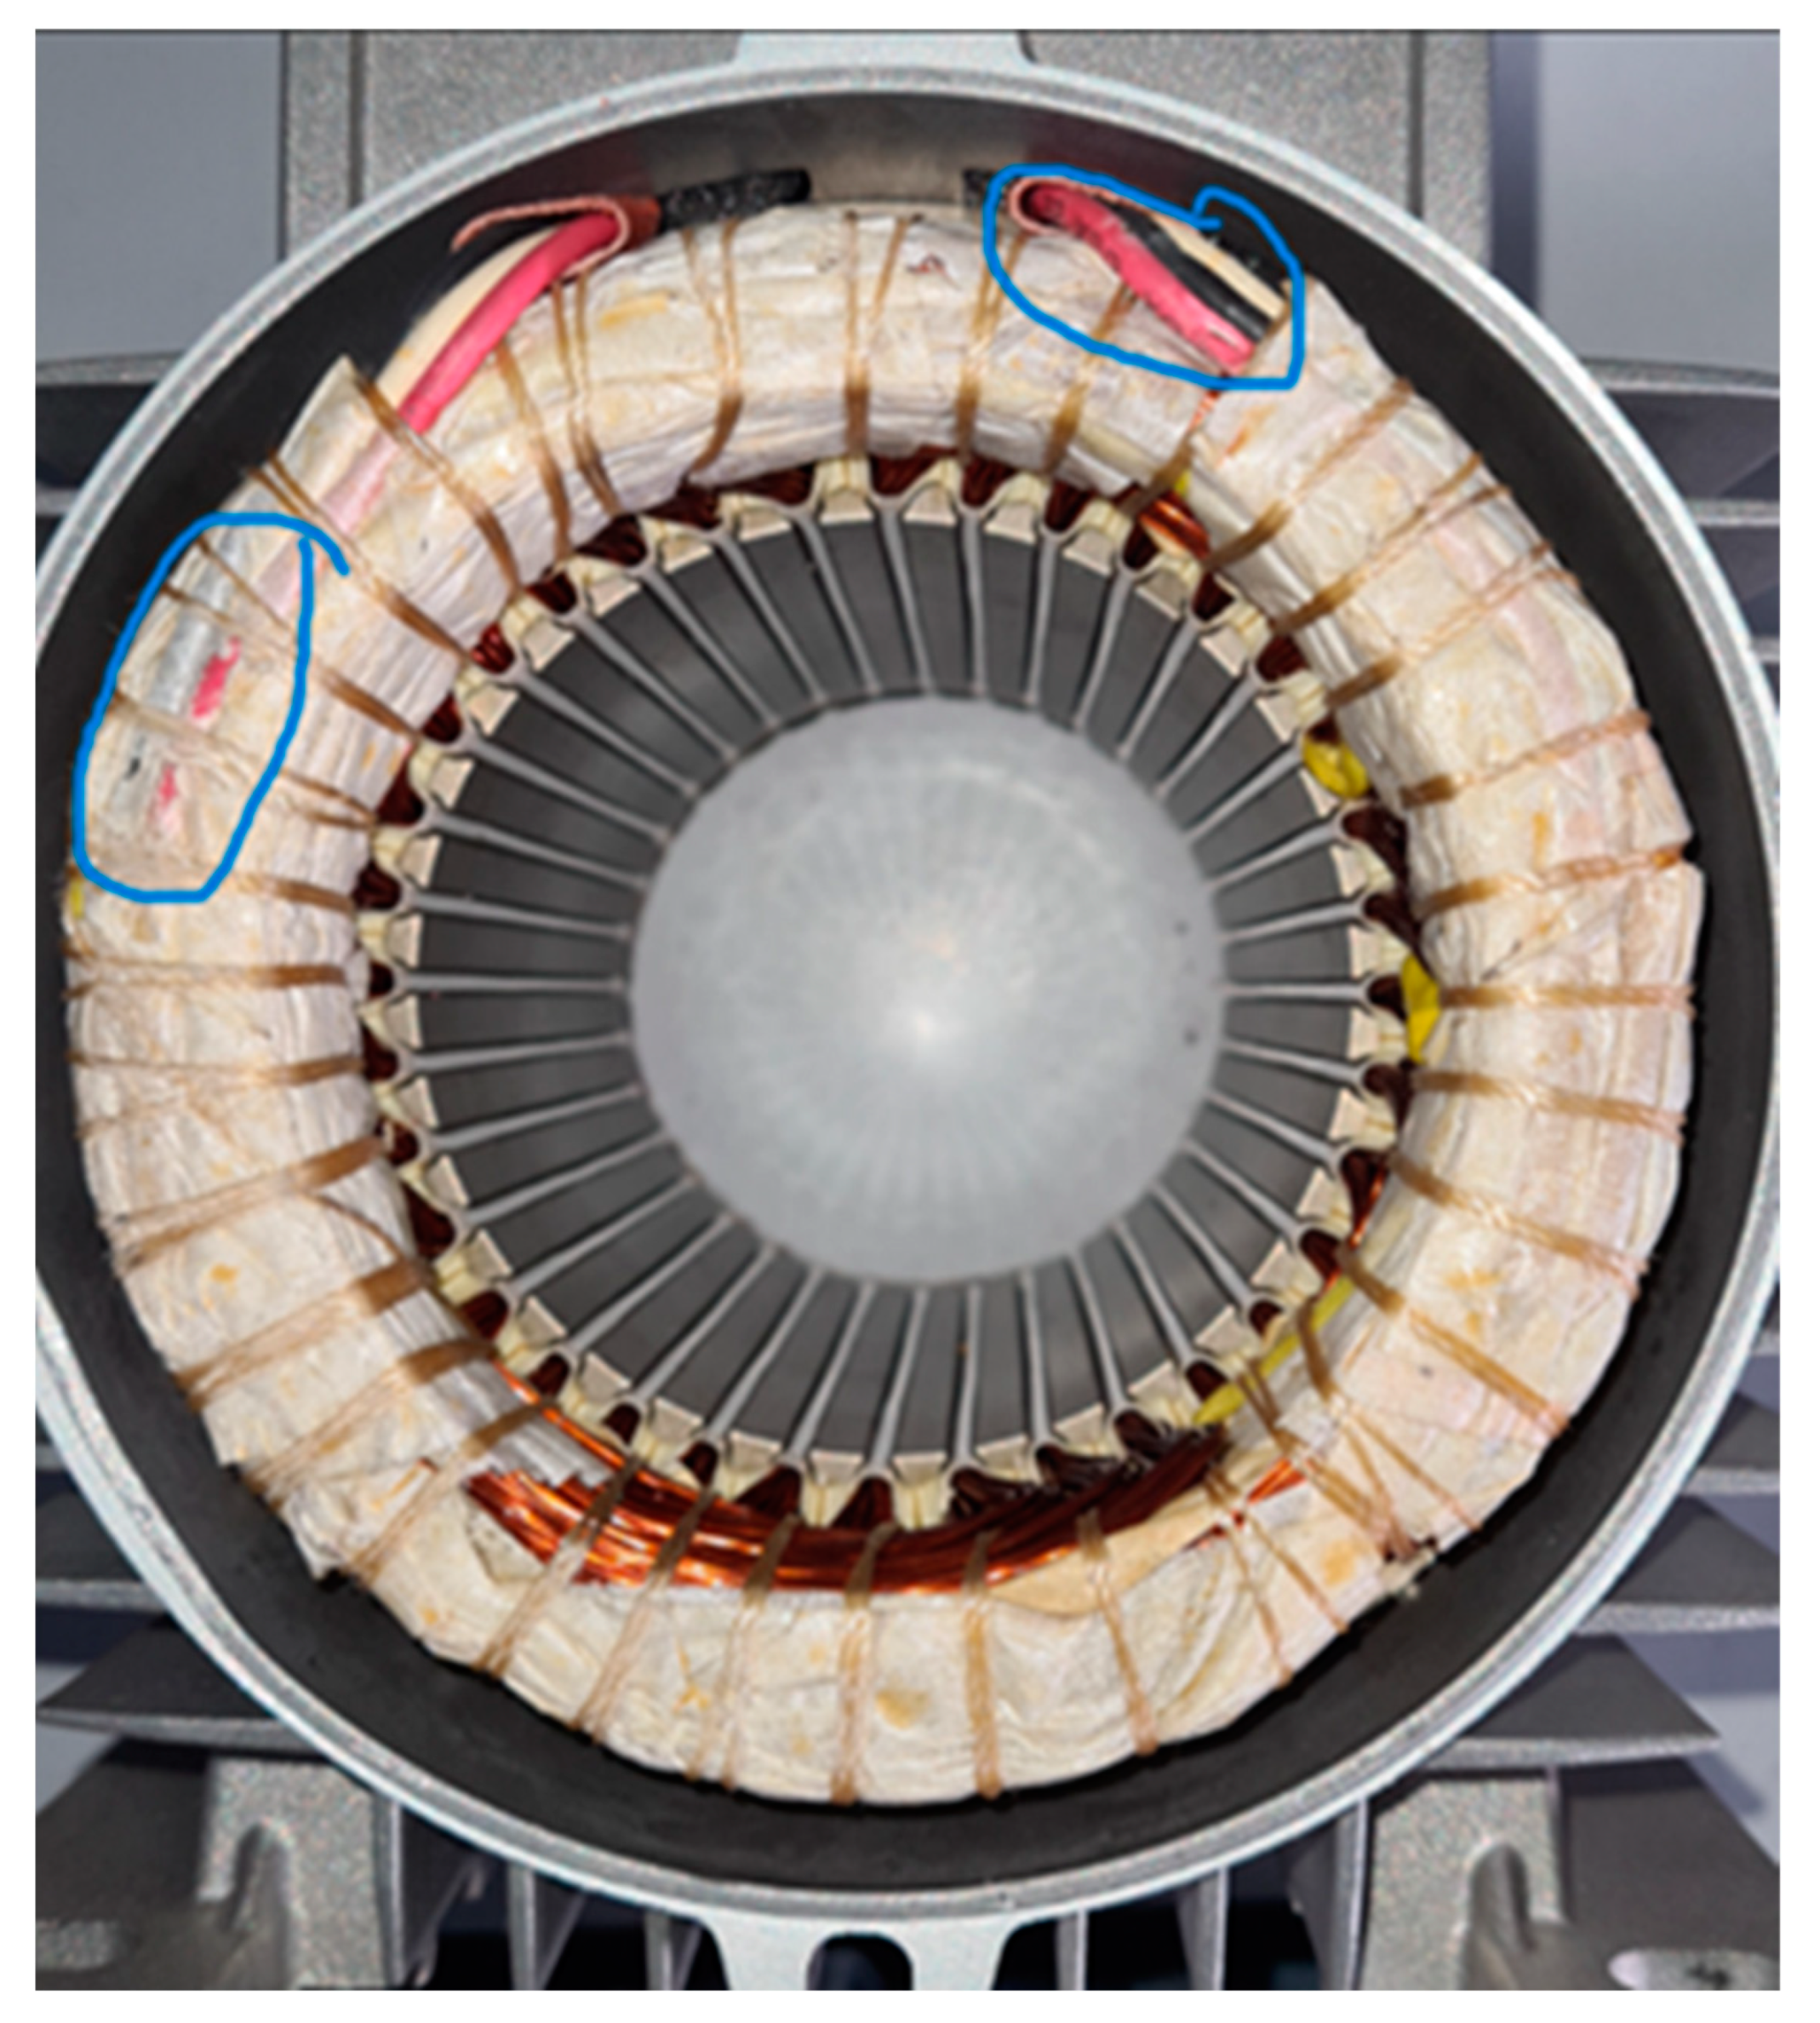
Figure 13.
Comparison between TFs of the same motor in healthy conditions and with a 25 kΩ resistance between one terminal and the ground.
Figure 13.
Comparison between TFs of the same motor in healthy conditions and with a 25 kΩ resistance between one terminal and the ground.
Figure 14.
Comparison of the TF of a motor with a 25 kΩ resistance between one terminal and the ground with the reference TFs.
Figure 14.
Comparison of the TF of a motor with a 25 kΩ resistance between one terminal and the ground with the reference TFs.
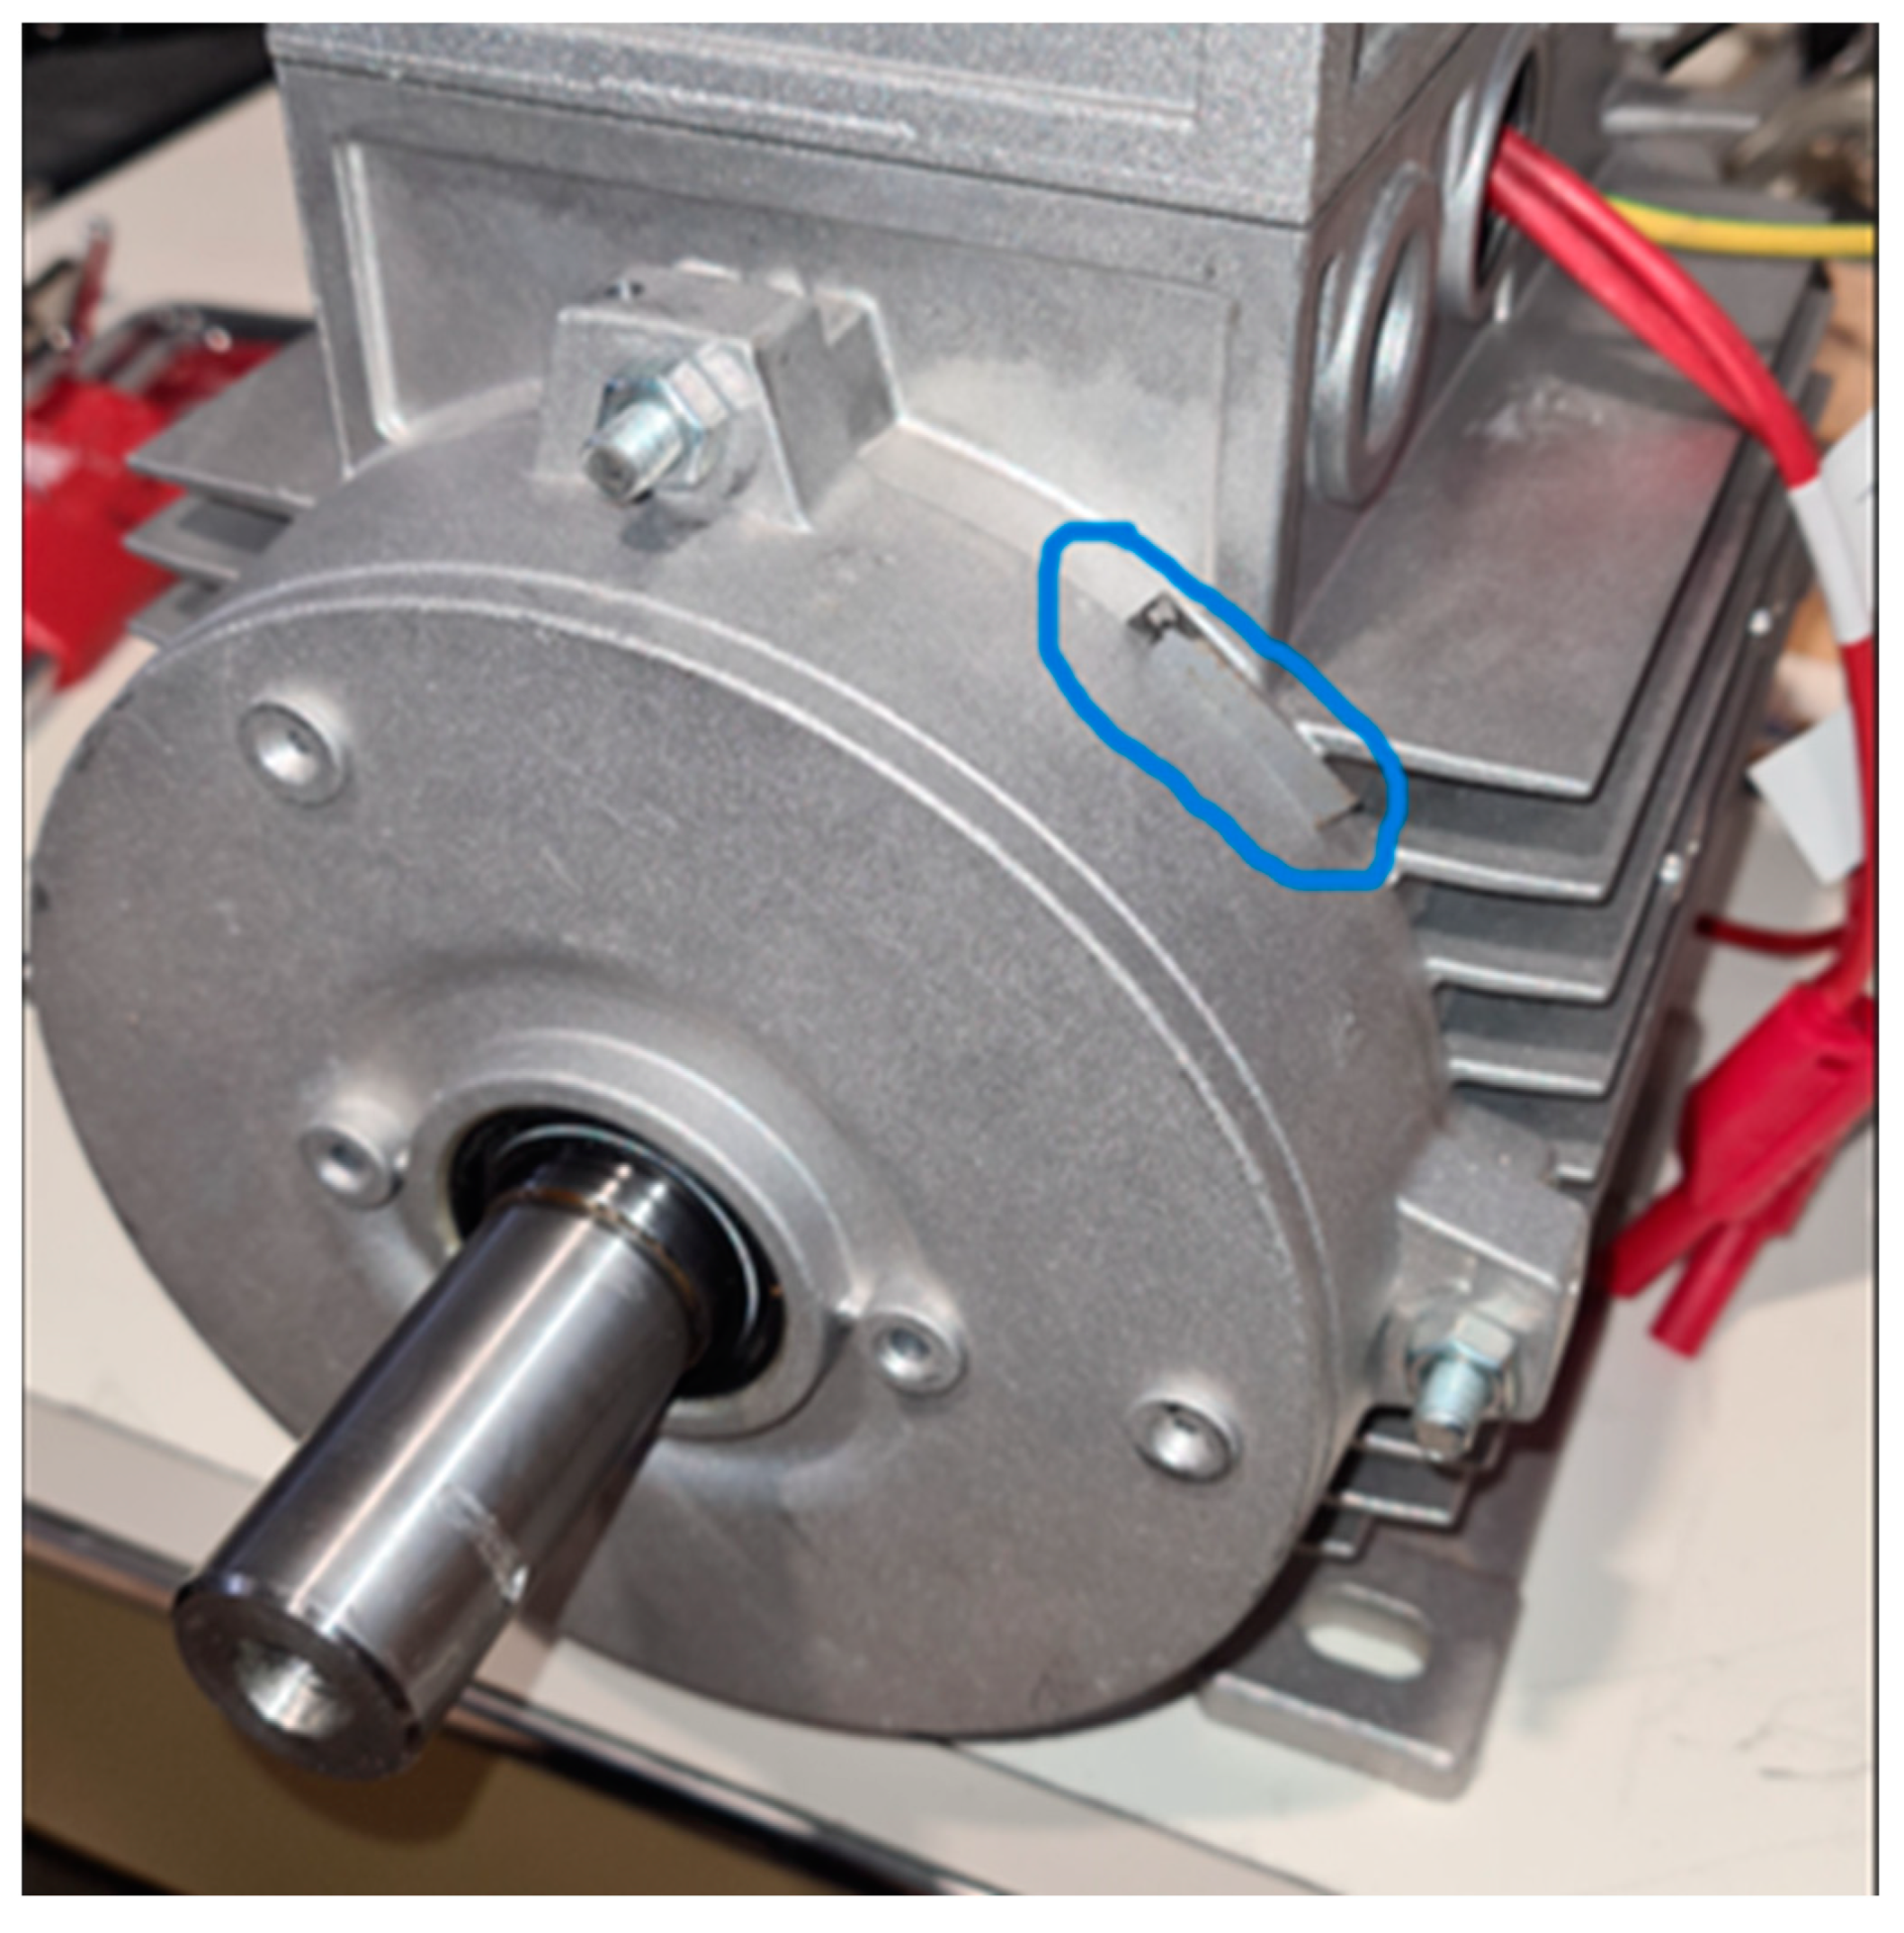
Figure 15.
Induction motor with slight rotor misalignment.
Figure 15.
Induction motor with slight rotor misalignment.
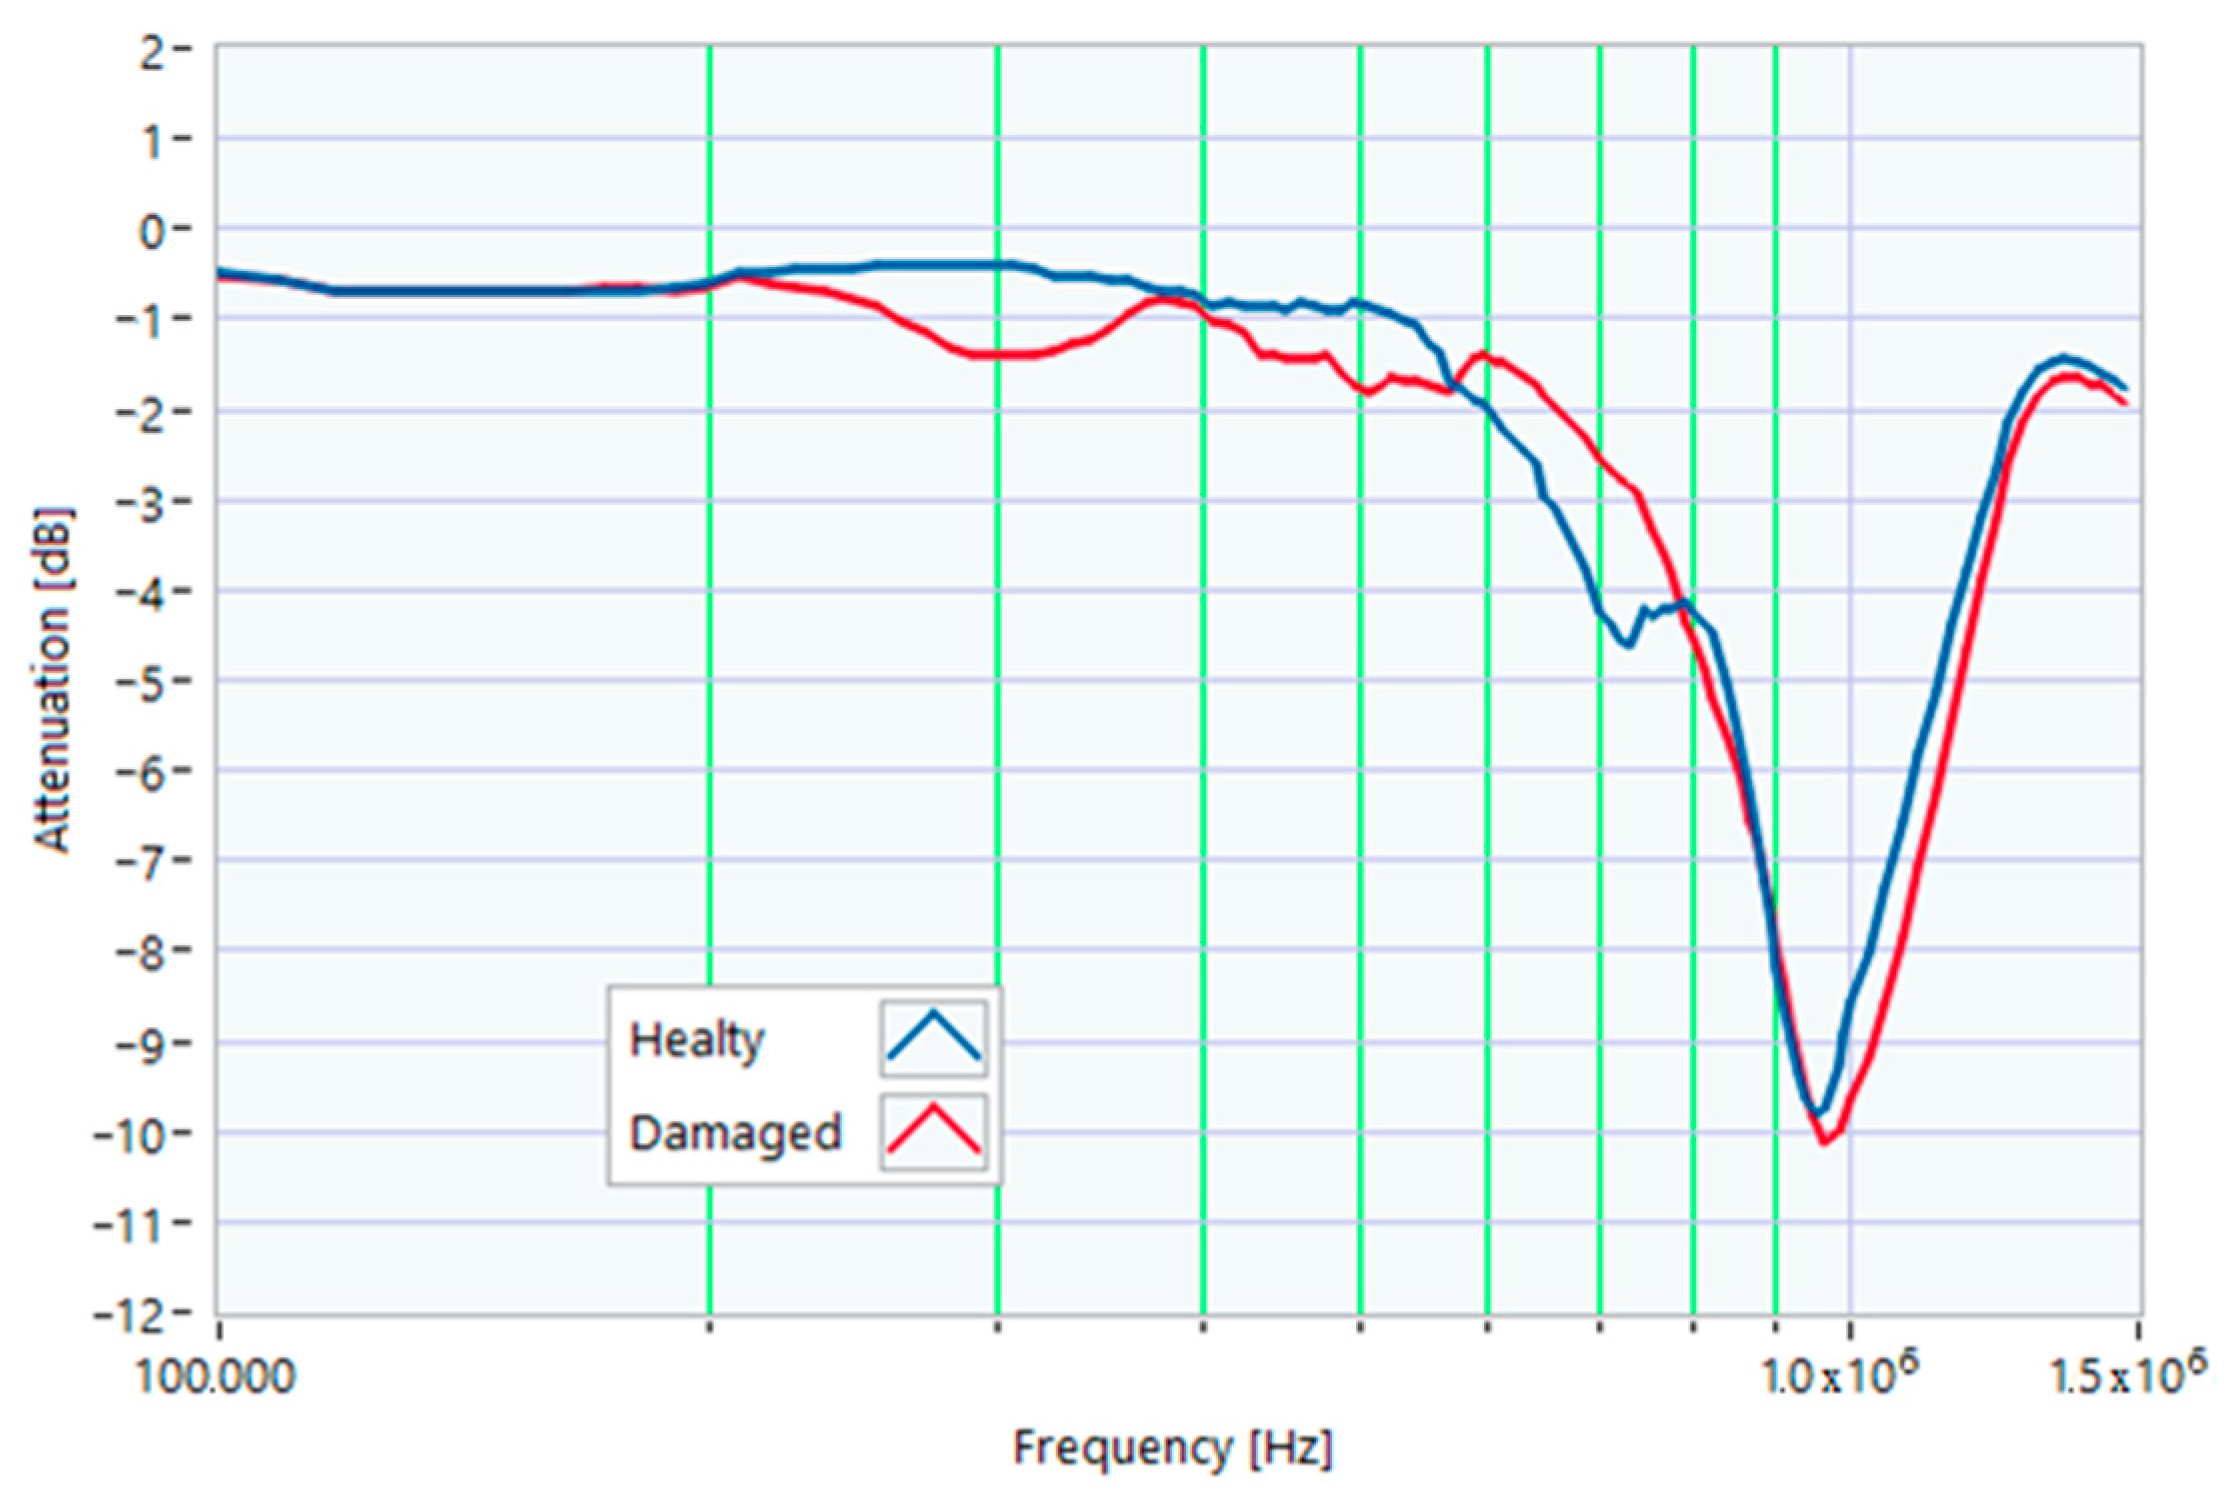
Figure 16.
Comparison between TFs of the same motor in healthy conditions and with slight rotor misalignment.
Figure 16.
Comparison between TFs of the same motor in healthy conditions and with slight rotor misalignment.
Figure 17.
Comparison between the TF of the motor with slight rotor misalignment and the reference TFs.
Figure 17.
Comparison between the TF of the motor with slight rotor misalignment and the reference TFs.
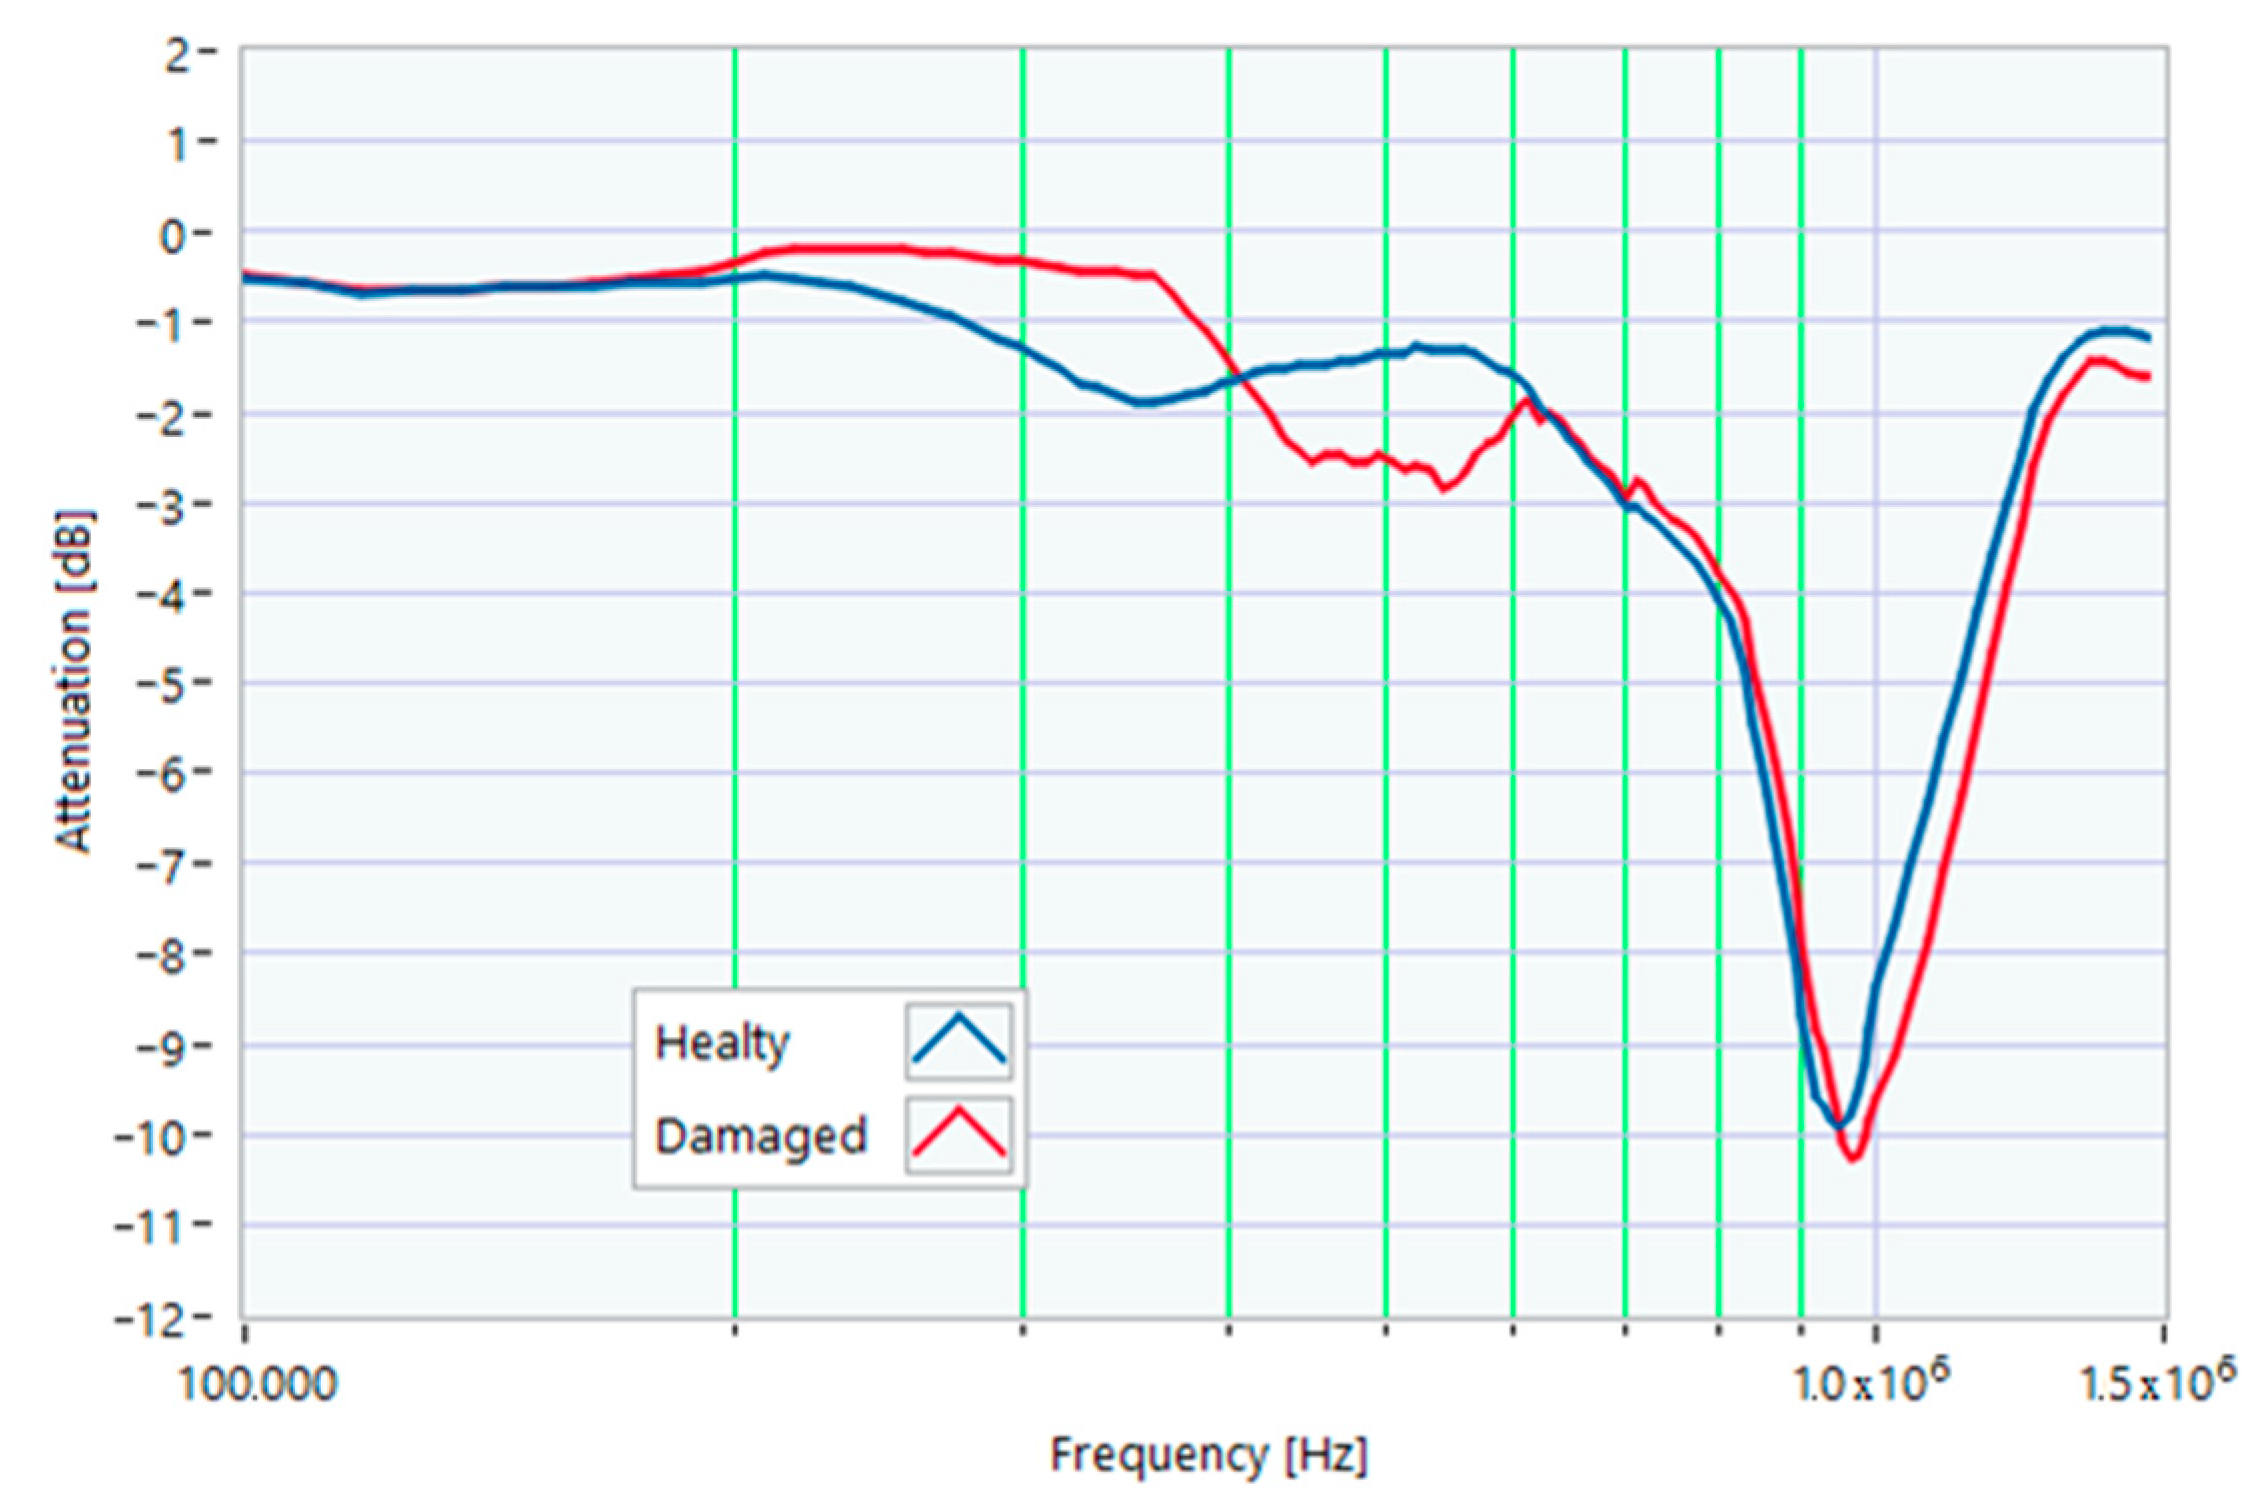
Figure 18.
Comparison between TFs of the same motor in healthy conditions and after overheating.
Figure 18.
Comparison between TFs of the same motor in healthy conditions and after overheating.
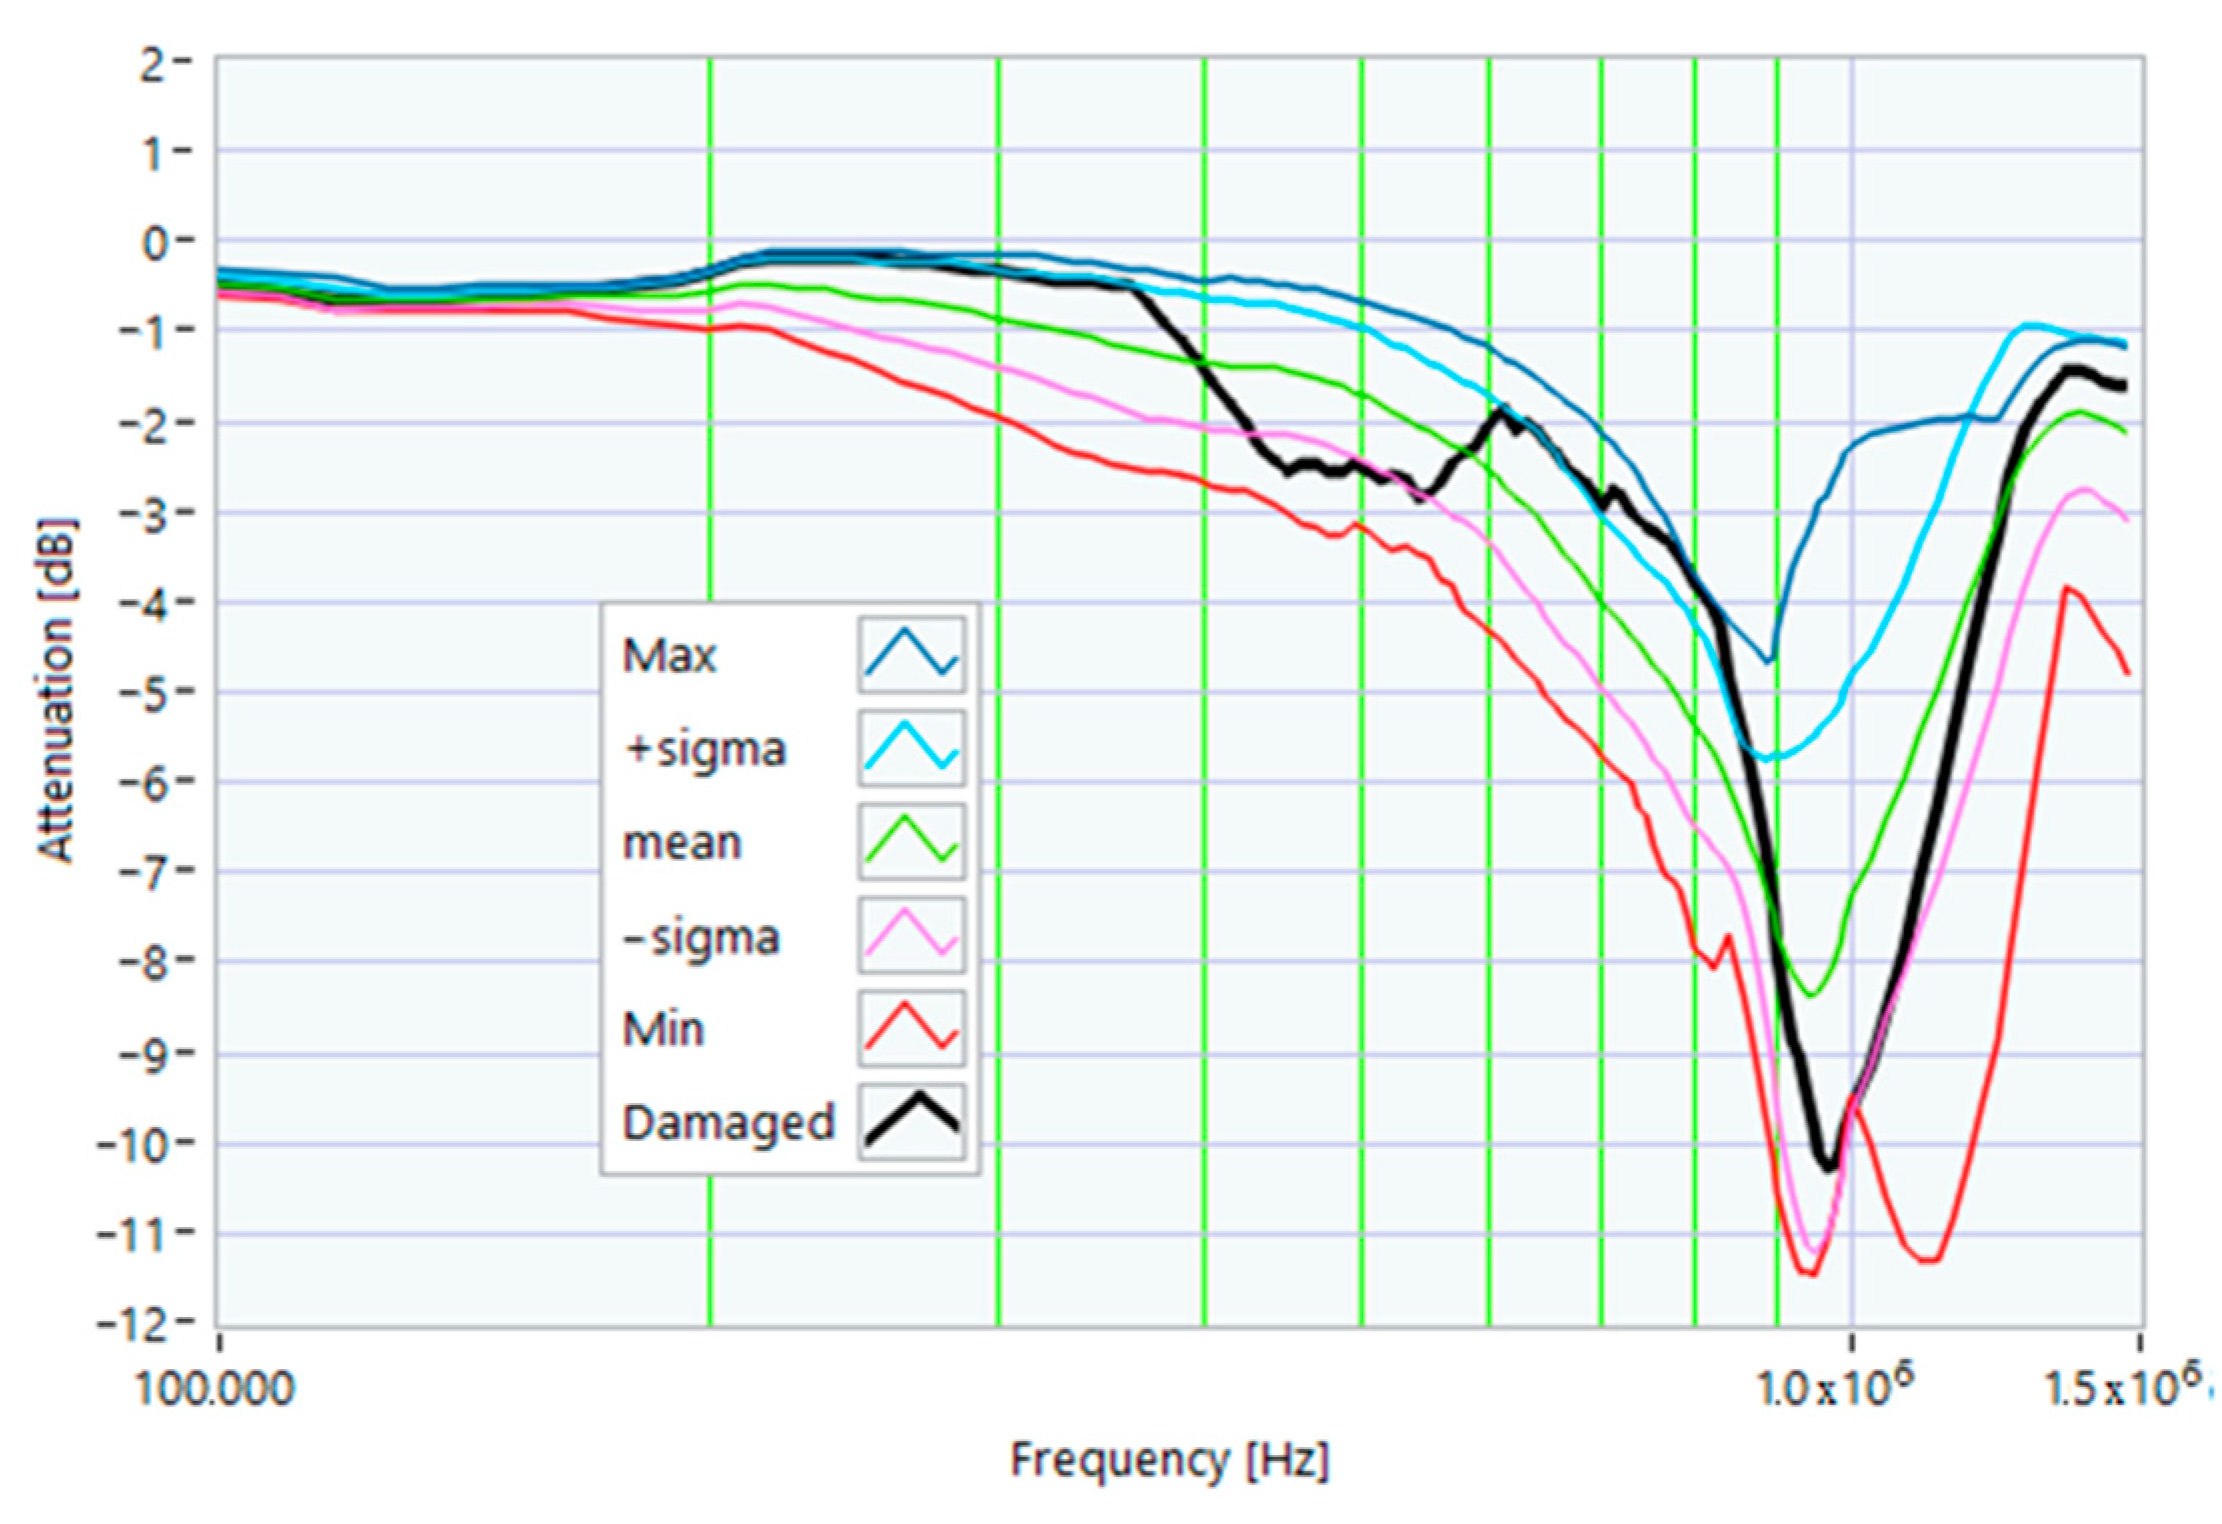
Figure 19.
Comparison of the TF of a motor after overheating with the reference TFs.
Figure 19.
Comparison of the TF of a motor after overheating with the reference TFs.
Figure 20.
The stator of an induction motor after a fall from a height of 1 m.
Figure 20.
The stator of an induction motor after a fall from a height of 1 m.
Figure 21.
Comparison between TFs of the same motor in healthy condition and a stator fell from a height of 1 m.
Figure 21.
Comparison between TFs of the same motor in healthy condition and a stator fell from a height of 1 m.
Figure 22.
Comparison of the TF of a motor after the stator fell from a height of 1 m with the reference TFs.
Figure 22.
Comparison of the TF of a motor after the stator fell from a height of 1 m with the reference TFs.
Figure 23.
Shorting ring damage.
Figure 23.
Shorting ring damage.
Figure 24.
Comparison between TFs of the same motor in healthy conditions and with shorting ring damage.
Figure 24.
Comparison between TFs of the same motor in healthy conditions and with shorting ring damage.
Figure 25.
Comparison between the TF of a motor with shorting ring damage and the reference TFs.
Figure 25.
Comparison between the TF of a motor with shorting ring damage and the reference TFs.
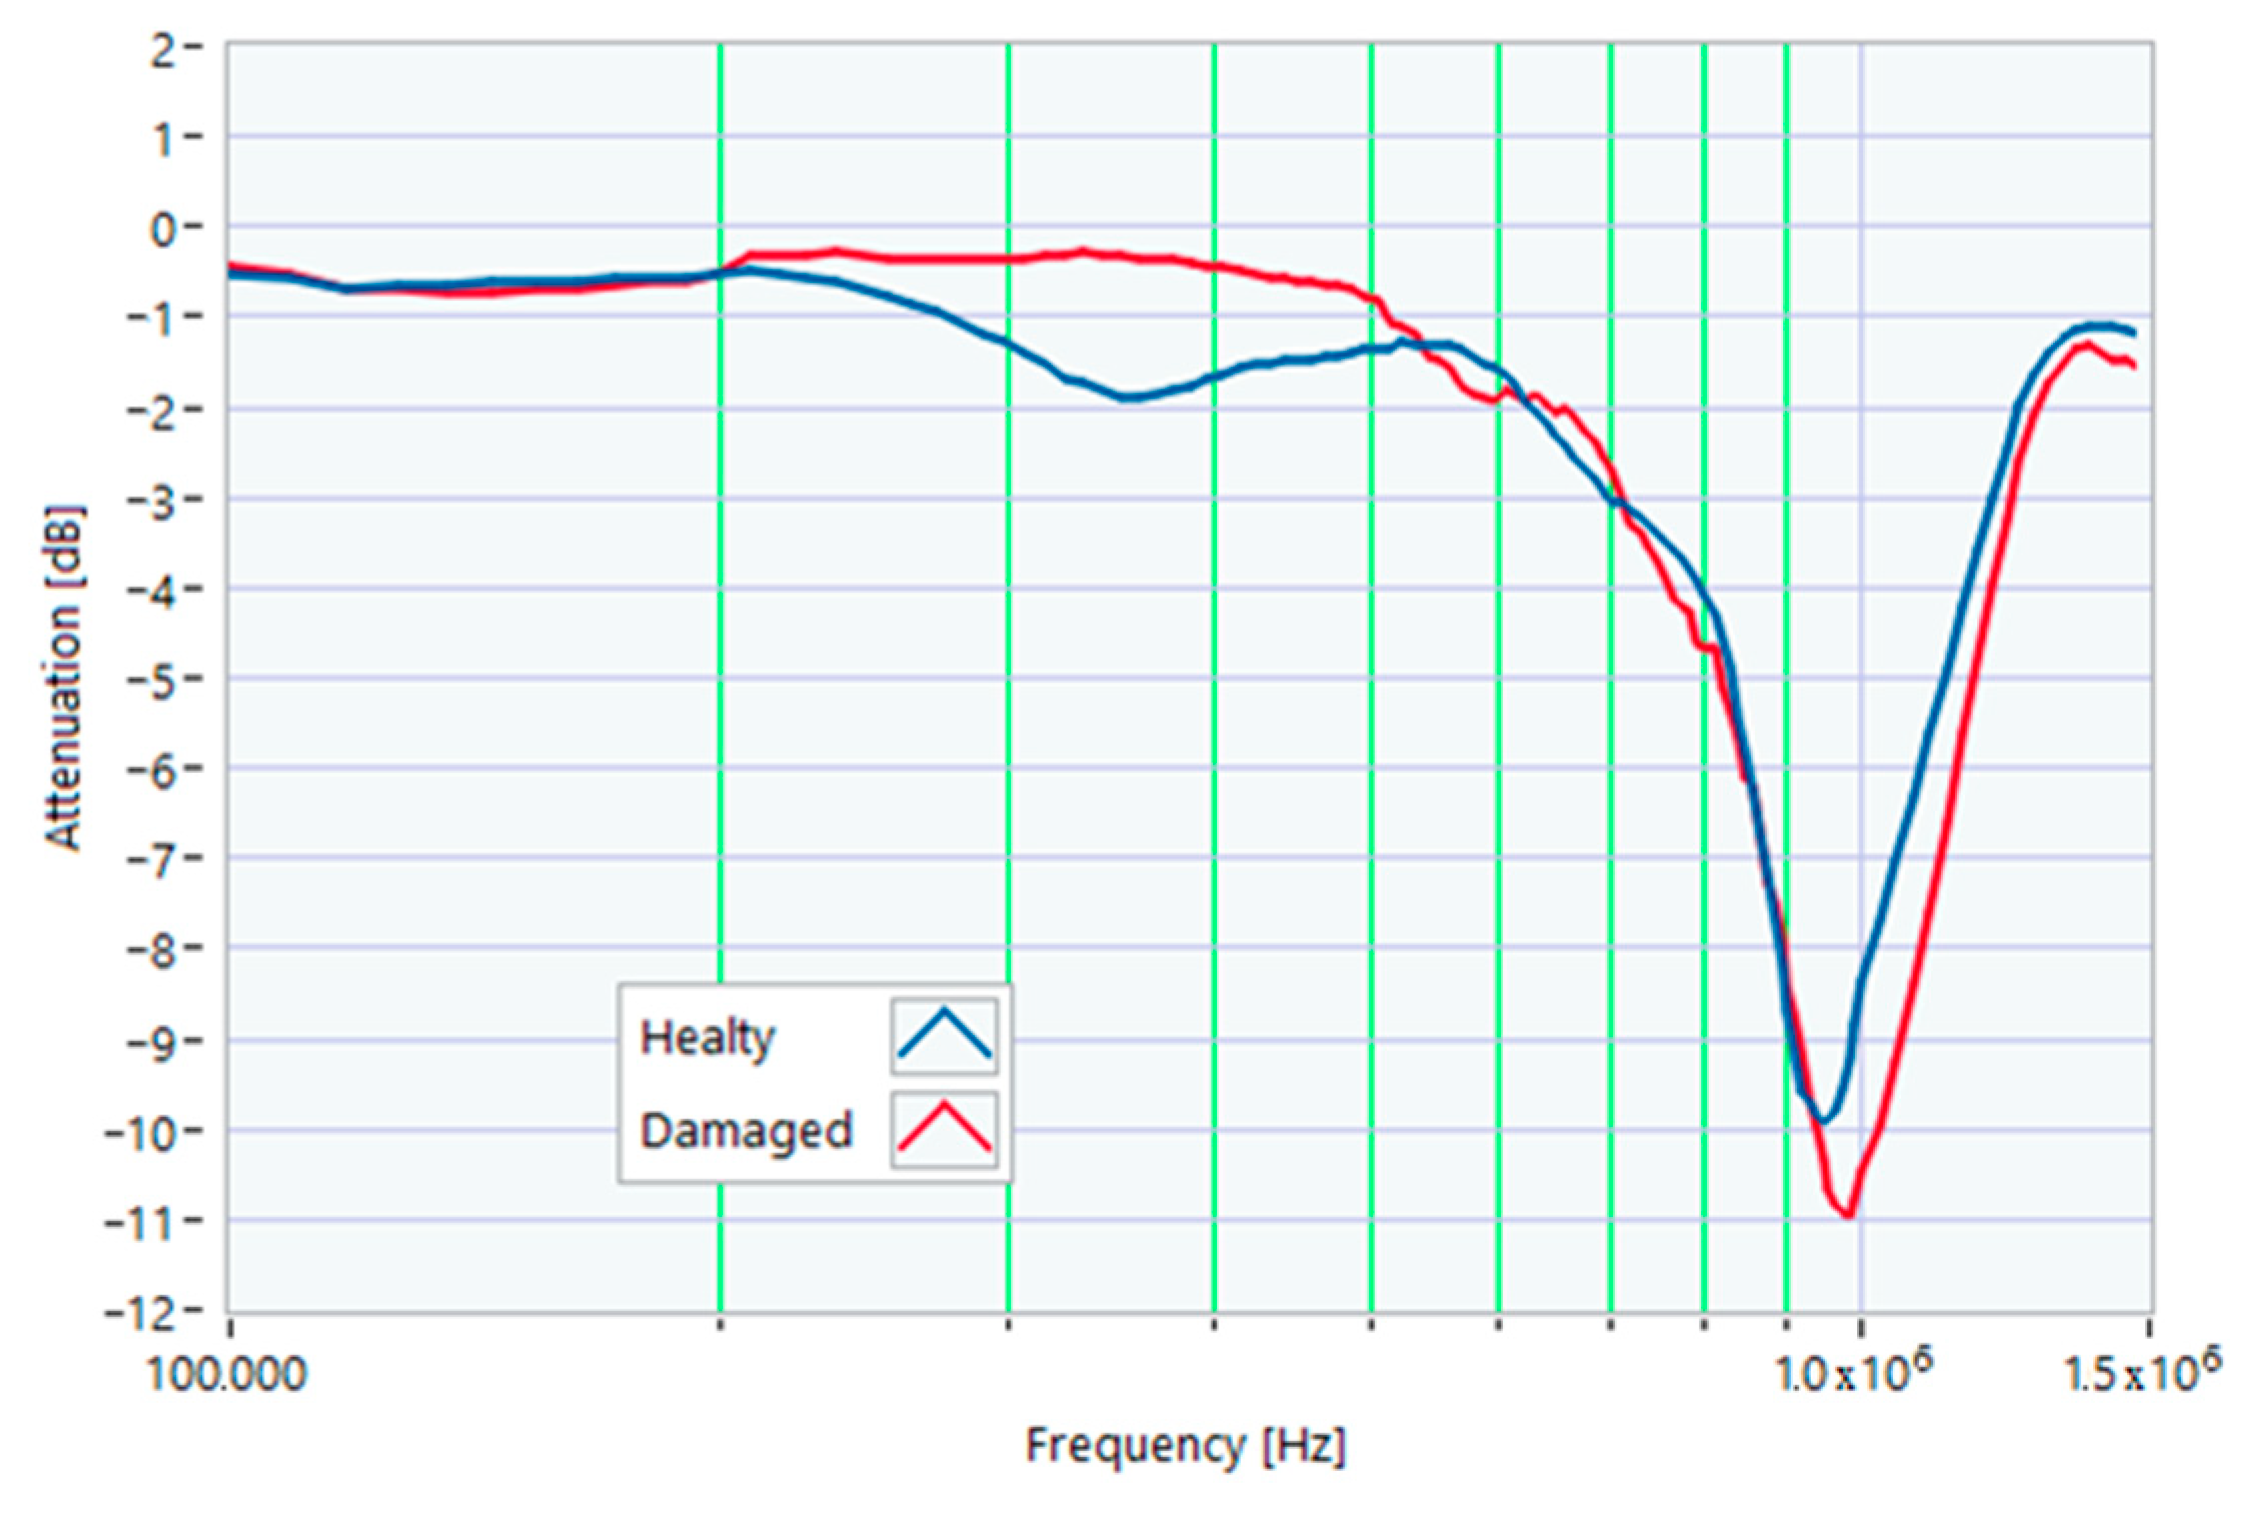
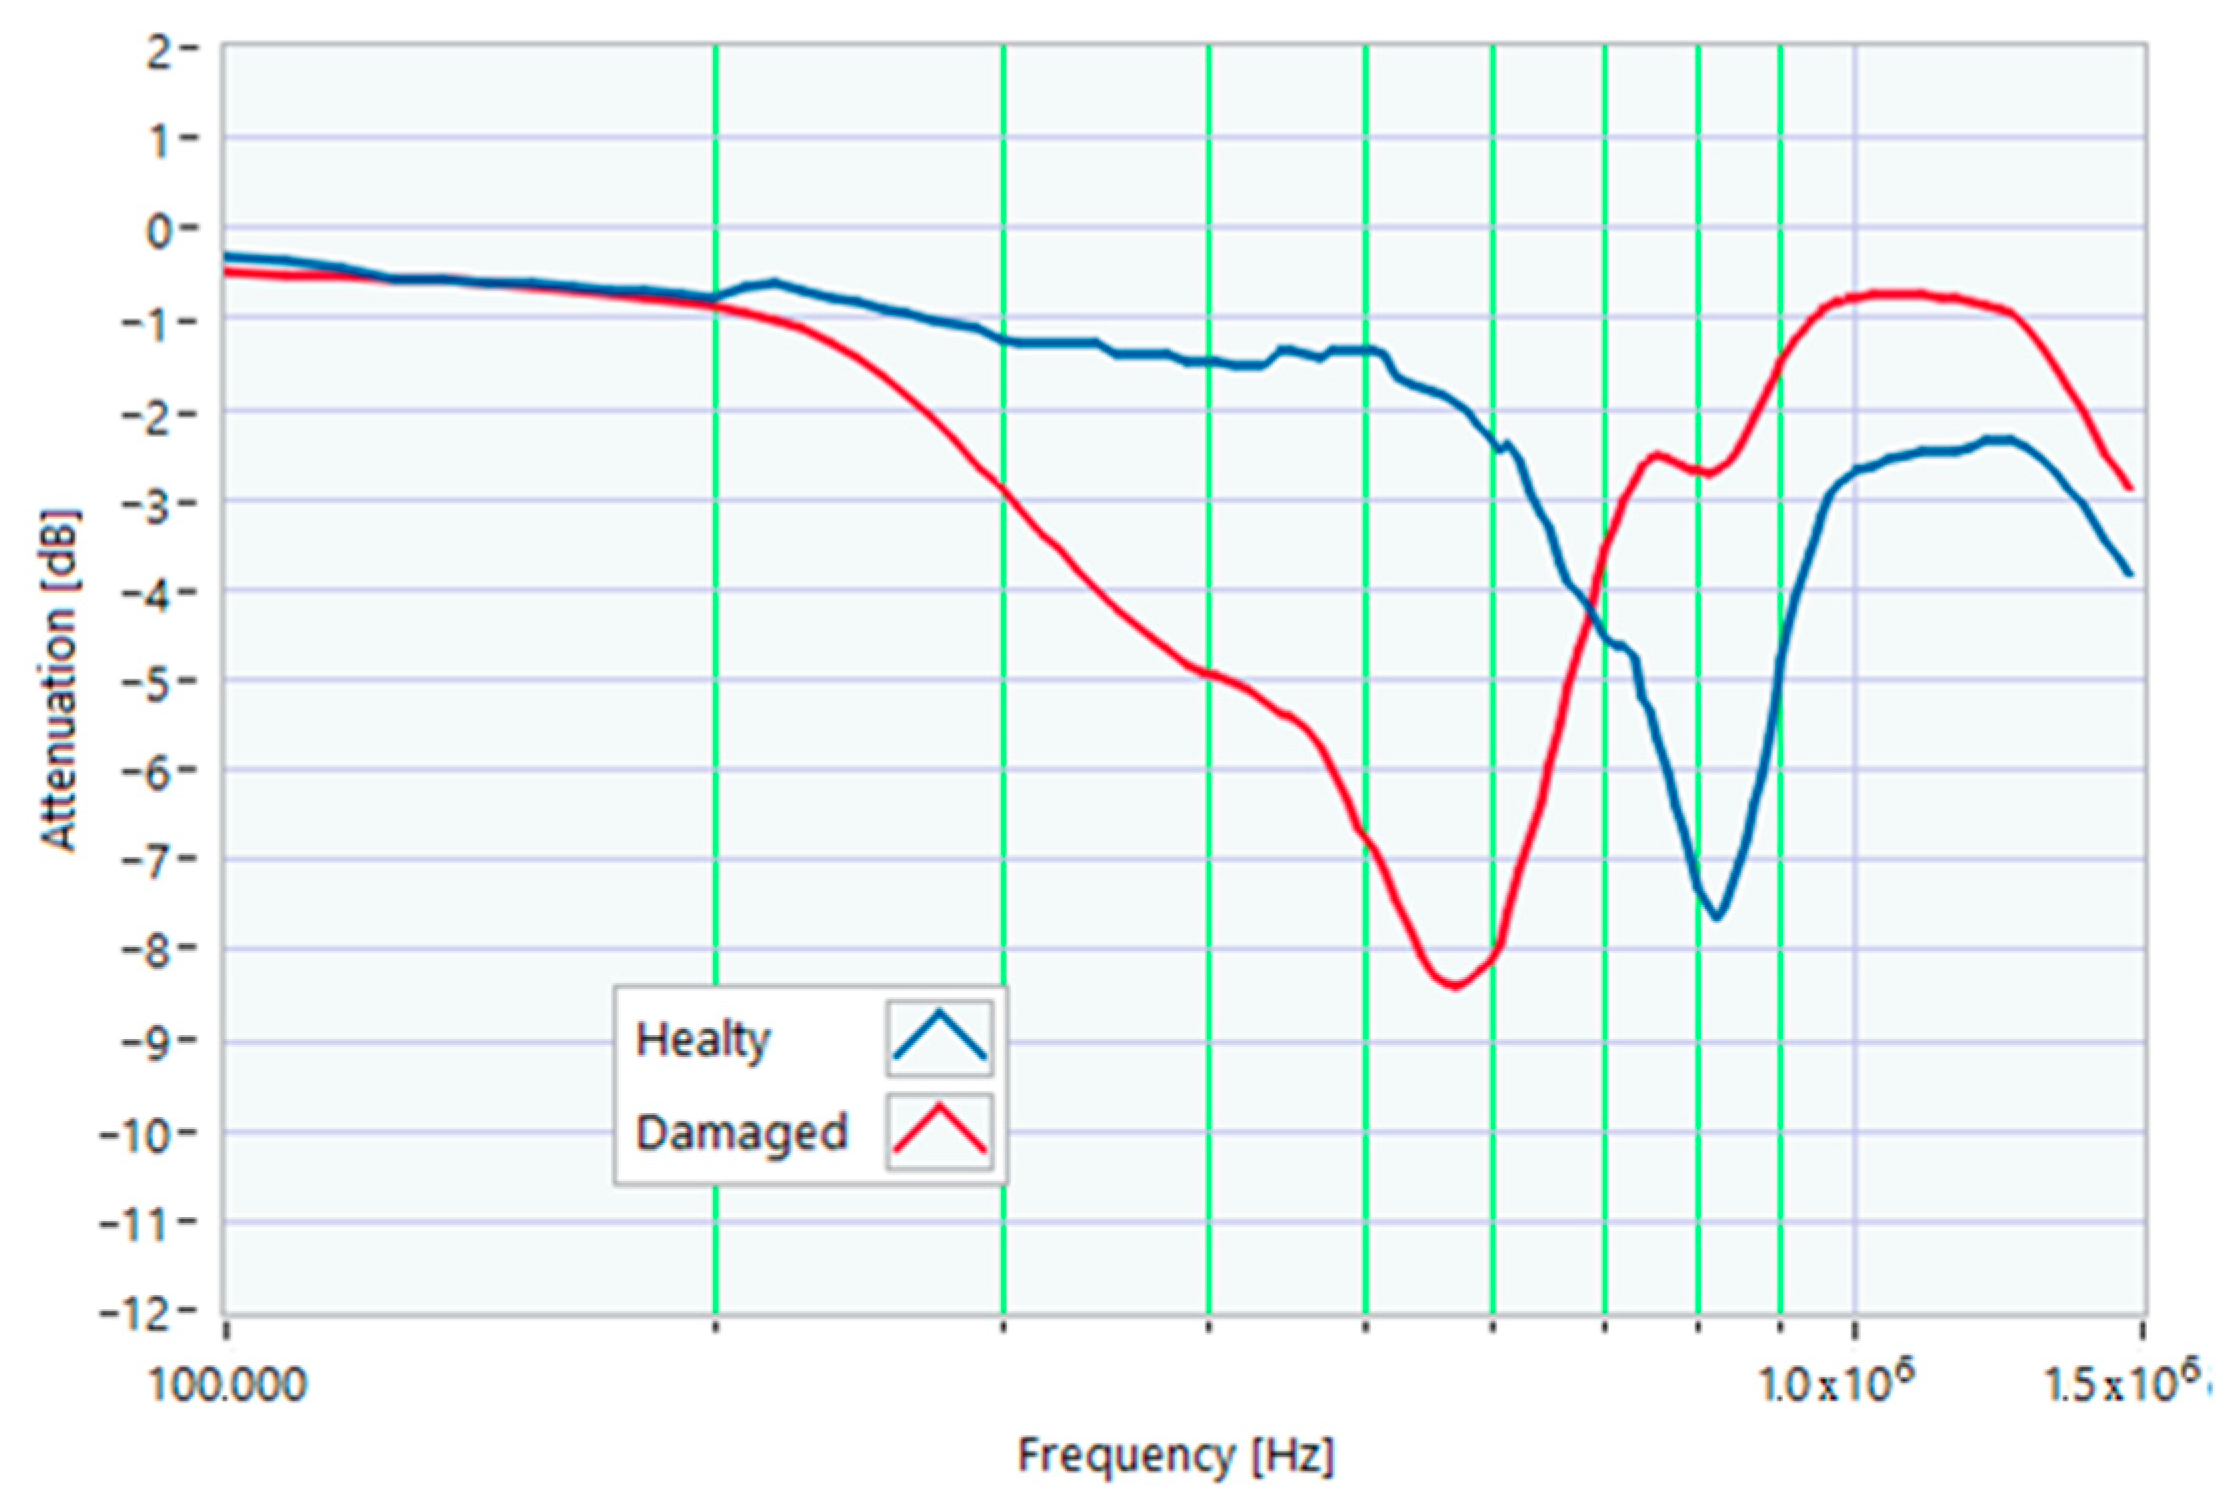
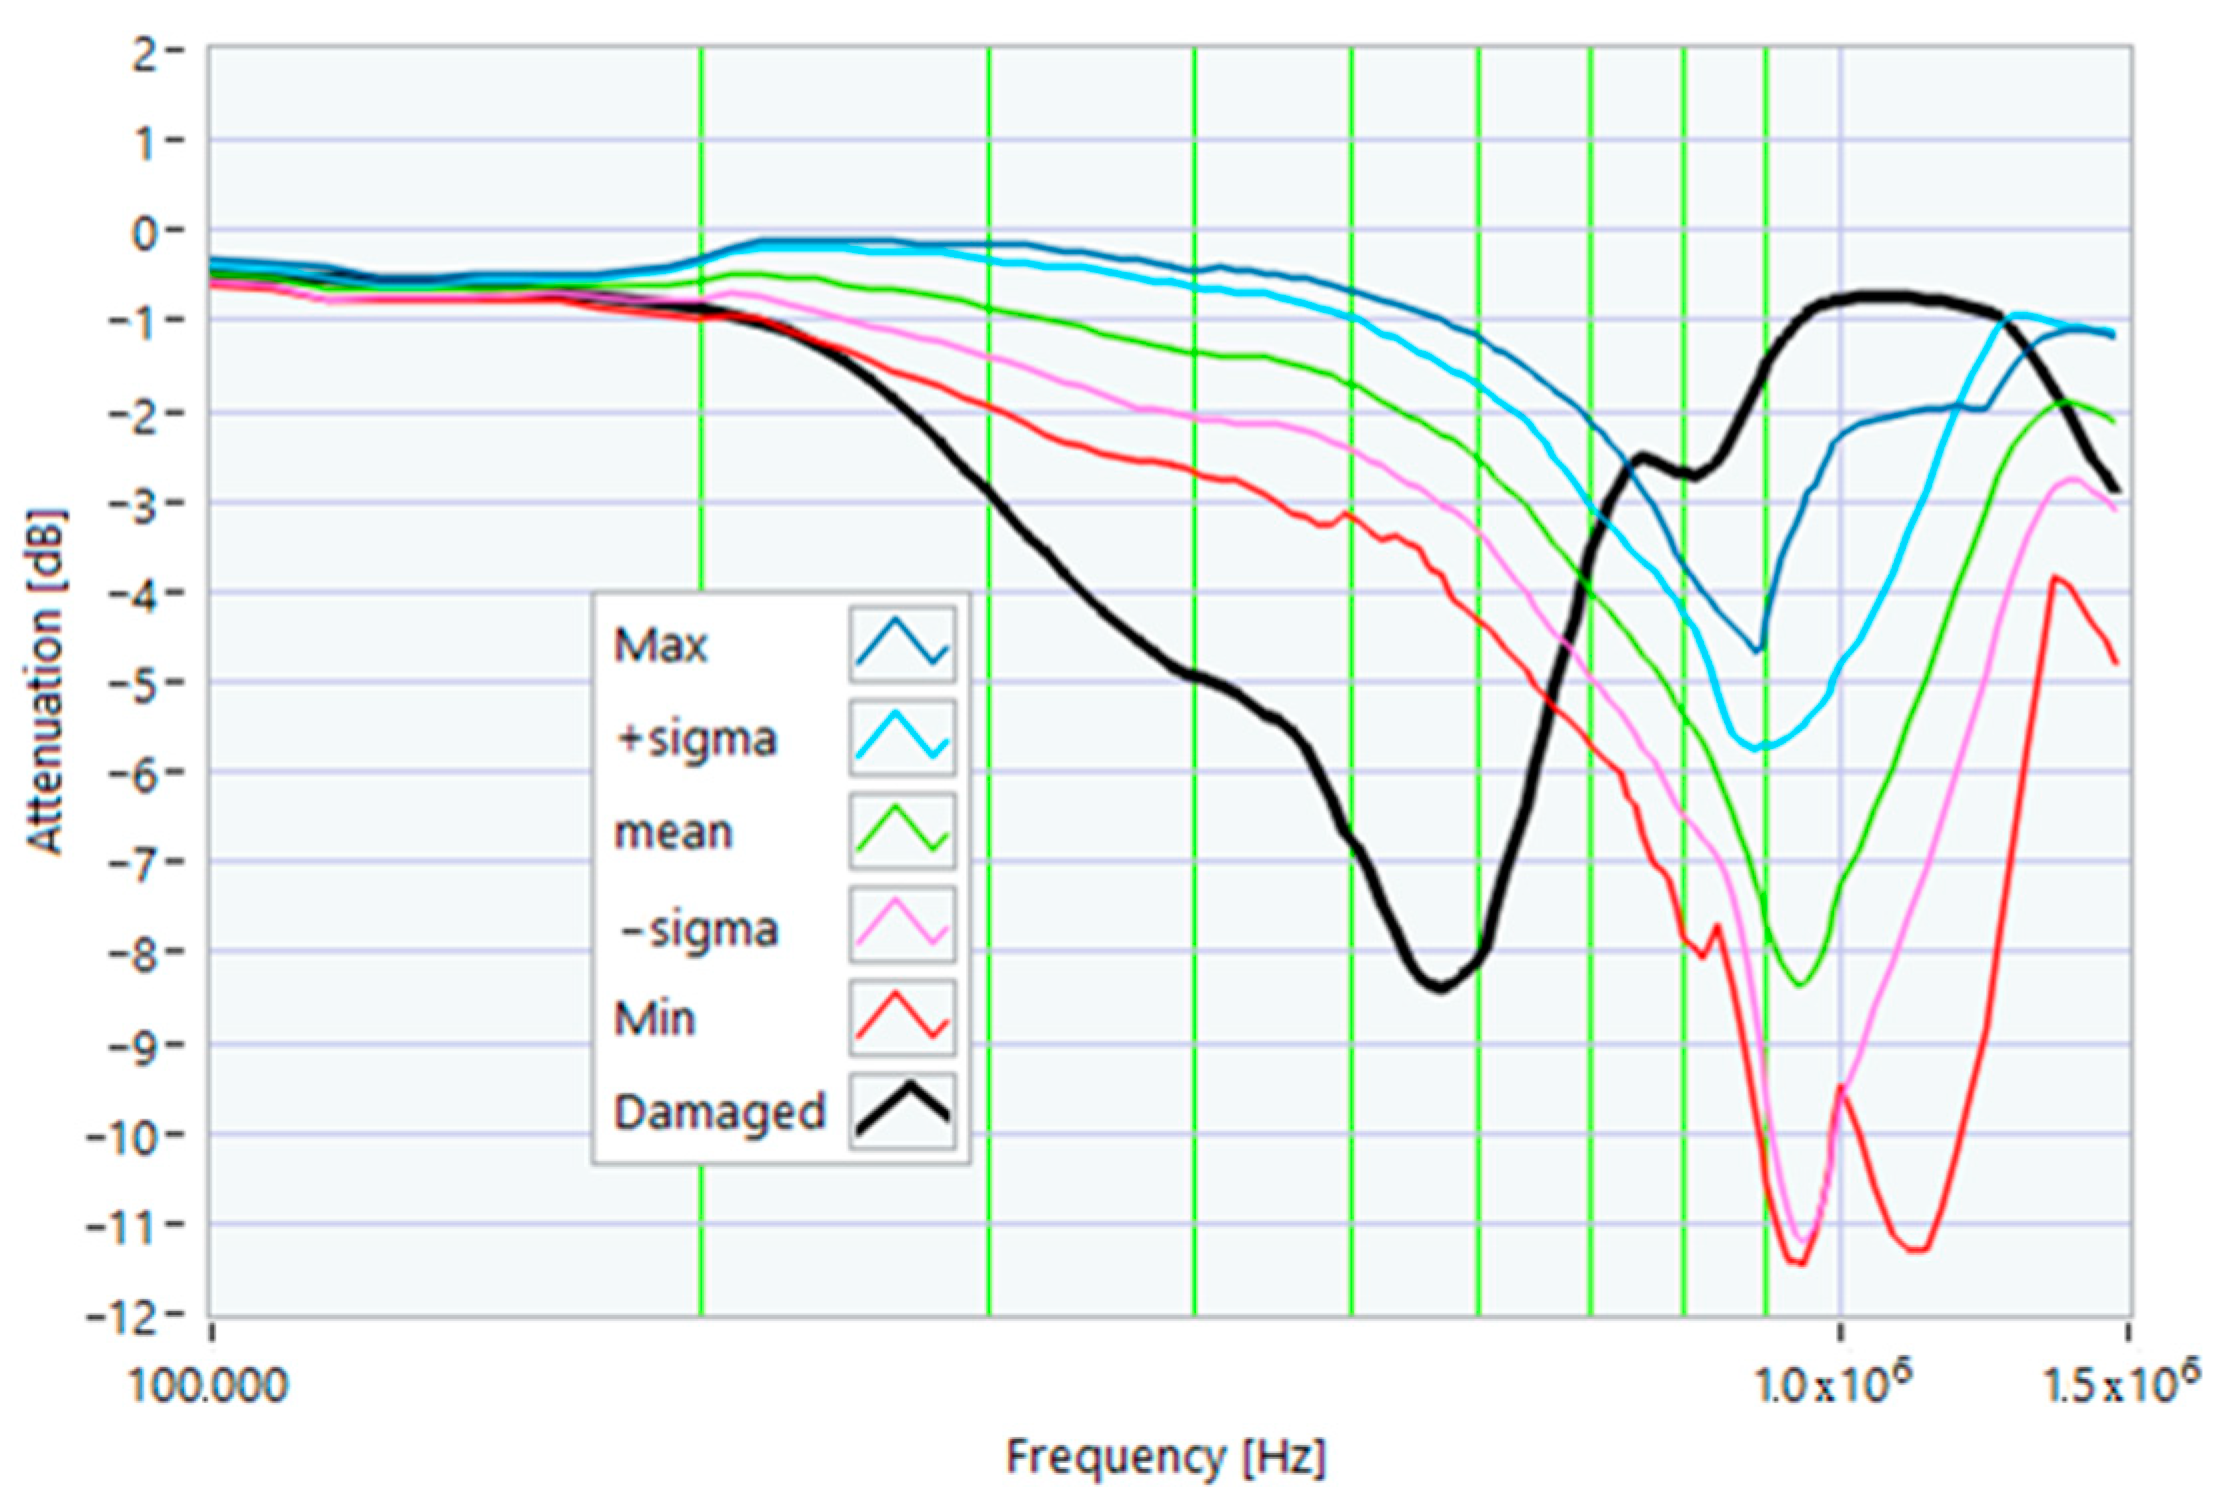
Figure 26.
Comparison between TFs of the same motor in healthy conditions and with rotor bar damage.
Figure 26.
Comparison between TFs of the same motor in healthy conditions and with rotor bar damage.
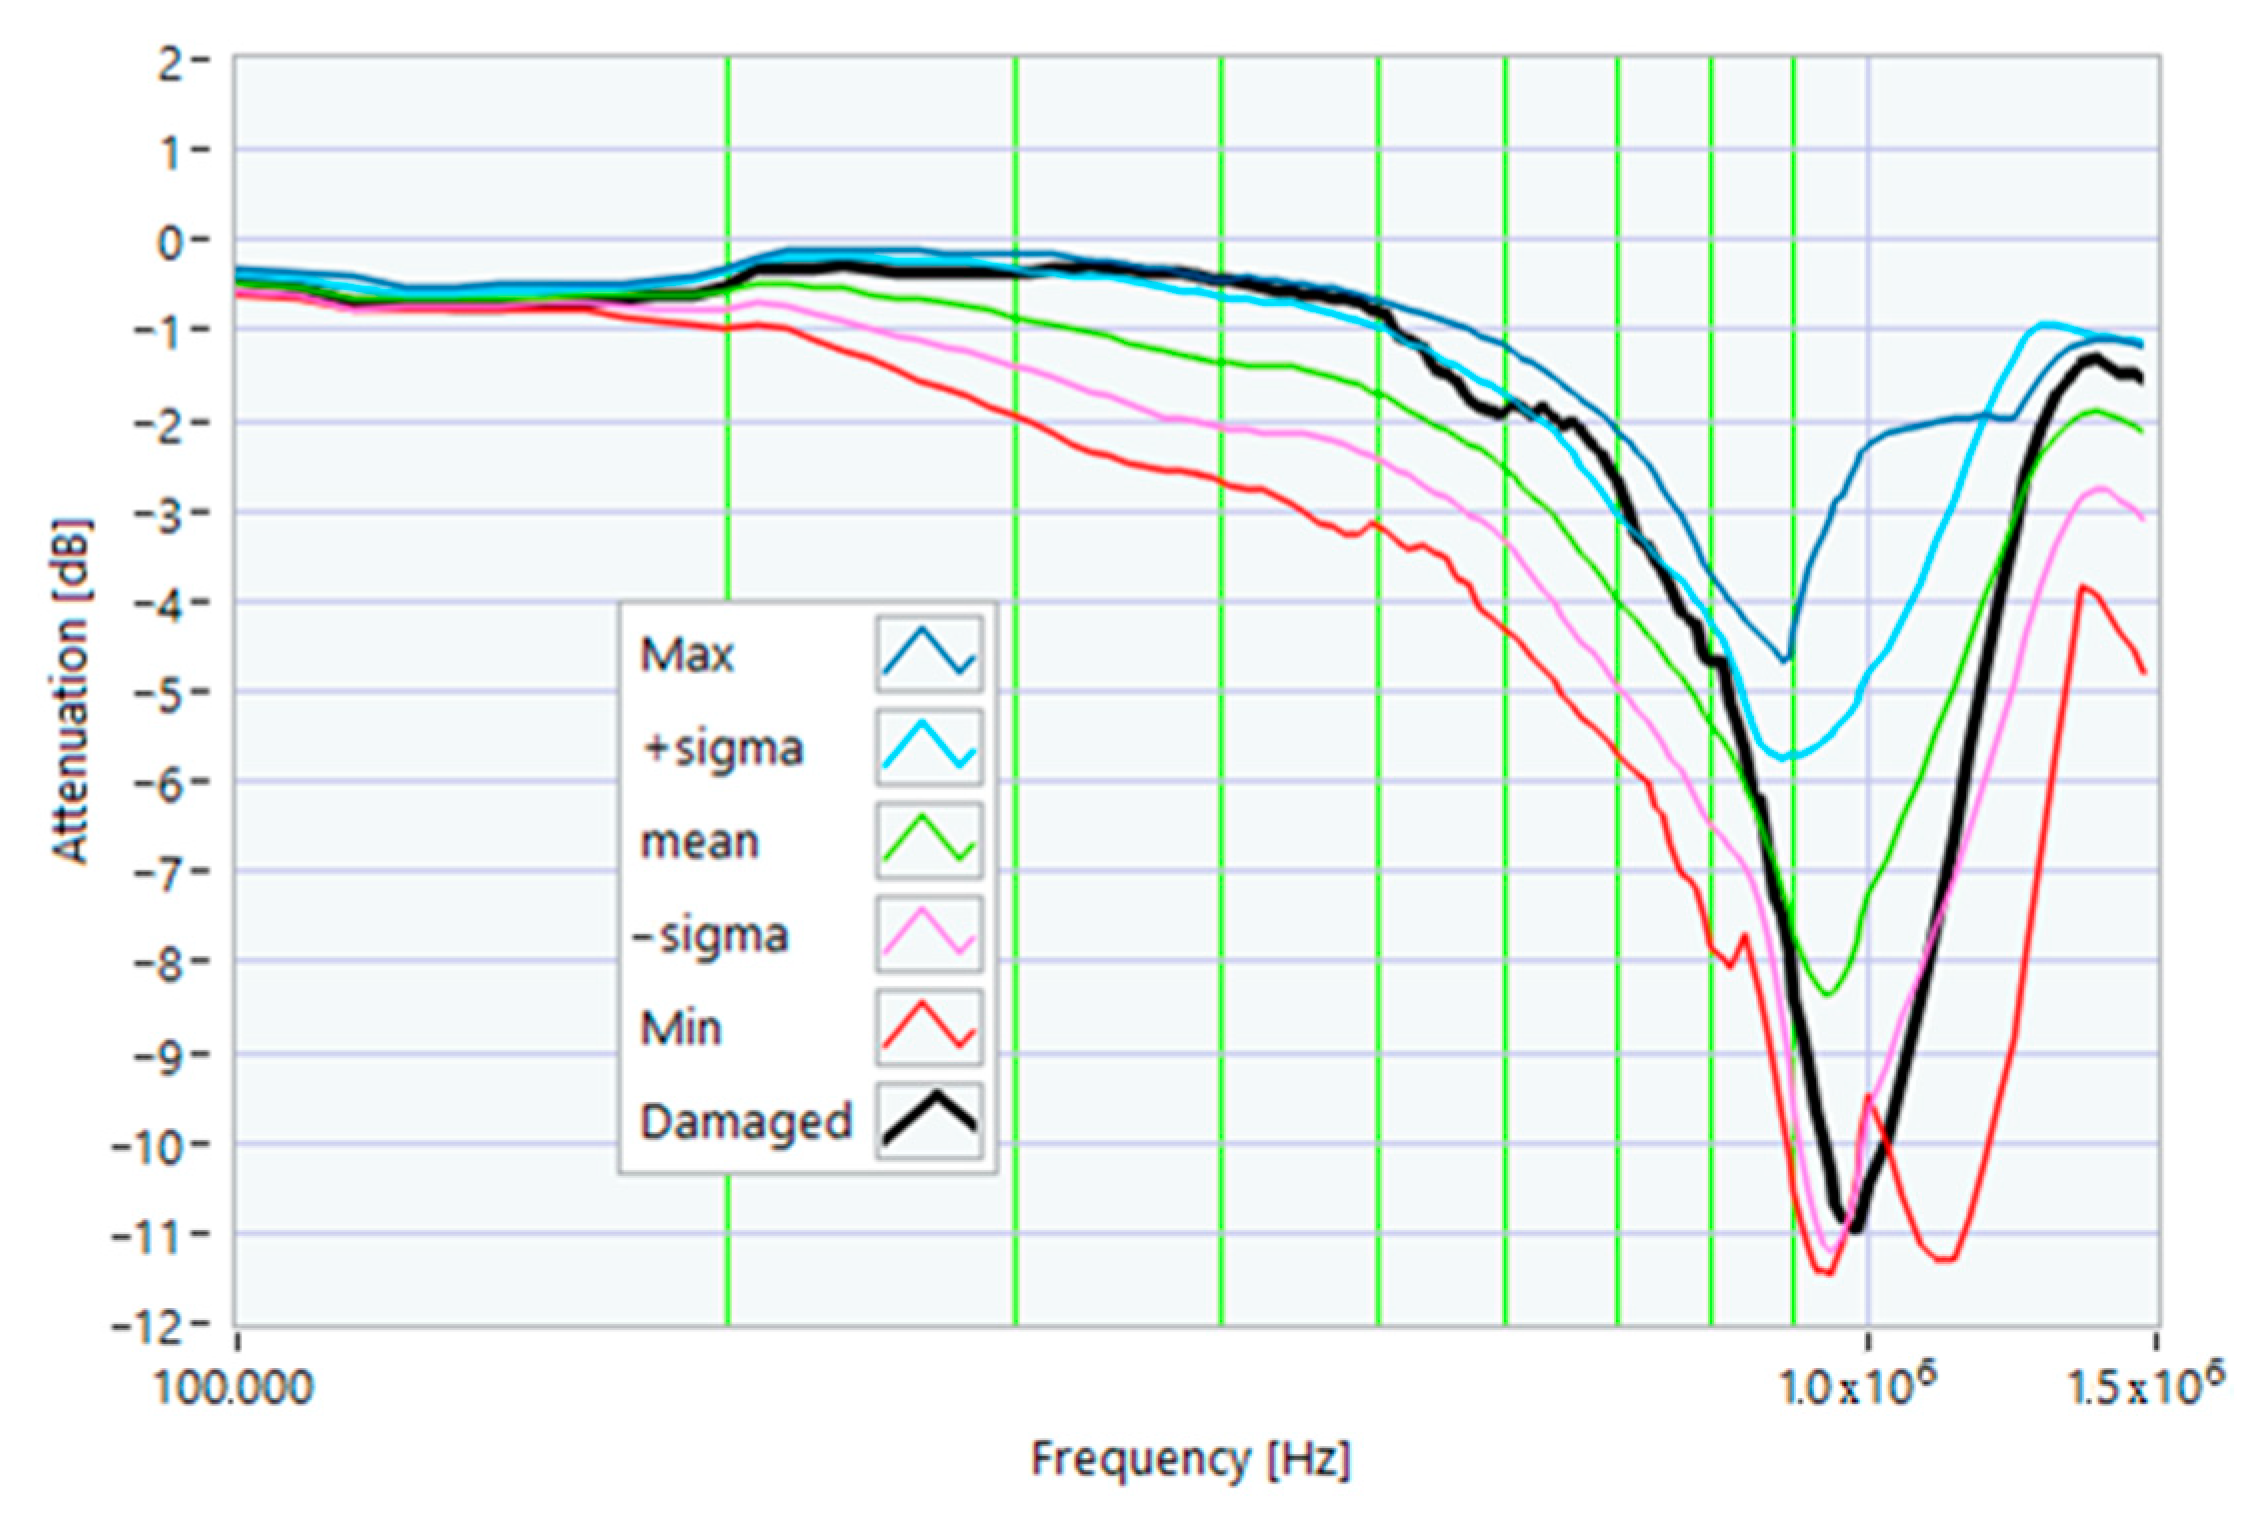
Figure 27.
Comparison of the TF of a motor with shorting ring damage with the reference TFs.
Figure 27.
Comparison of the TF of a motor with shorting ring damage with the reference TFs.
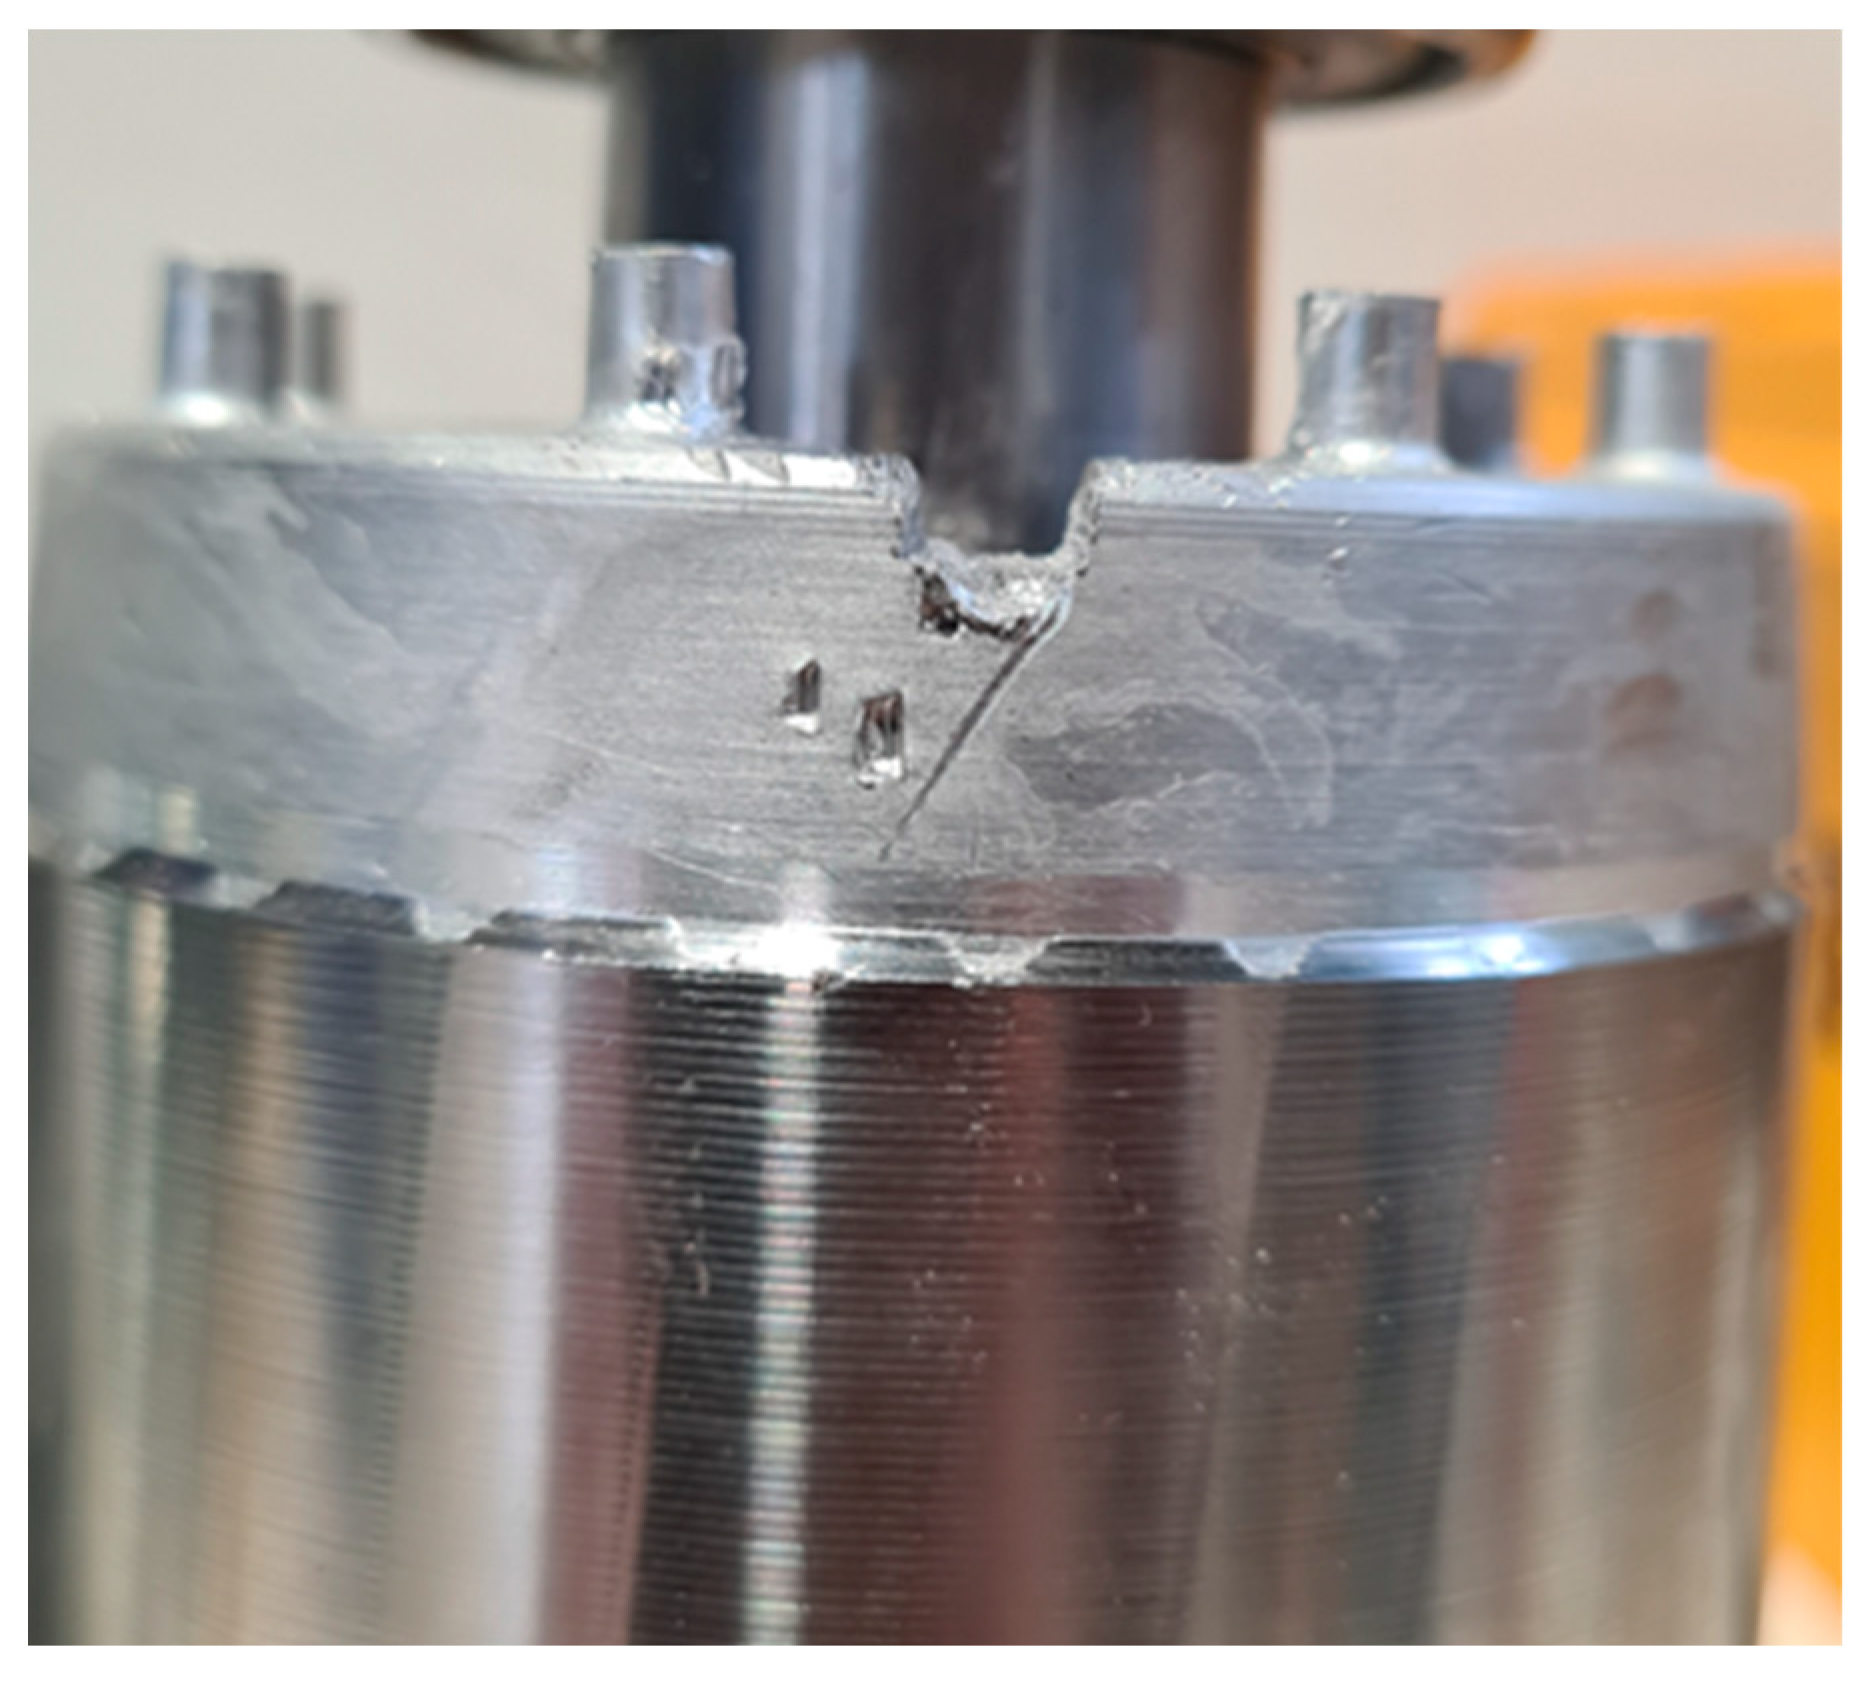
Figure 28.
Rotor group fall.
Figure 28.
Rotor group fall.
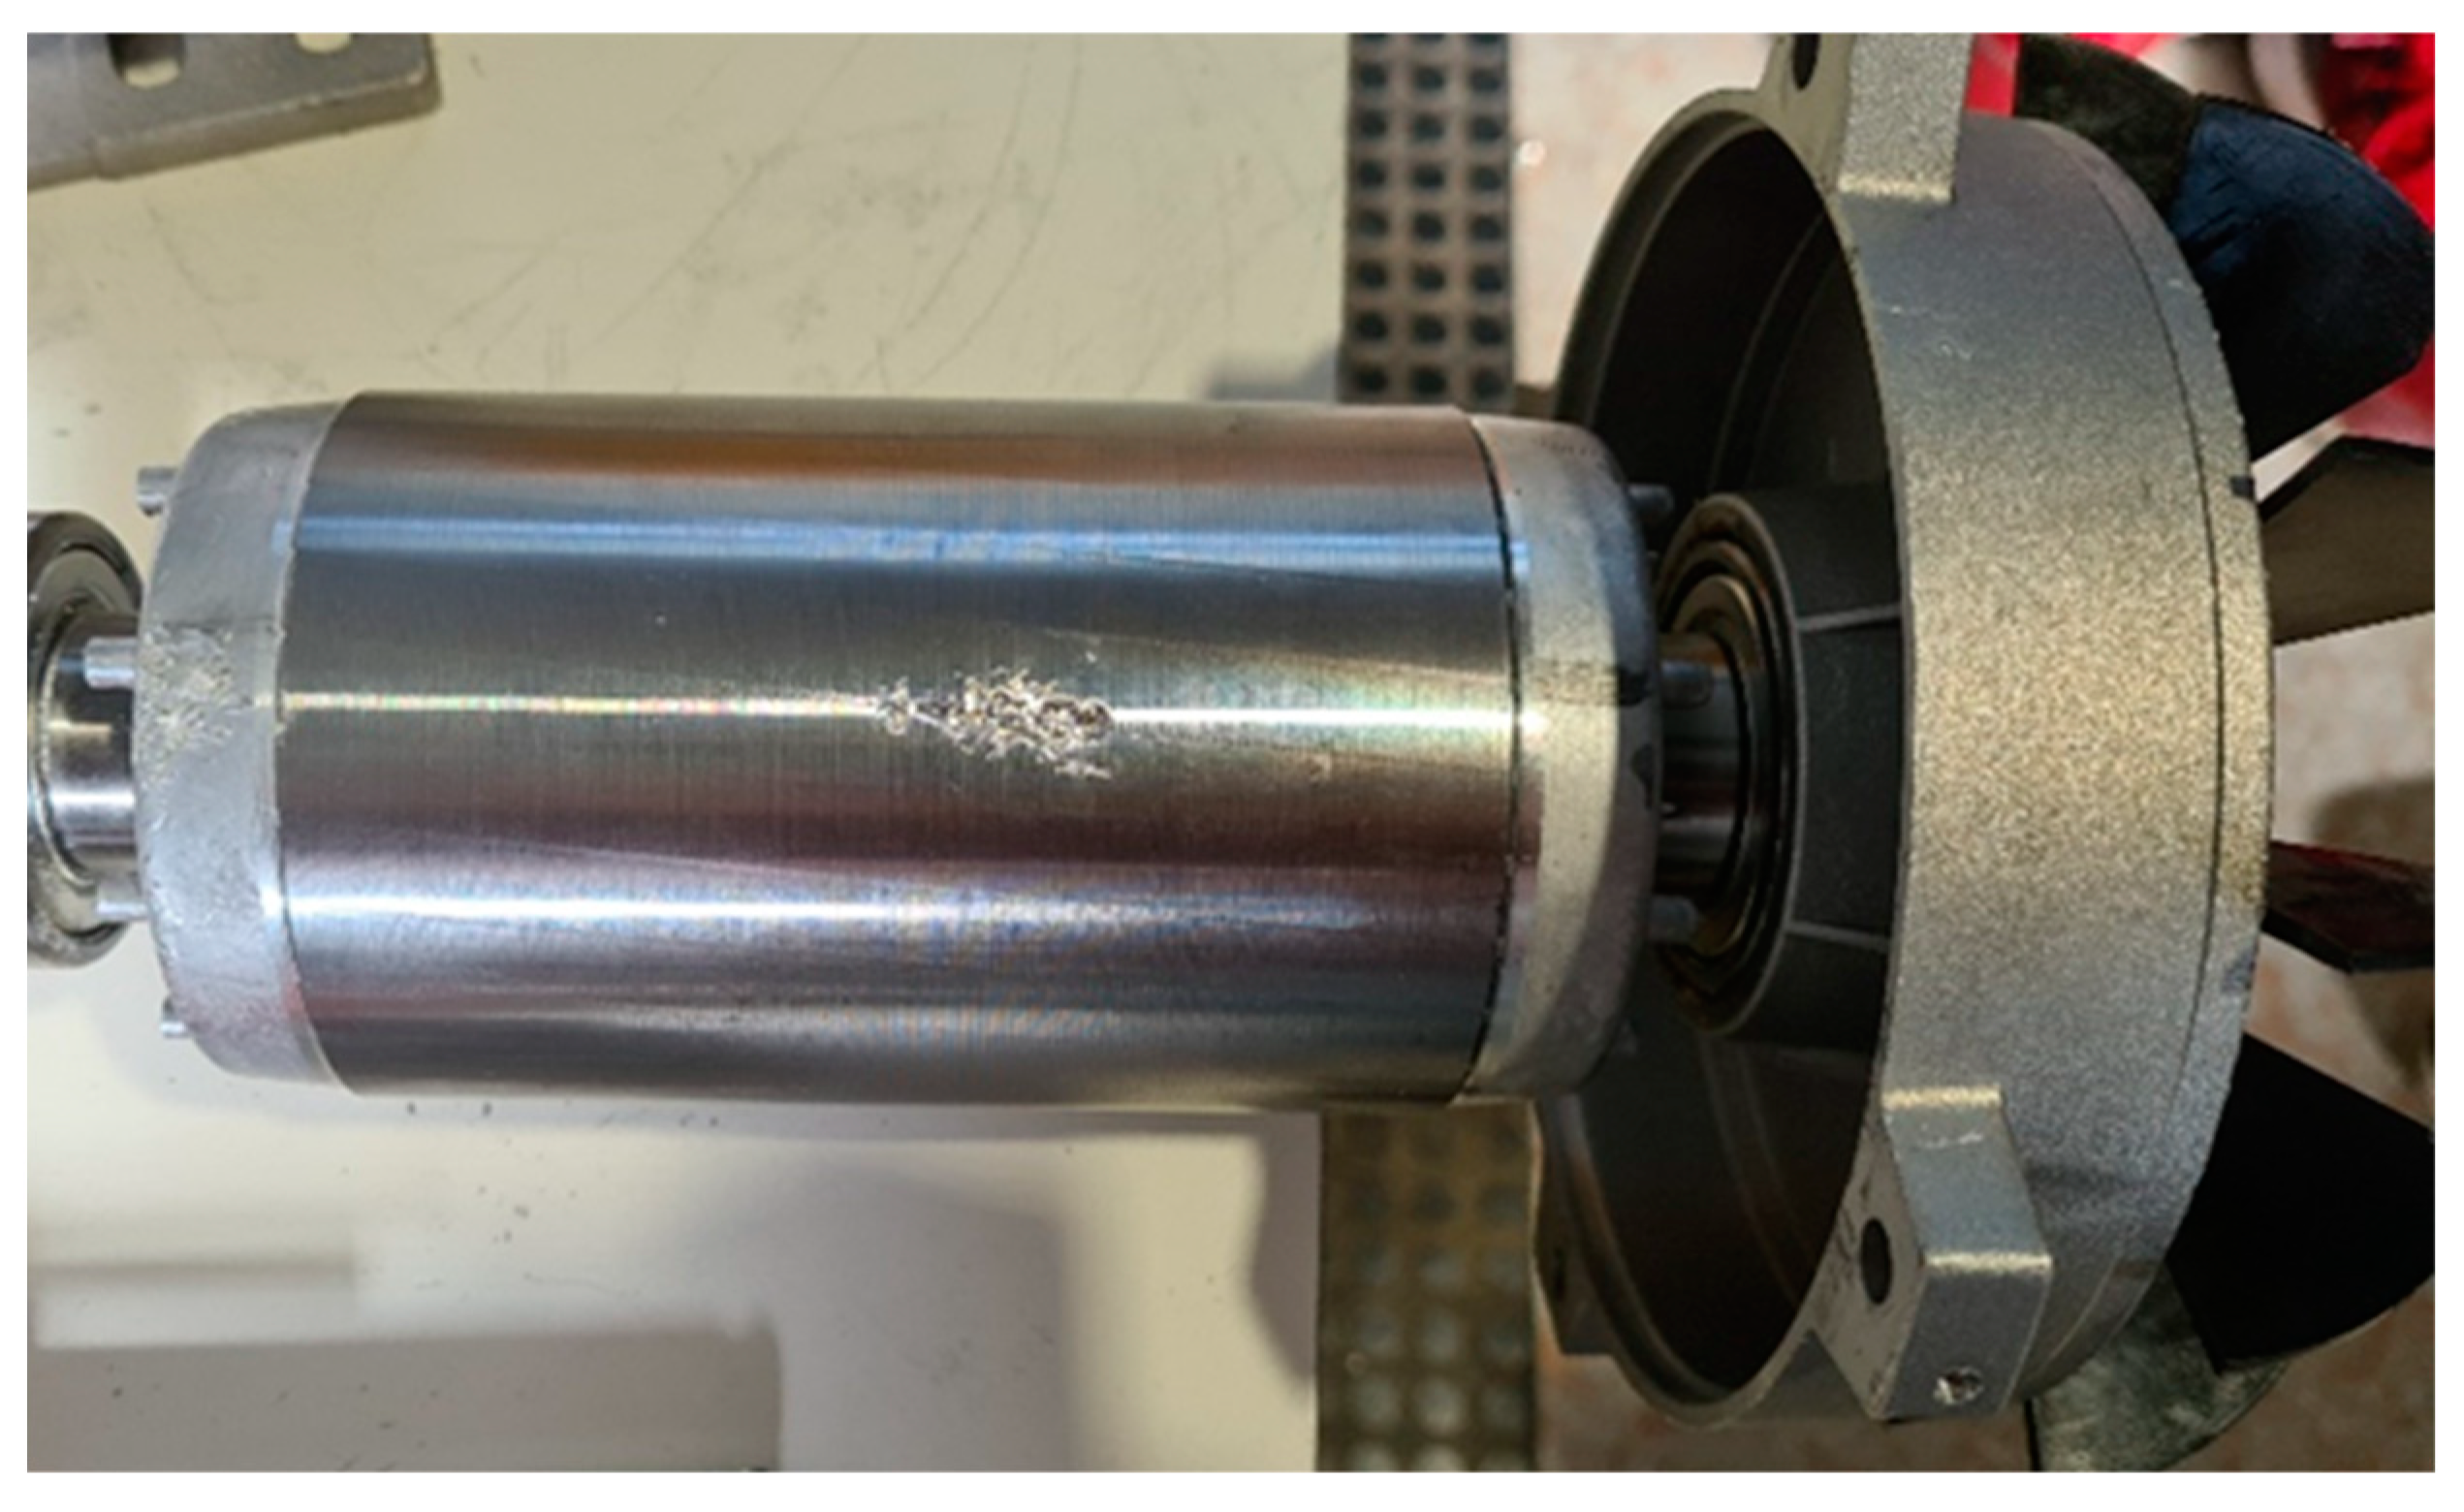
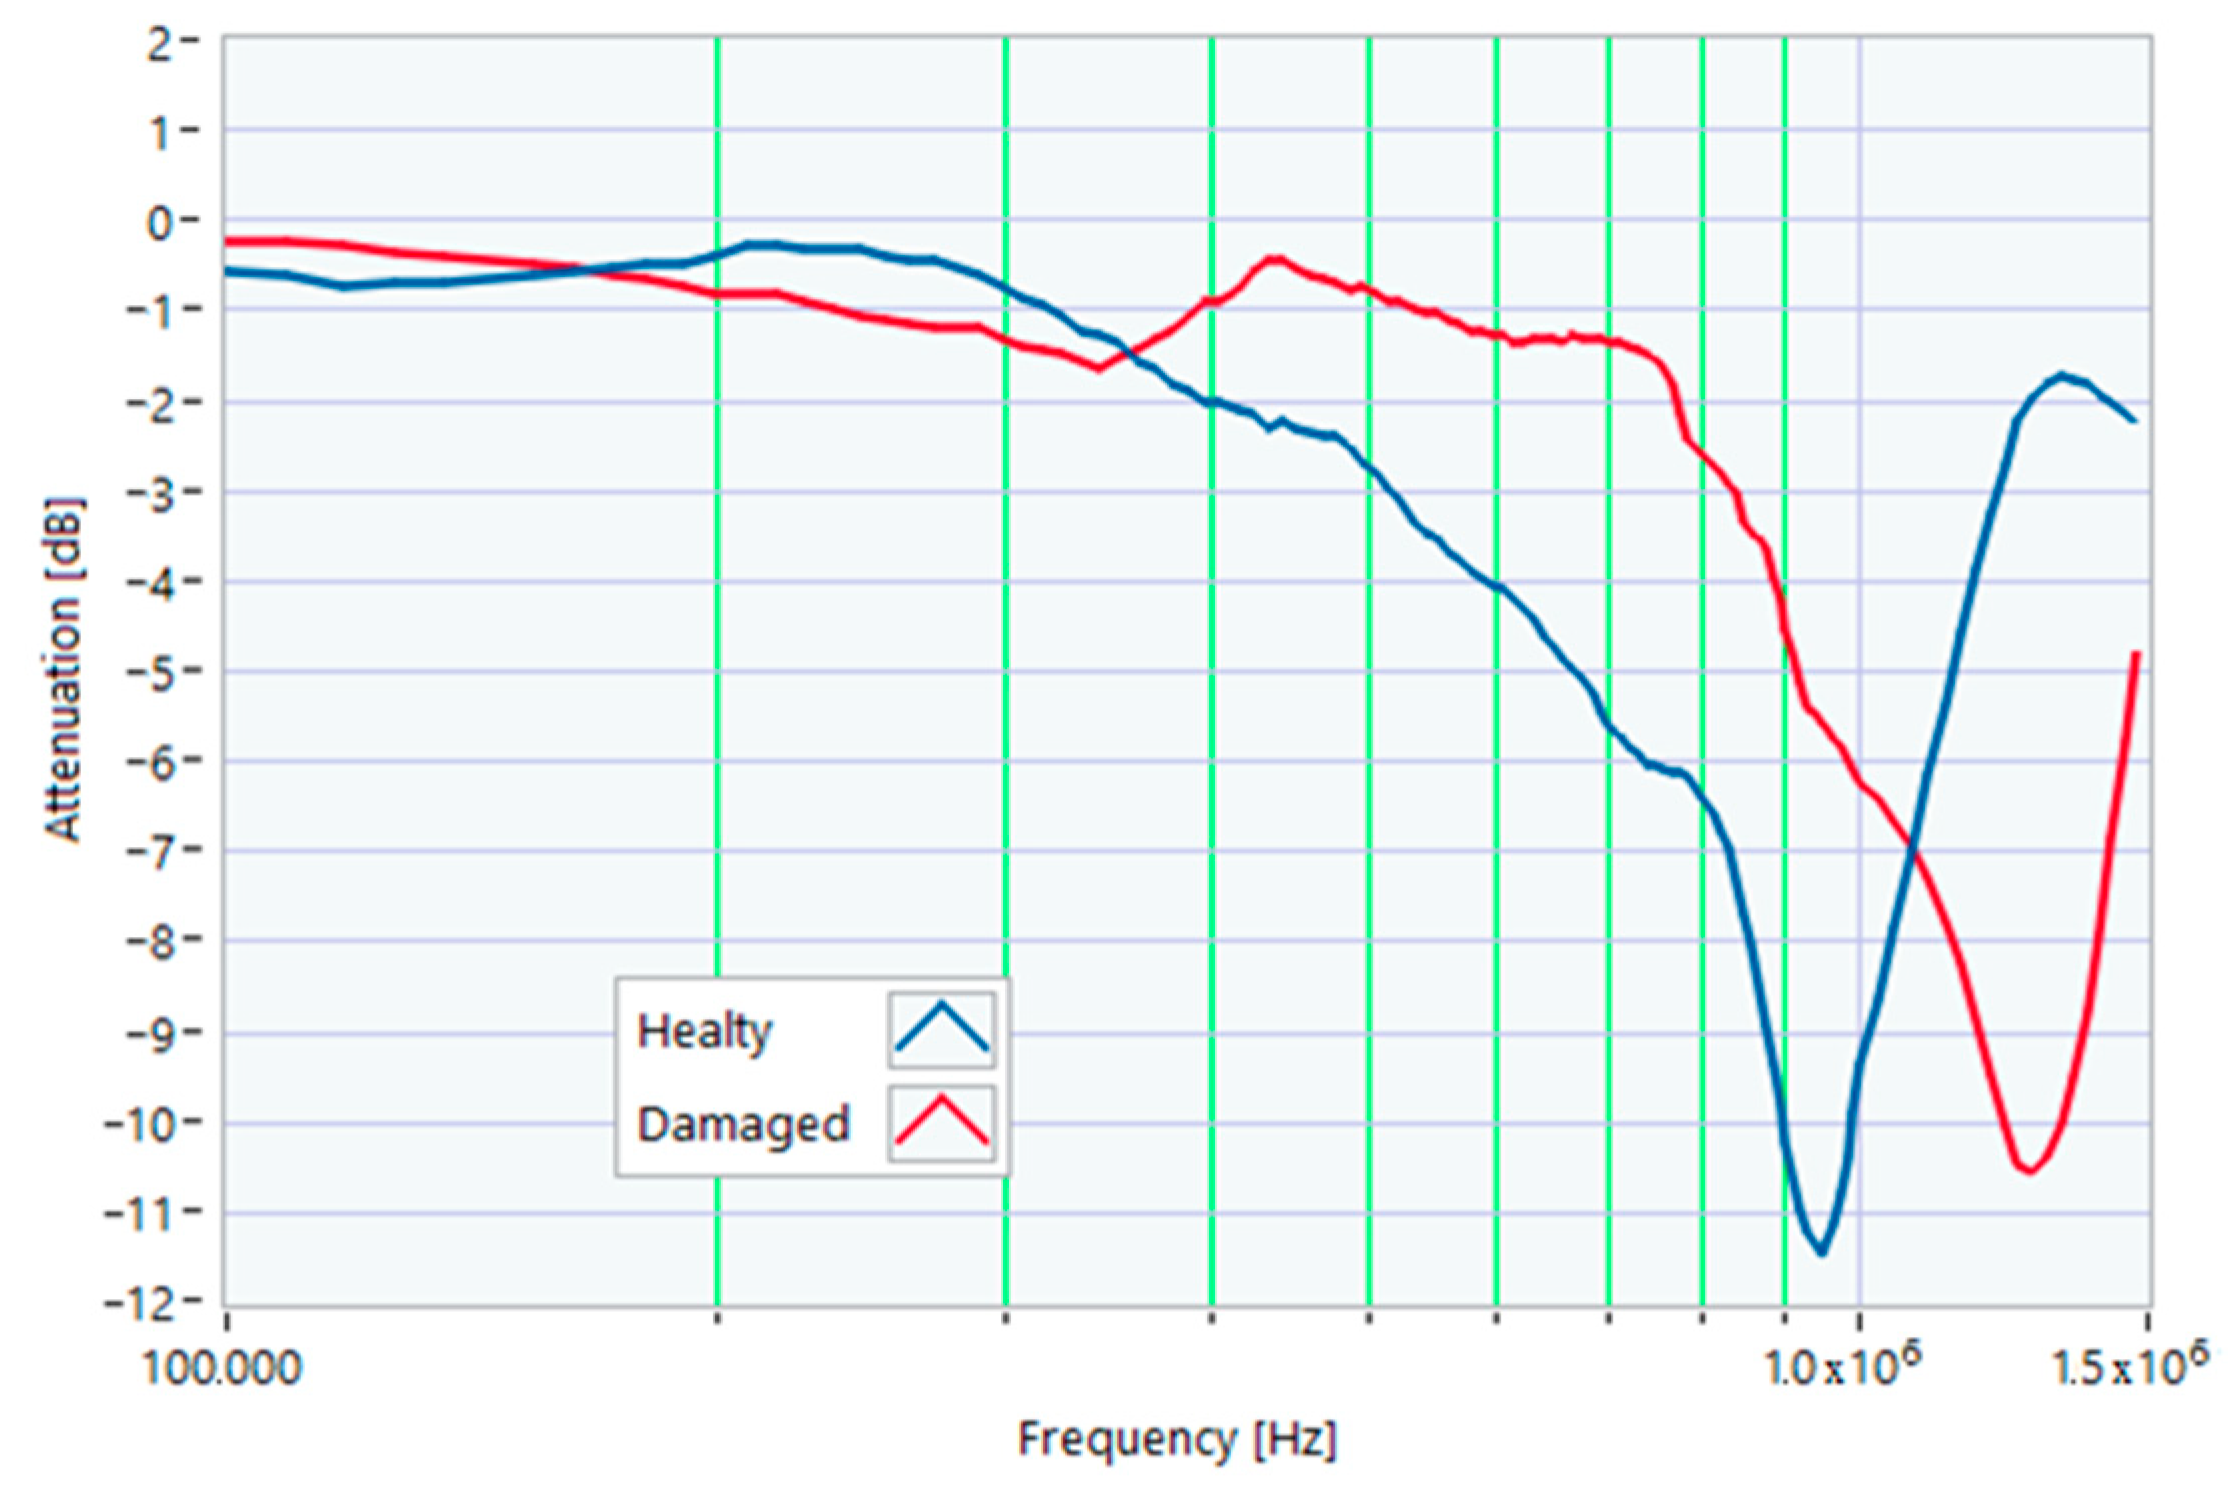
Figure 29.
Comparison between TFs of the same motor in healthy conditions and after the rotor group fell from a height of 1 m.
Figure 29.
Comparison between TFs of the same motor in healthy conditions and after the rotor group fell from a height of 1 m.
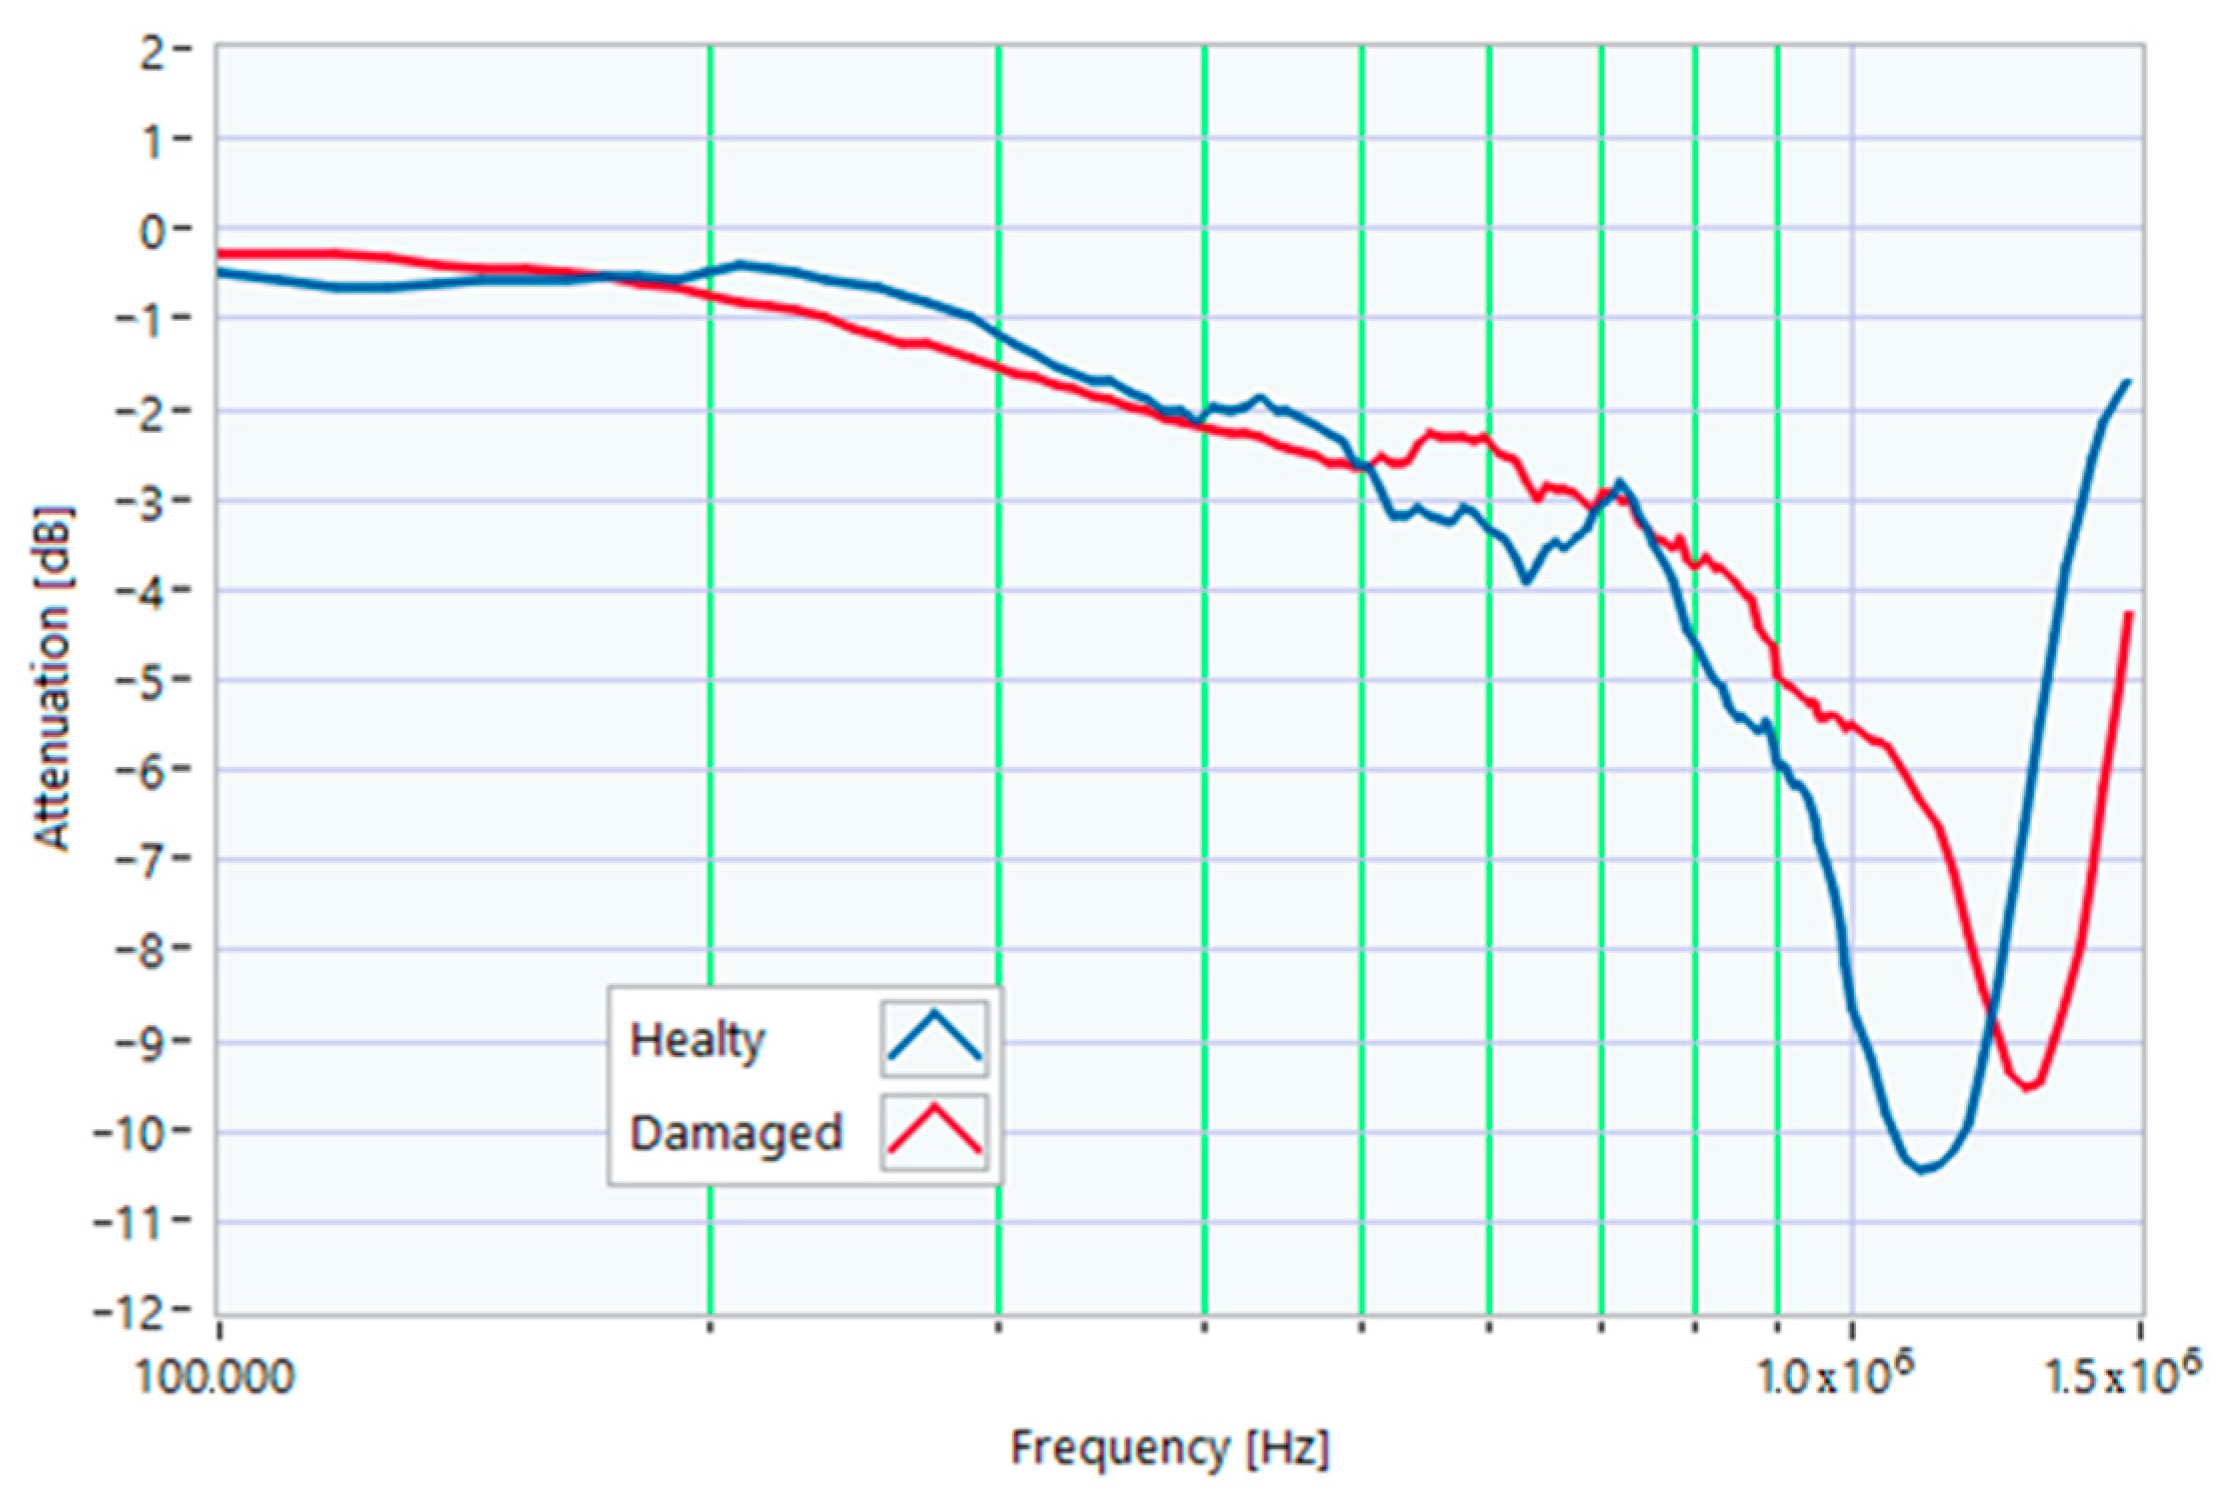
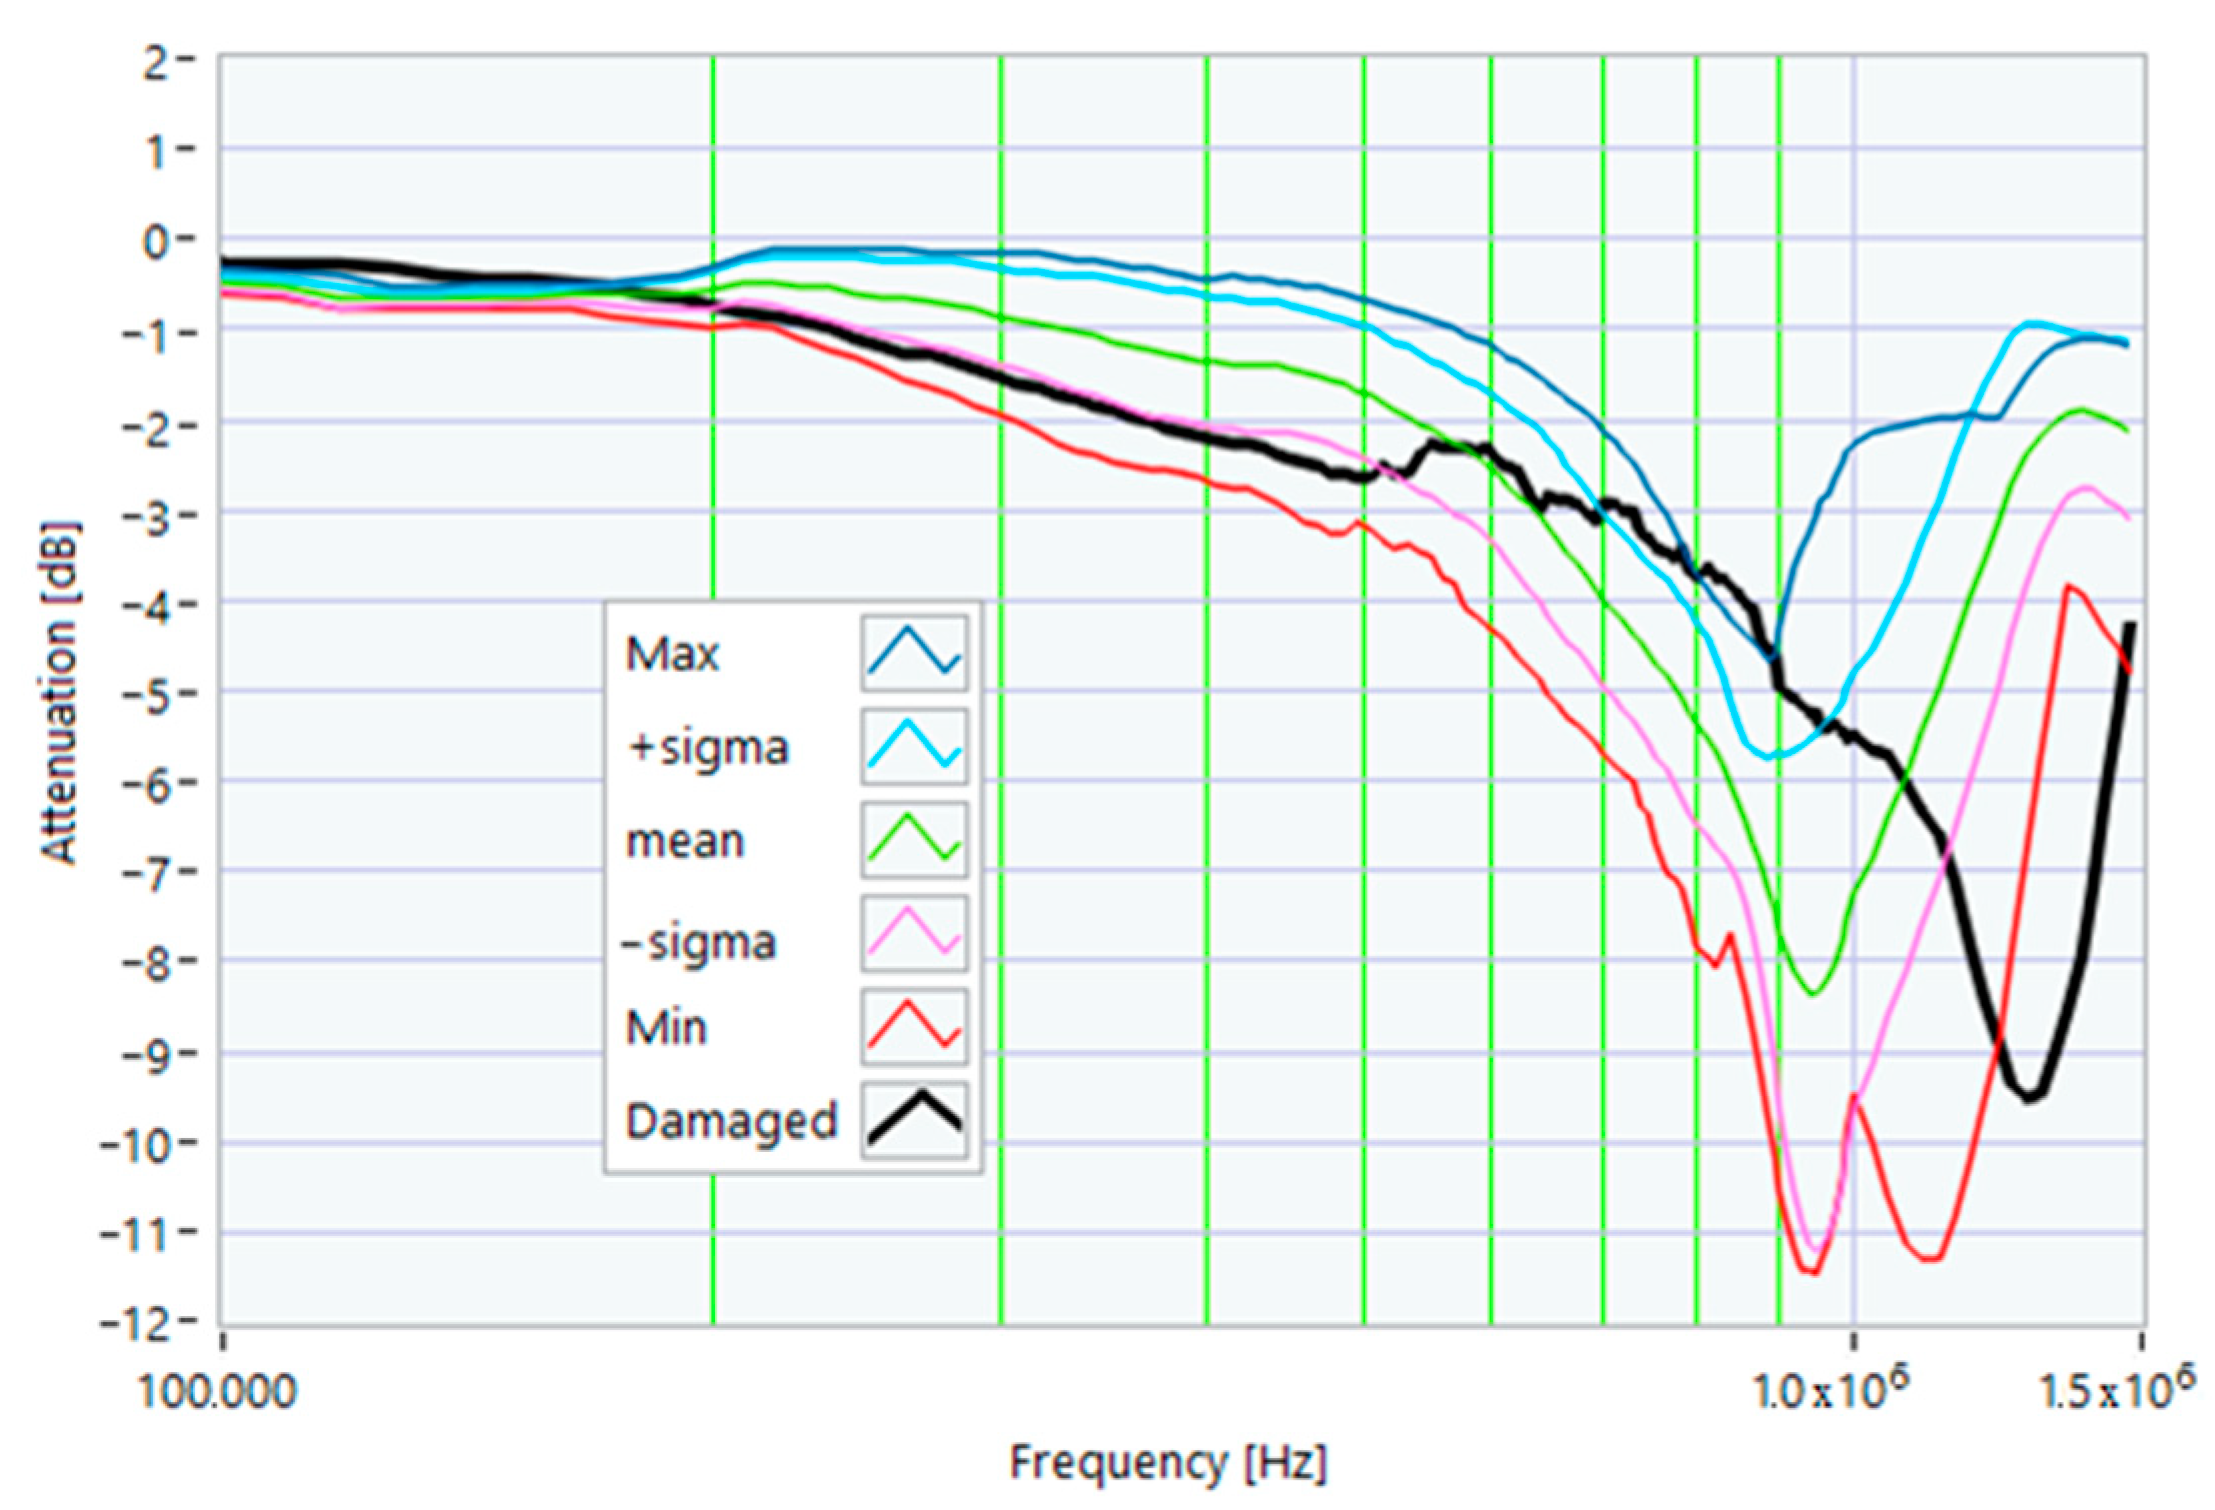
Figure 30.
Comparison of the TF of a motor after the rotor group fell from a height of 1 m with the reference TFs.
Figure 30.
Comparison of the TF of a motor after the rotor group fell from a height of 1 m with the reference TFs.
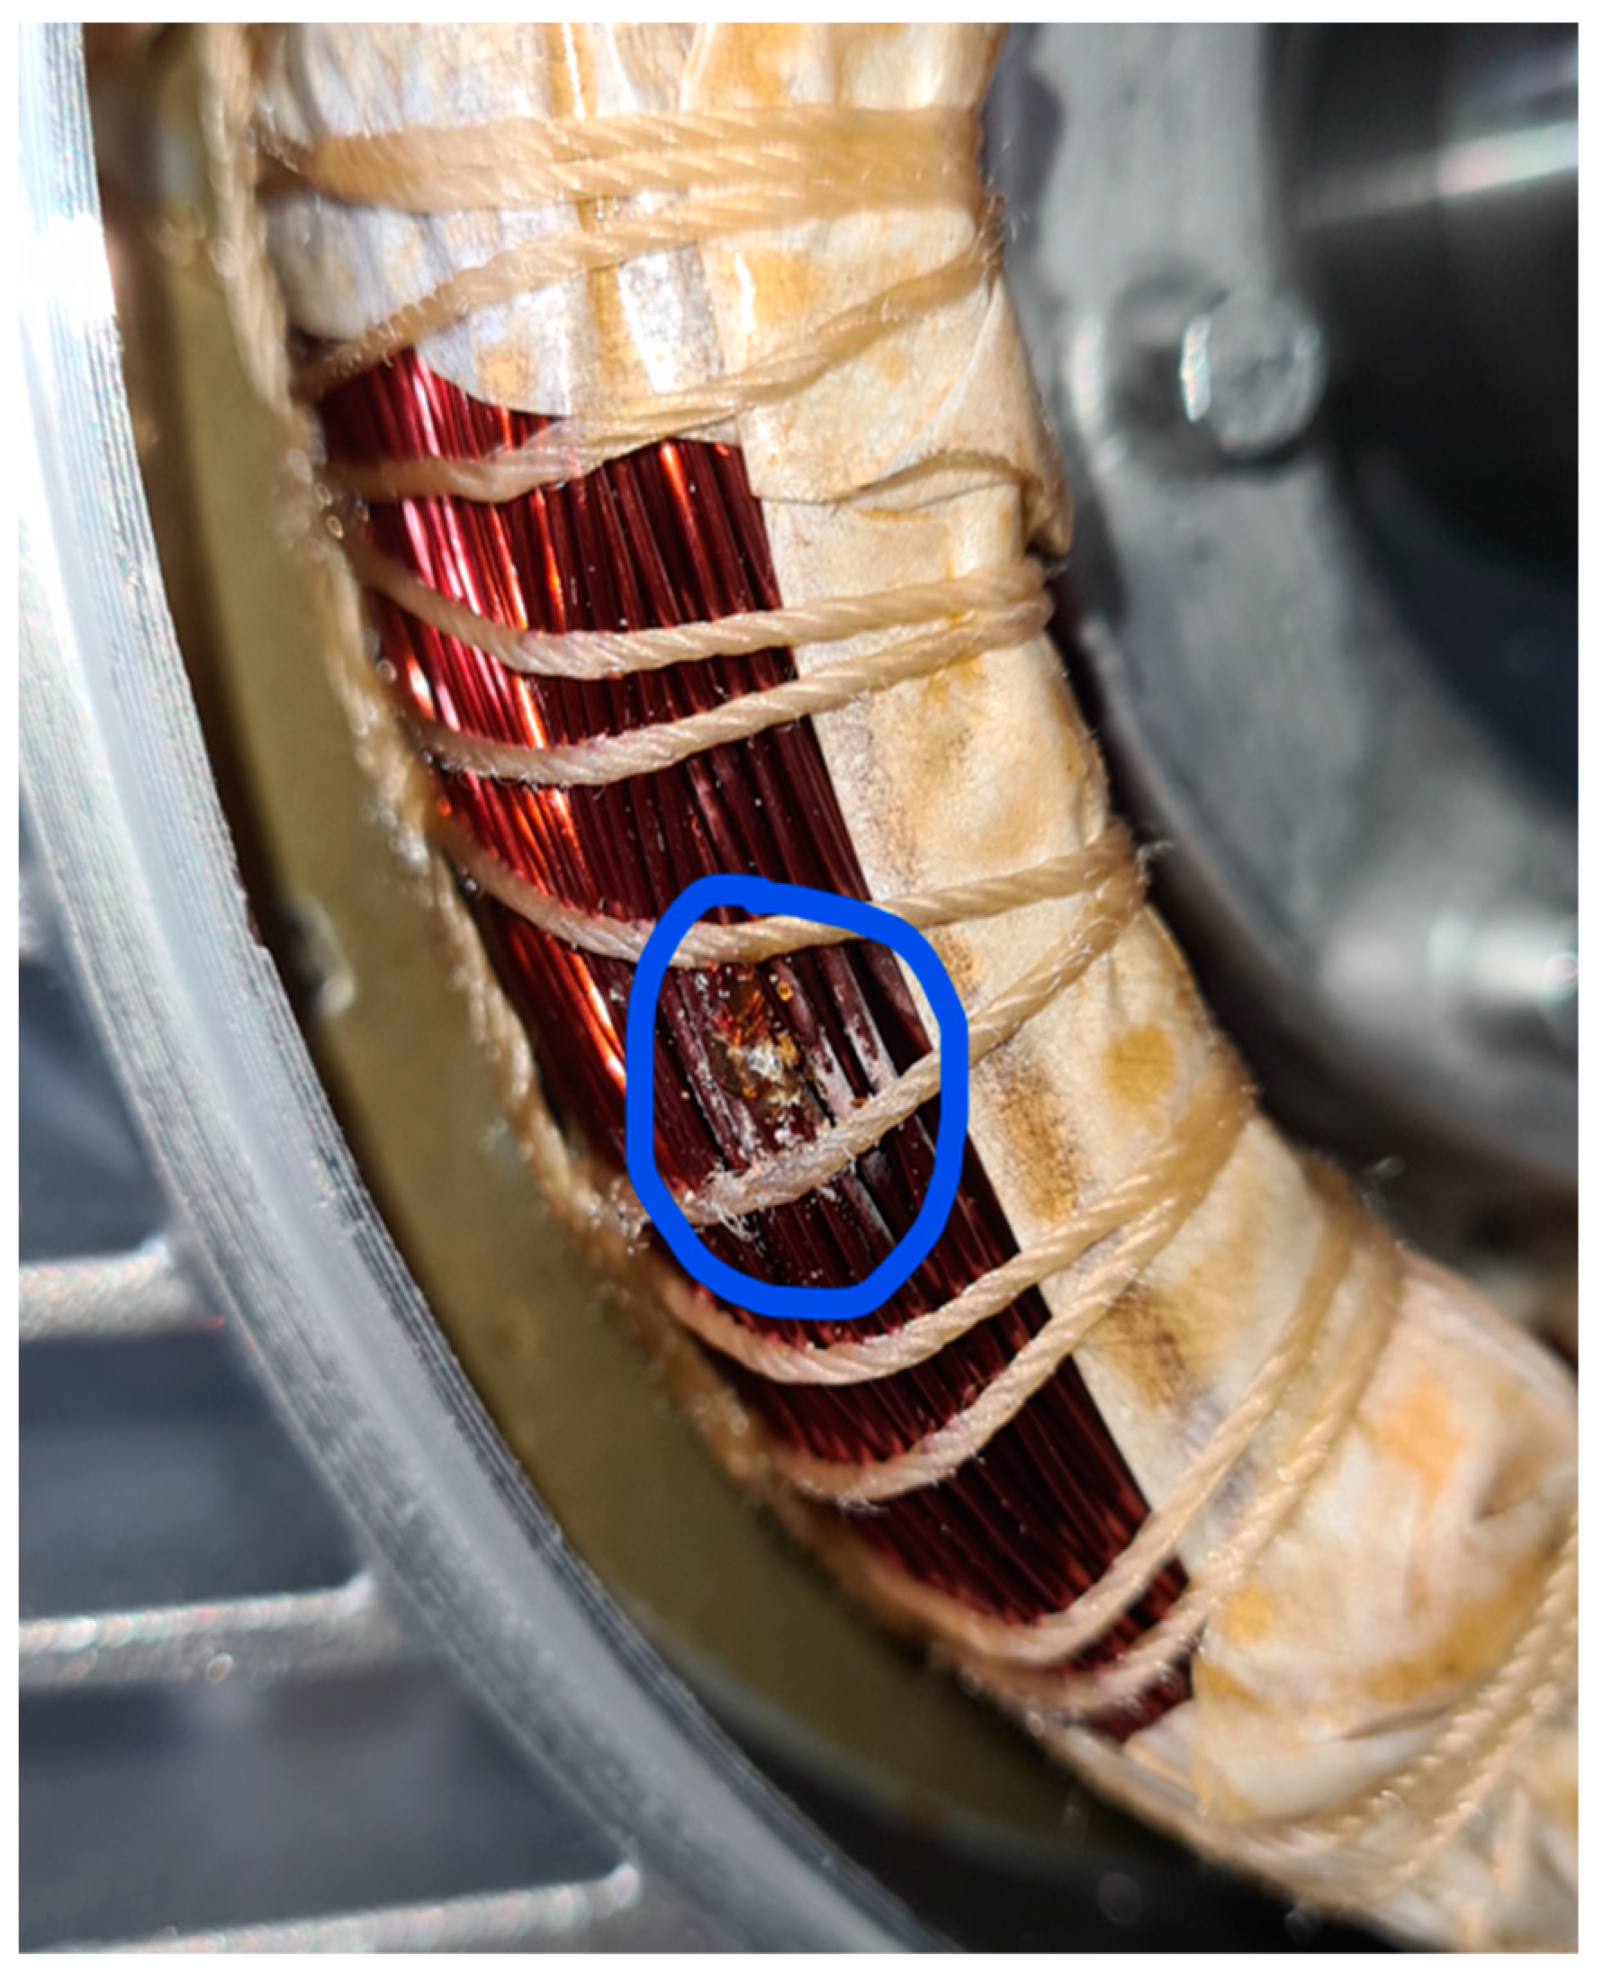
Figure 31.
Insulating enamel removed.
Figure 31.
Insulating enamel removed.
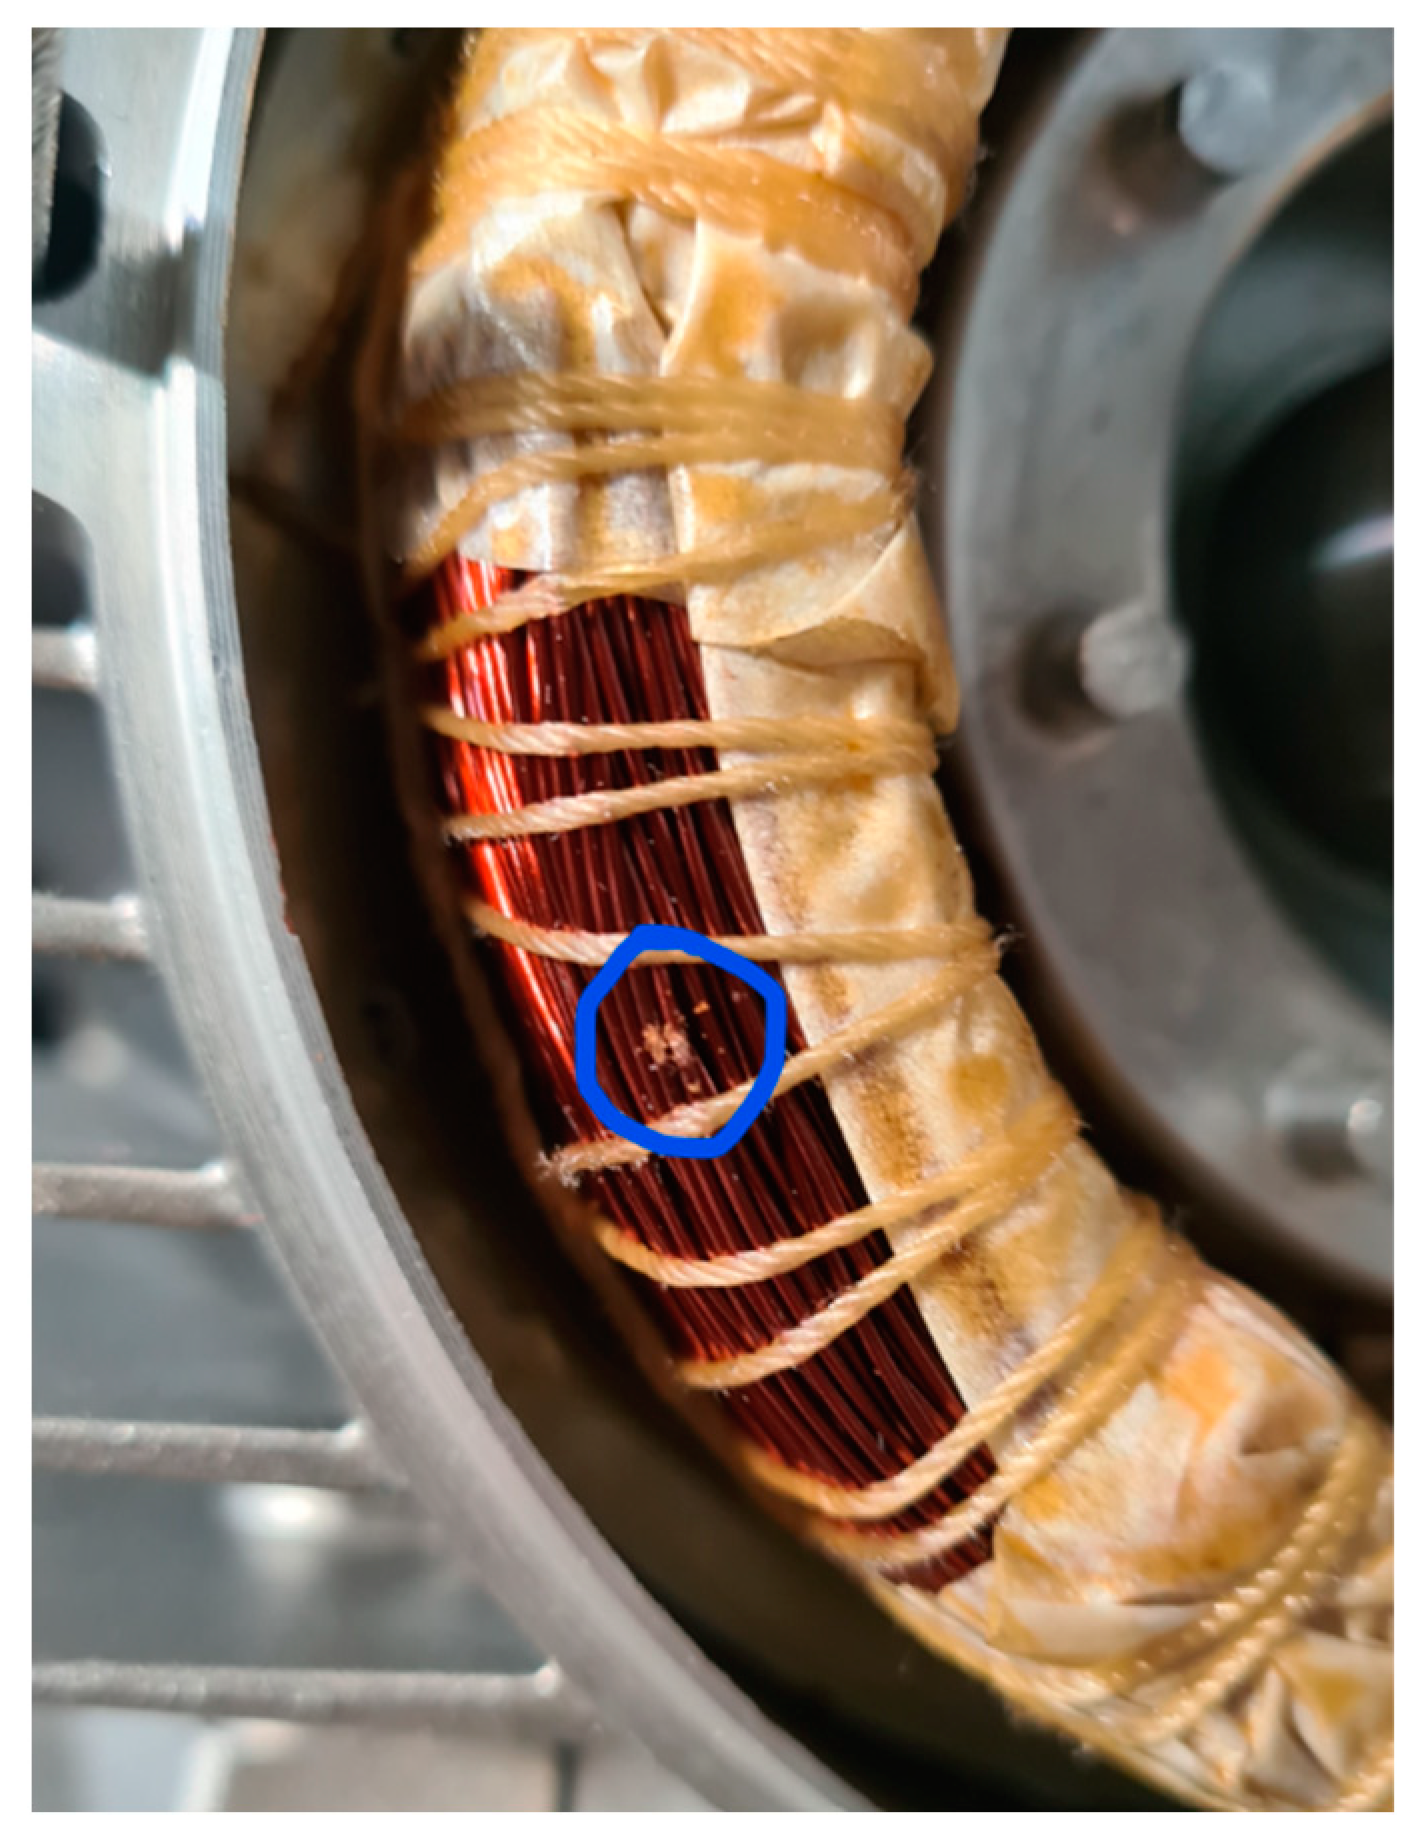
Figure 32.
Welded winding turns.
Figure 32.
Welded winding turns.
Figure 33.
Comparison between TFs of the same motor in healthy conditions and with a shortcut between 2 winding turns.
Figure 33.
Comparison between TFs of the same motor in healthy conditions and with a shortcut between 2 winding turns.
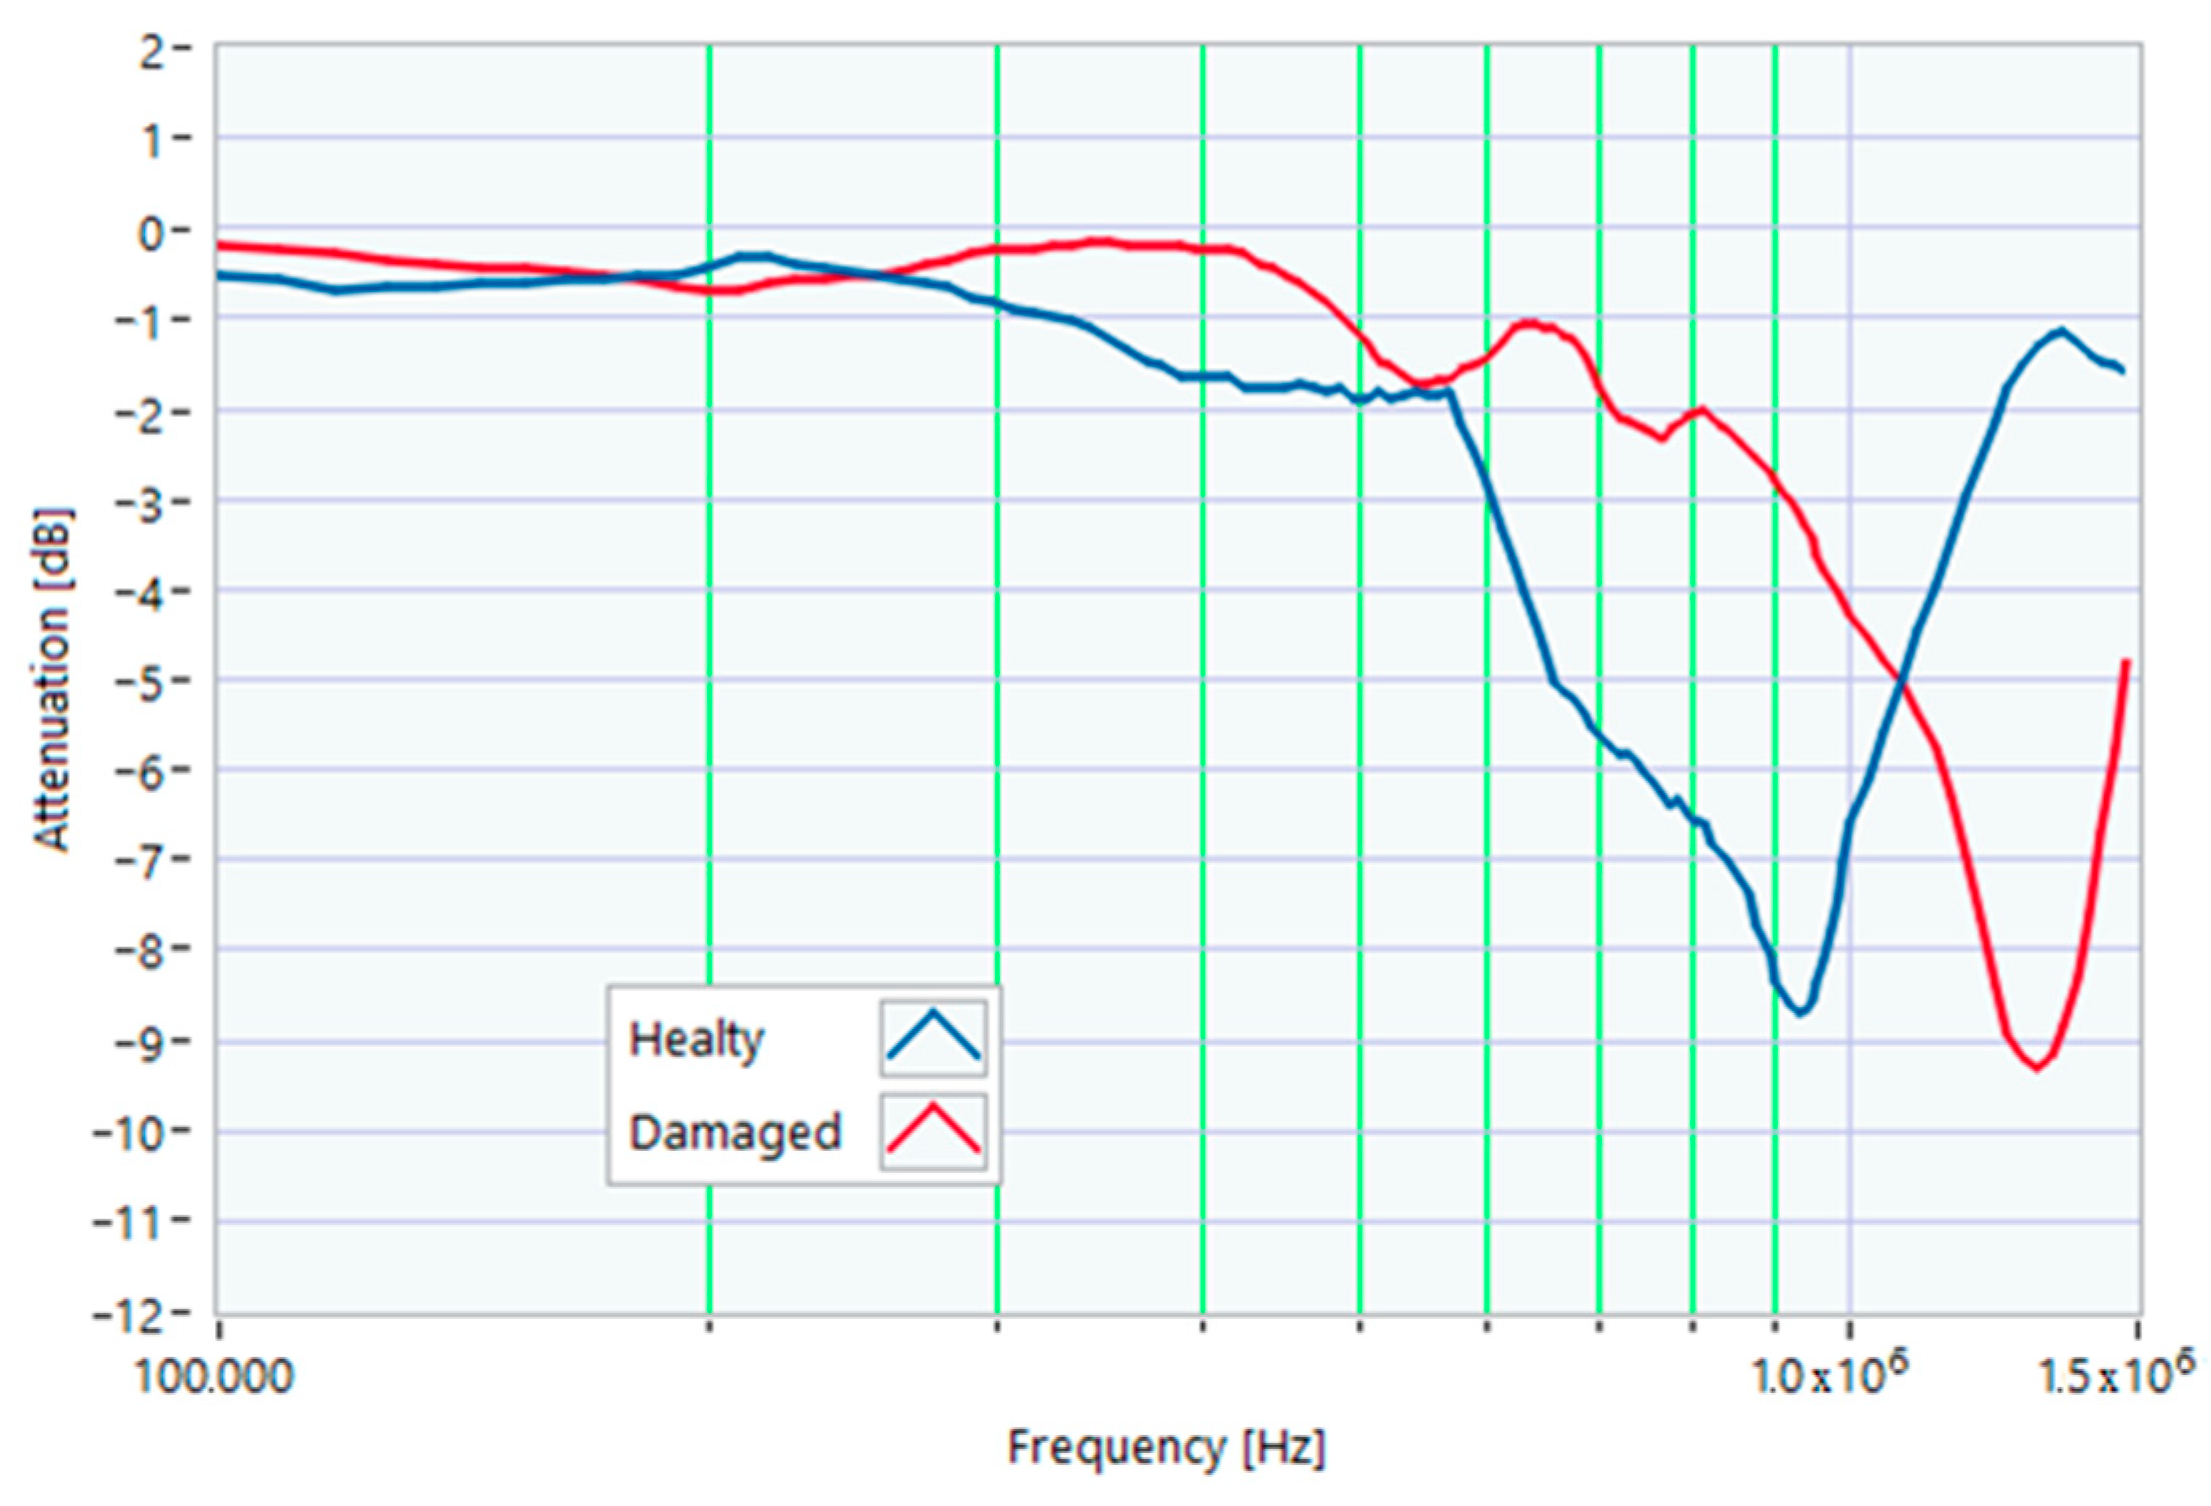
Figure 34.
Comparison between the TF of a motor with a shortcut between 2 winding turns and the reference TFs.
Figure 34.
Comparison between the TF of a motor with a shortcut between 2 winding turns and the reference TFs.
Table 1.
Correlation factors in the range from 100 kHz to 982 kHz for a motor with a 1 Ω resistance-in-series on a phase conductor.
Table 1.
Correlation factors in the range from 100 kHz to 982 kHz for a motor with a 1 Ω resistance-in-series on a phase conductor.
| Reference TF | Pearson’s ρ | Spearman r |
|---|
| Max | 0.8618 | 0.9671 |
| + sigma | 0.9436 | 0.9692 |
| mean | 0.9719 | 0.9268 |
| - sigma | 0.9771 | 0.9054 |
| Min | 0.9557 | 0.8999 |
Table 2.
Correlation factors in the range from 982 kHz to 1.500 MHz for a motor with a 1 Ω resistance-in-series on a phase conductor.
Table 2.
Correlation factors in the range from 982 kHz to 1.500 MHz for a motor with a 1 Ω resistance-in-series on a phase conductor.
| Reference TF | Pearson’s ρ | Spearman r |
|---|
| Max | 0.9082 | 0.9844 |
| + sigma | 0.9906 | 0.8857 |
| mean | 0.9992 | 0.9974 |
| - sigma | 0.9949 | 0.9987 |
| Min | 0.8110 | 0.8221 |
Table 3.
Correlation factors in the range from 100 kHz to 973 kHz for a motor with a 1 Ω resistance-in-series on a phase conductor.
Table 3.
Correlation factors in the range from 100 kHz to 973 kHz for a motor with a 1 Ω resistance-in-series on a phase conductor.
| Reference TF | Pearson’s ρ | Spearman r |
|---|
| Max | 0.8071 | 0.9381 |
| + sigma | 0.8959 | 0.9588 |
| mean | 0.9416 | 0.9392 |
| - sigma | 0.9591 | 0.9232 |
| Min | 0.9431 | 0.9202 |
Table 4.
Correlation factors in the range from 973 kHz to 1.500 MHz for a motor with a 1 Ω resistance-in-series on a phase conductor.
Table 4.
Correlation factors in the range from 973 kHz to 1.500 MHz for a motor with a 1 Ω resistance-in-series on a phase conductor.
| Reference TF | Pearson’s ρ | Spearman r |
|---|
| Max | 0.9228 | 0.9853 |
| + sigma | 0.9900 | 0.9074 |
| mean | 0.9987 | 0.9988 |
| - sigma | 0.9953 | 0.9977 |
| Min | 0.8235 | 0.8103 |
Table 5.
Correlation factors in the range from 100 kHz to 964 kHz for a motor with slight rotor misalignment.
Table 5.
Correlation factors in the range from 100 kHz to 964 kHz for a motor with slight rotor misalignment.
| Reference TF | Pearson’s ρ | Spearman r |
|---|
| Max | 0.8676 | 0.8974 |
| + sigma | 0.9289 | 0.9251 |
| mean | 0.9581 | 0.9733 |
| - sigma | 0.9655 | 0.9726 |
| Min | 0.9476 | 0.9698 |
Table 6.
Correlation factors in the range from 964 kHz to 1.500 MHz for a motor with slight rotor misalignment.
Table 6.
Correlation factors in the range from 964 kHz to 1.500 MHz for a motor with slight rotor misalignment.
| Reference TF | Pearson’s ρ | Spearman r |
|---|
| Max | 0.9197 | 0.9733 |
| + sigma | 0.9919 | 0.9358 |
| mean | 0.9971 | 0.9901 |
| - sigma | 0.9930 | 0.9862 |
| Min | 0.8237 | 0.8103 |
Table 7.
Correlation factors in the range from 100 kHz to 901 kHz for a motor with a slight rotor misalignment.
Table 7.
Correlation factors in the range from 100 kHz to 901 kHz for a motor with a slight rotor misalignment.
| Reference TF | Pearson’s ρ | Spearman r |
|---|
| Max | 0.8708 | 0.8831 |
| + sigma | 0.9595 | 0.8938 |
| mean | 0.9467 | 0.9182 |
| - sigma | 0.9298 | 0.9426 |
| Min | 0.9143 | 0.9464 |
Table 8.
Correlation factors in the range from 901 kHz to 1.500 MHz for a motor with a slight rotor misalignment.
Table 8.
Correlation factors in the range from 901 kHz to 1.500 MHz for a motor with a slight rotor misalignment.
| Reference TF | Pearson’s ρ | Spearman r |
|---|
| Max | 0.7186 | 0.6156 |
| + sigma | 0.6963 | 0.7268 |
| mean | 0.6261 | 0.5844 |
| - sigma | 0.5786 | 0.5555 |
| Min | 0.2497 | 0.3677 |
Table 9.
Correlation factors in the range from 100 kHz to 604 kHz of the motor after a stator fell from a height of 1 m.
Table 9.
Correlation factors in the range from 100 kHz to 604 kHz of the motor after a stator fell from a height of 1 m.
| Reference TF | Pearson’s ρ | Spearman r |
|---|
| Max | 0.6116 | 0.6112 |
| + sigma | 0.8207 | 0.7477 |
| mean | 0.9498 | 0.9444 |
| - sigma | 0.9644 | 0.9807 |
| Min | 0.9562 | 0.9832 |
Table 10.
Correlation factors in the range from 604 kHz to 1.500 MHz of the motor after a stator fell from a height of 1 m.
Table 10.
Correlation factors in the range from 604 kHz to 1.500 MHz of the motor after a stator fell from a height of 1 m.
| Reference TF | Pearson’s ρ | Spearman r |
|---|
| Max | −0.4380 | −0.4509 |
| + sigma | −0.6842 | −0.6495 |
| mean | −0.8160 | −0.7434 |
| - sigma | −0.8623 | −0.7851 |
| Min | −0.8498 | −0.7992 |
Table 11.
Correlation factors in the range from 100 kHz to 1.275 MHz for a motor with shorting ring damage.
Table 11.
Correlation factors in the range from 100 kHz to 1.275 MHz for a motor with shorting ring damage.
| Reference TF | Pearson’s ρ | Spearman r |
|---|
| Max | 0.6329 | 0.8470 |
| + sigma | 0.6429 | 0.8632 |
| mean | 0.7415 | 0.9265 |
| -sigma | 0.7877 | 0.9481 |
| Min | 0.8990 | 0.9739 |
Table 12.
Correlation factors in the range from 1.275 MHz to 1.5 MHz for a motor with shorting ring damage.
Table 12.
Correlation factors in the range from 1.275 MHz to 1.5 MHz for a motor with shorting ring damage.
| Reference TF | Pearson’s ρ | Spearman r |
|---|
| Max | 0.6352 | 0.6905 |
| + sigma | −0.8945 | −1.000 |
| mean | 0.4729 | 0.4762 |
| -sigma | 0.5643 | 0.5953 |
| Min | 0.5169 | 0.5238 |
Table 13.
Correlation factors in the range from 100 kHz to 568 kHz for a motor with rotor bar damage.
Table 13.
Correlation factors in the range from 100 kHz to 568 kHz for a motor with rotor bar damage.
| Reference TF | Pearson’s ρ | Spearman r |
|---|
| Max | 0.6792 | 0.5475 |
| + sigma | 0.8174 | 0.7012 |
| mean | 0.9865 | 0.9460 |
| - sigma | 0.9964 | 0.9900 |
| Min | 0.9852 | 0.9966 |
Table 14.
Correlation factors in the range from 568 kHz to 1.5 MHz for a motor with rotor bar damage.
Table 14.
Correlation factors in the range from 568 kHz to 1.5 MHz for a motor with rotor bar damage.
| Reference TF | Pearson’s ρ | Spearman r |
|---|
| Max | −0.4198 | −0.2950 |
| + sigma | −0.4361 | −0.3223 |
| mean | −0.5592 | −0.5176 |
| - sigma | −0.6133 | −0.6213 |
| Min | −0.7393 | −0.7875 |
Table 15.
Correlation factors in the range from 100 kHz to 1.275 MHz after the rotor group fell from a height of 1 m.
Table 15.
Correlation factors in the range from 100 kHz to 1.275 MHz after the rotor group fell from a height of 1 m.
| Reference TF | Pearson’s ρ | Spearman r |
|---|
| Max | 0.5204 | 0.6854 |
| + sigma | 0.5543 | 0.6978 |
| mean | 0.6668 | 0.8034 |
| - sigma | 0.7227 | 0.8330 |
| Min | 0.8318 | 0.8604 |
Table 16.
Correlation factors in the range from 1.275 MHz to 1.5 MHz after the rotor group fell from a height of 1 m.
Table 16.
Correlation factors in the range from 1.275 MHz to 1.5 MHz after the rotor group fell from a height of 1 m.
| Reference TF | Pearson’s ρ | Spearman r |
|---|
| Max | 0.6366 | 0.6905 |
| + sigma | -0.8950 | -1.000 |
| mean | 0.4730 | 0.4762 |
| - sigma | 0.5645 | 0.5952 |
| Min | 0.5146 | 0.5238 |
Table 17.
Correlation factors in the range from 100 kHz to 1.300 MHz for a motor with a shortcut between 2 winding turns.
Table 17.
Correlation factors in the range from 100 kHz to 1.300 MHz for a motor with a shortcut between 2 winding turns.
| Reference TF | Pearson’s ρ | Spearman r |
|---|
| Max | 0.4918 | 0.8303 |
| + sigma | 0.4696 | 0.8127 |
| mean | 0.5731 | 0.8391 |
| - sigma | 0.6252 | 0.8652 |
| Min | 0.7673 | 0.8974 |
Table 18.
Correlation factors in the range from 1.300 MHz to 1.500 MHz for a motor with a shortcut between 2 winding turns.
Table 18.
Correlation factors in the range from 1.300 MHz to 1.500 MHz for a motor with a shortcut between 2 winding turns.
| Reference TF | Pearson’s ρ | Spearman r |
|---|
| Max | 0.5297 | 0.5357 |
| + sigma | −0.8363 | −1.000 |
| mean | 0.1609 | 0.2143 |
| - sigma | 0.3560 | 0.3929 |
| Min | 0.2523 | 0.2857 |


 ,
, 


