Acknowledgments
The Multi-Ethnic Study of Atherosclerosis (MESA) Sleep Ancillary study was funded by NIH-NHLBI Association of Sleep Disorders with Cardiovascular Health Across Ethnic Groups (RO1 HL098433). MESA is supported by NHLBI funded contracts HHSN268201500003I, N01-HC-95159, N01-HC-95160, N01-HC-95161, N01-HC-95162, N01-HC-95163, N01-HC-95164, N01-HC-95165, N01-HC-95166, N01-HC-95167, N01-HC-95168 and N01-HC-95169 from the National Heart, Lung, and Blood Institute, and by cooperative agreements UL1-TR-000040, UL1-TR-001079, and UL1-TR-001420 funded by NCATS. The National Sleep Research Resource was supported by the National Heart, Lung, and Blood Institute (R24 HL114473, 75N92019R002). The authors would like to thank Andrius Petrėnas for providing the algorithm of irregular rhythm detection and for useful suggestions on preparing the manuscript of the paper.
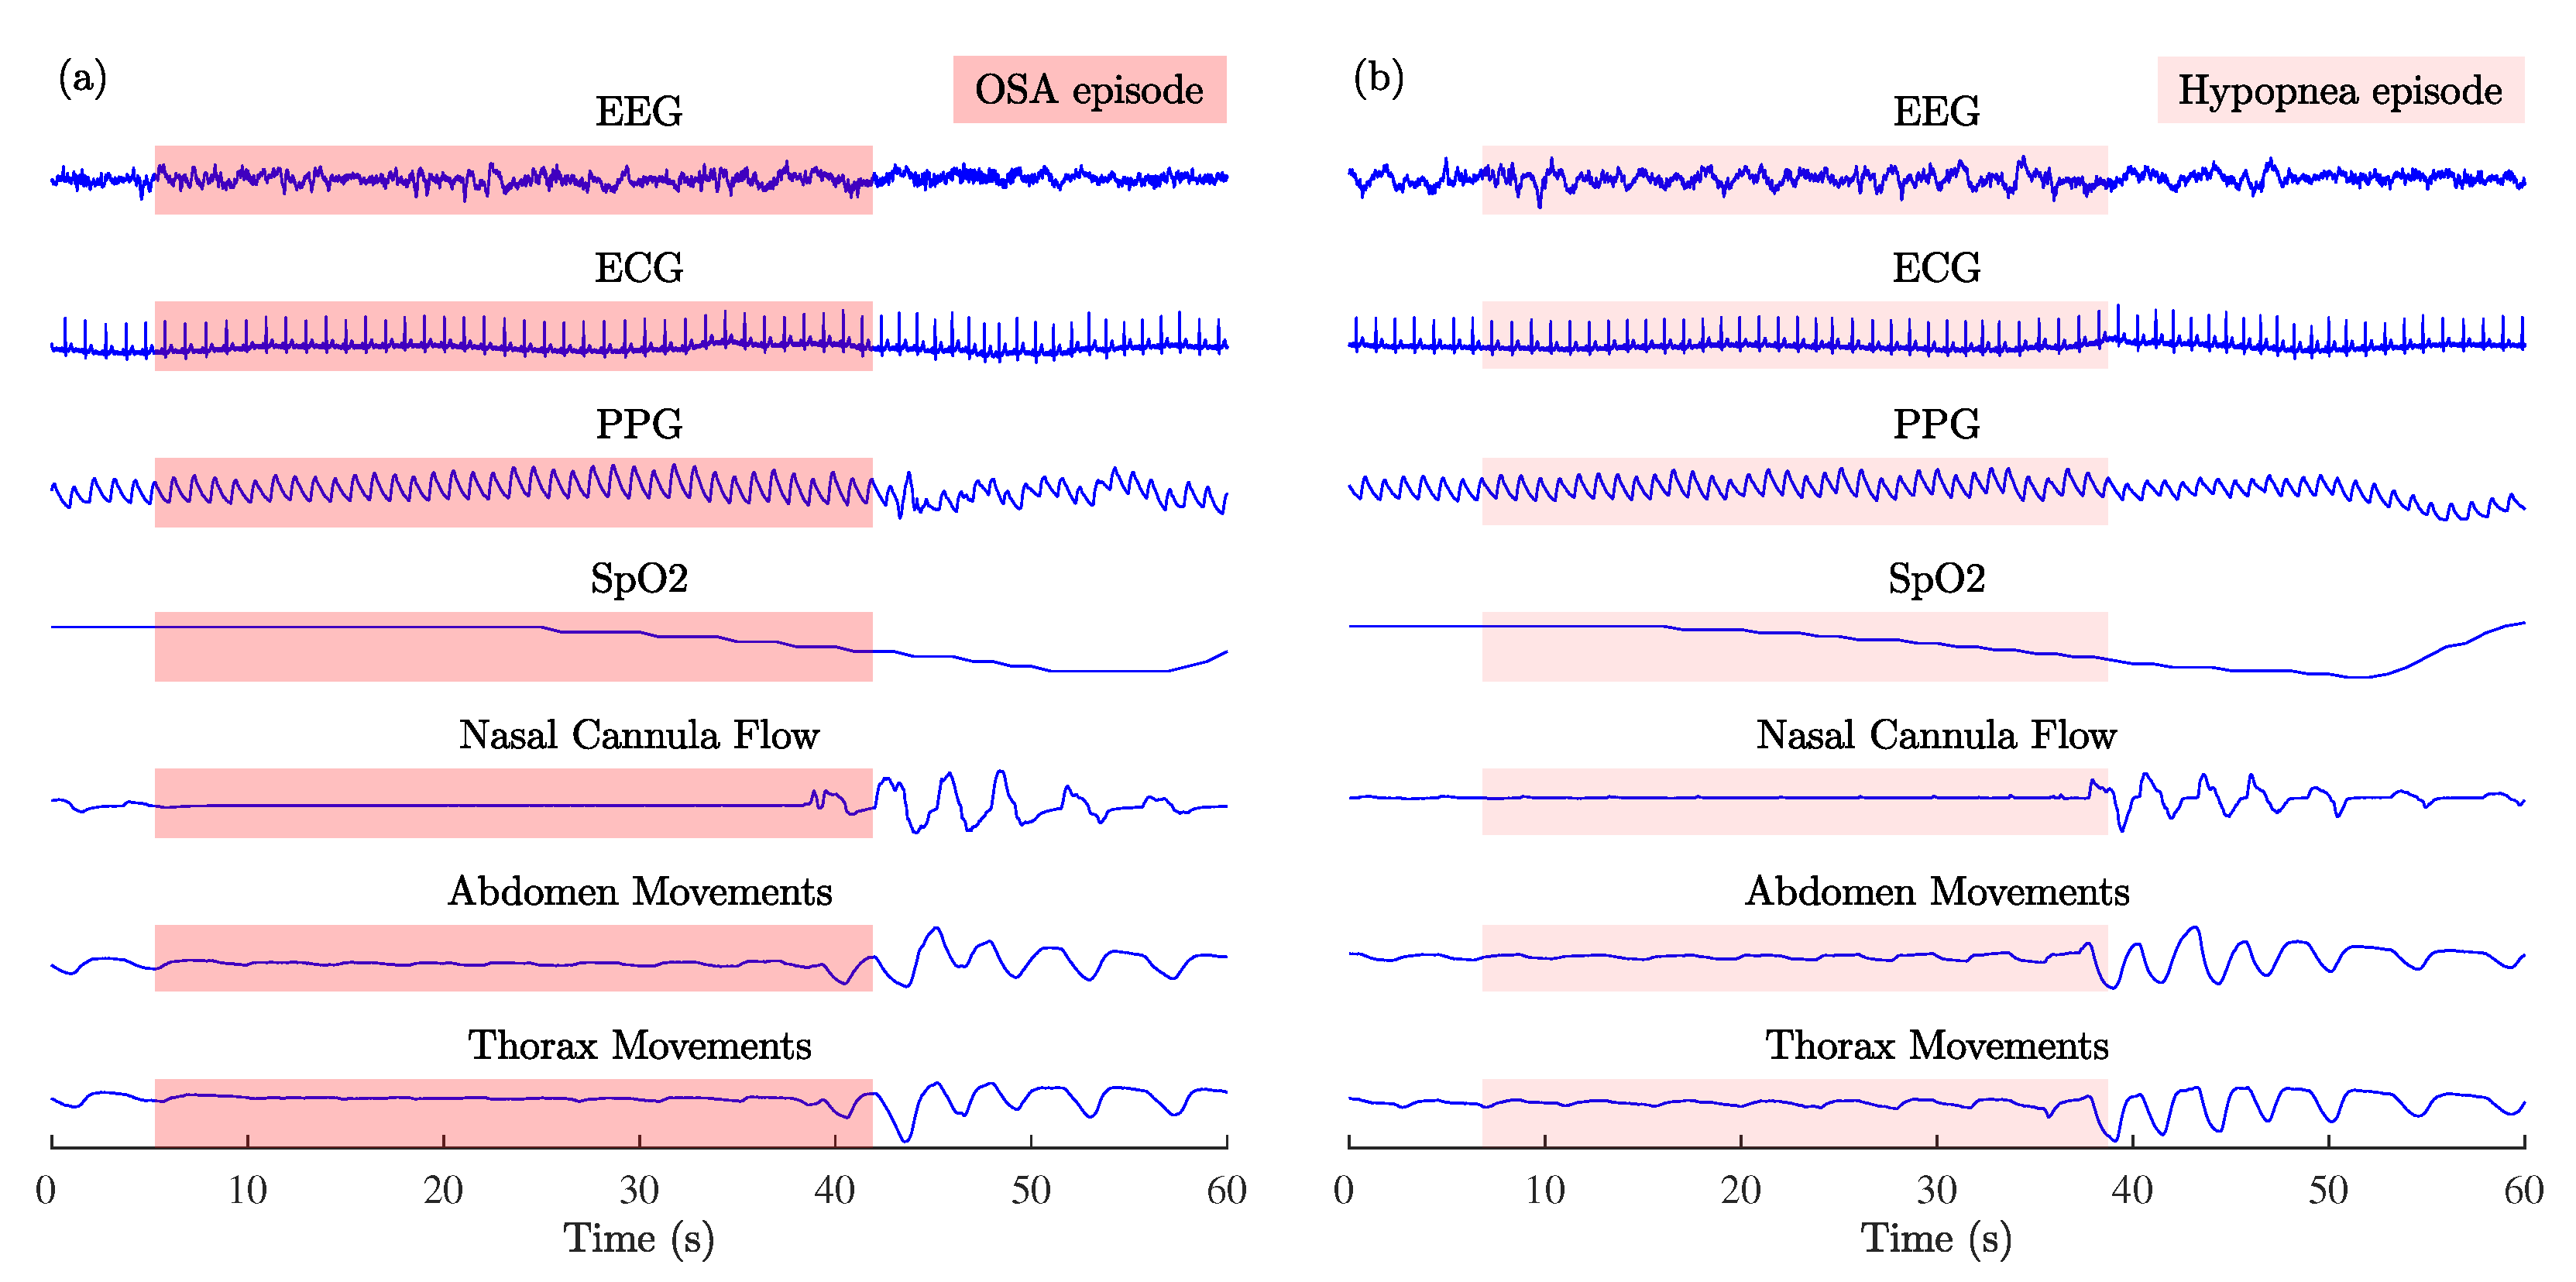
Figure 1.
Examples of MESA multichannel physiological signals recorded during (a) OSA and (b) hypopnea episodes: electroencephalogram (EEG), electrocardiogram (ECG), photoplethysmogram (PPG), arterial blood oxygen saturation (SpO2), nasal cannula flow, abdomen, and thorax movements.
Figure 1.
Examples of MESA multichannel physiological signals recorded during (a) OSA and (b) hypopnea episodes: electroencephalogram (EEG), electrocardiogram (ECG), photoplethysmogram (PPG), arterial blood oxygen saturation (SpO2), nasal cannula flow, abdomen, and thorax movements.
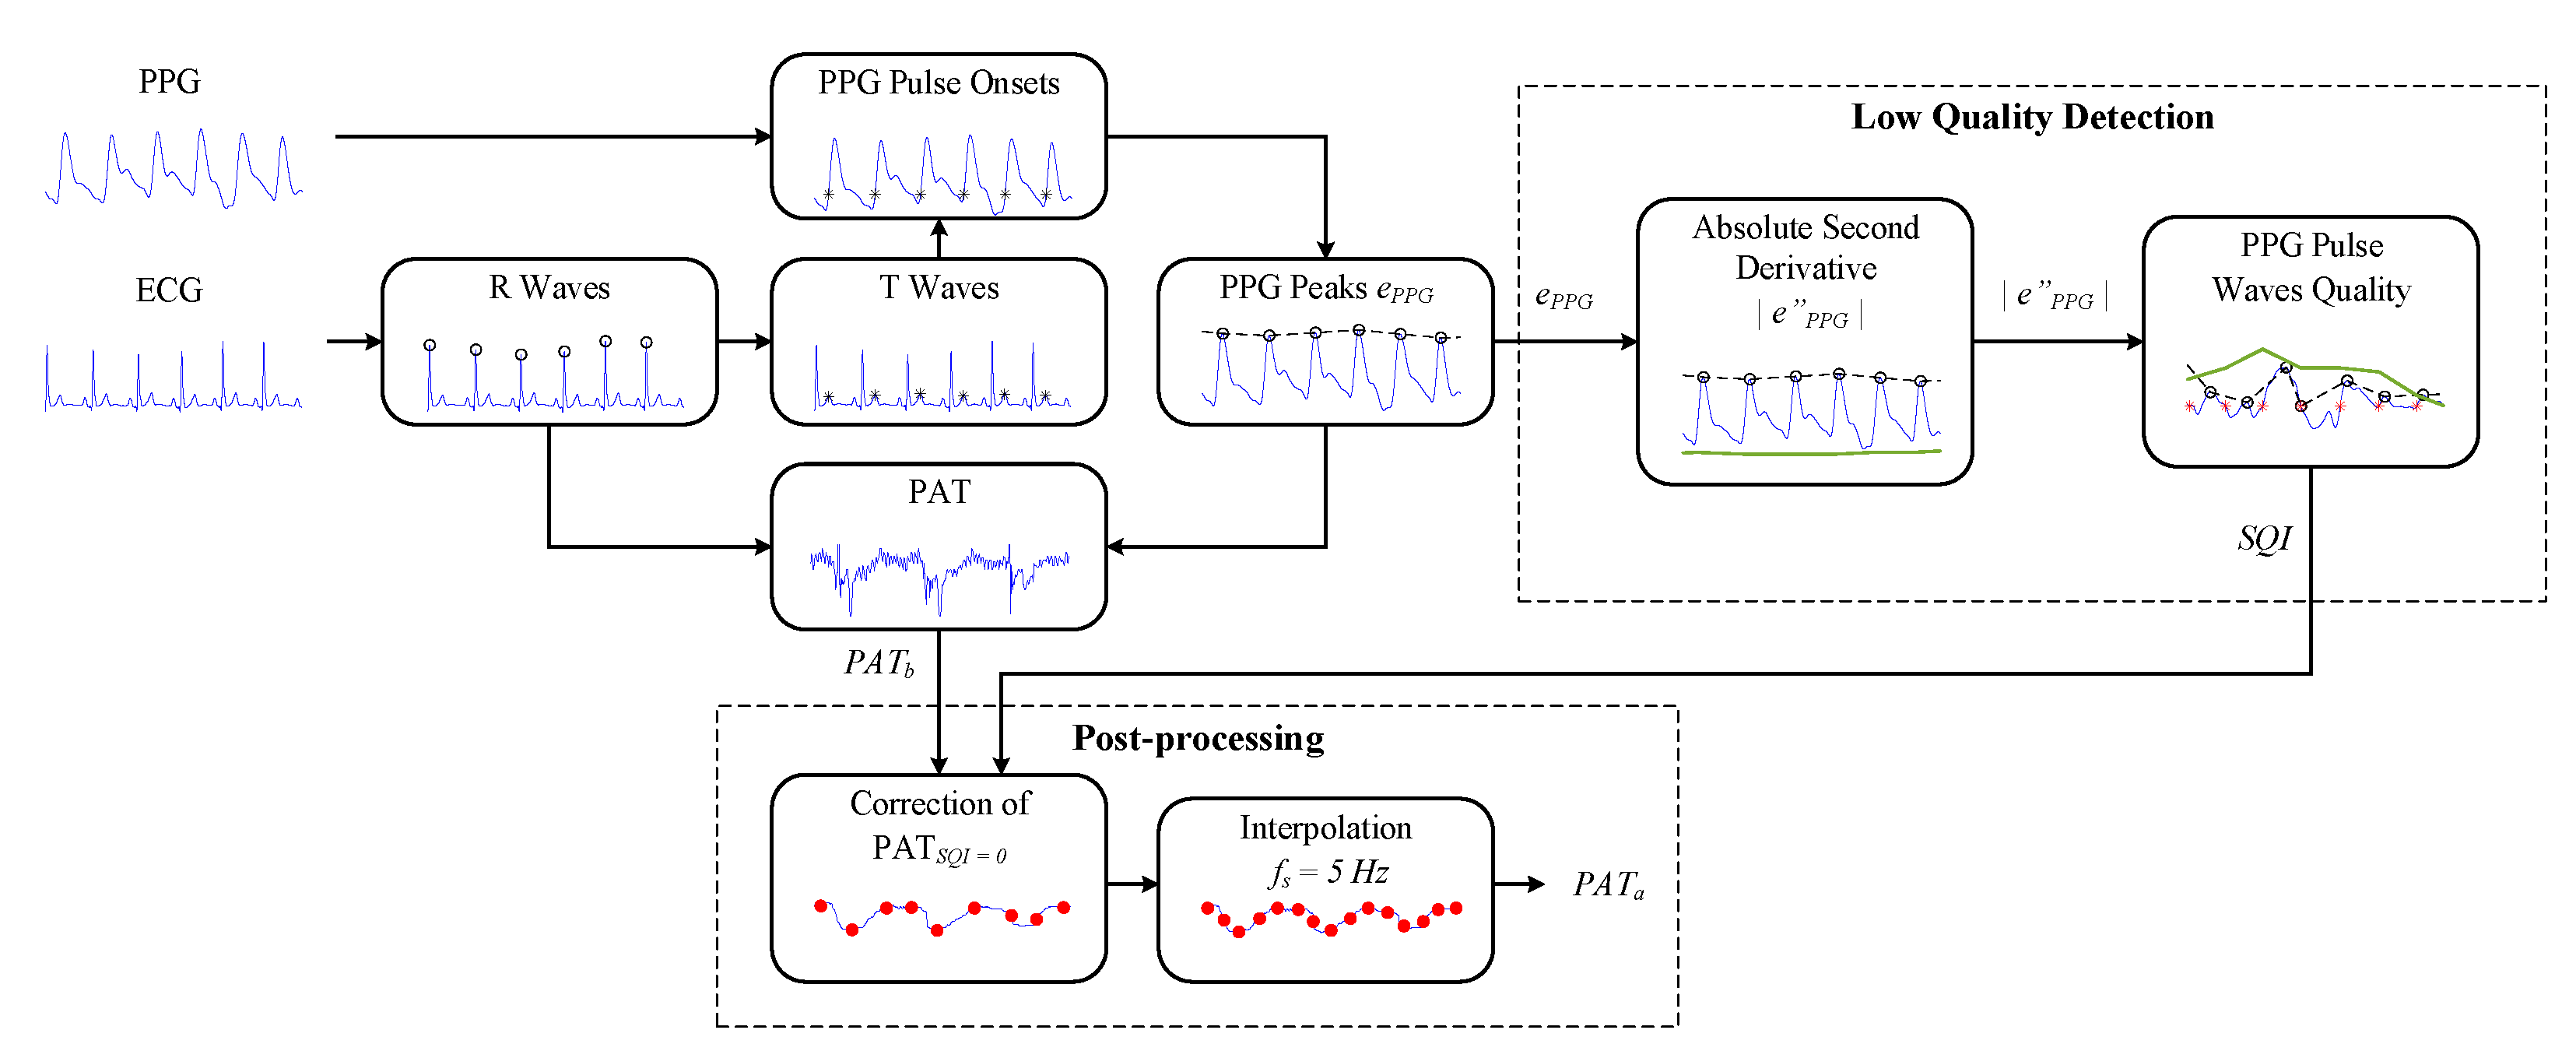
Figure 2.
The block diagram of the PPG signal-quality assessment algorithm for robust PAT estimation.
Figure 2.
The block diagram of the PPG signal-quality assessment algorithm for robust PAT estimation.
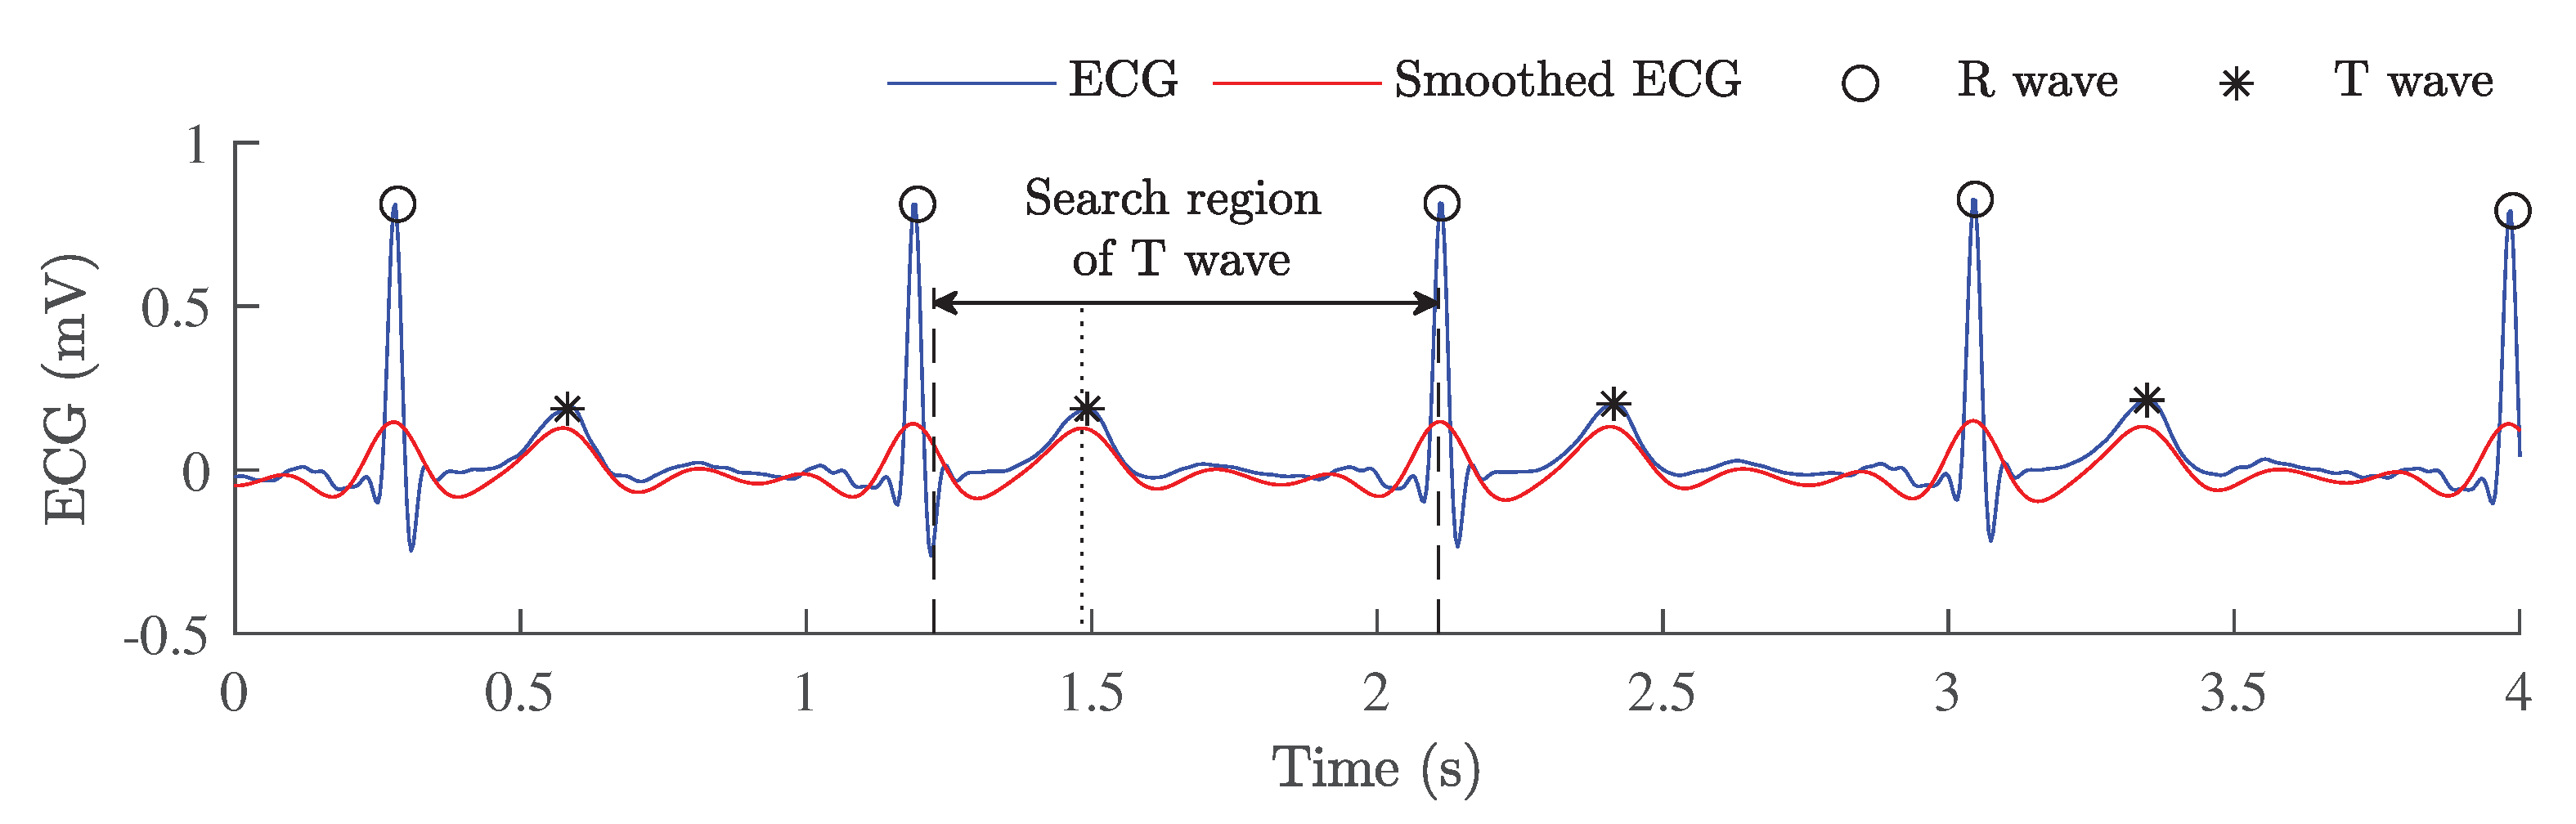
Figure 3.
A low-complexity detection of T waves from the ECG signal by using additional filtering.
Figure 3.
A low-complexity detection of T waves from the ECG signal by using additional filtering.
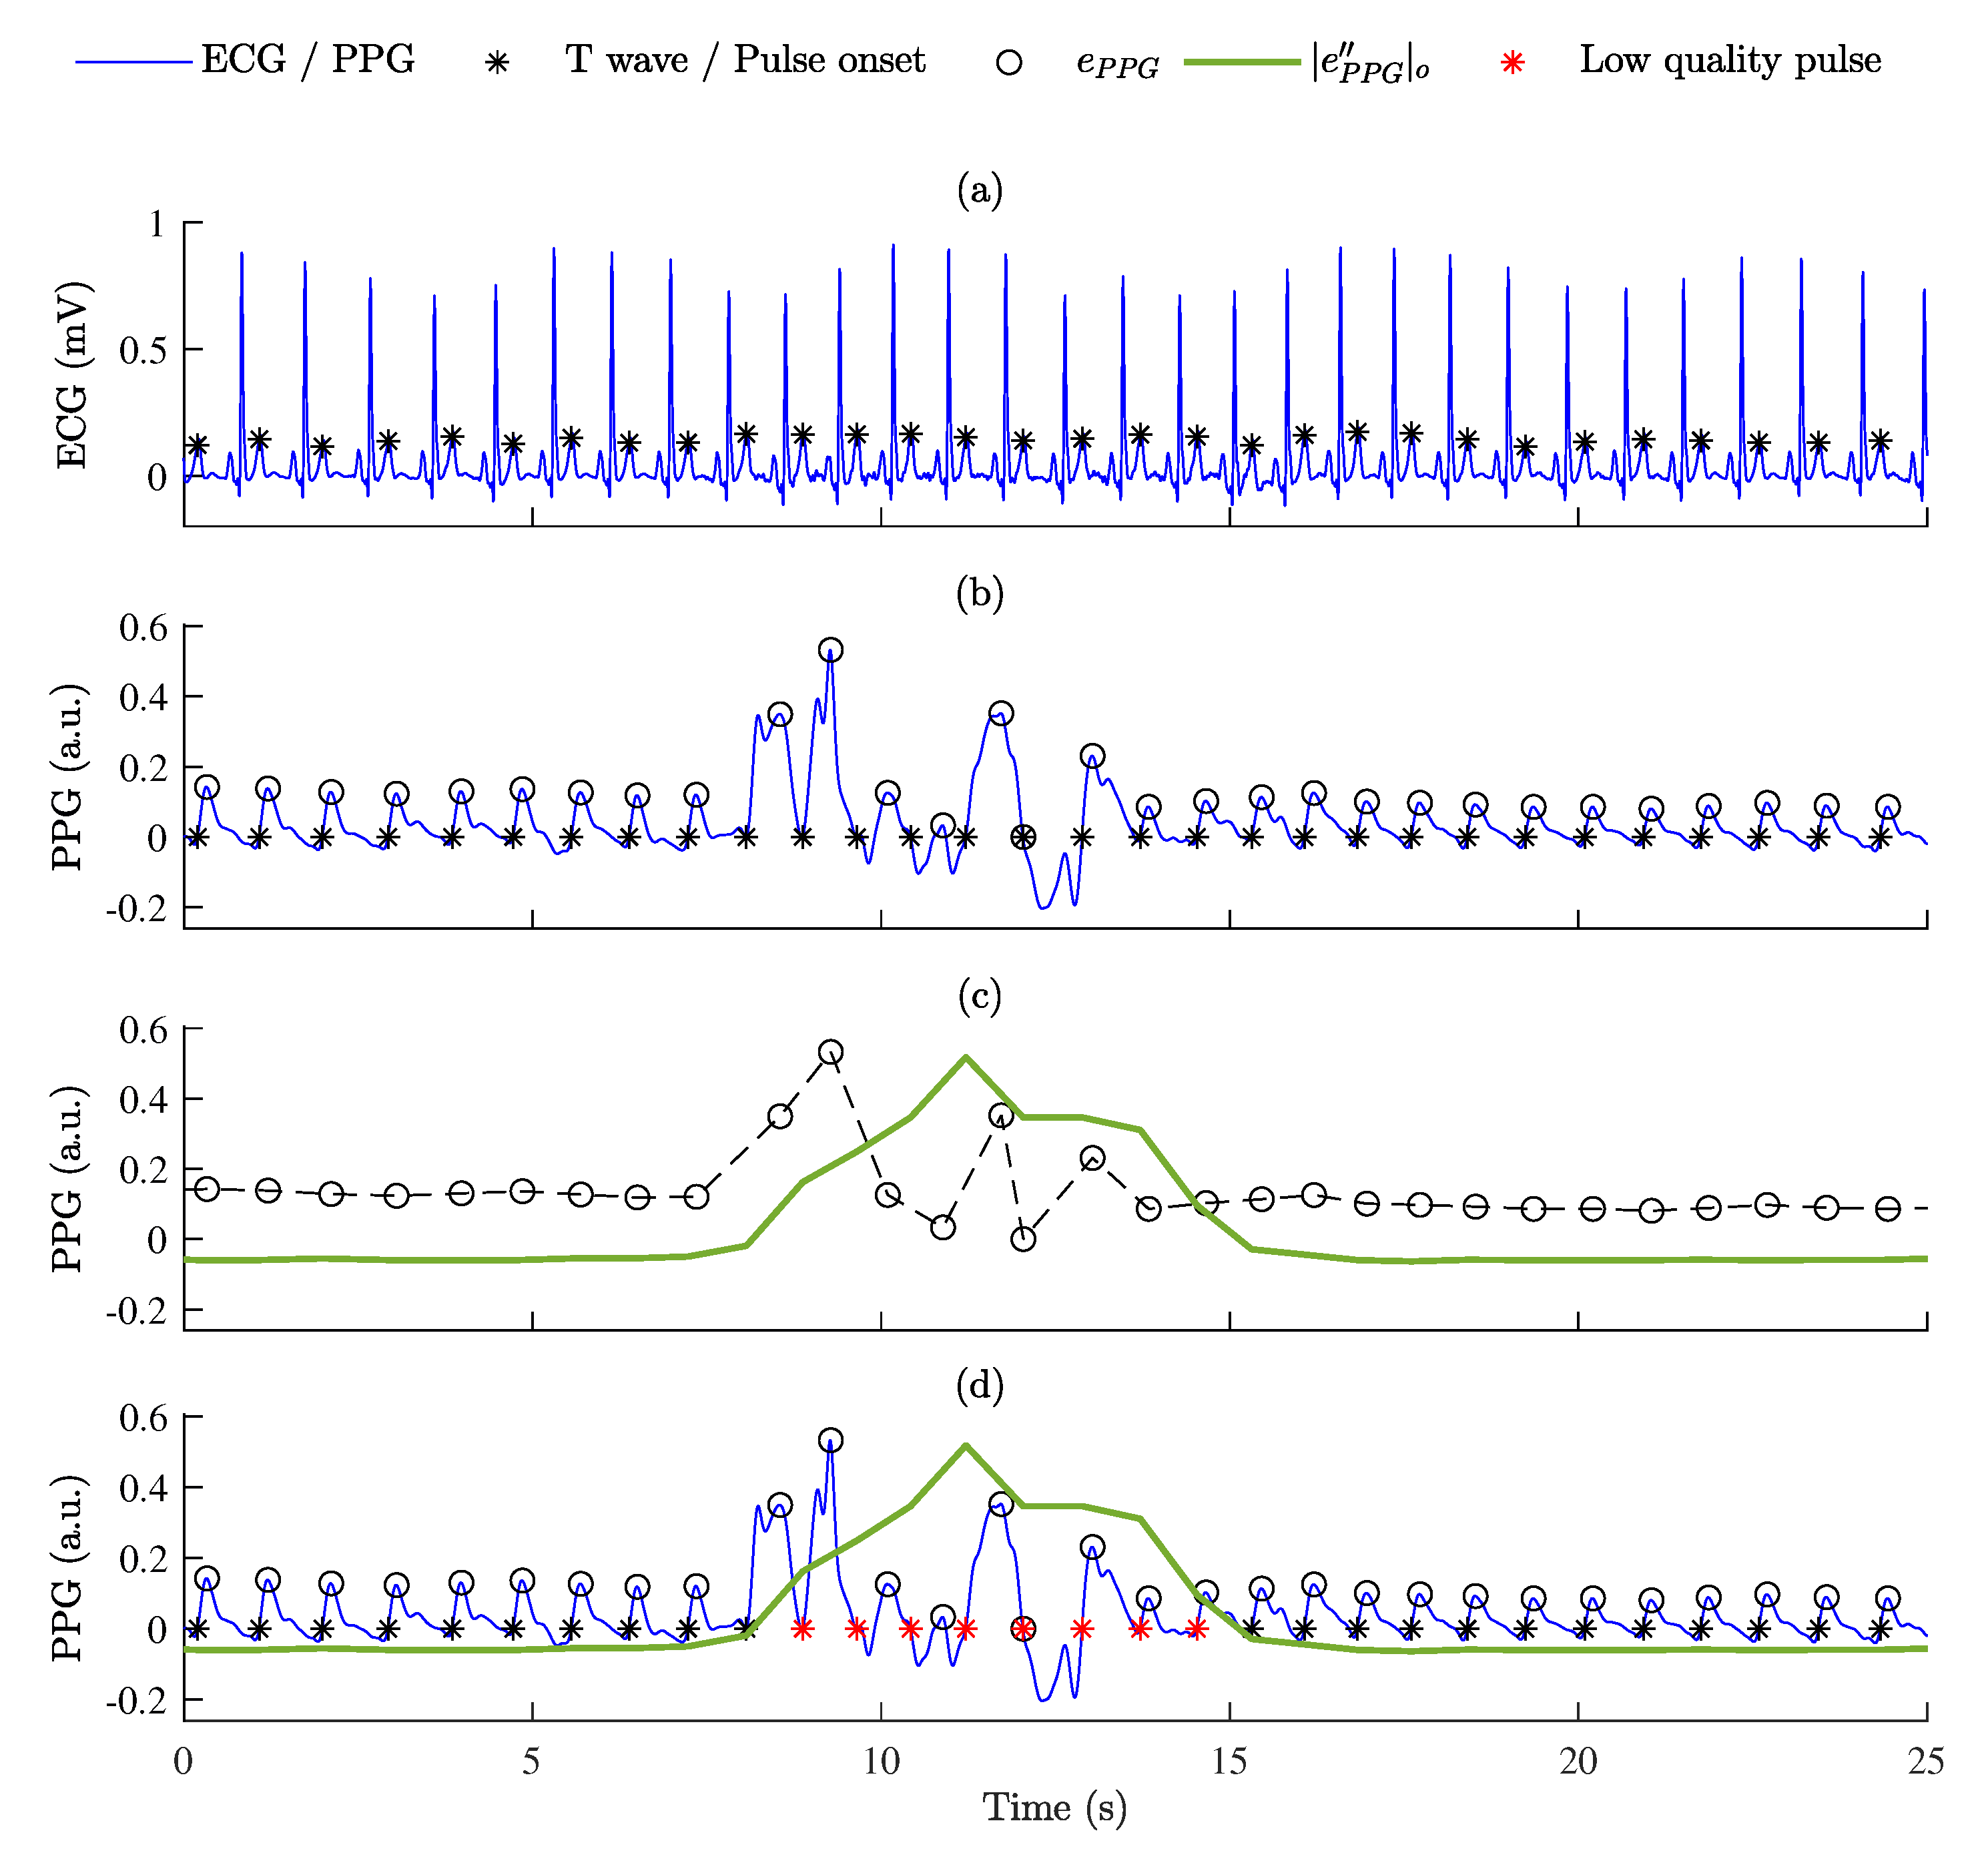
Figure 4.
The segmentation of low-quality PPG pulse waves: (a) ECG signal with detected T waves; (b) PPG signal with detected pulse onsets and estimated maximum values of the PPG signal envelope, (black circles); (c) the second derivative of the PPG signal envelope after offsetting, (shown in green) was calculated from the PPG signal envelope, (black circles); (d) the identification of low-quality pulses according to thresholds and (red stars indicate low- quality pulses).
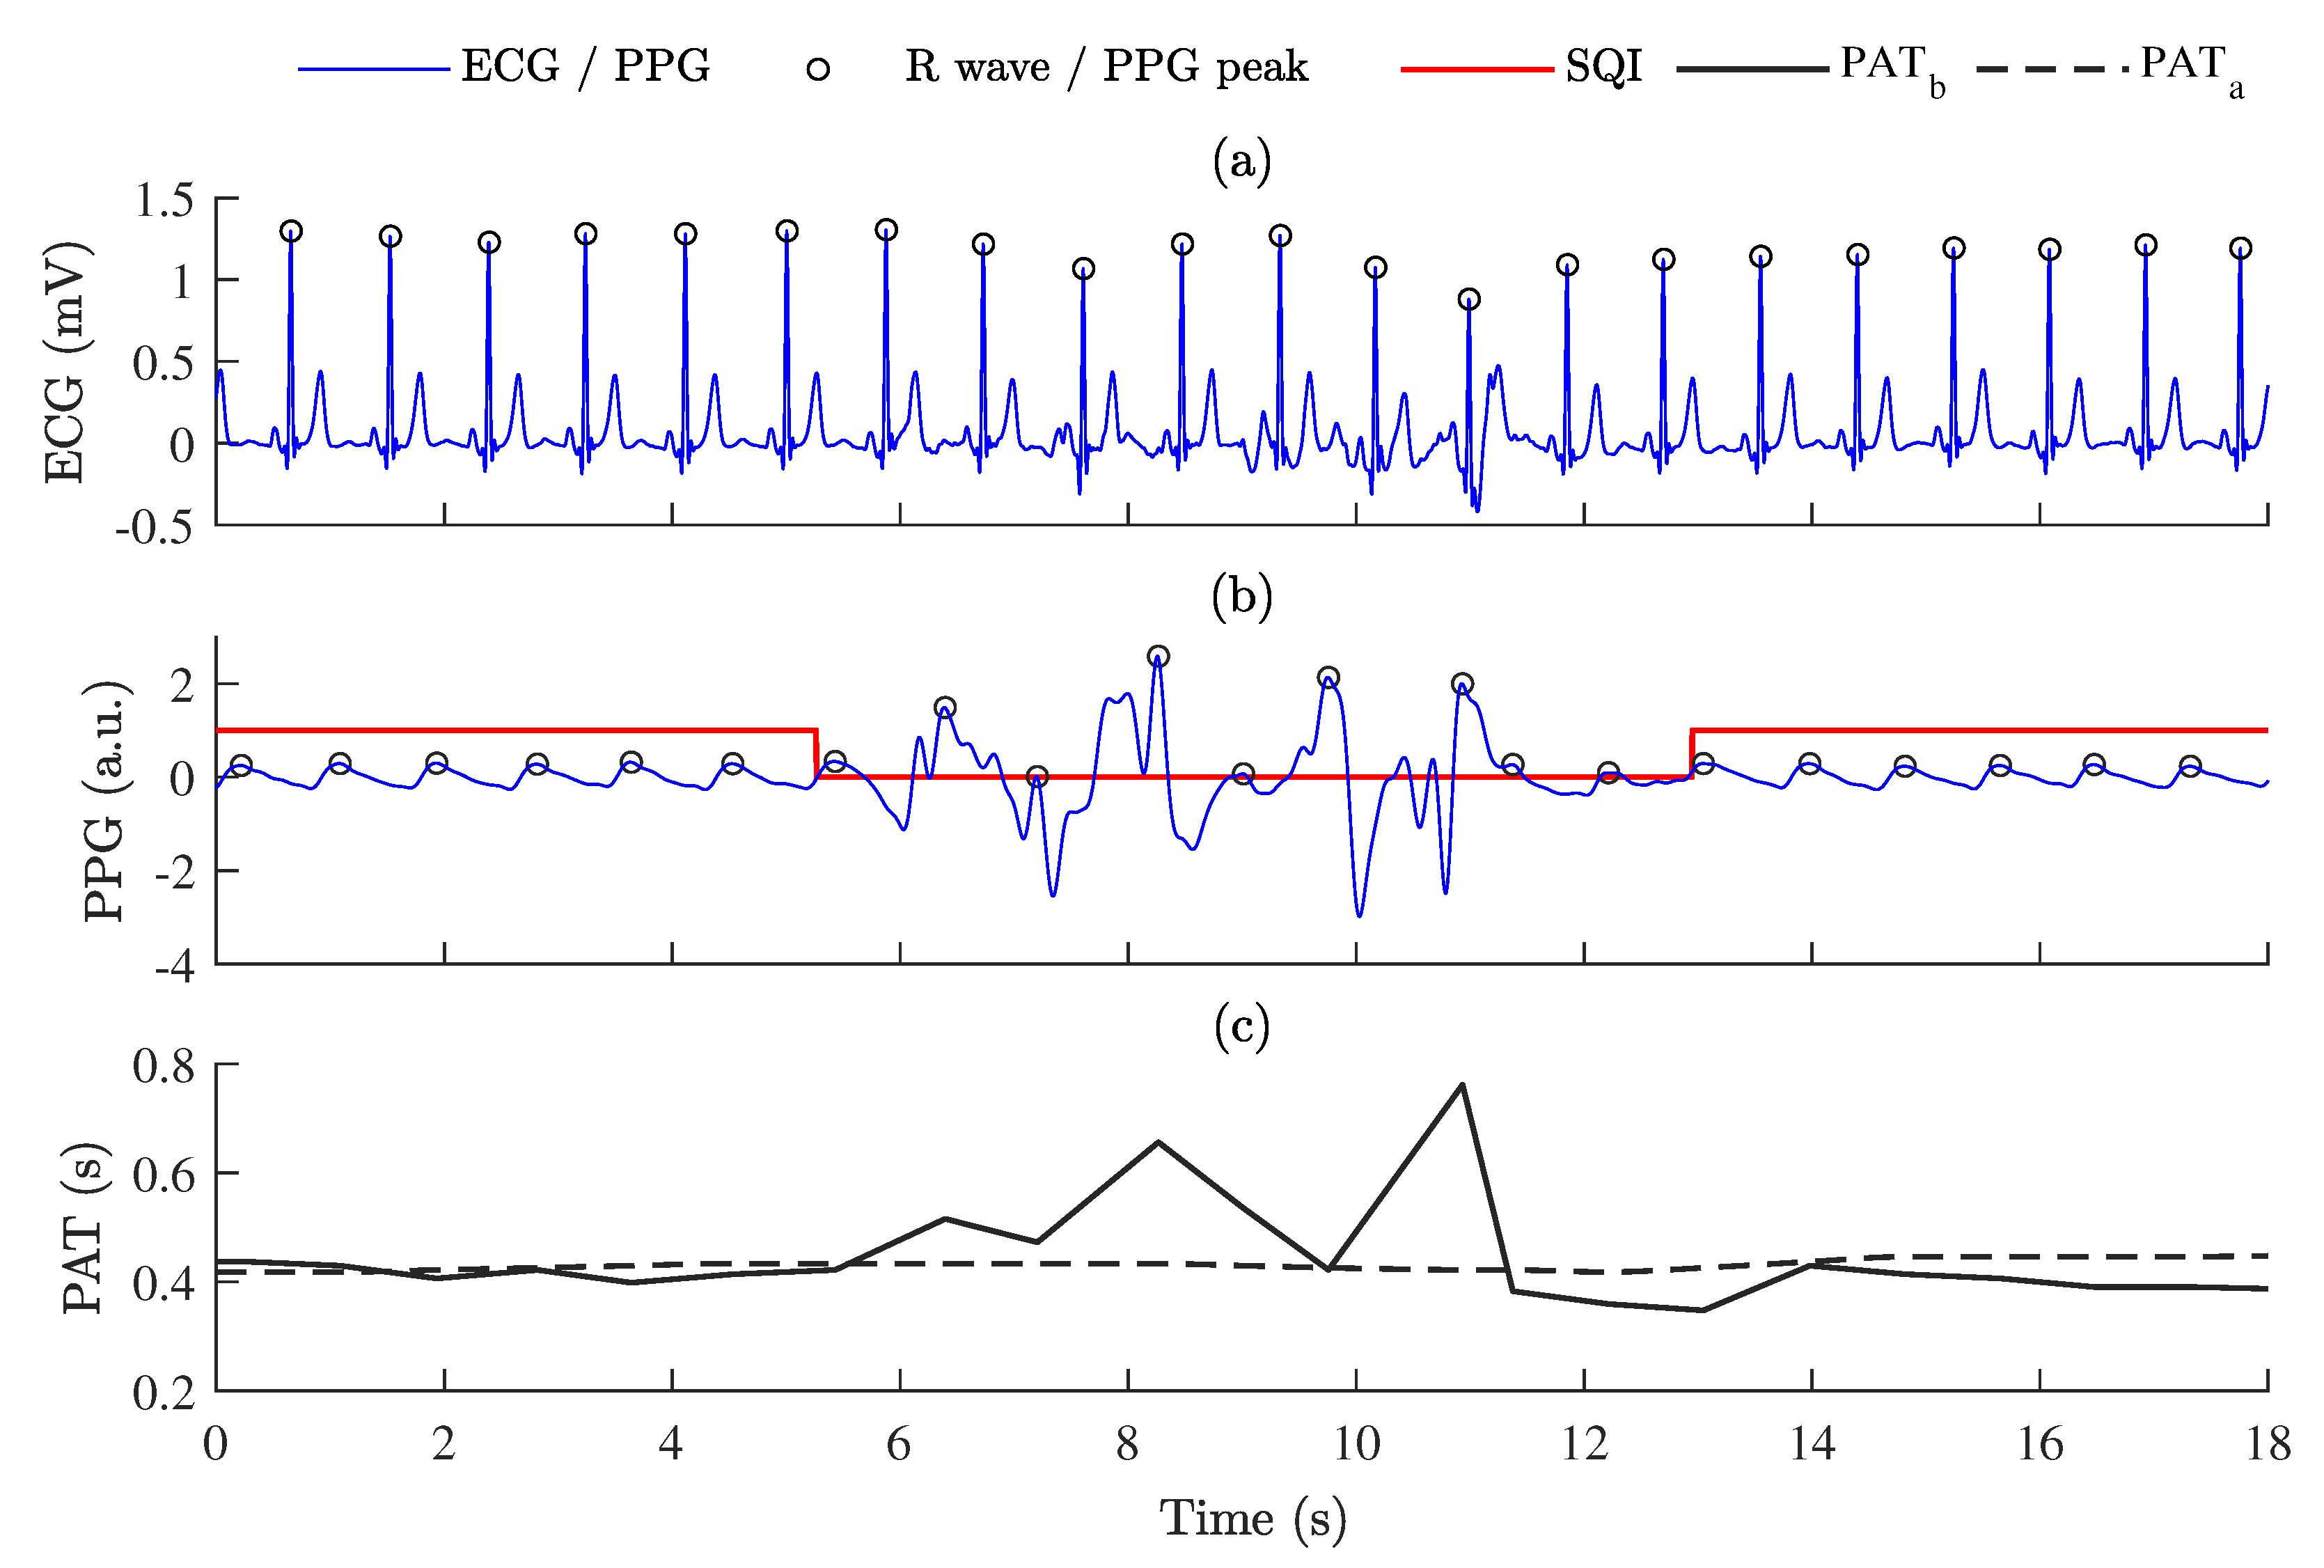
Figure 5.
The relationship between PPG signal quality and PAT: (a) ECG signal; (b) PPG signal with labeled signal quality (SQI); (c) PAT variations estimated as time intervals between ECG R peaks and PPG systolic peaks—PAT before post-processing, , and PAT after post-processing, .
Figure 5.
The relationship between PPG signal quality and PAT: (a) ECG signal; (b) PPG signal with labeled signal quality (SQI); (c) PAT variations estimated as time intervals between ECG R peaks and PPG systolic peaks—PAT before post-processing, , and PAT after post-processing, .
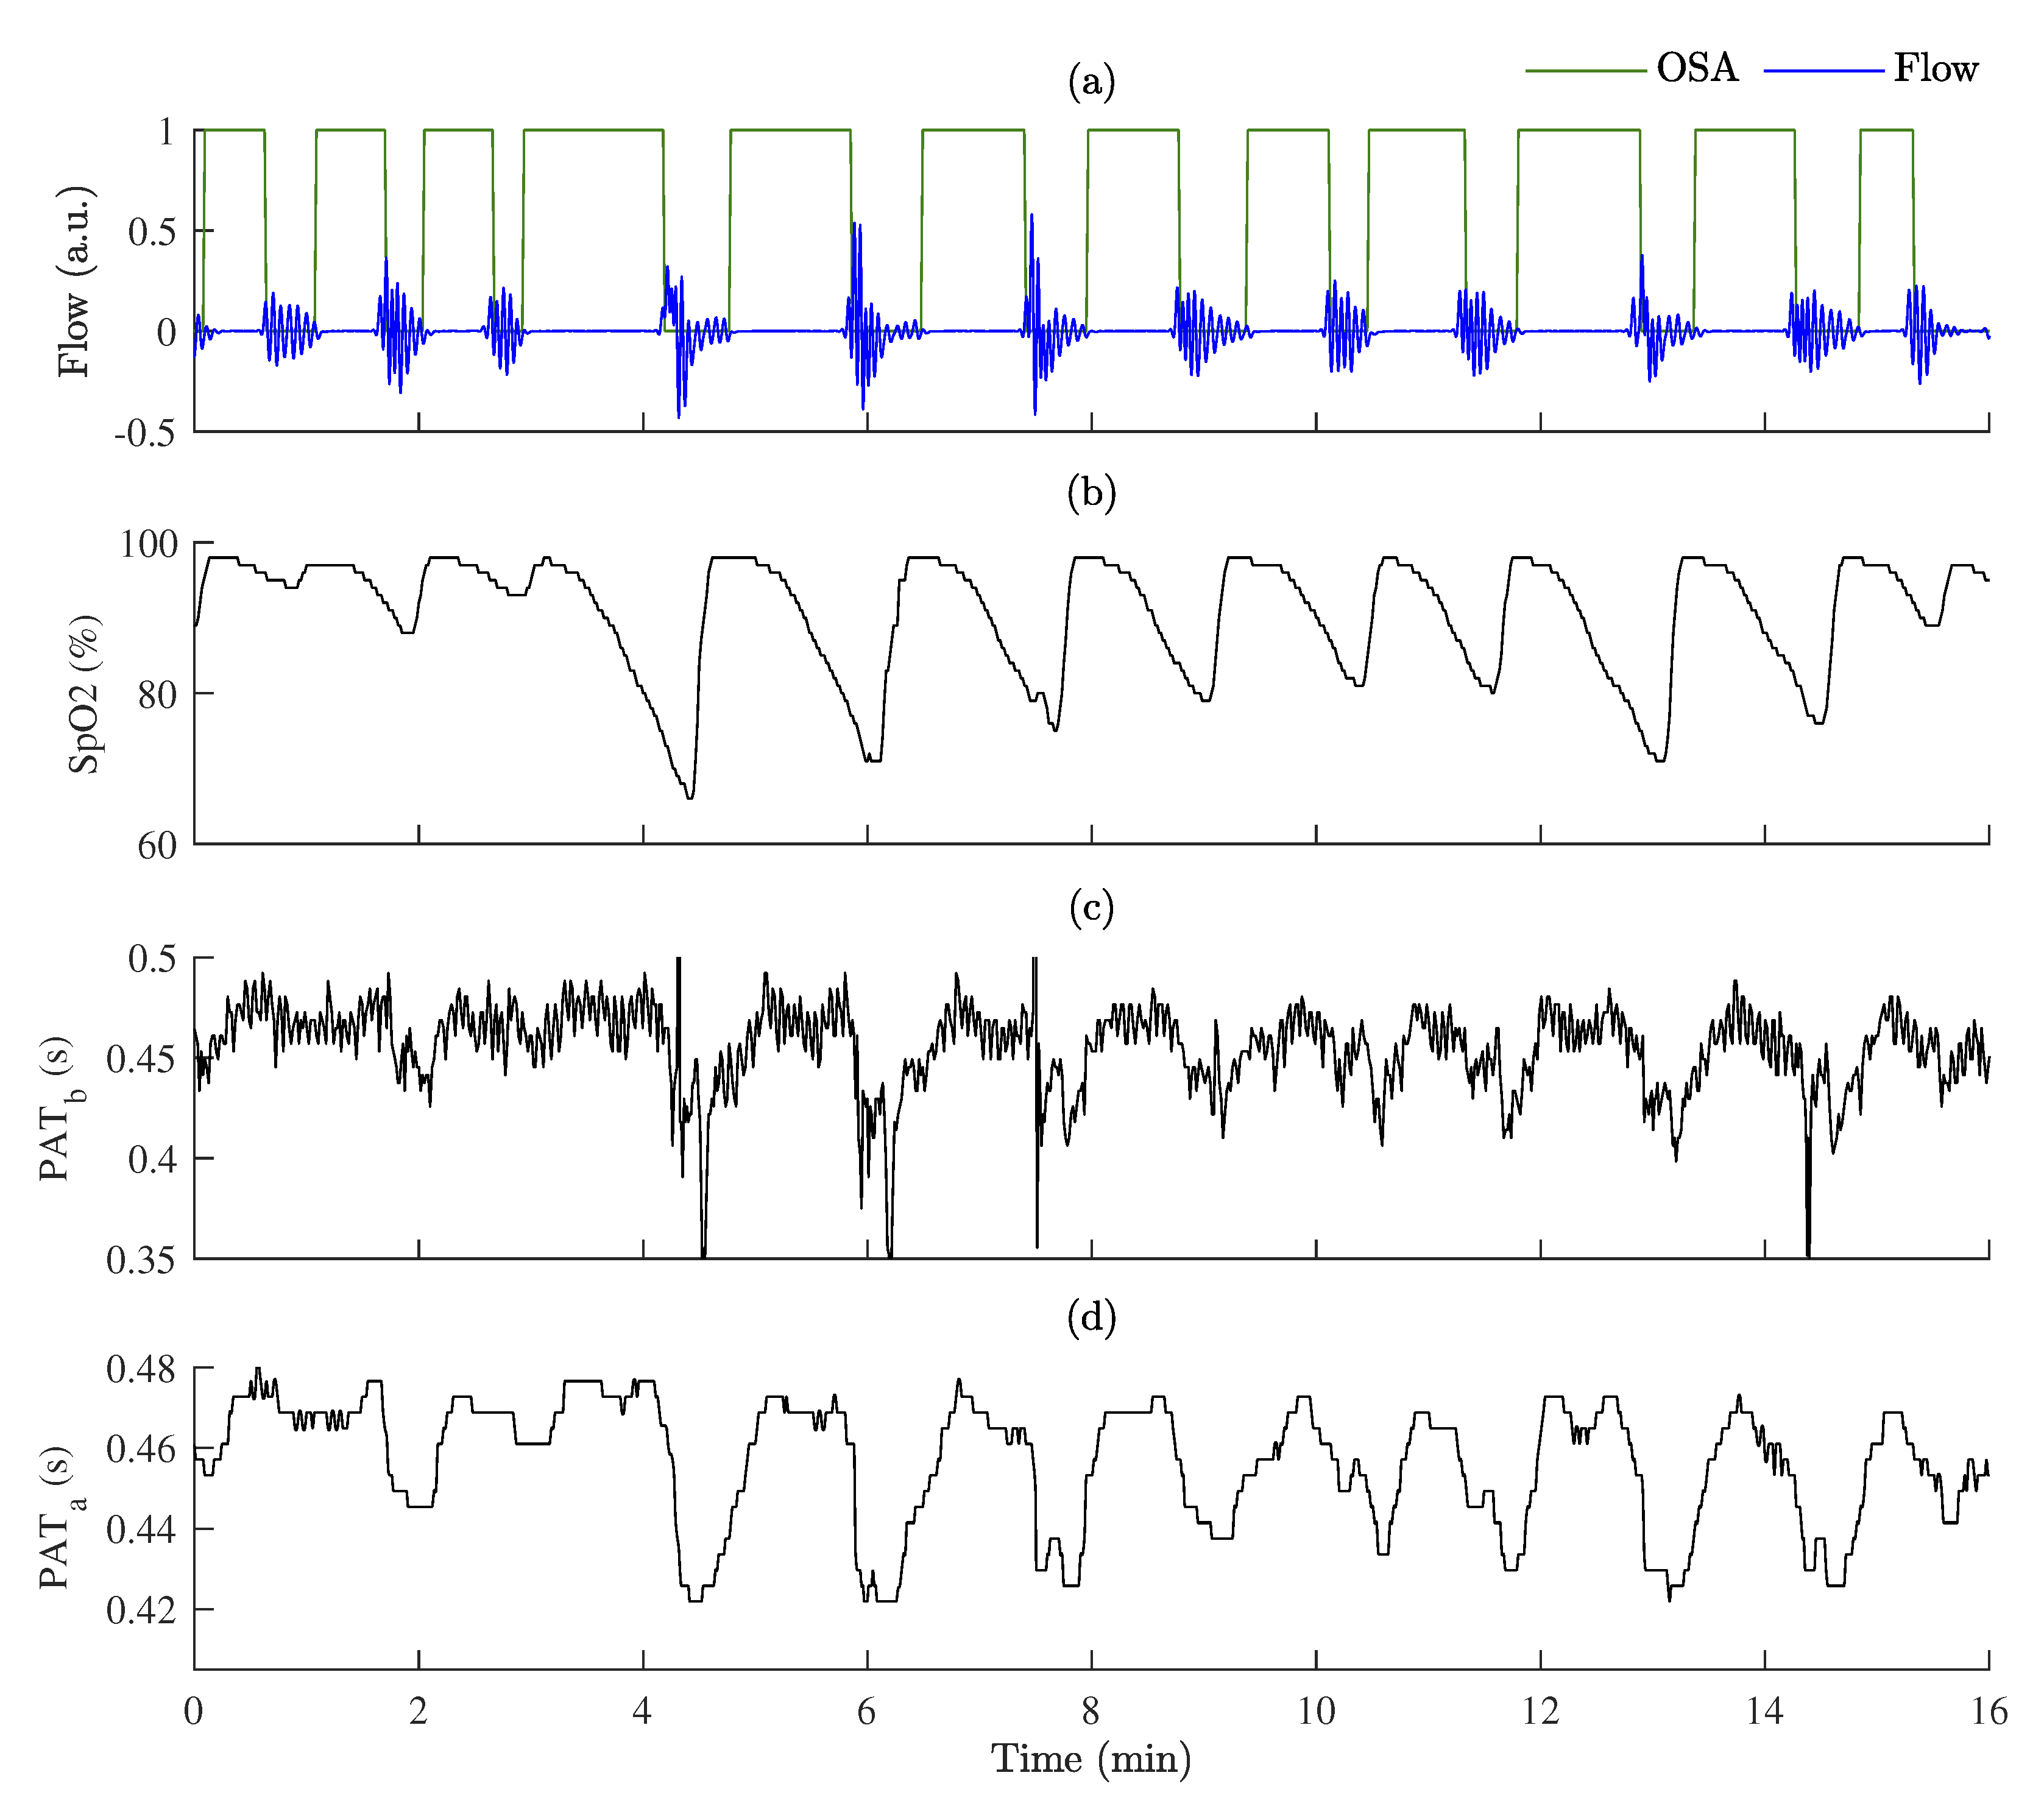
Figure 6.
An example of PAT variations during OSA episodes: (a) respiration flow signal with labeled OSA episodes; (b) SpO2 variations; (c) PAT before post-processing, ; (d) PAT after post-processing, .
Figure 6.
An example of PAT variations during OSA episodes: (a) respiration flow signal with labeled OSA episodes; (b) SpO2 variations; (c) PAT before post-processing, ; (d) PAT after post-processing, .
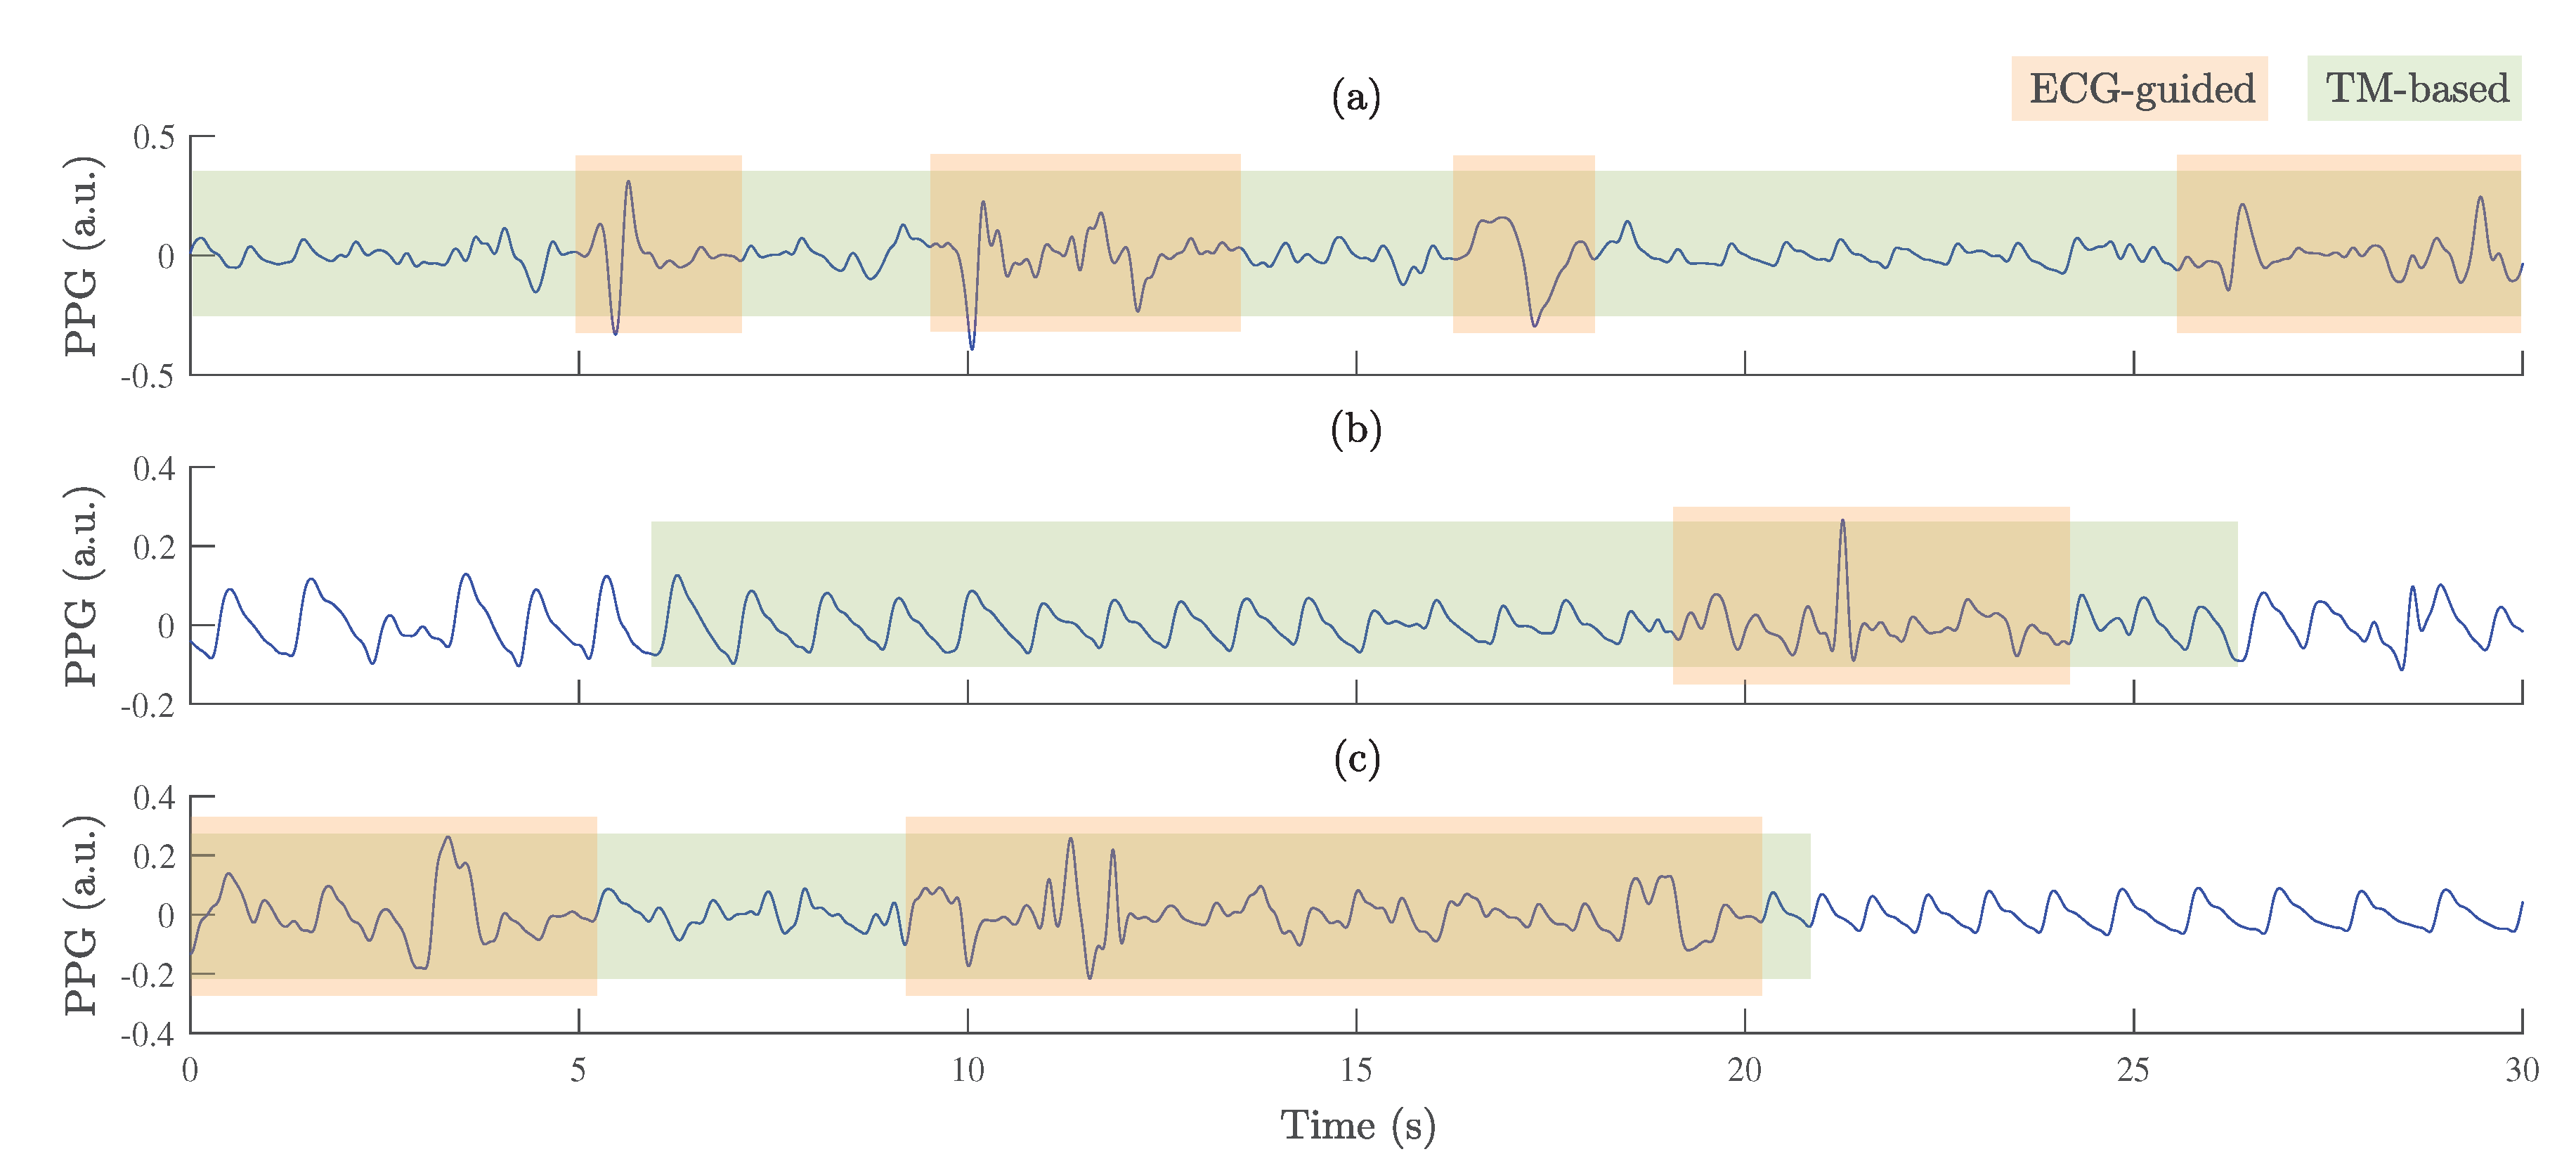
Figure 7.
Examples of PPG signals with labeled poor-quality segments obtained by ECG-guided and TM-based algorithms: (a) wake, (b) oxygen desaturation, and (c) arousal.
Figure 7.
Examples of PPG signals with labeled poor-quality segments obtained by ECG-guided and TM-based algorithms: (a) wake, (b) oxygen desaturation, and (c) arousal.
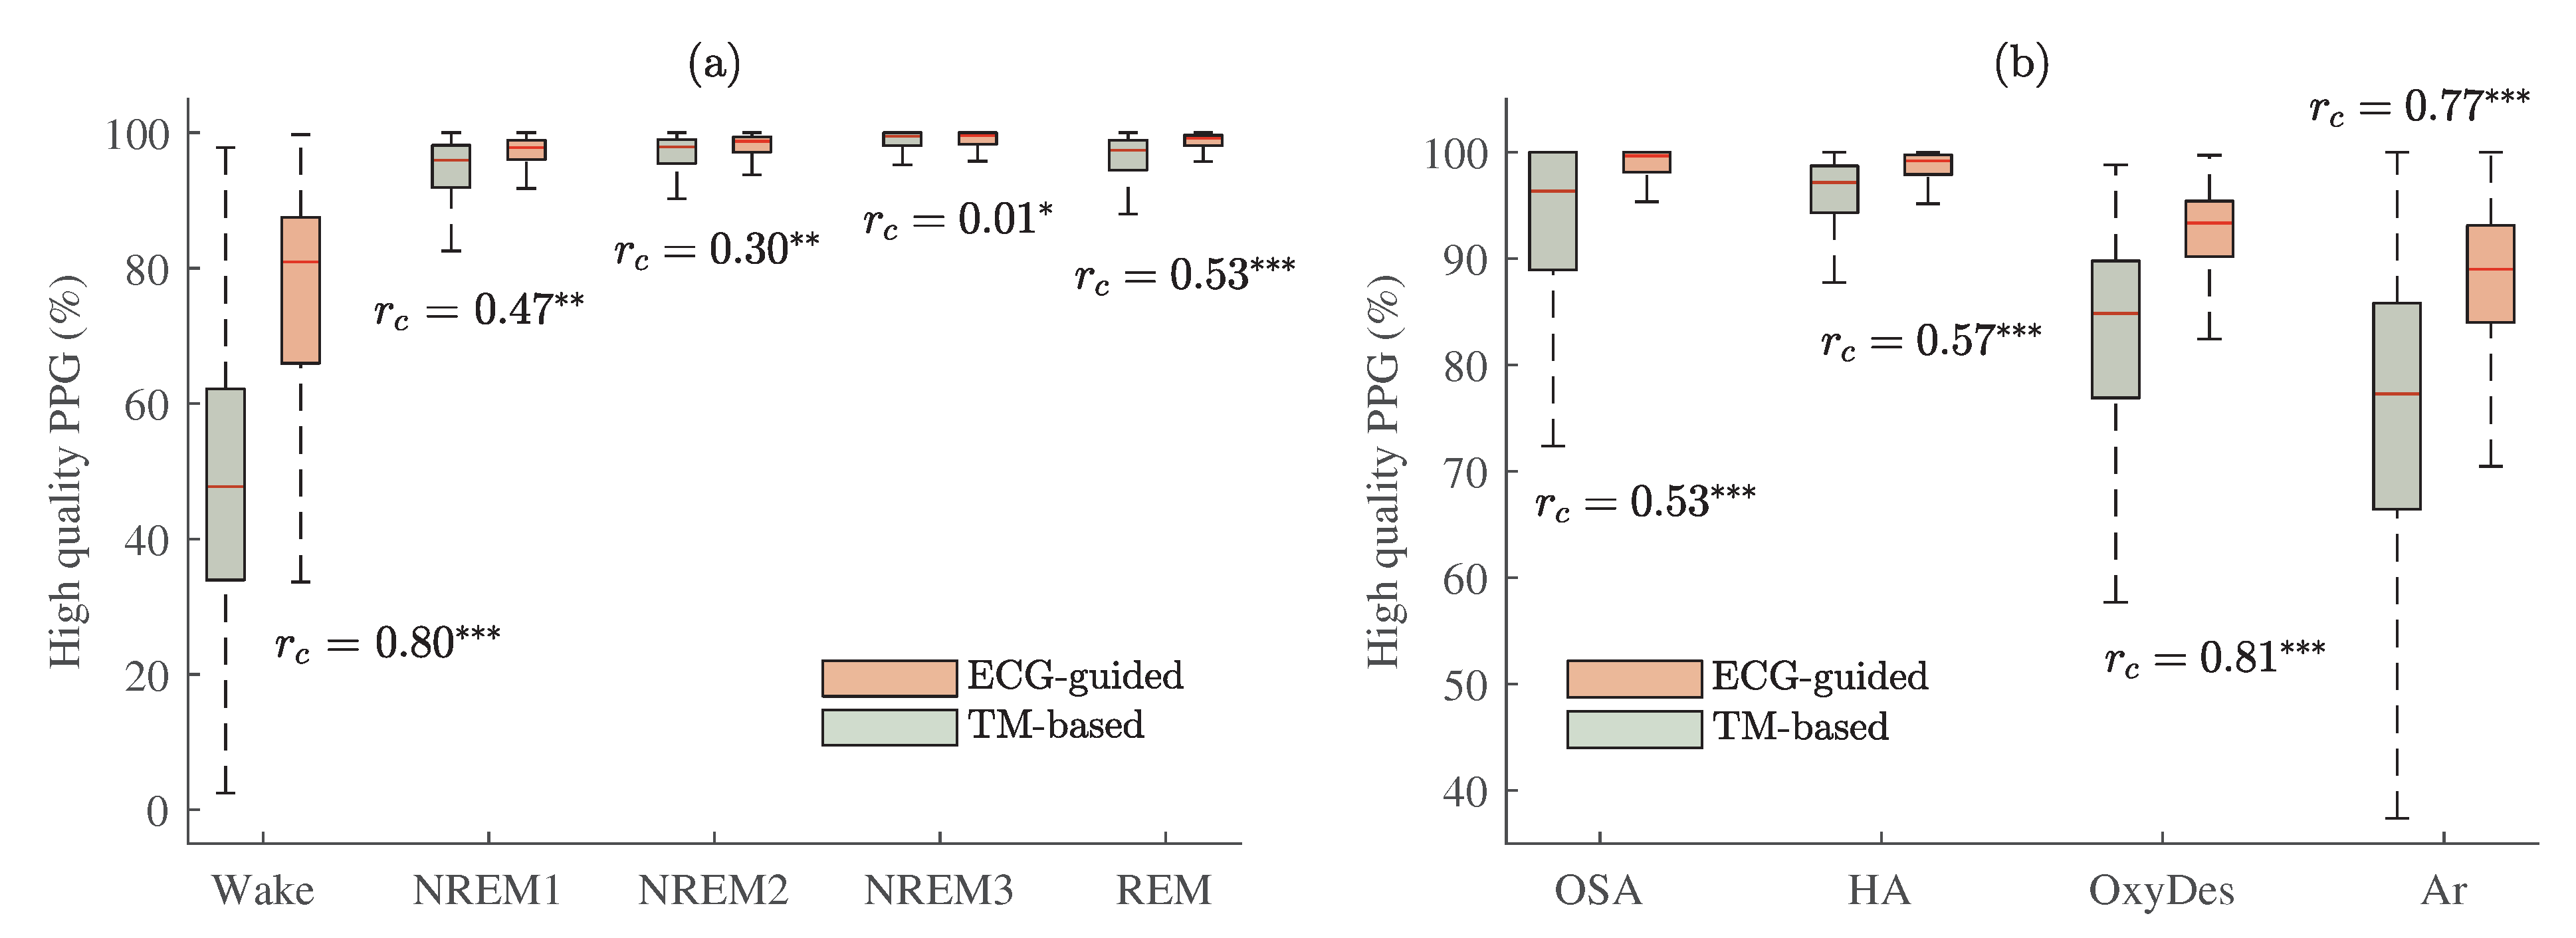
Figure 8.
The proportion of PPG pulse waves classified as high quality by the two signal-quality assessment algorithms with estimated matched-pairs values: ECG-guided and TM-based approaches. Results are shown (a): whilst awake and for different sleep stages; (b) for different events related to sleep-disordered breathing. p < 0.001 and < 0.30 is marked , p < 0.001 and ≥ 0.30—, p < 0.001 and ≥ 0.50—.
Figure 9.
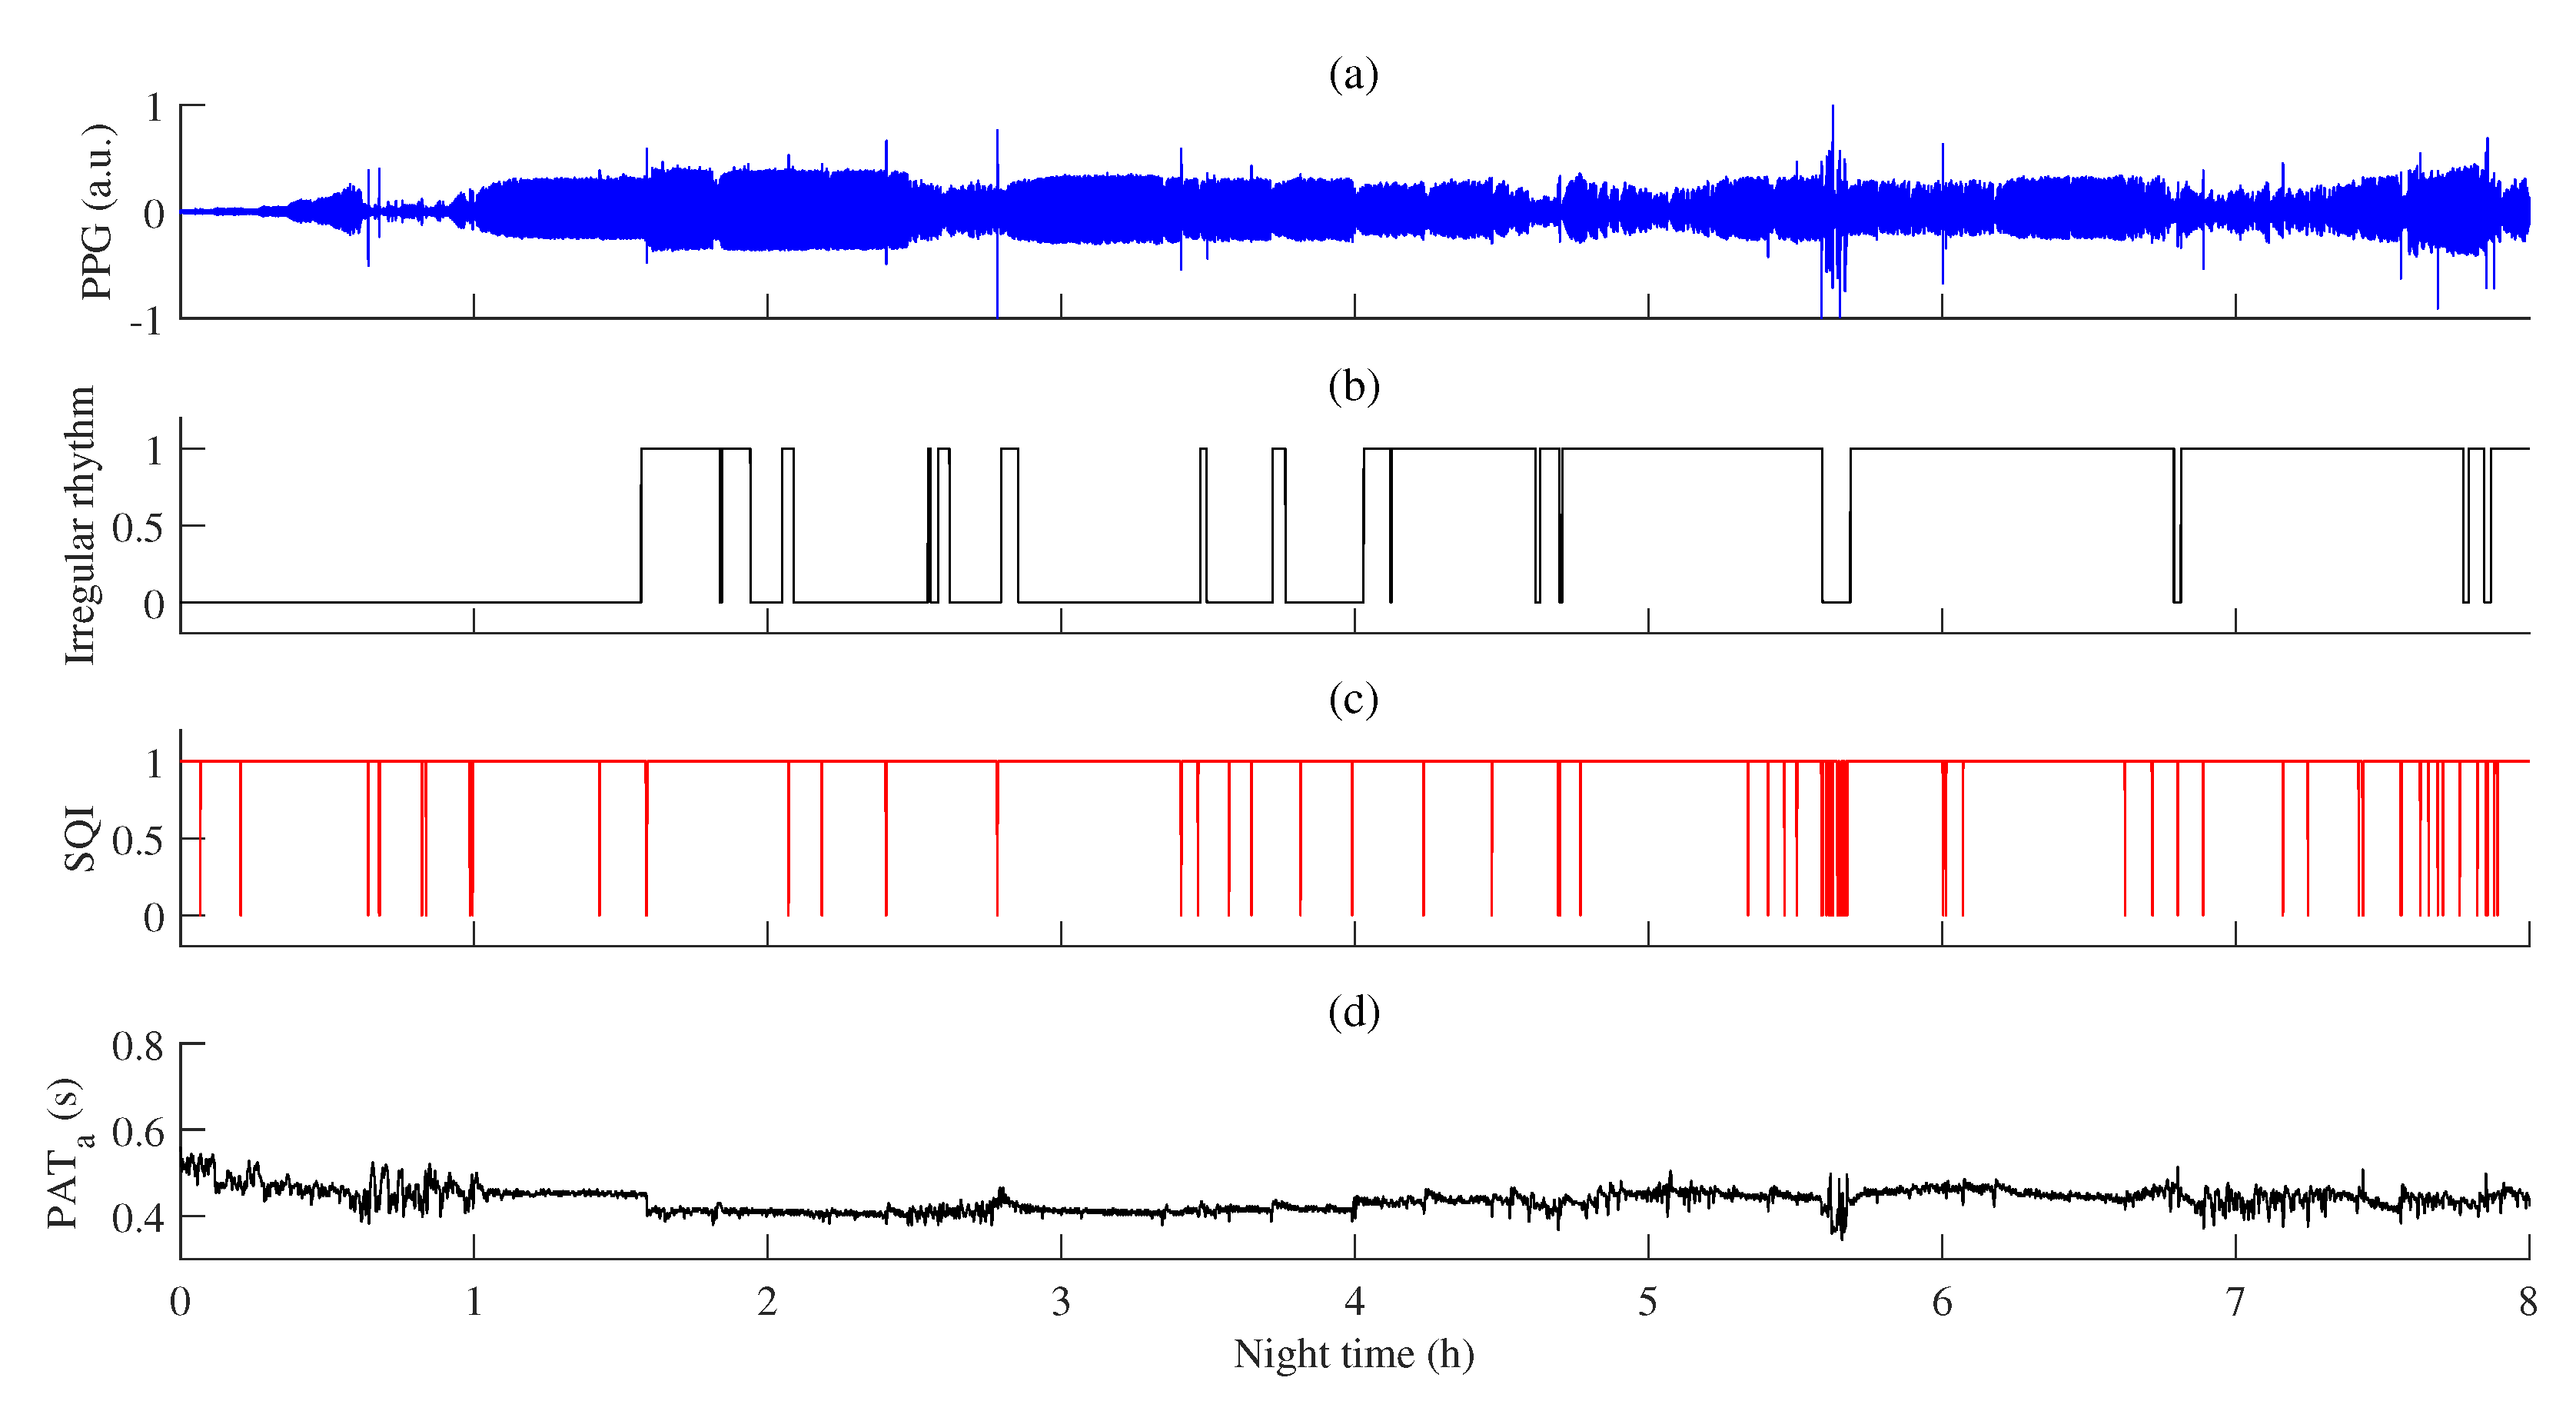
An example of PAT variations during regular and irregular rhythms: (a) PPG signal; (b) detected episodes of irregular rhythm (1—irregular rhythm, 0—regular rhythm); (c) PPG signal quality estimated by the ECG-guided algorithm, SQI (SQI = 1—high-quality, SQI = 0—low-quality); (d) PAT after post-processing, .
Figure 9.
An example of PAT variations during regular and irregular rhythms: (a) PPG signal; (b) detected episodes of irregular rhythm (1—irregular rhythm, 0—regular rhythm); (c) PPG signal quality estimated by the ECG-guided algorithm, SQI (SQI = 1—high-quality, SQI = 0—low-quality); (d) PAT after post-processing, .
Figure 10.
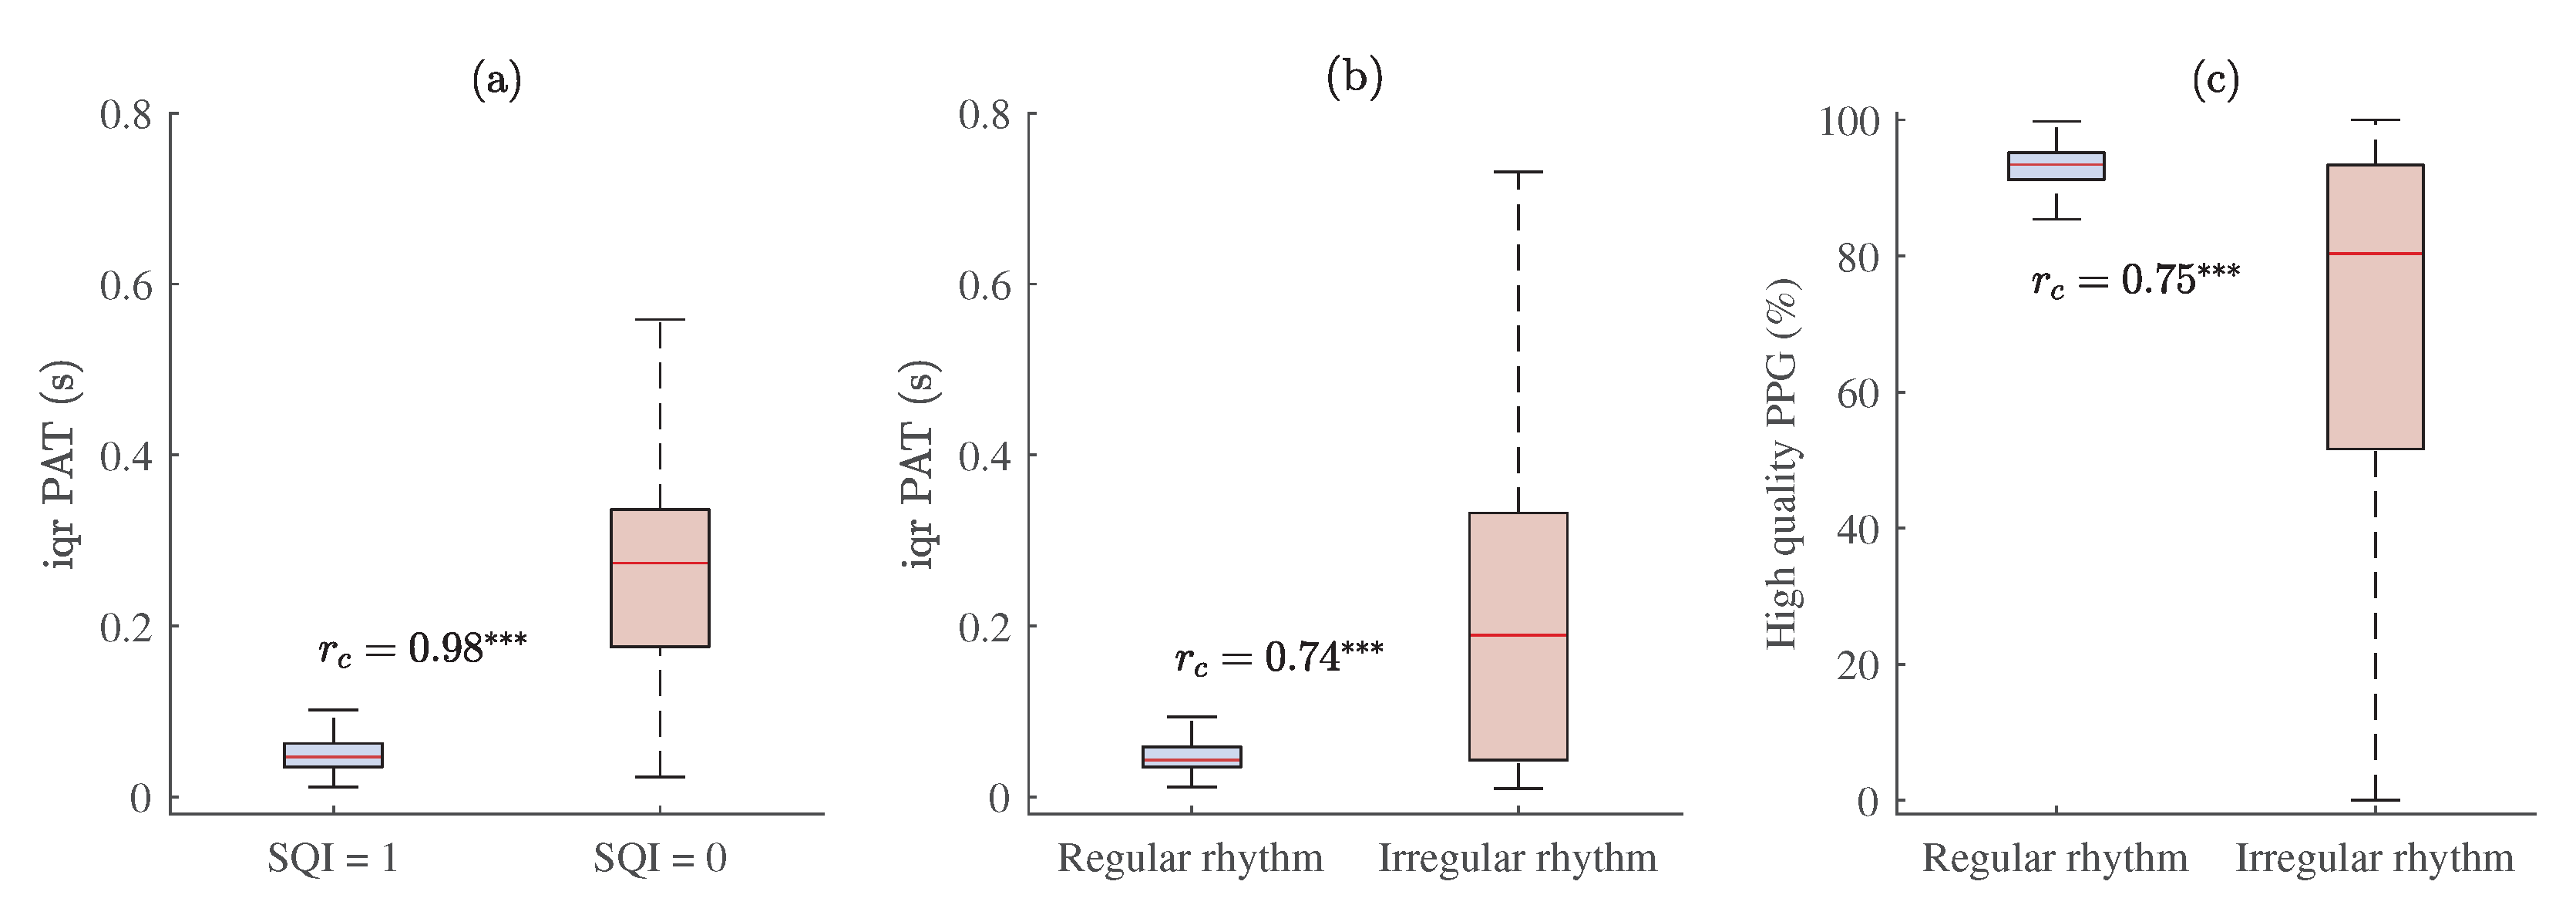
The relationship between PPG signal quality and PAT with estimated matched-pairs values. Interquartile range of PAT across all MESA subjects in: (a) high- (SQI = 1) and low-quality (SQI = 0) PPG segments, and (b) regular and irregular rhythm PPG beat-to-beat intervals; (c) the proportion of high-quality PPG during regular and irregular rhythm PPG pulse waves. p < 0.001 and ≥ 0.50 is marked .
Figure 10.
The relationship between PPG signal quality and PAT with estimated matched-pairs values. Interquartile range of PAT across all MESA subjects in: (a) high- (SQI = 1) and low-quality (SQI = 0) PPG segments, and (b) regular and irregular rhythm PPG beat-to-beat intervals; (c) the proportion of high-quality PPG during regular and irregular rhythm PPG pulse waves. p < 0.001 and ≥ 0.50 is marked .
Figure 11.
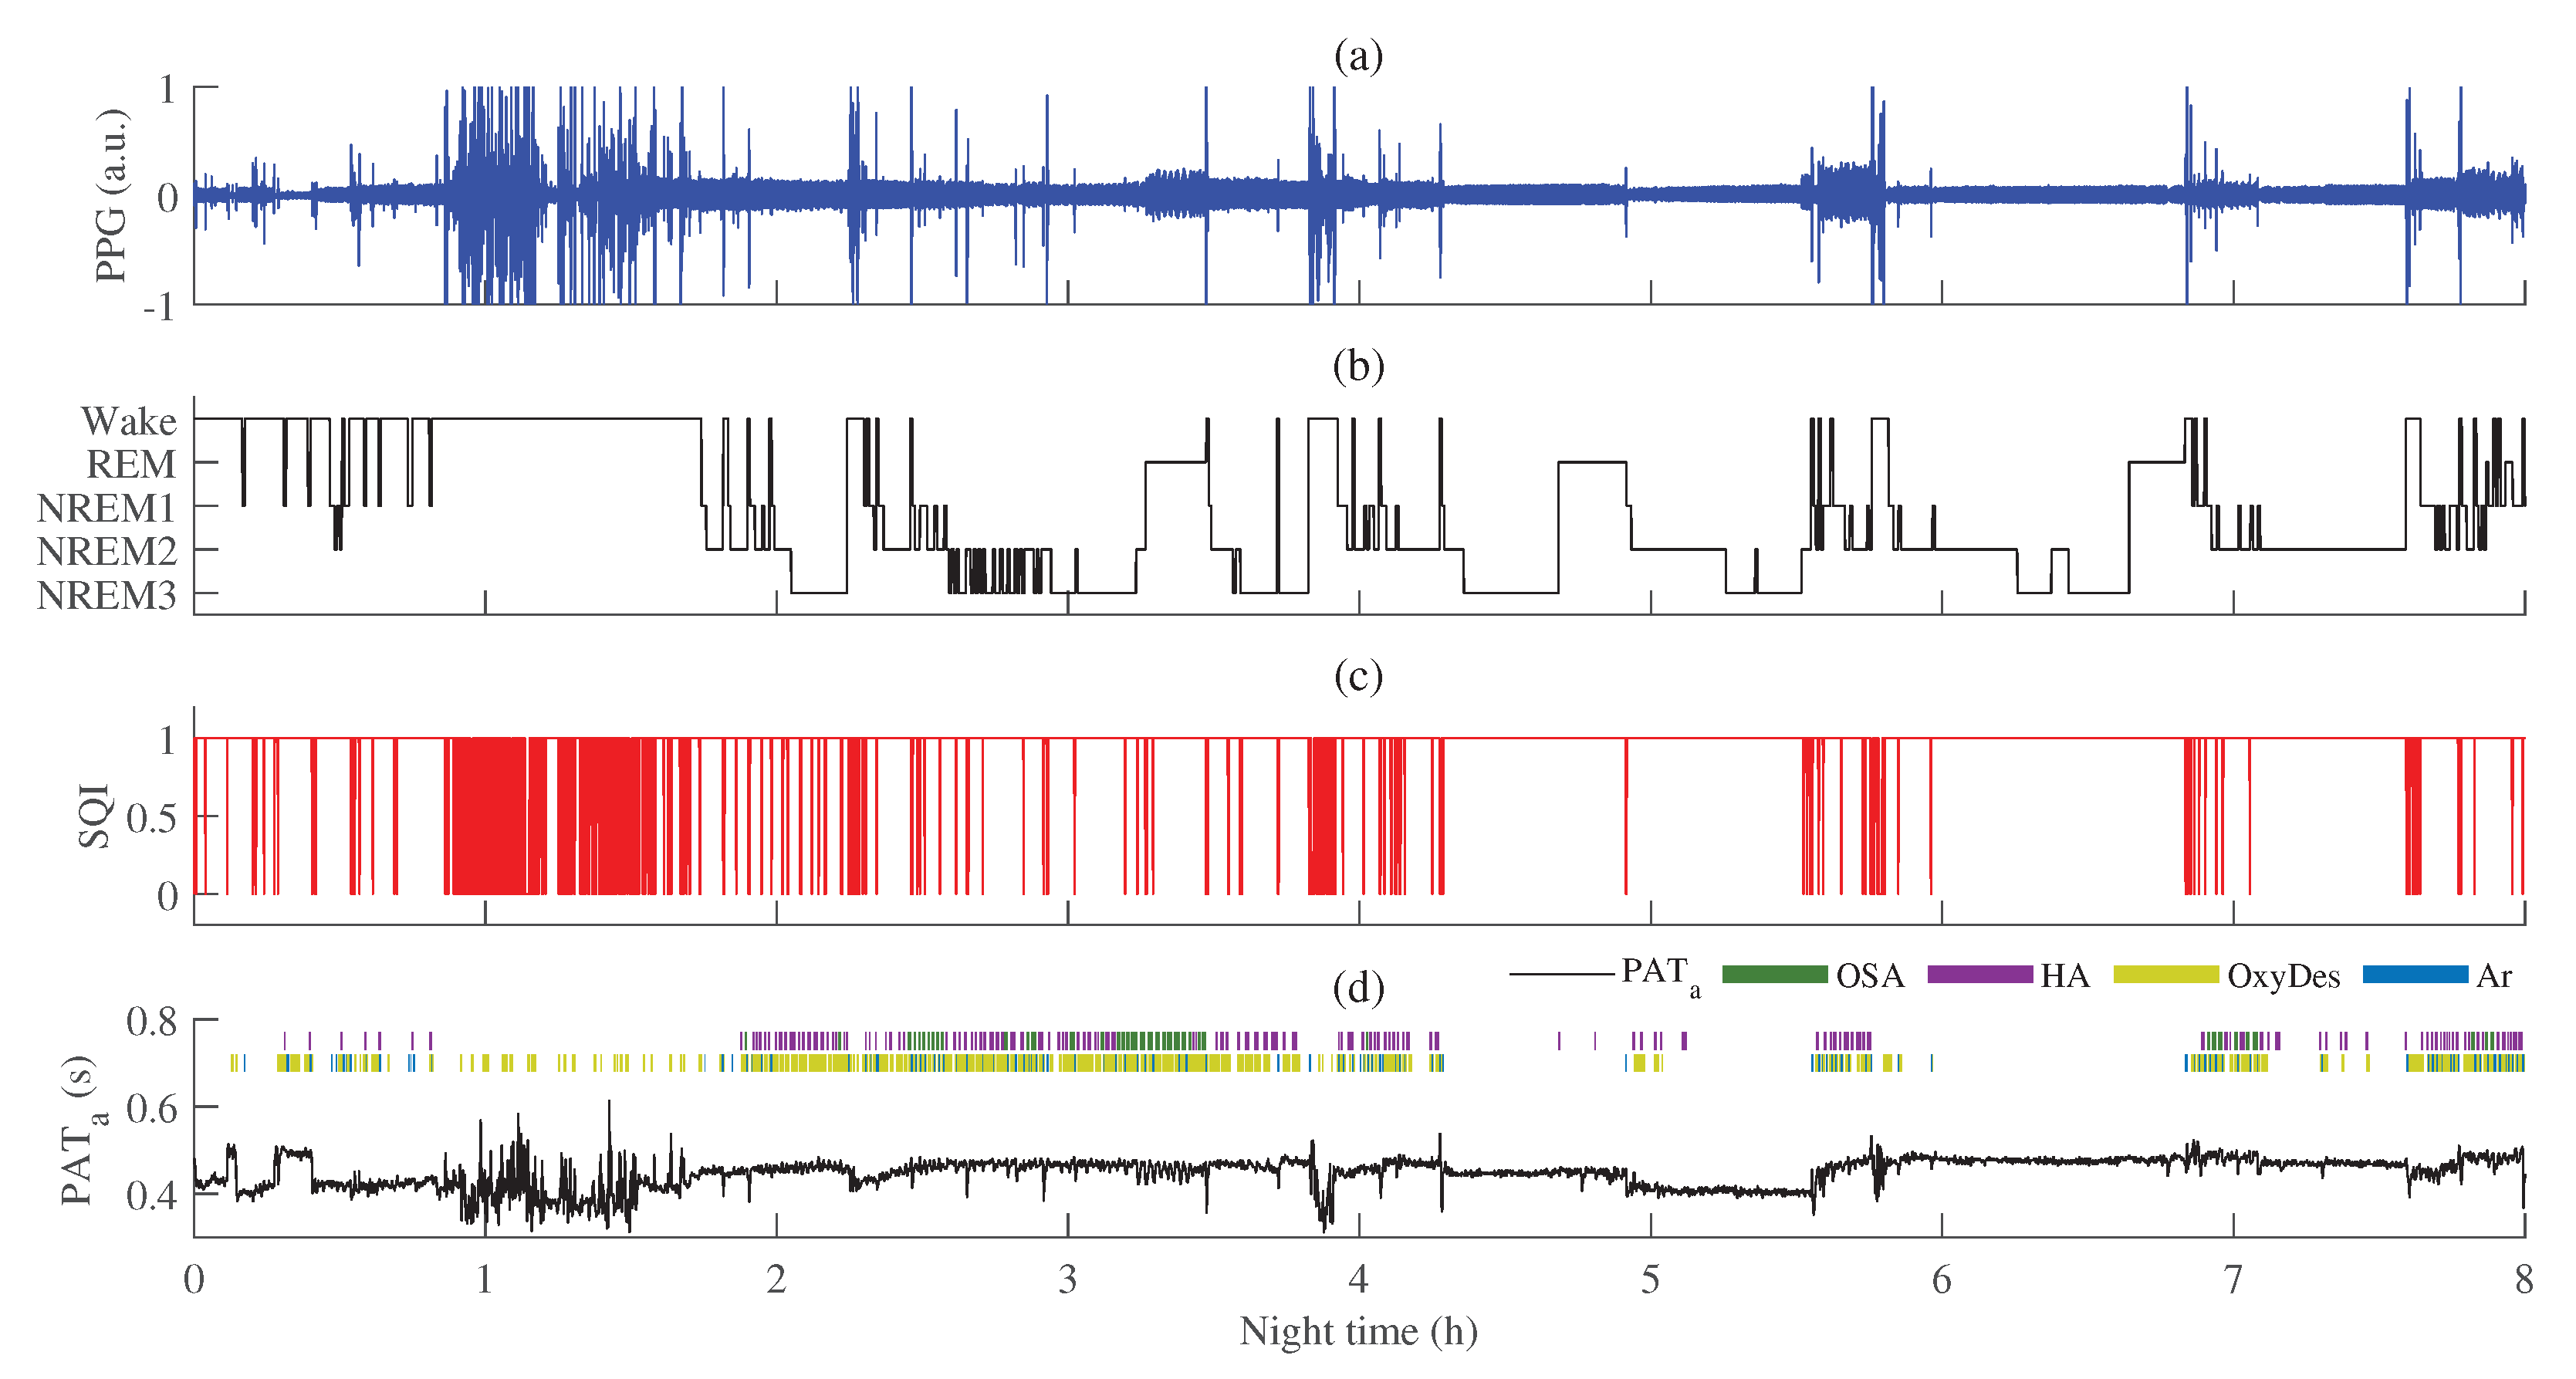
An example of PAT variations in different sleep stages: (a) PPG signal; (b) recorded hypnogram during PSG; (c) PPG signal quality estimated by the ECG-guided algorithm, SQI (SQI = 1—high-quality, SQI = 0—low-quality); (d) PAT after post-processing, , with annotated obstructive sleep apnea (OSA), hypopnea (HA), oxygen desaturation (OxyDes), and arousal (Ar) episodes.
Figure 11.
An example of PAT variations in different sleep stages: (a) PPG signal; (b) recorded hypnogram during PSG; (c) PPG signal quality estimated by the ECG-guided algorithm, SQI (SQI = 1—high-quality, SQI = 0—low-quality); (d) PAT after post-processing, , with annotated obstructive sleep apnea (OSA), hypopnea (HA), oxygen desaturation (OxyDes), and arousal (Ar) episodes.
Figure 12.
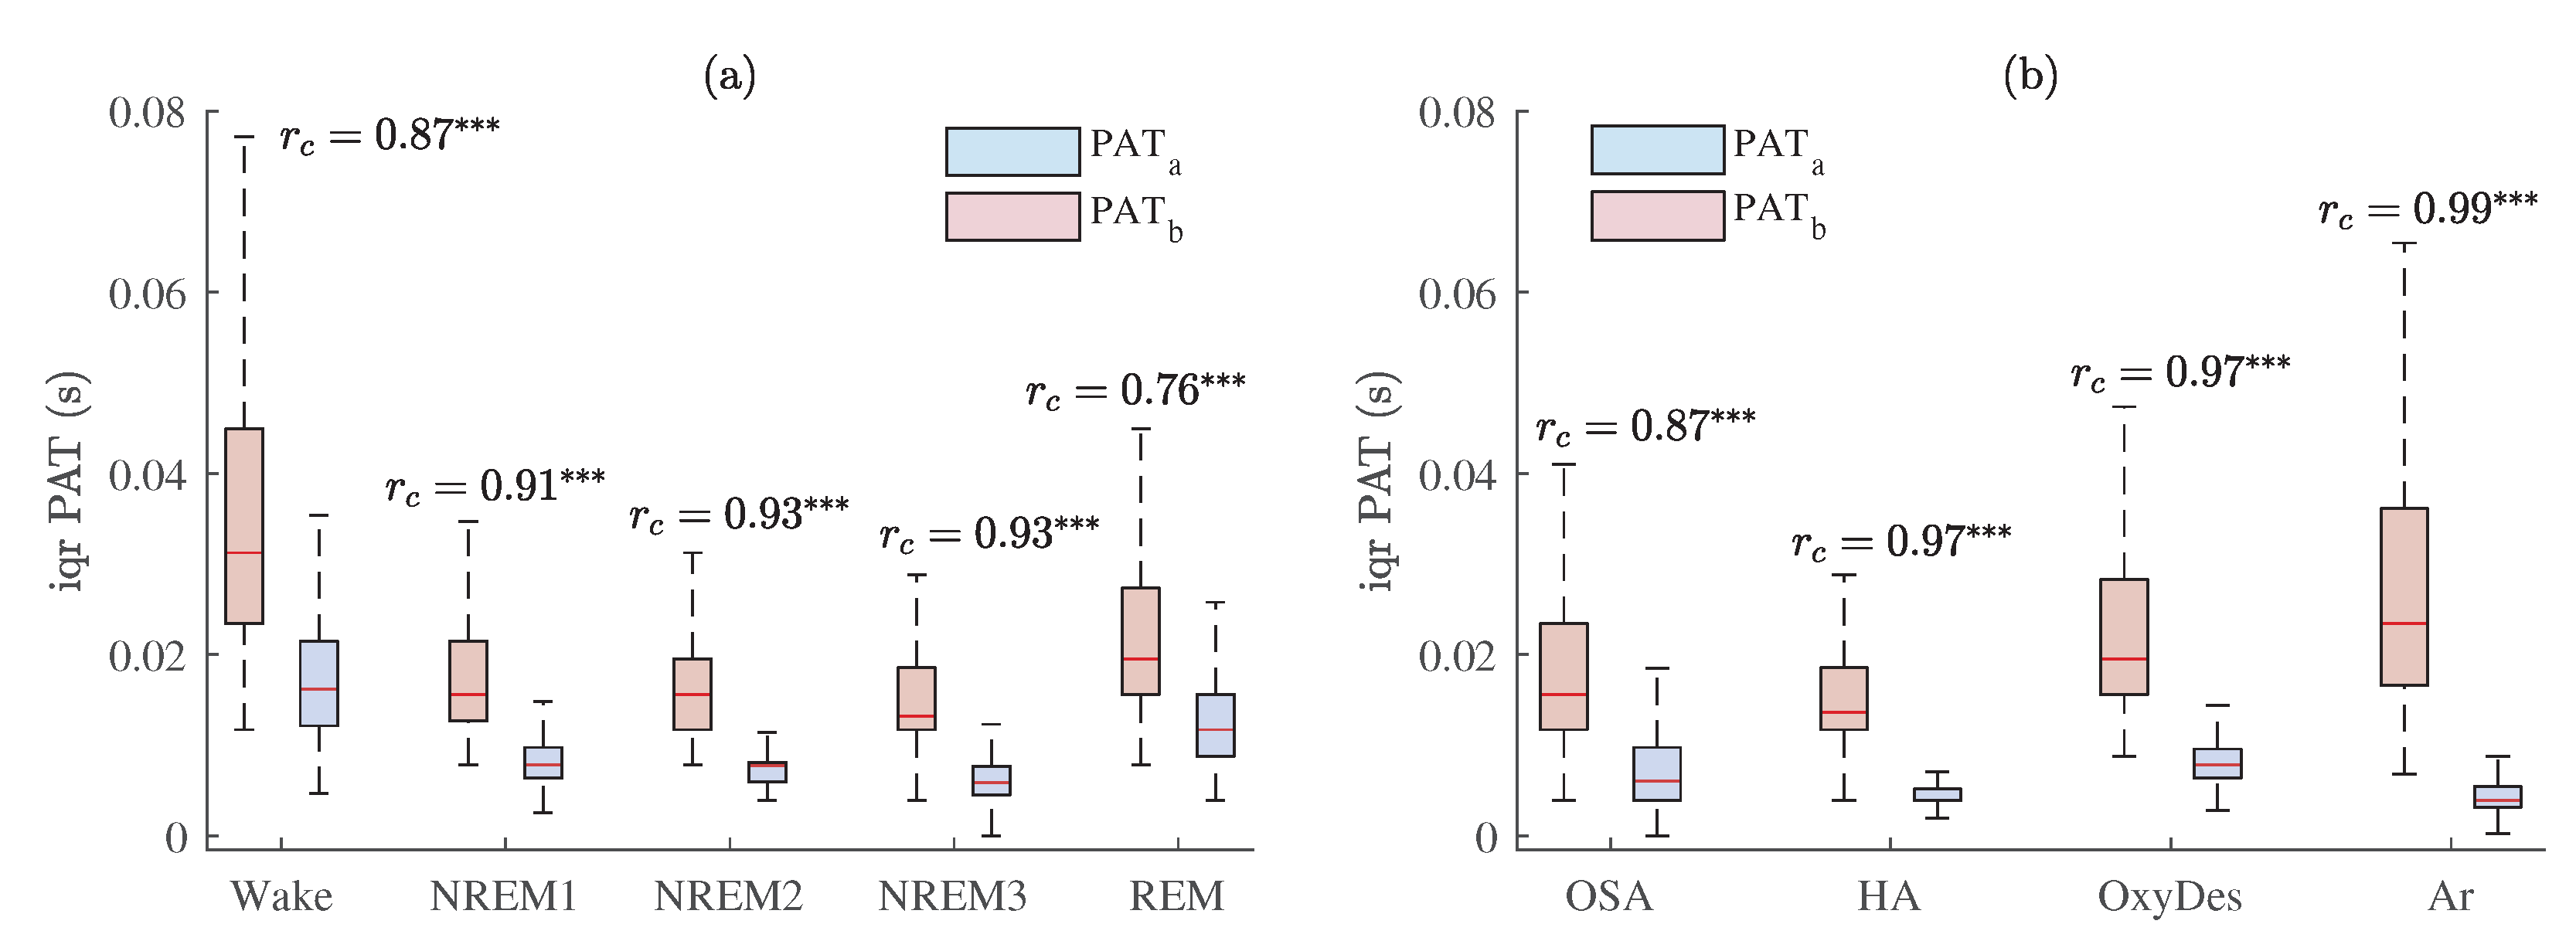
The interquartile range of PAT across all MESA subjects with estimated matched-pairs values in: (a) different sleep stages; (b) different events related to sleep-disordered breathing. Results are shown before and after PAT post-processing, and , respectively. p < 0.001 and ≥ 0.50 is marked .
Figure 12.
The interquartile range of PAT across all MESA subjects with estimated matched-pairs values in: (a) different sleep stages; (b) different events related to sleep-disordered breathing. Results are shown before and after PAT post-processing, and , respectively. p < 0.001 and ≥ 0.50 is marked .
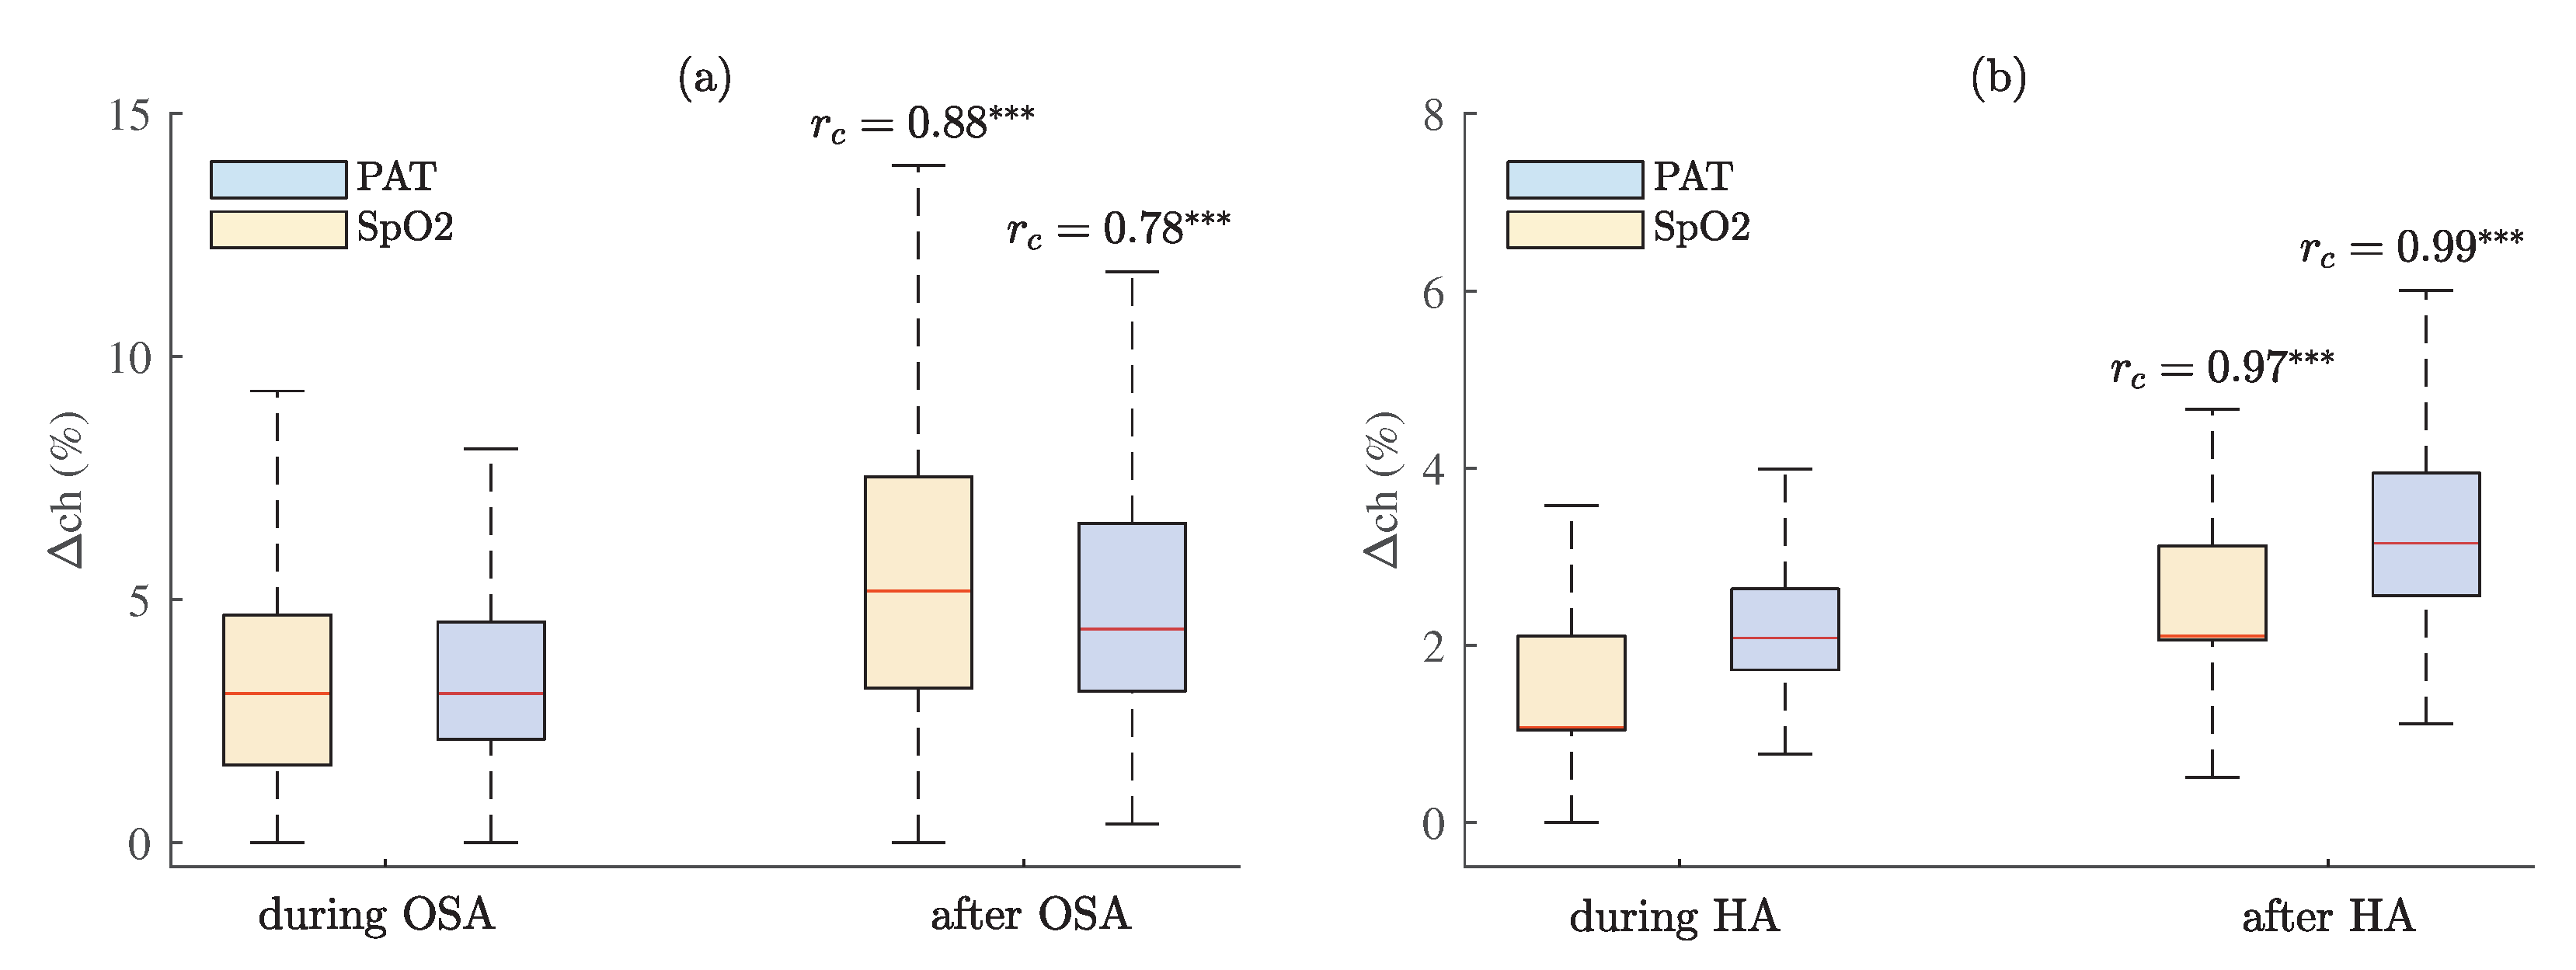
Figure 13.
The percentage changes of PAT and SpO2 during and 30 s after (a) OSA and (b) hypopnea episodes across all subjects with estimated matched-pairs values. p < 0.001 and ≥ 0.50 is marked .
Figure 13.
The percentage changes of PAT and SpO2 during and 30 s after (a) OSA and (b) hypopnea episodes across all subjects with estimated matched-pairs values. p < 0.001 and ≥ 0.50 is marked .
Table 1.
The matched-pairs values of proportions of high-quality PPG between different sleep stages obtained by using ECG-guided (orange background) and TM-based algorithms (green background). p < 0.001 and < 0.30 is marked , p < 0.001 and ≥ 0.30—, p < 0.001 and ≥ 0.50—.
Table 1.
The matched-pairs values of proportions of high-quality PPG between different sleep stages obtained by using ECG-guided (orange background) and TM-based algorithms (green background). p < 0.001 and < 0.30 is marked , p < 0.001 and ≥ 0.30—, p < 0.001 and ≥ 0.50—.
| Matched-Pairs | Wake | NREM1 | NREM2 | NREM3 | REM |
|---|
| Wake | | | | | |
| NREM1 | | | | | |
| NREM2 | | | | | |
| NREM3 | | | | | |
| REM | | | | | |
Table 2.
The matched-pairs values of proportions of high-quality PPG between sleep-disordered breathing events obtained by using ECG-guided (orange background) and TM-based algorithms (green background), where OSA—obstructive sleep apnea, HA—hypopnea, OxyDes —oxygen desaturation, Ar—arousal events. p < 0.001 and < 0.30 is marked , p < 0.001 and ≥ 0.30—, p < 0.001 and ≥ 0.50—.
| Matched-Pairs | OSA | HA | OxyDes | Ar |
|---|
| OSA | | | | |
| HA | | | | |
| OxyDes | | | | |
| Ar | | | | |
Table 3.
The matched-pairs values of interquartile ranges of PAT distributions between different sleep stages after (blue background) and before post-processing (red background). p < 0.001 and ≥ 0.30 is marked , p < 0.001 and ≥ 0.50—.
Table 3.
The matched-pairs values of interquartile ranges of PAT distributions between different sleep stages after (blue background) and before post-processing (red background). p < 0.001 and ≥ 0.30 is marked , p < 0.001 and ≥ 0.50—.
| Matched-Pairs | Wake | NREM1 | NREM2 | NREM3 | REM |
|---|
| Wake | | | | | |
| NREM1 | | | | | |
| NREM2 | | | | | |
| NREM3 | | | | | |
| REM | | | | | |
Table 4.
The matched-pairs values of interquartile ranges of PAT distributions between different events related to sleep-disordered breathing after (blue background) and before post-processing (red background), where OSA—obstructive sleep apnea, HA—hypopnea, OxyDes—oxygen desaturation, Ar—arousal events. p < 0.001 and < 0.30 is marked , p < 0.001 and ≥ 0.30—, p < 0.001 and ≥ 0.50—.
| Matched-Pairs | OSA | HA | OxyDes | Ar |
|---|
| OSA | | | | |
| HA | | | | |
| OxyDes | | | | |
| Ar | | | | |


