

Remote Sensing Image Characteristics and Typical Area Analysis of Taiyuan Xishan Ecological Restoration Area
Abstract
:1. Introduction
- We focus on how to use the RGB image data to obtain vegetation cover information.
- We use the RGB remote sensing image data to construct new vegetation coverage extraction models that are based on the cell dichotomy method by combining different indexes.
- A new RGB vegetation coverage CIVE calculation model is innovatively proposed for using the RGB image data to quickly and accurately extract vegetation coverage information.
- We selected vegetation coverage as the evaluation index of ecological restoration effect, and a new CIVE model for calculating RGB vegetation coverage is proposed.
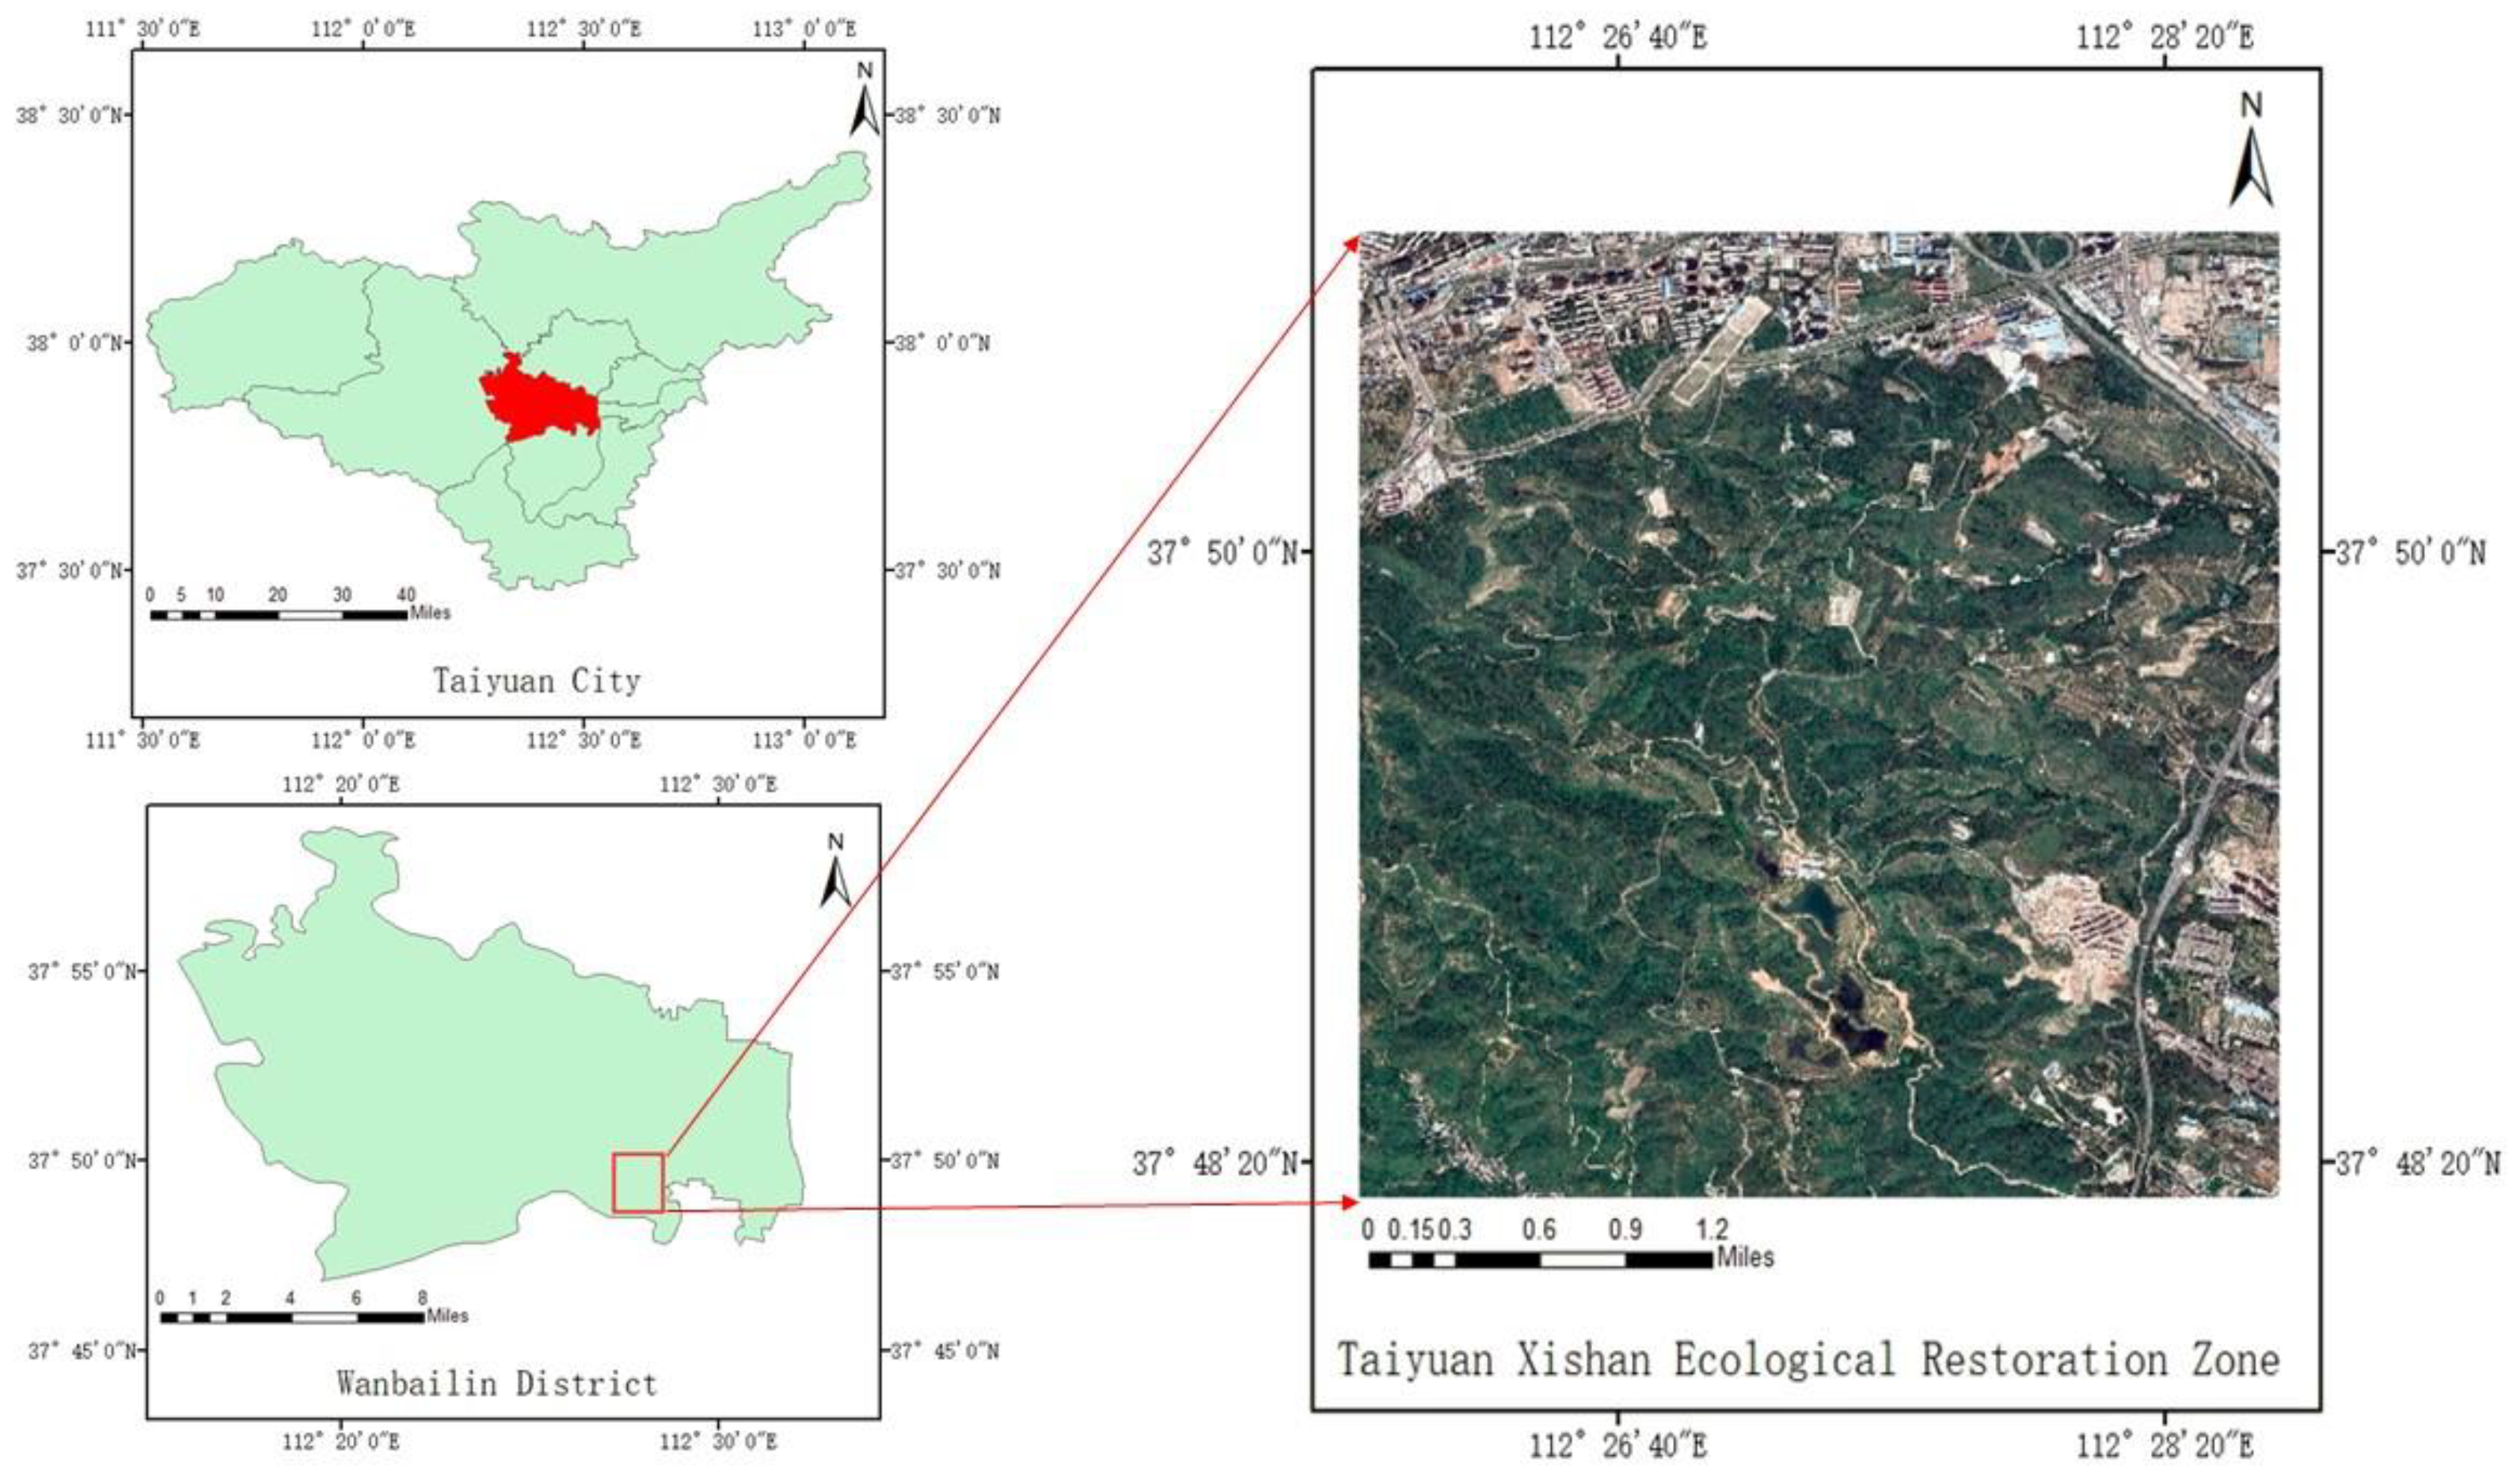
2. Overview of the Study Area and Data Selection
2.1. Overview of the Study Area
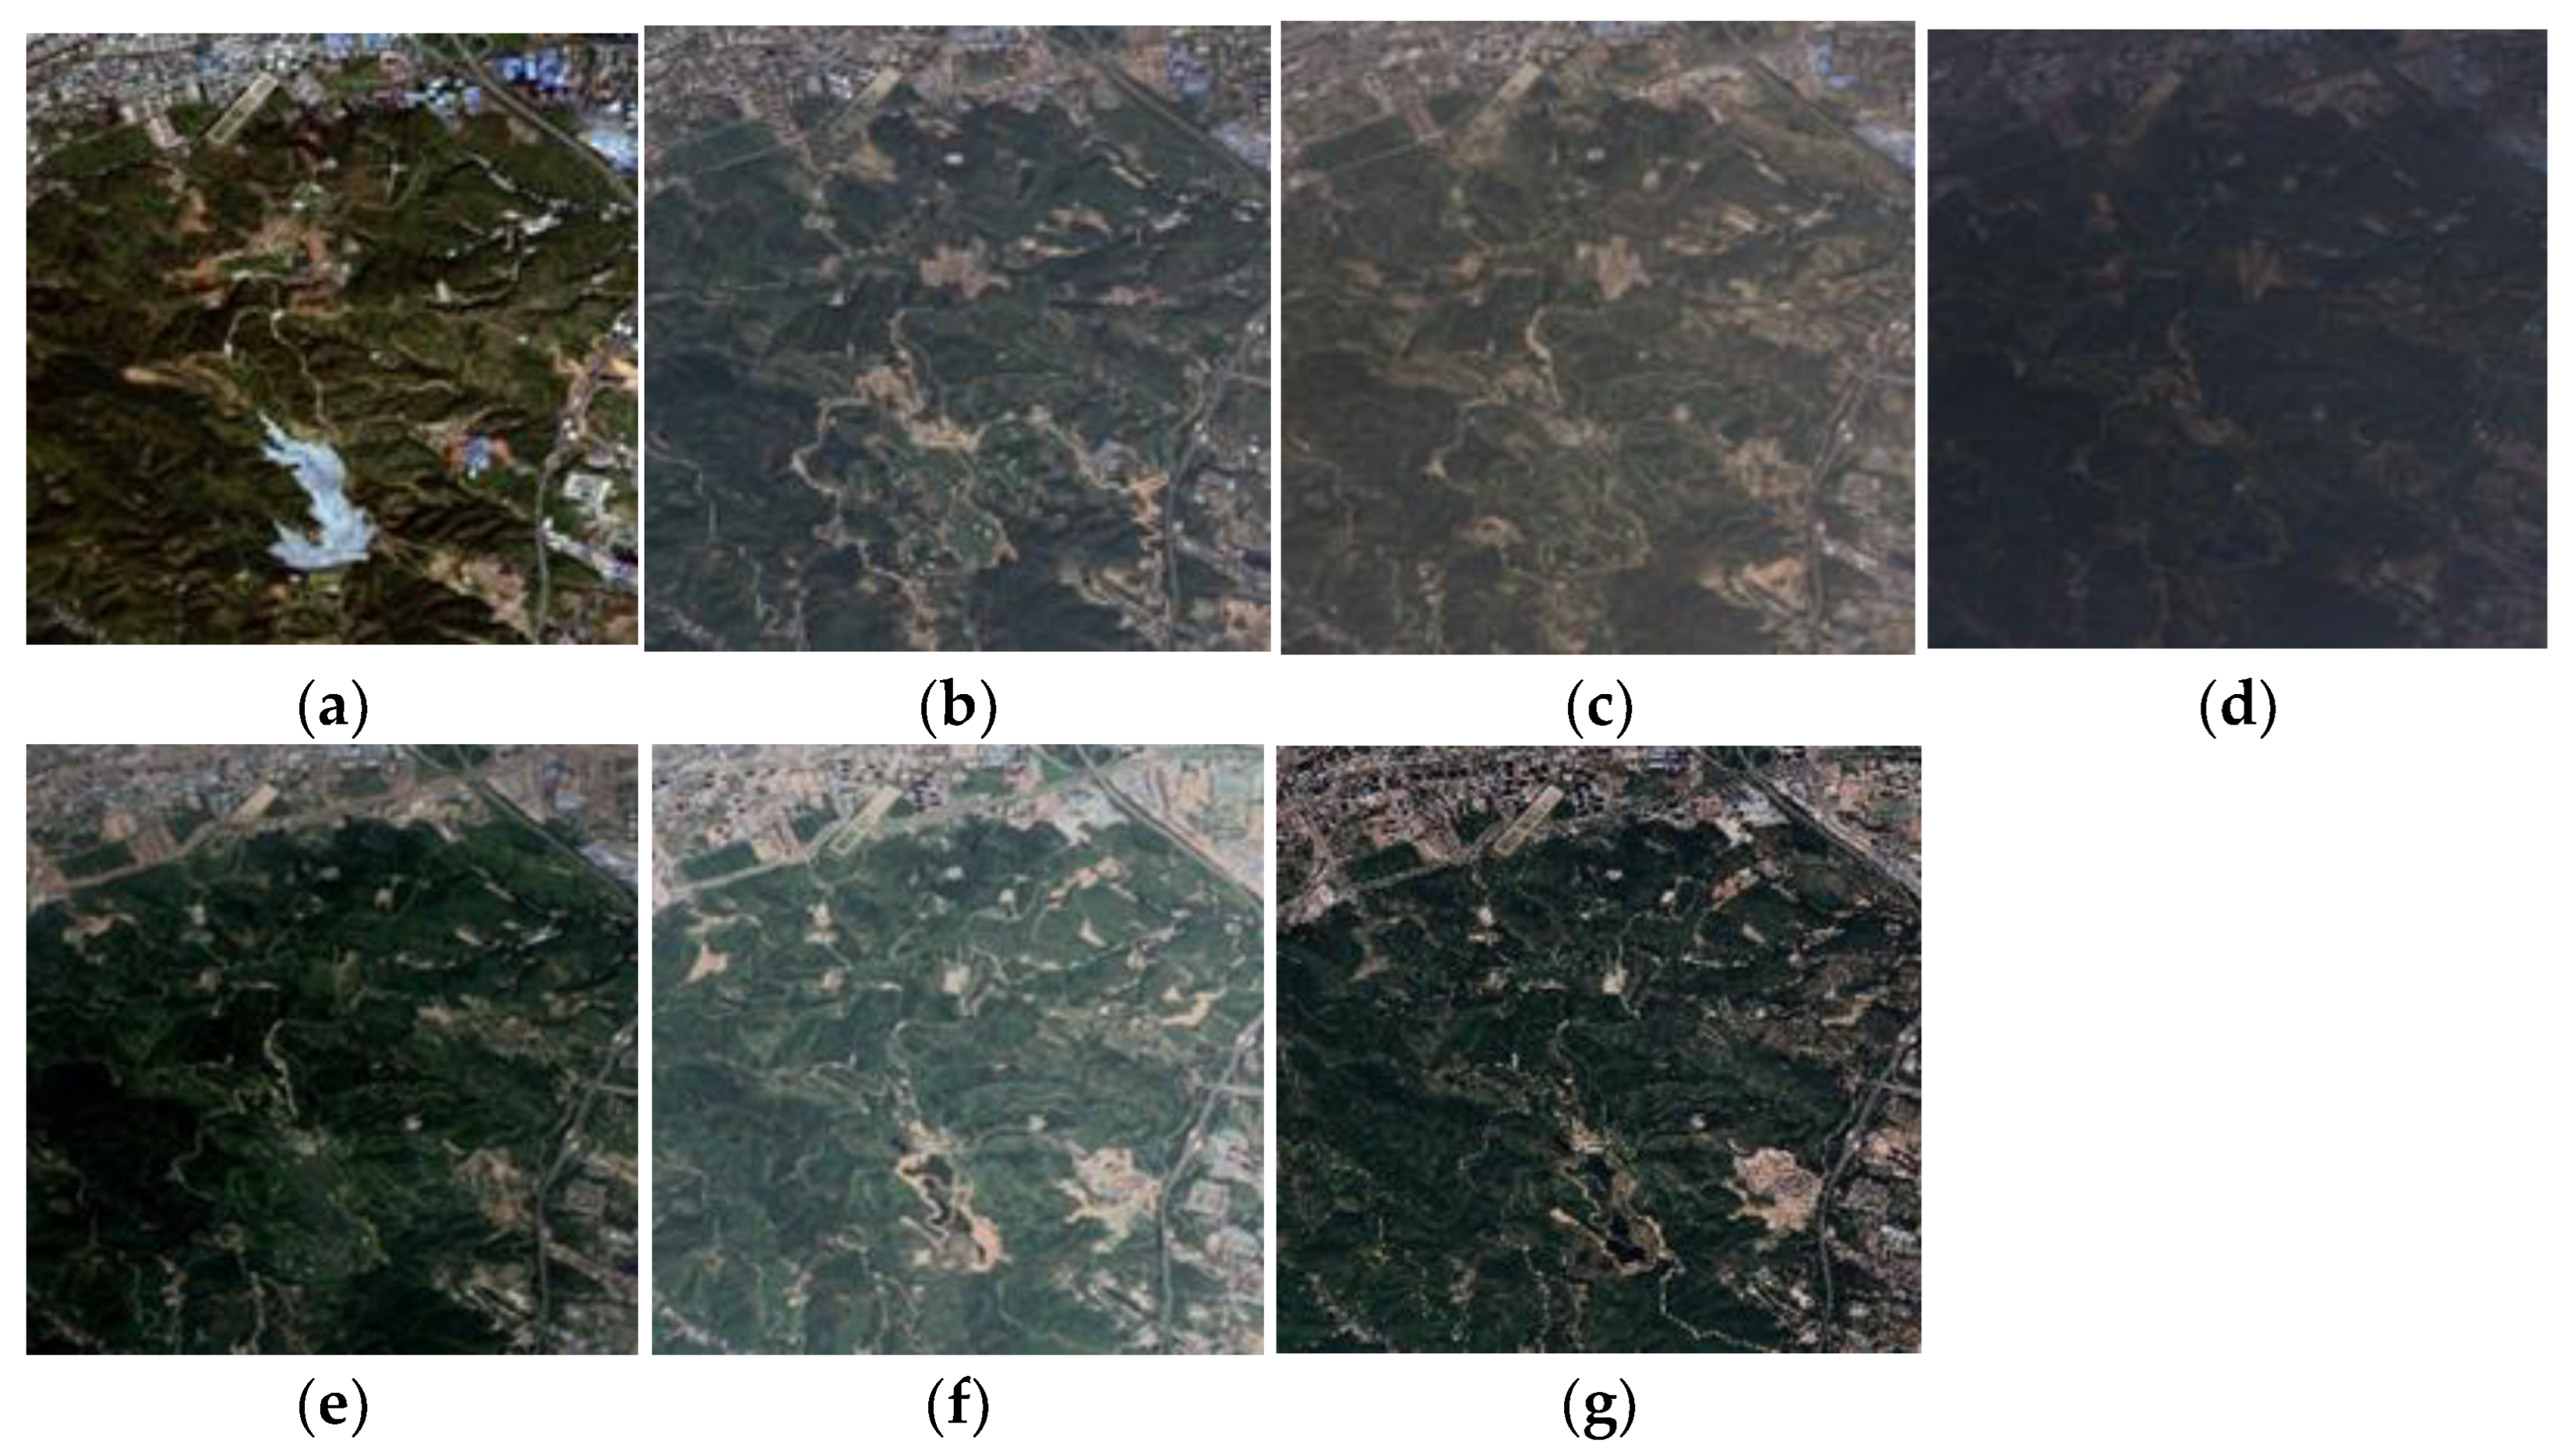
2.2. Data Picking
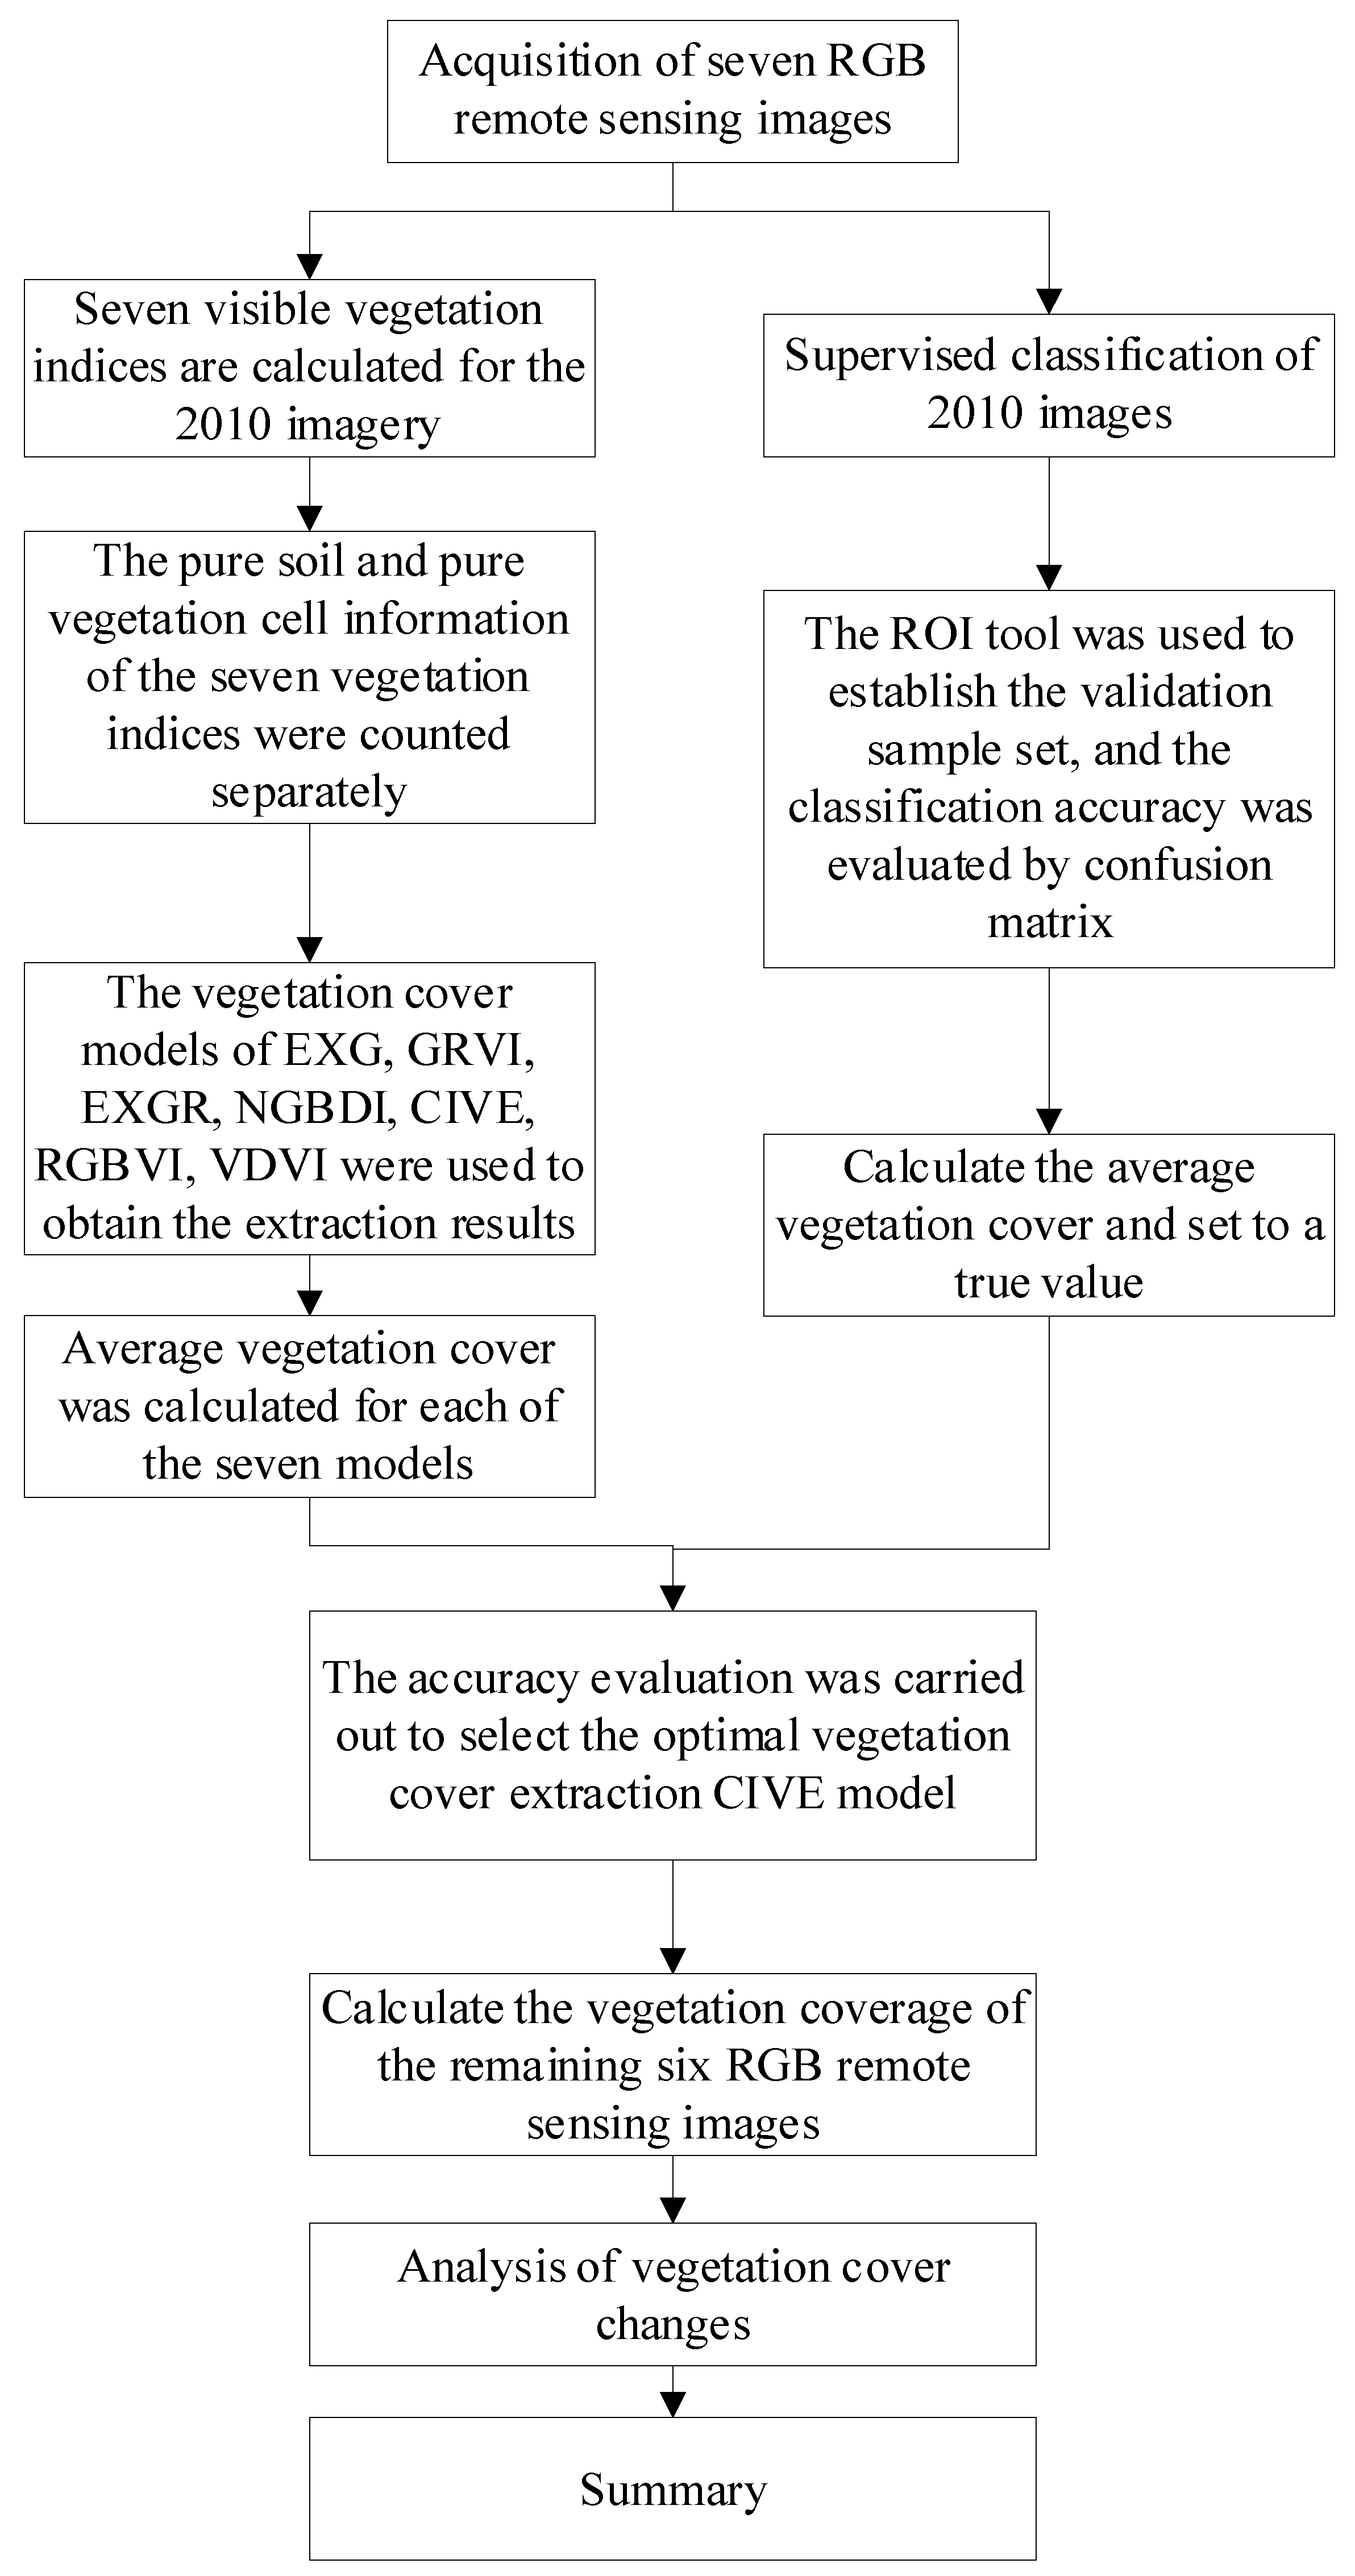
3. Research Methods
3.1. Visible Light Vegetation Index
3.2. Cell Dichotomy
3.3. Vegetation Cover Extraction Model
3.4. Vegetation Coverage Extraction from RGB Images
3.5. Accuracy Evaluation of Vegetation Cover
4. Analysis of the Results
4.1. Monitor Classification Results and Evaluations
4.2. Extraction Results and Analysis of Vegetation Cover for Different Models
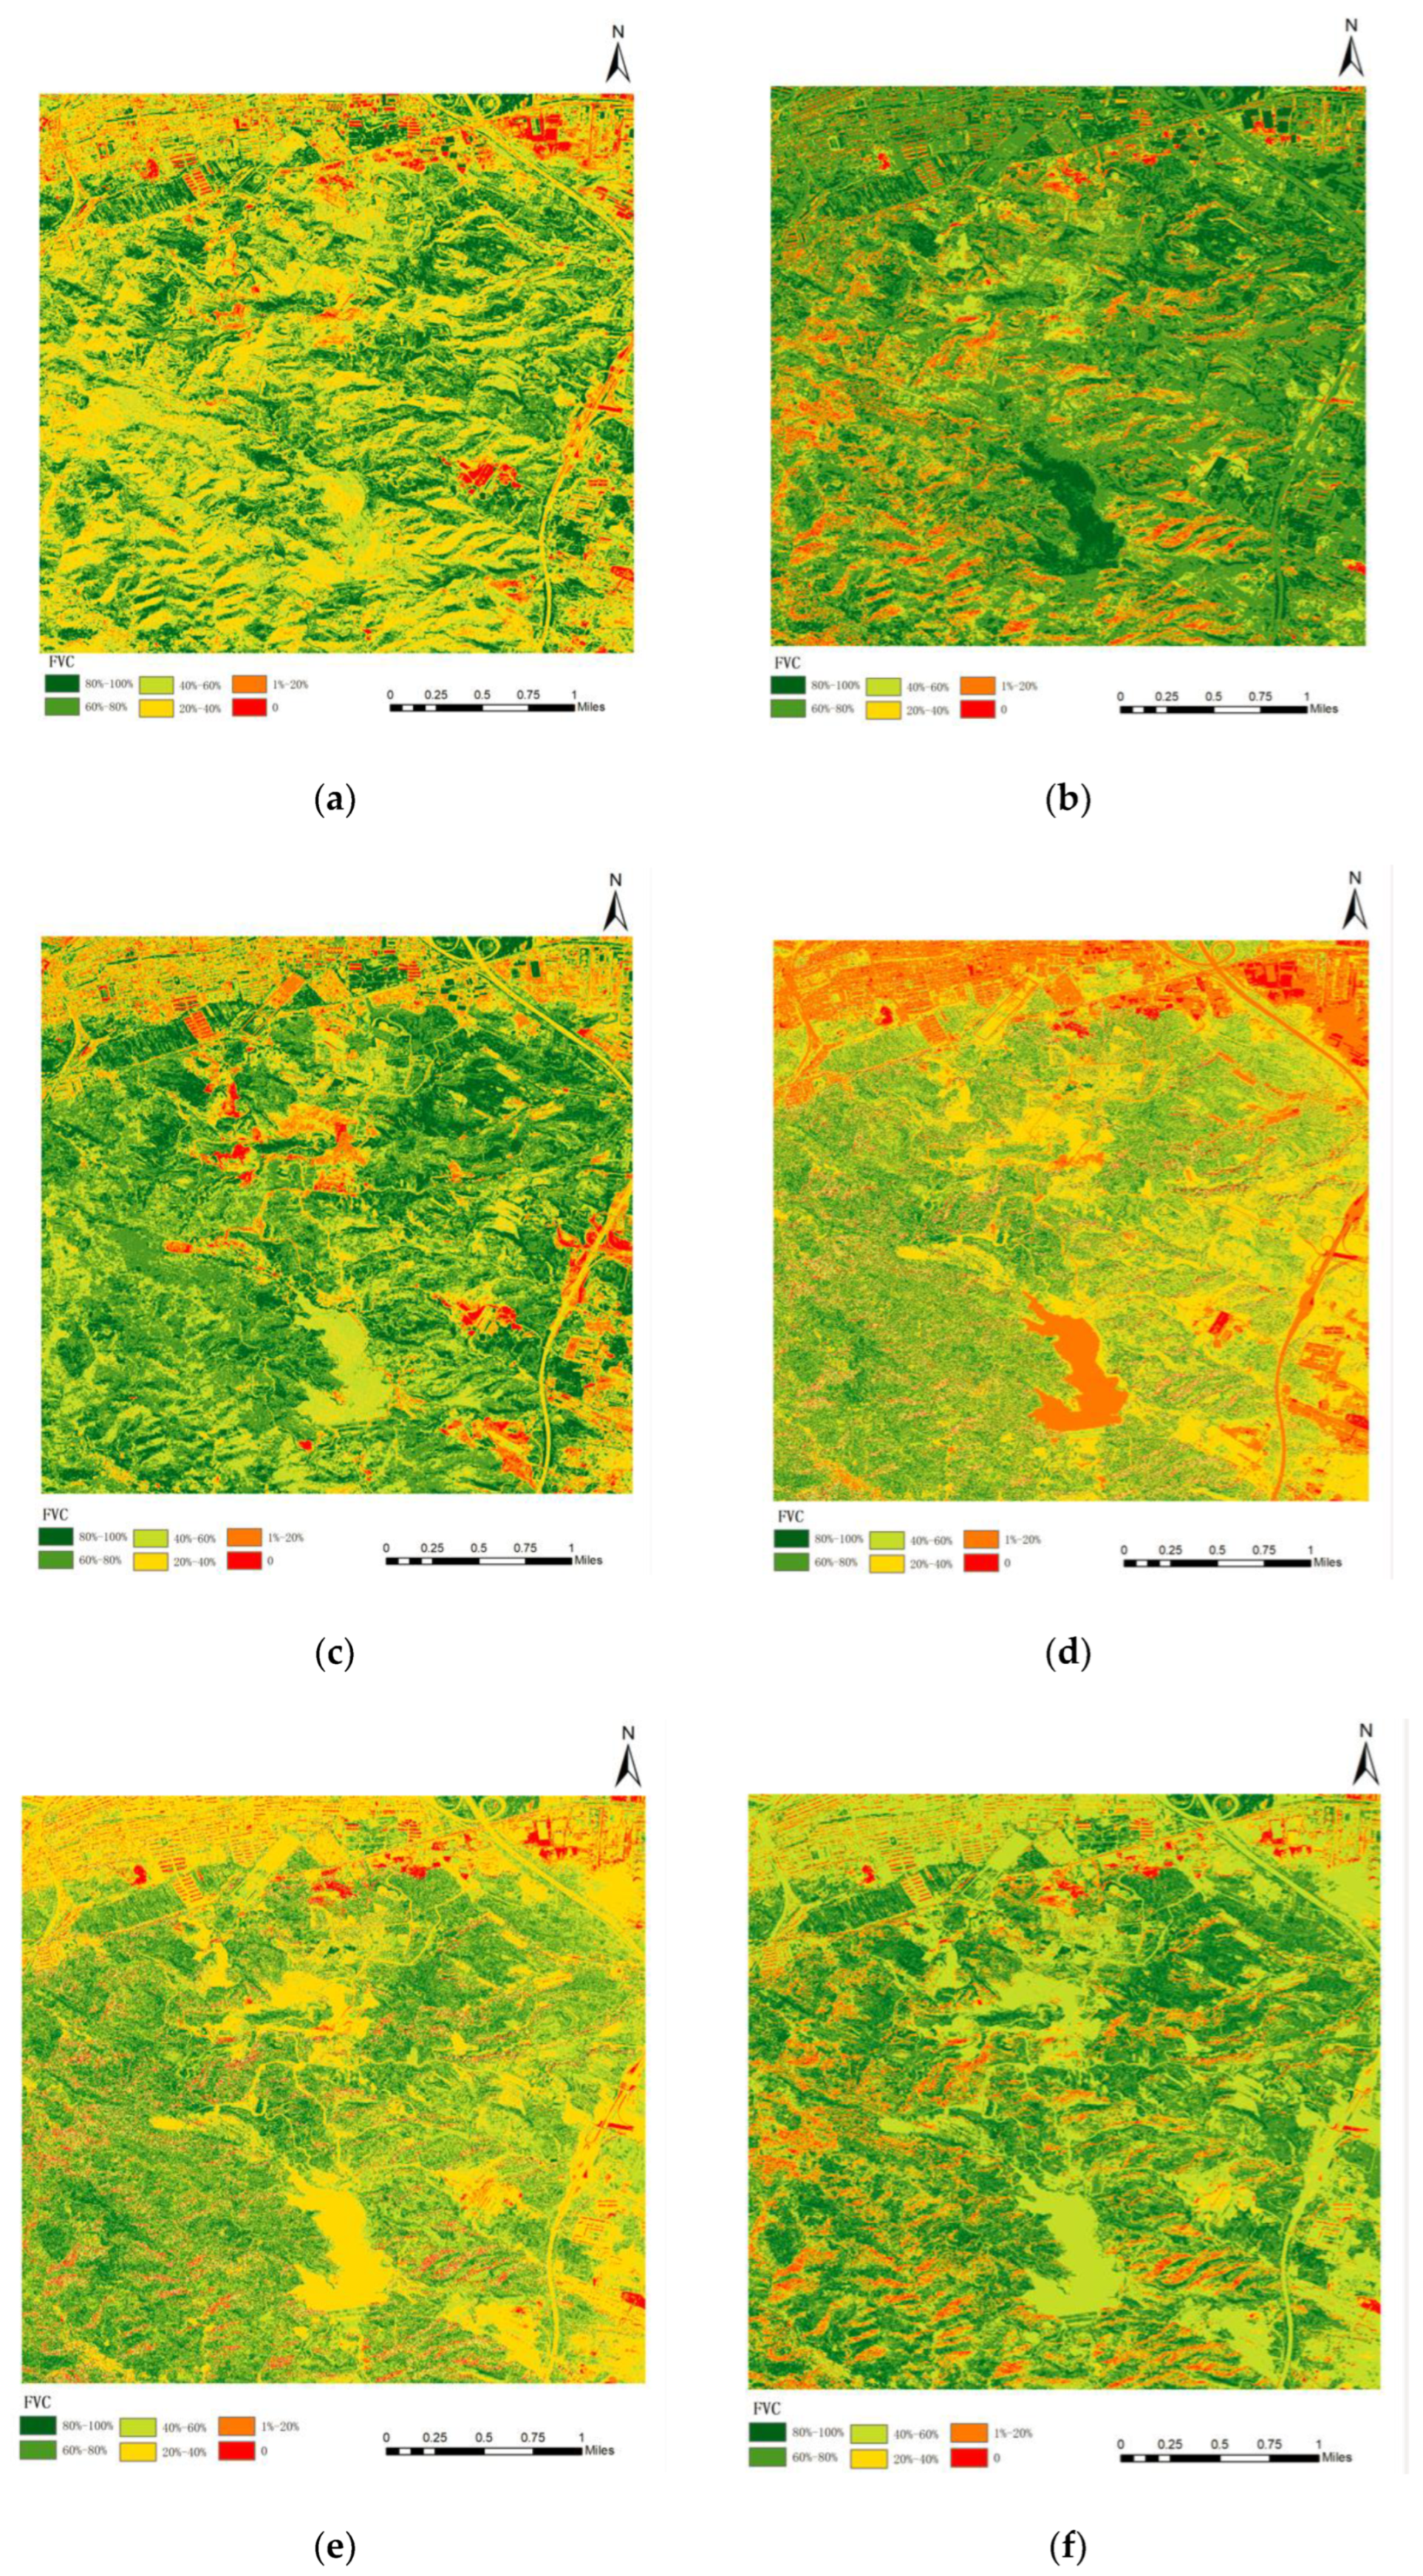
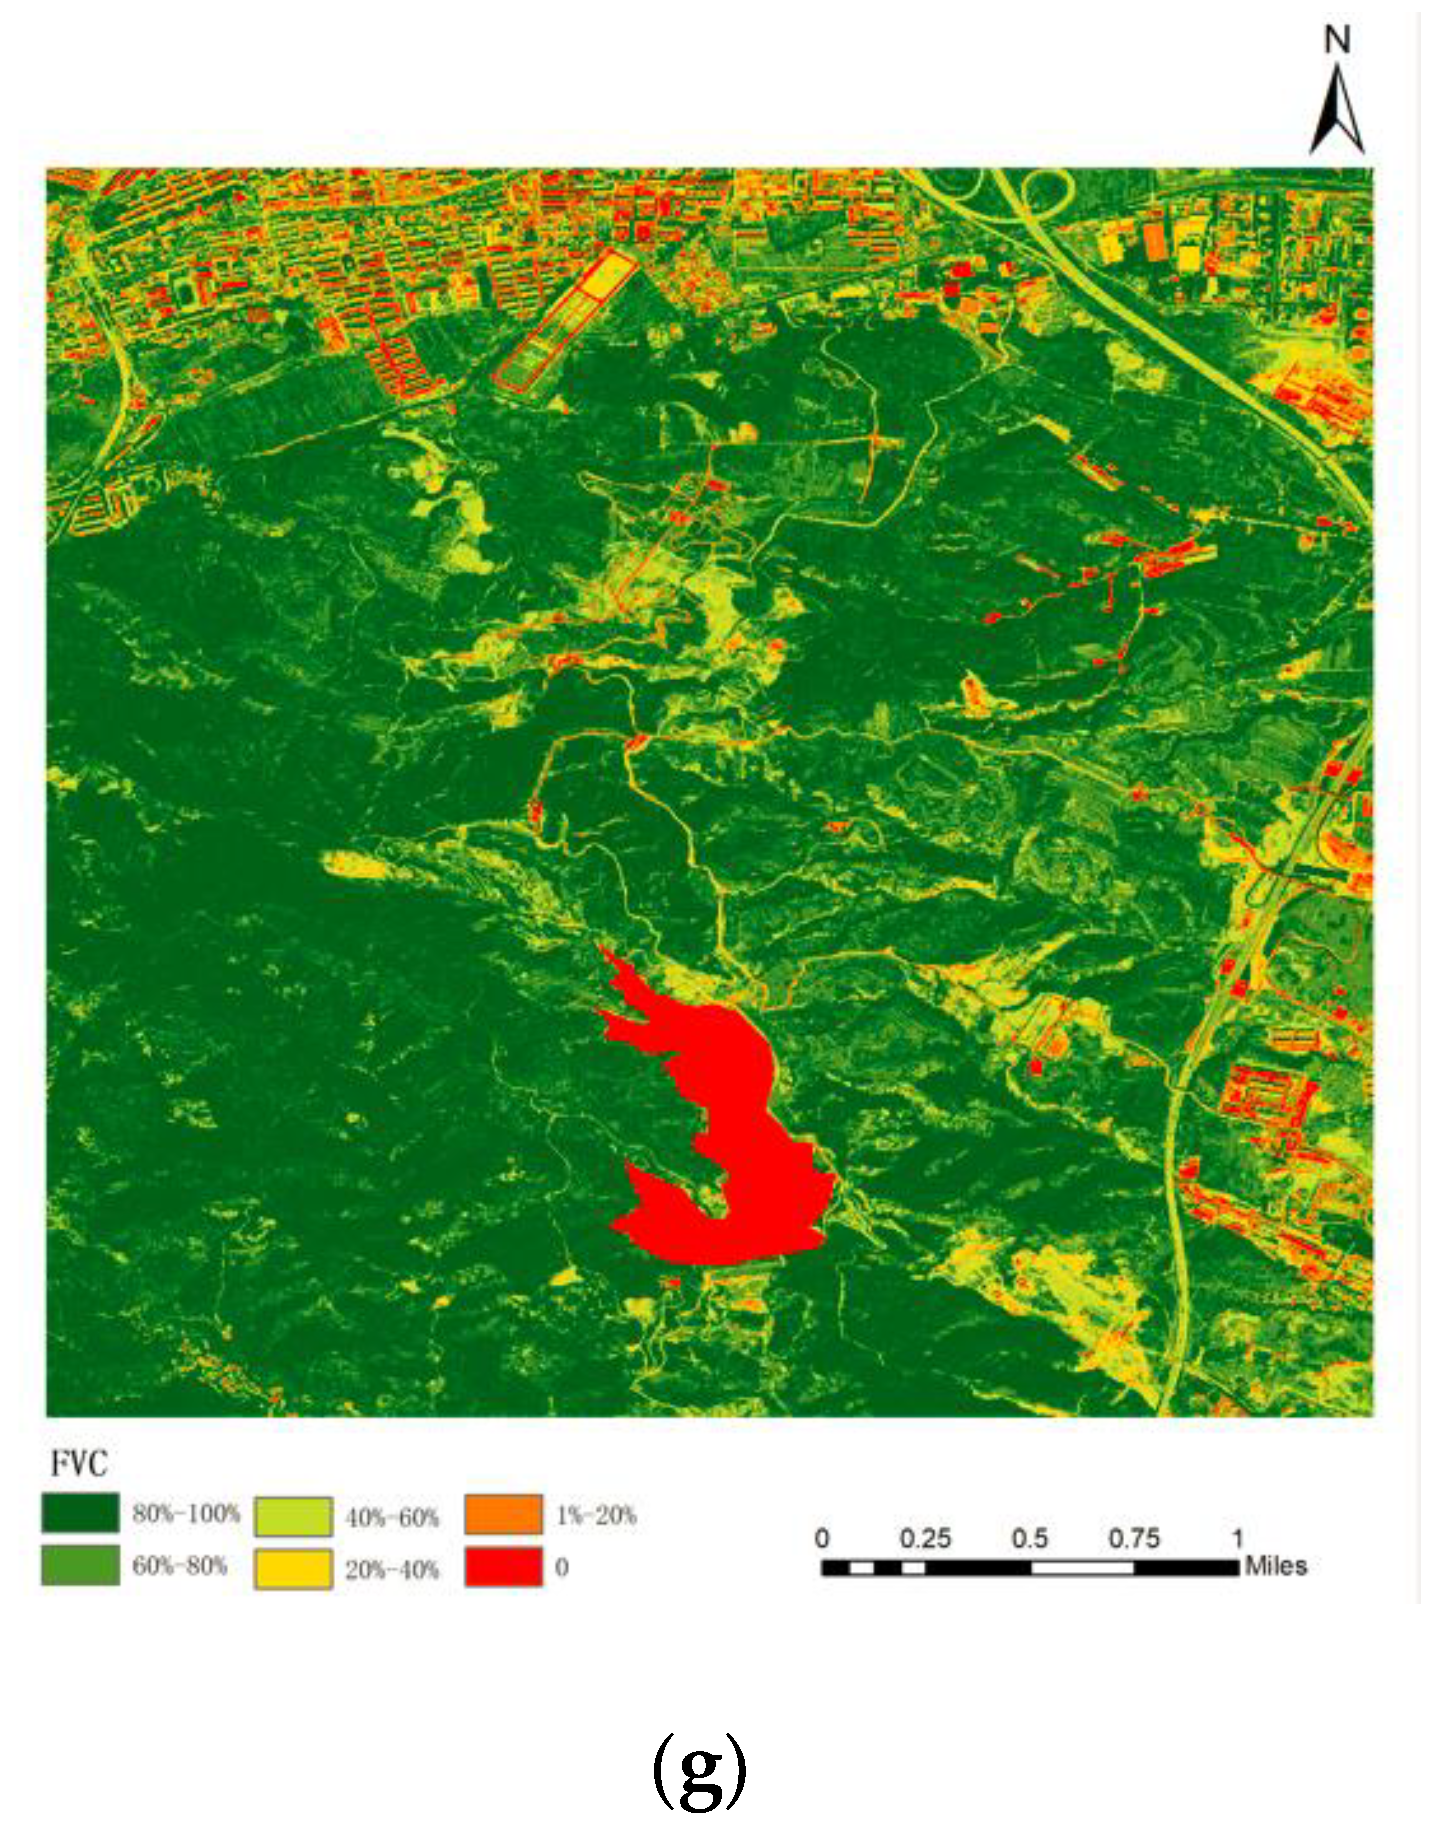
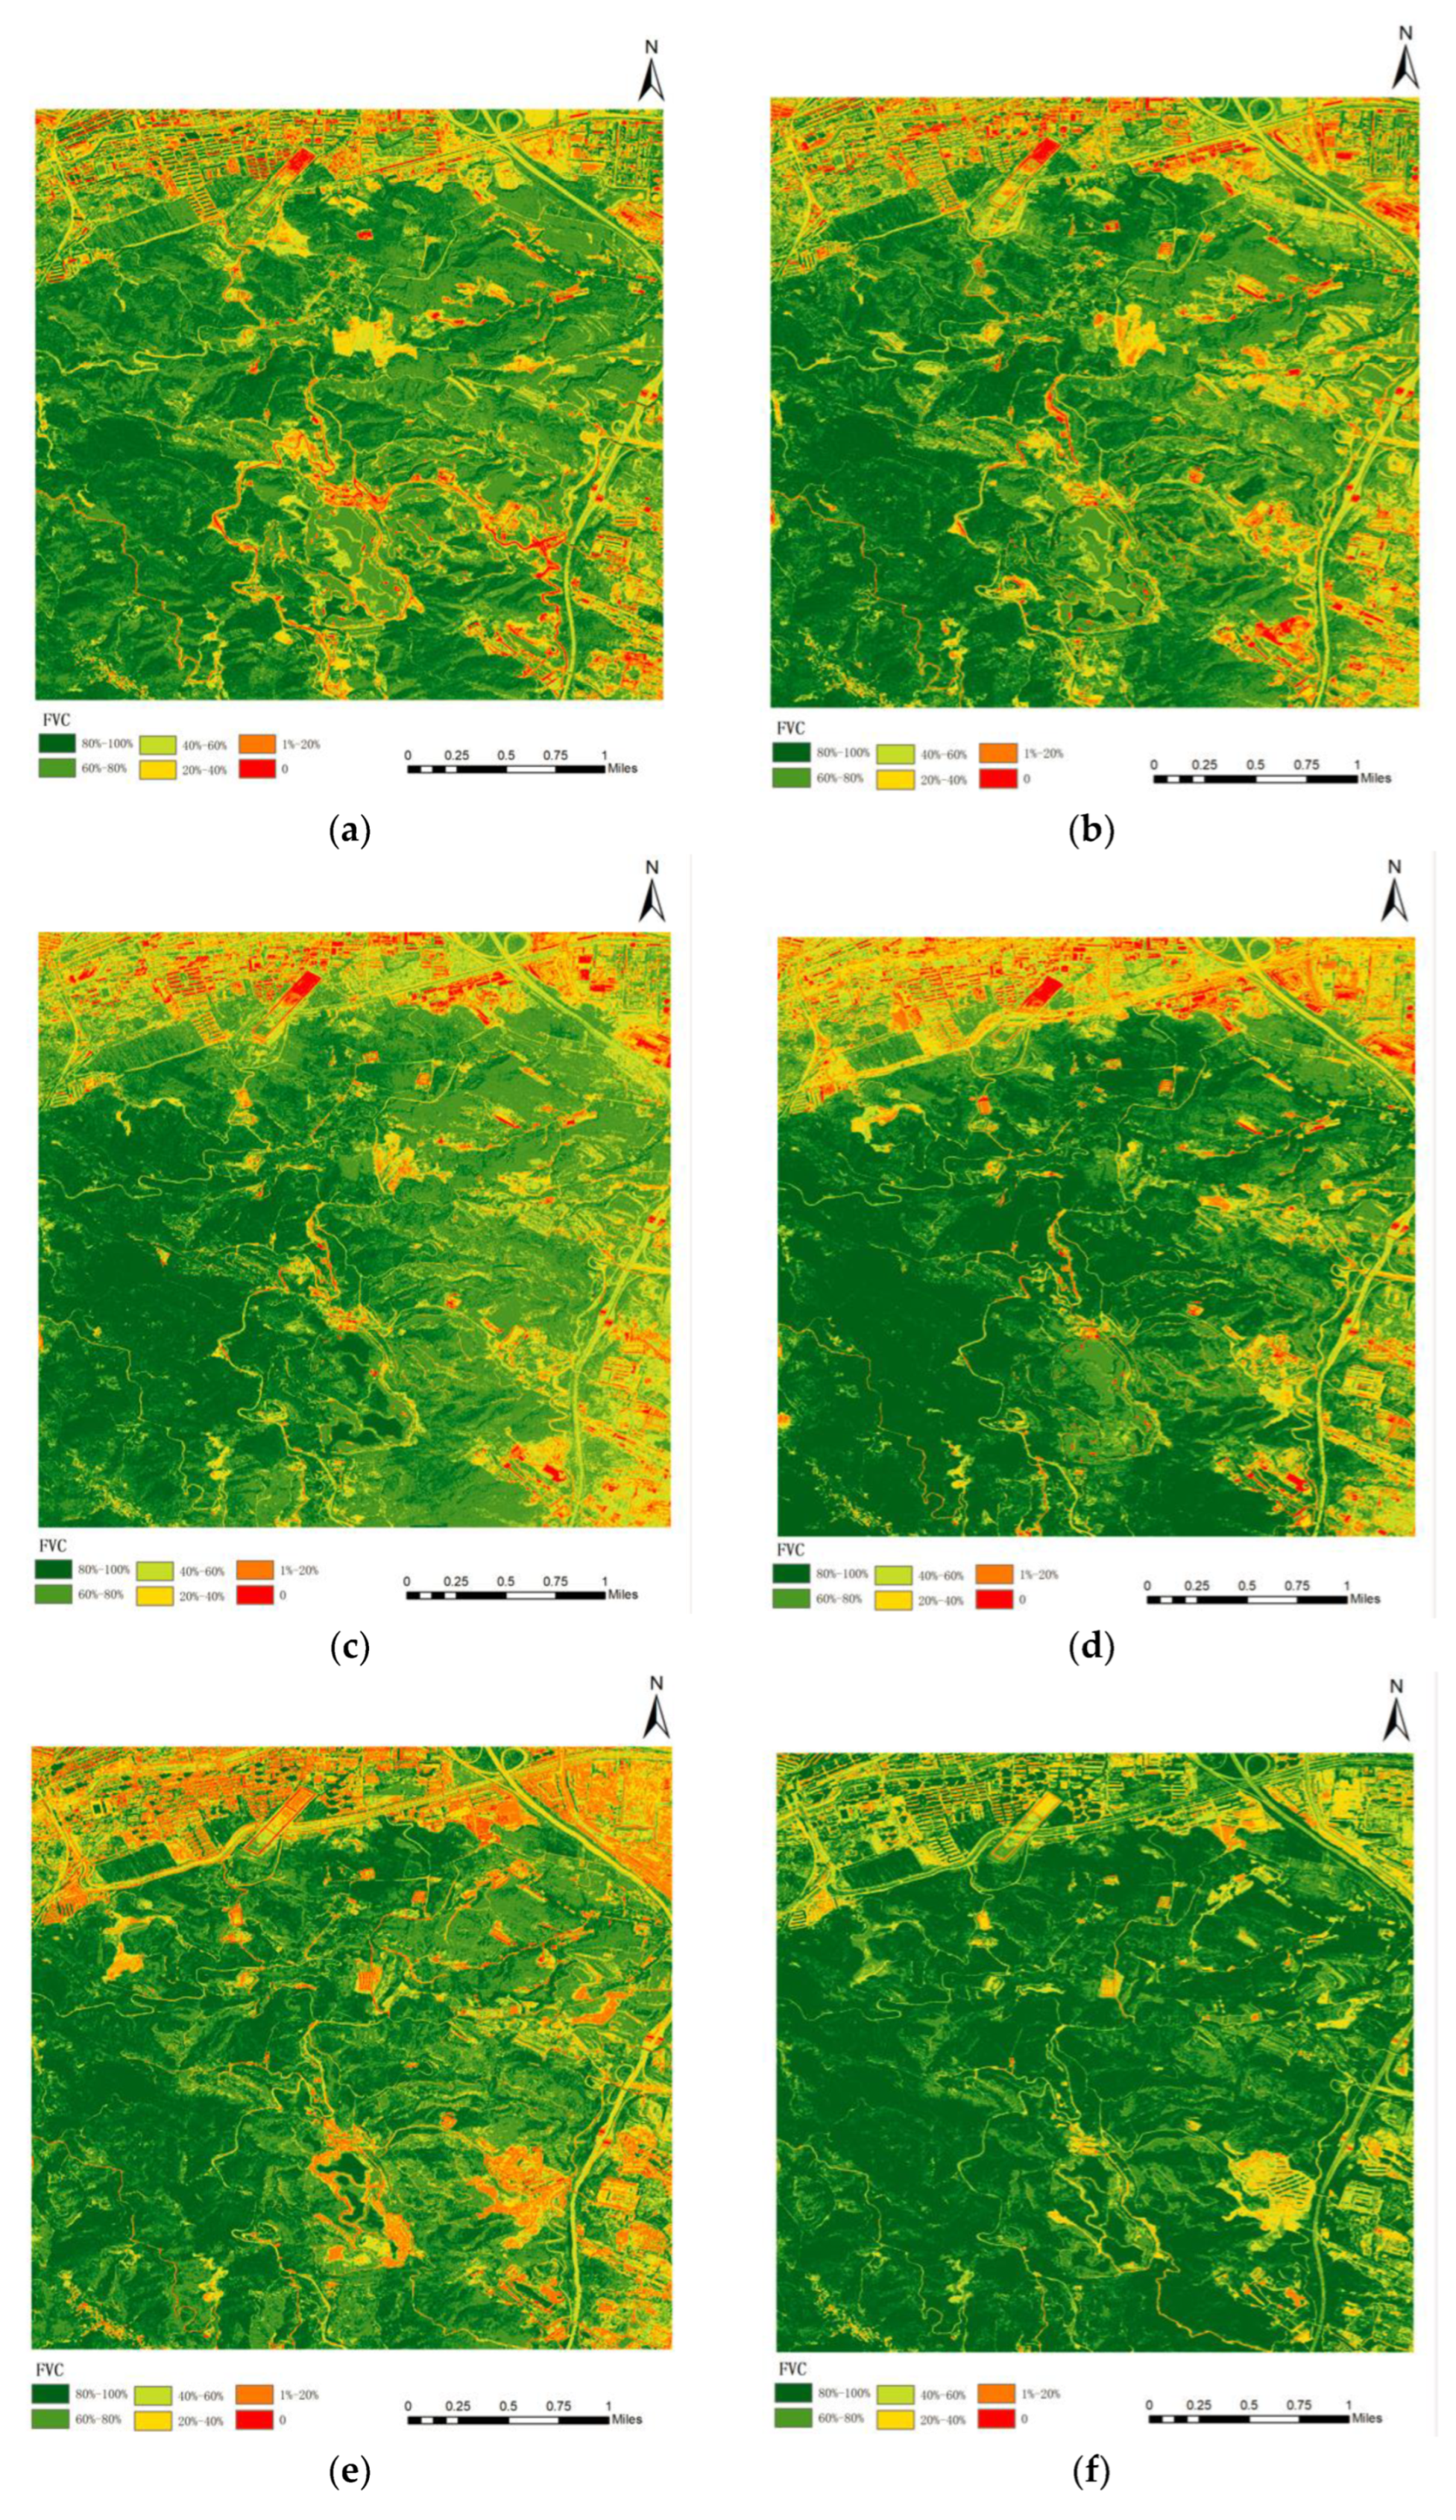
4.3. Vegetation Cover Extraction Results of CIVE Model
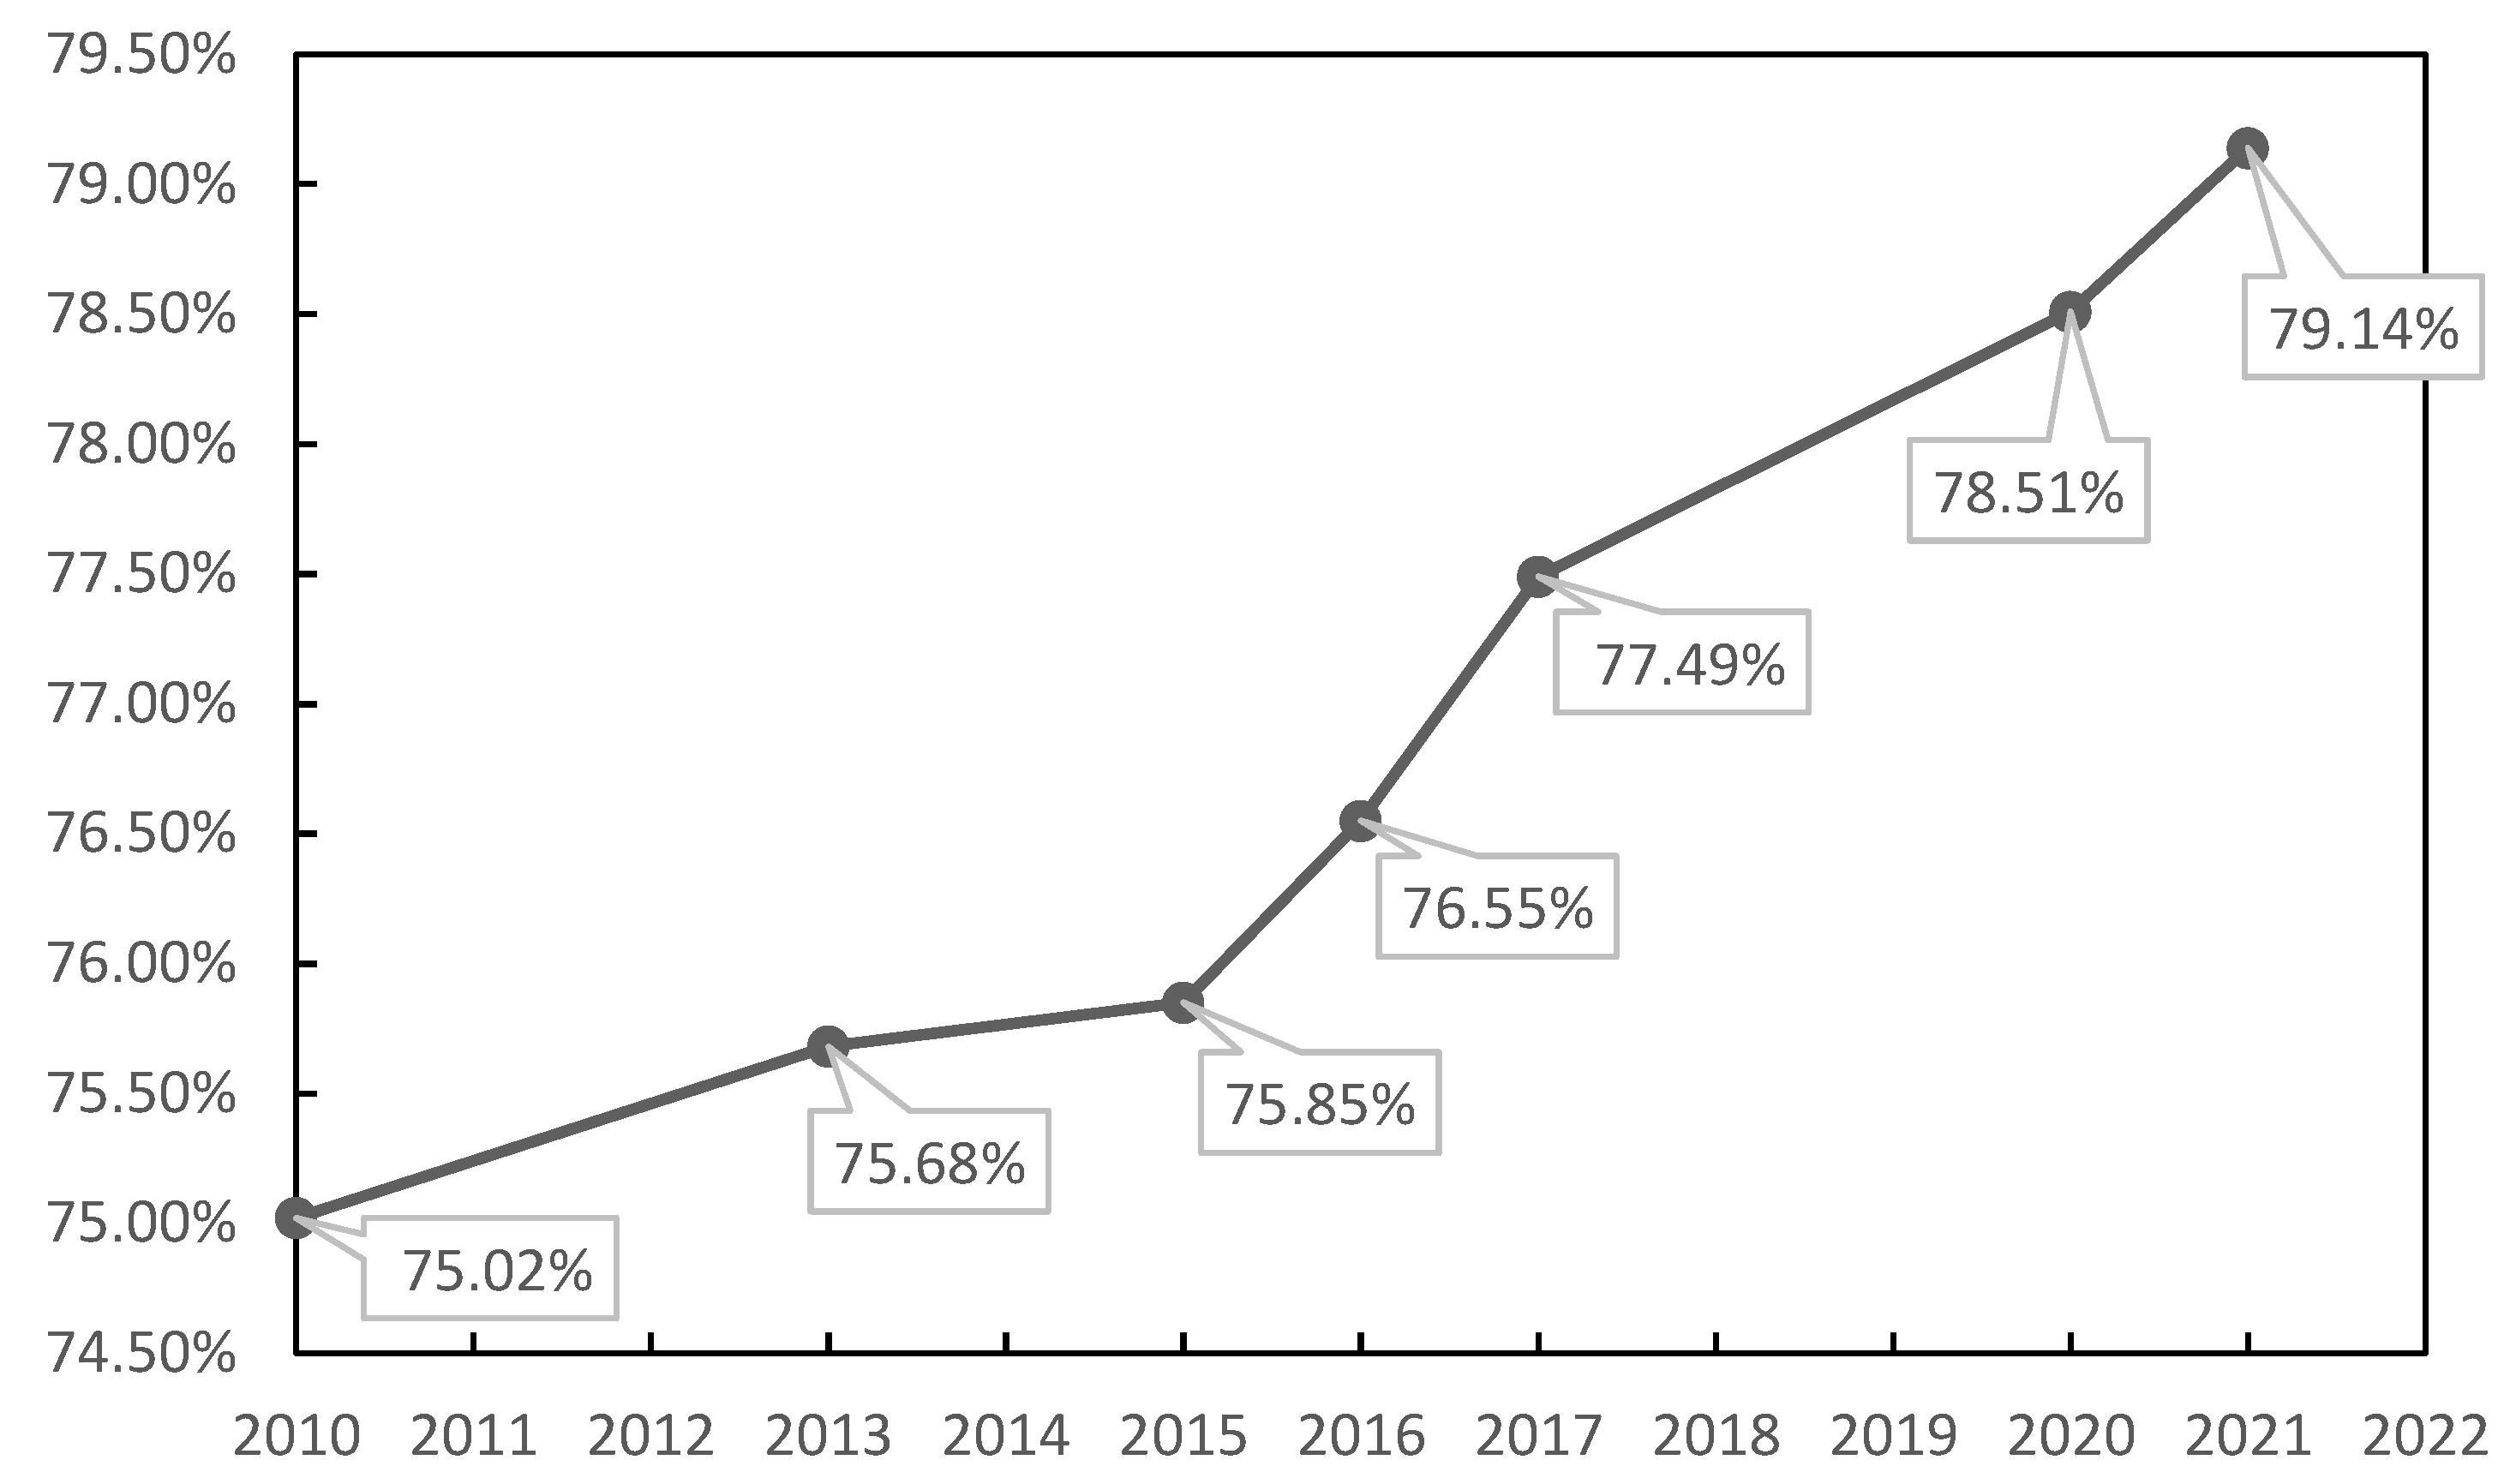
4.4. Analysis of Vegetation Cover Changes
5. Typical Area Analysis
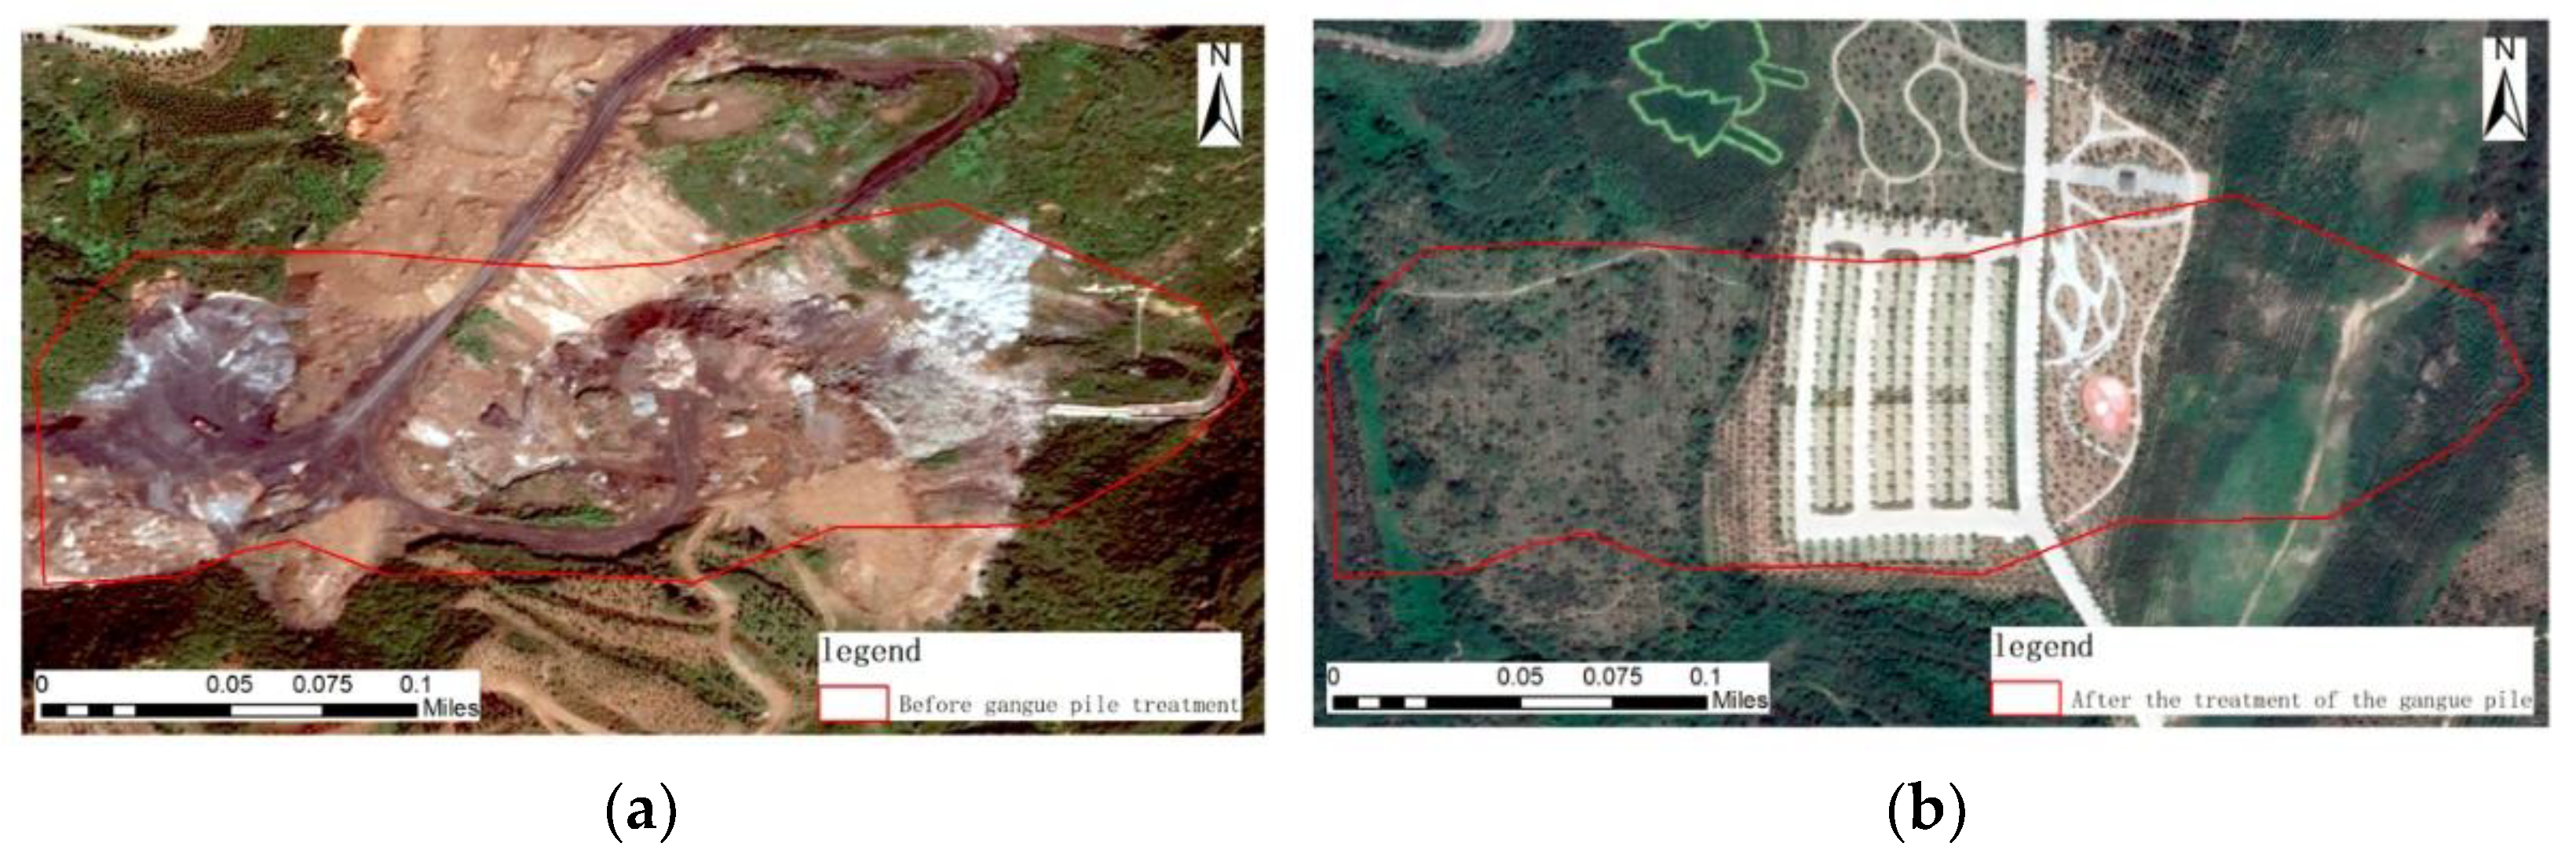
5.1. Gangue Pile Treatment Area
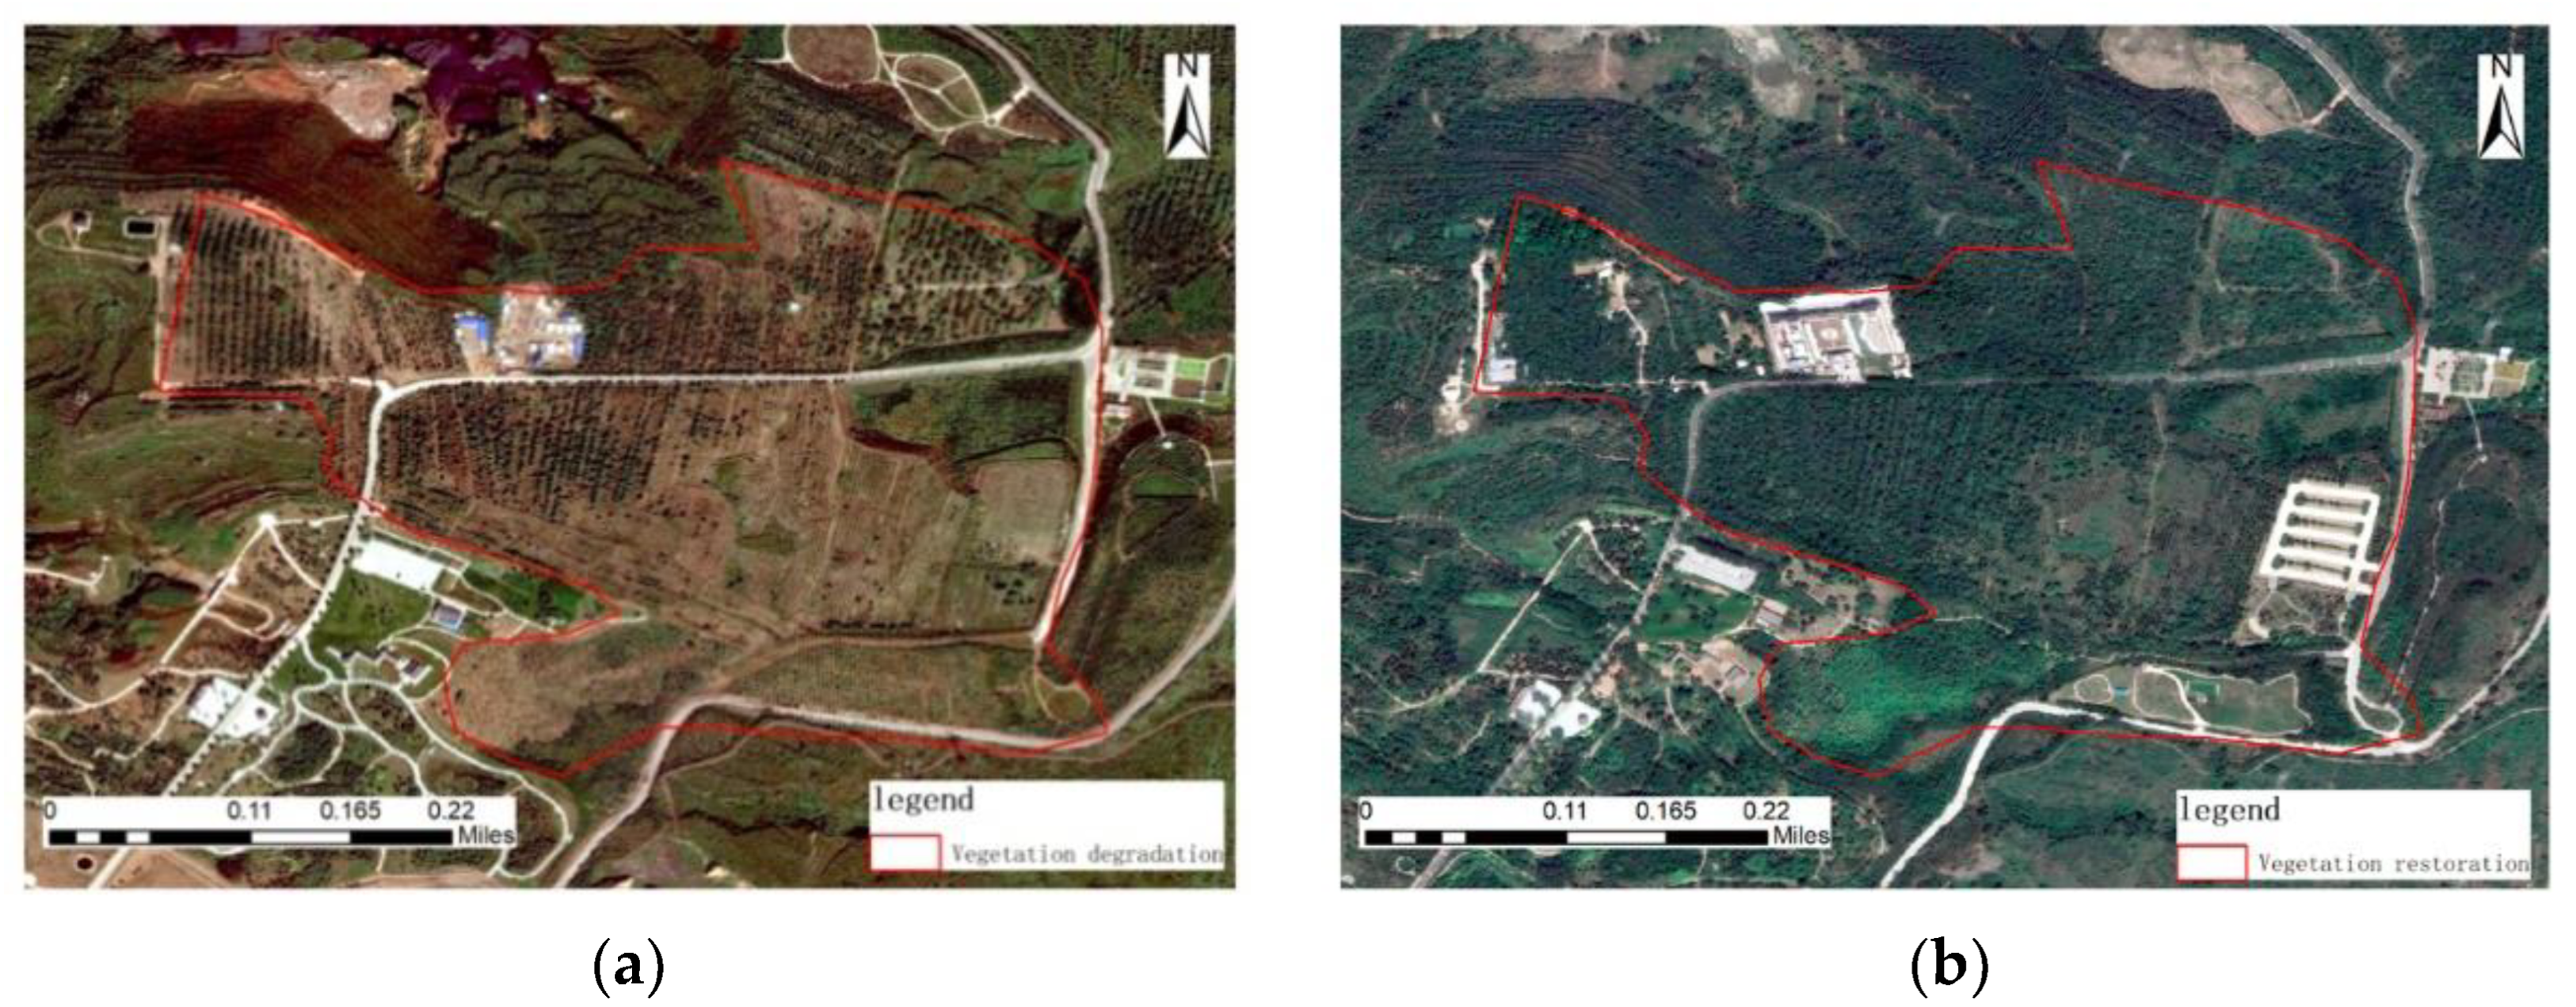
5.2. Vegetation Degradation Restoration Area
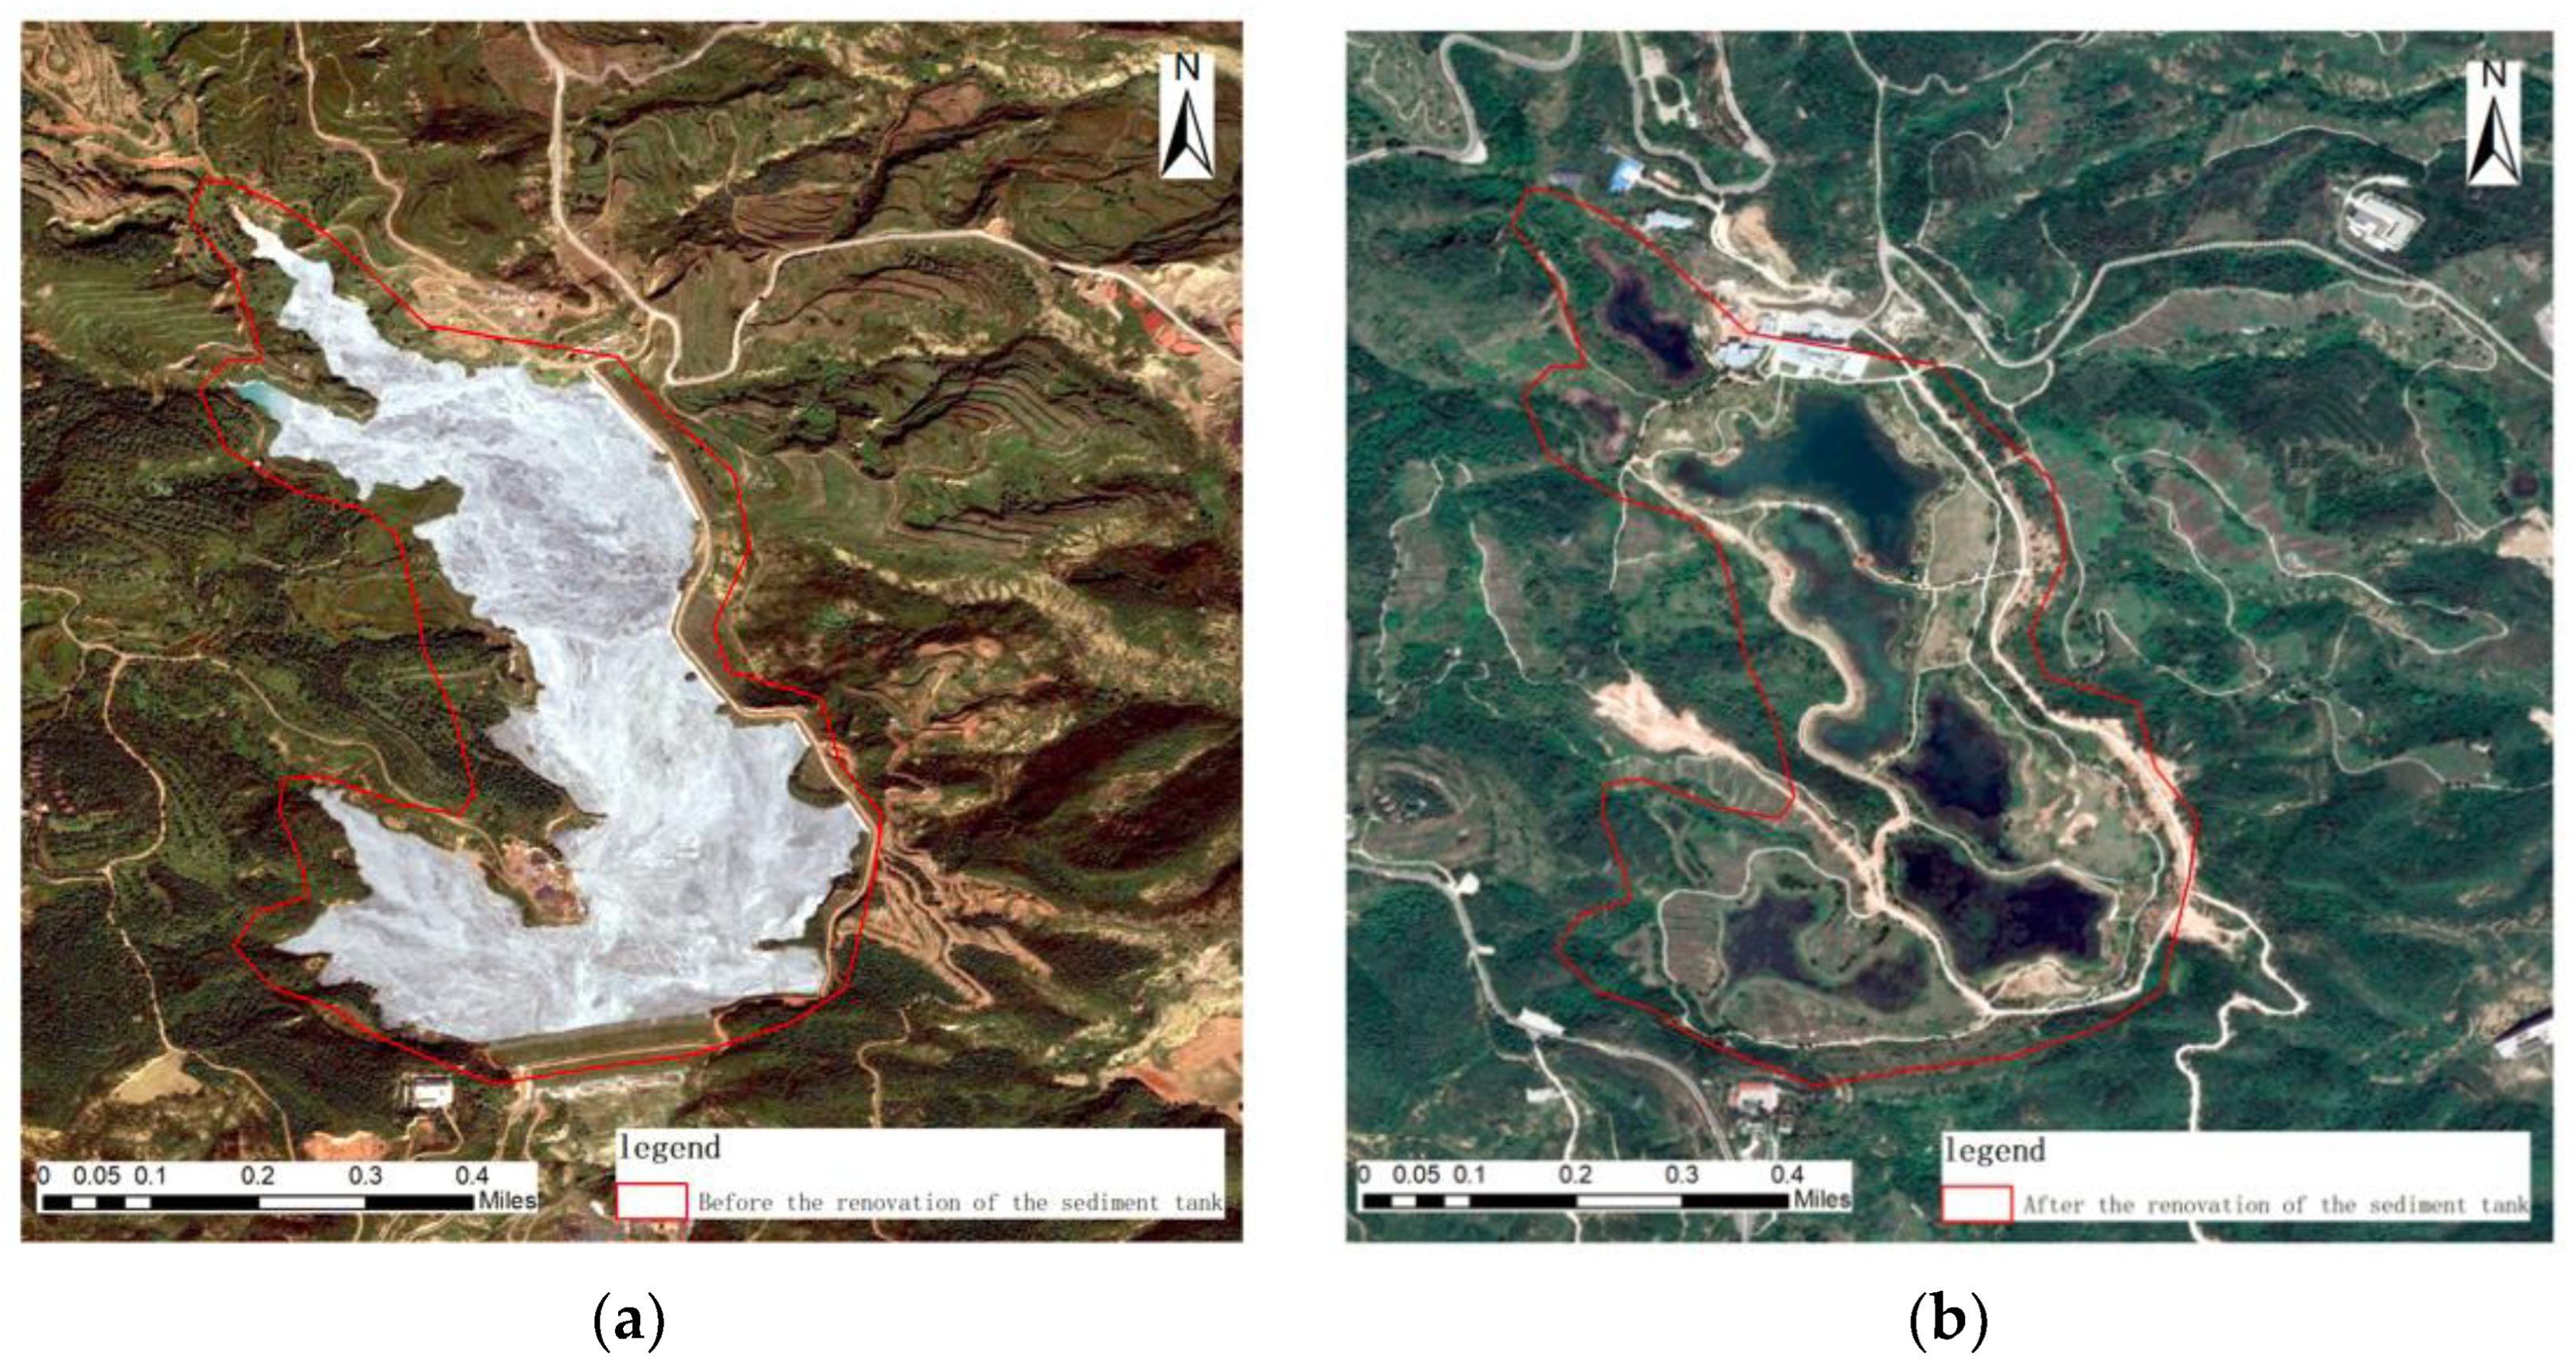
5.3. Sediment Tank Renovation Area
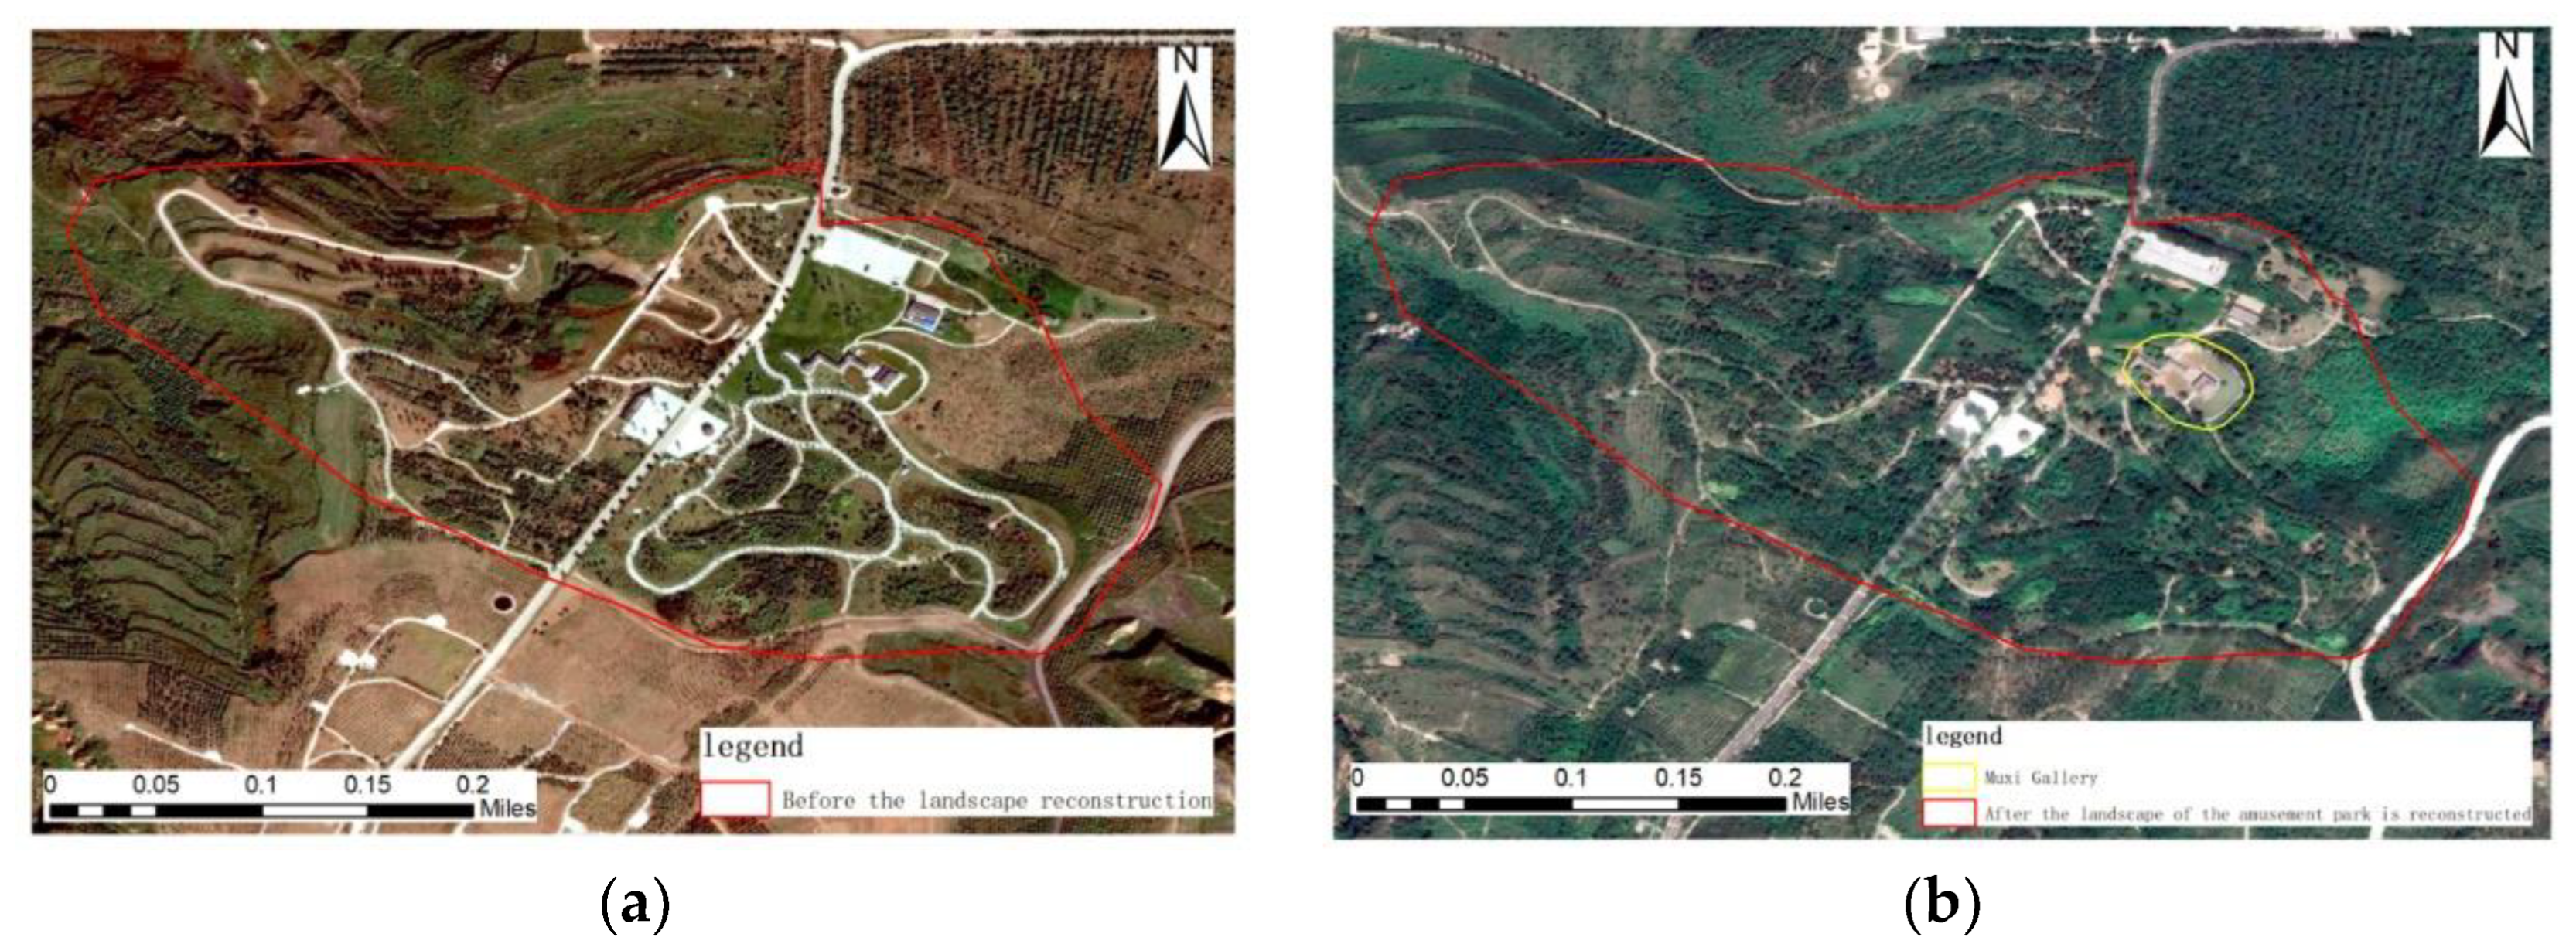
5.4. Amusement Park Landscape Regeneration Area
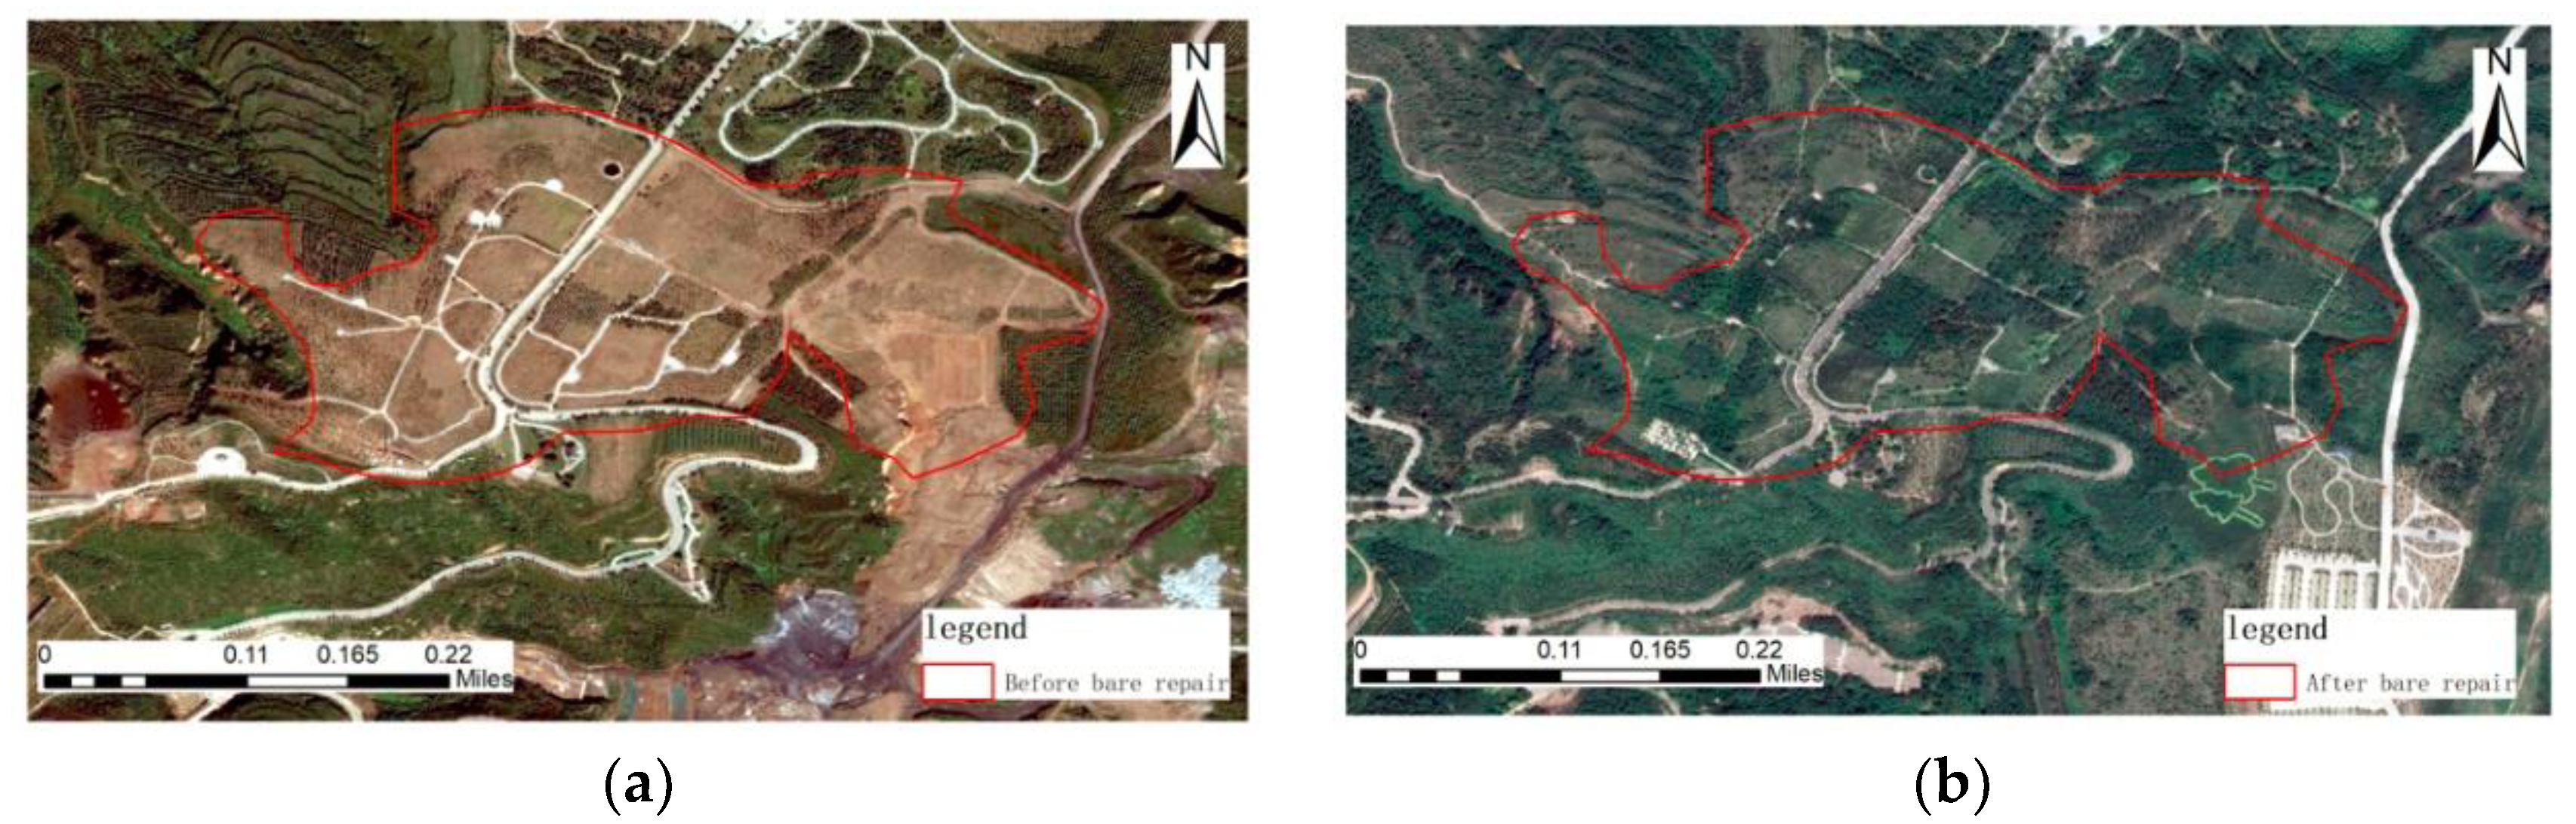
5.5. Bare Land Regreening Area
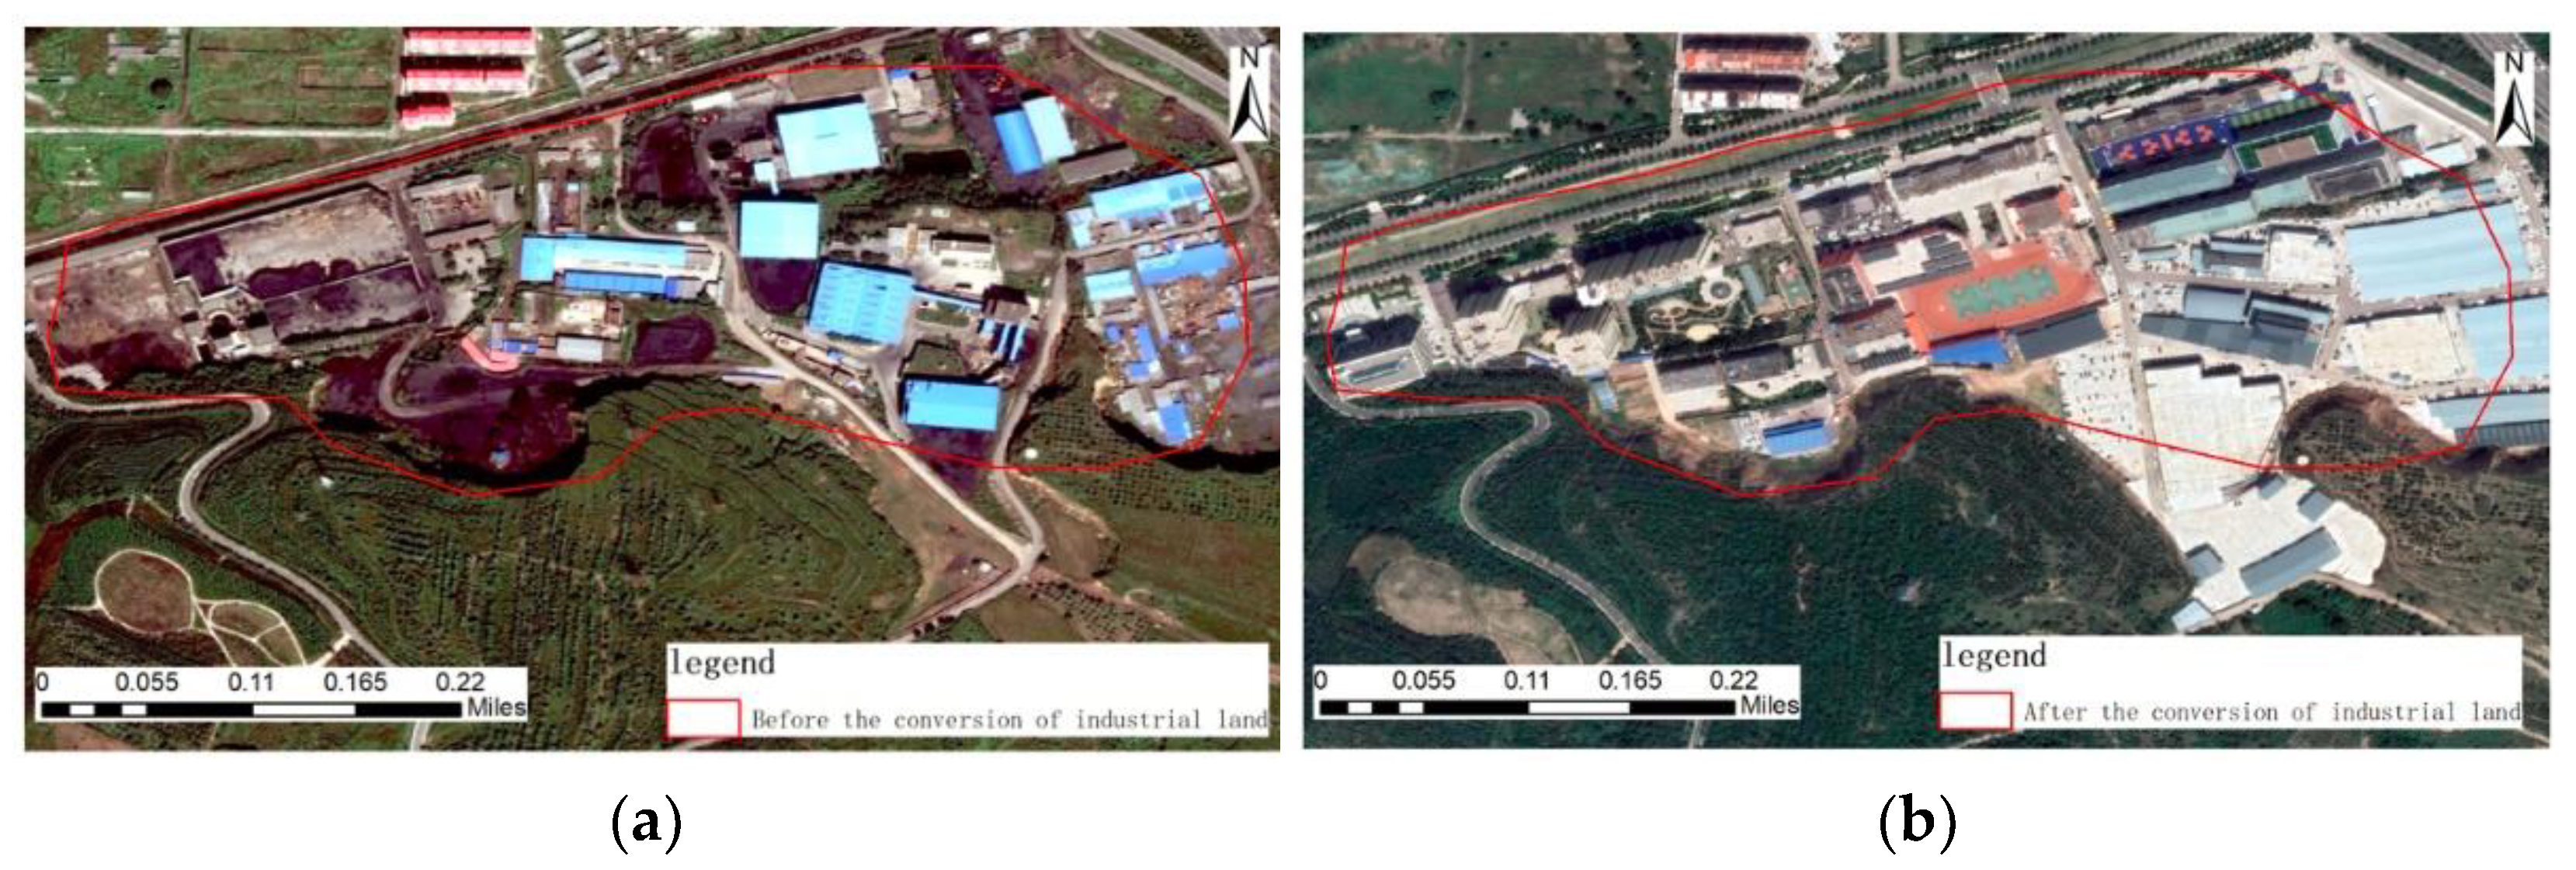
5.6. Industrial Land Redevelopment Area
6. Conclusions and Future Work
- The ecological restoration and governance of mining areas should adhere to the principle of taking into account the development of mineral resources and ecological environmental protection. Moreover, efforts should be made to strengthen the ecological restoration measures in the process of coal mining, adopt measures of “mining and treatment,” and practice the development idea that “green water and green mountains are gold and silver mountains”.
- By studying the change in vegetation coverage in the Taiyuan Xishan Ecological Restoration Area, the quality of the vegetation in the Taiyuan Xishan Ecological Restoration Area is constantly improving, and the vegetation restoration trend is also significant. In essence, in fact, this shows that through government intervention and ecological restoration intervention, the vegetation coverage in this area has improved significantly.
- Through the long-term dynamic monitoring of the vegetation coverage in the Xishan ecological restoration area of Taiyuan, it can be seen that the ecological restoration governance has multiple treatments in the same area. Therefore, the possibility of obtaining ideal results after one treatment is quite low, and it is necessary to continuously explore and investigate the governance model suitable for Xishan.
- According to the relevant paper data and remote sensing image characteristics, the Taiyuan Xishan Ecological Restoration Area is divided into six typical areas, including: (i) the coal gangue pile treatment area; (ii) the vegetation degradation restoration area; (iii) the sediment pond transformation area; (iv) the amusement garden landscape regeneration area; (v) the bare land regreening area; and (vi) the industrial land reconstruction area. While restoring the ecological environment, it has produced certain economic and social benefits, which can provide a reference for subsequent ecological restoration work.
- When building on residential and commercial land in the Taiyuan Xishan Ecological Restoration Zone, attention should be paid to protecting the surrounding vegetation to avoid vegetation degradation. Furthermore, at the same time, it is also necessary to increase the greening of vegetation around the building land, which is also an important reference for the further restoration of the Taiyuan Xishan Ecological Restoration Area.
- Due to the limitations of the data selected for this study, further research is needed to validate the CIVE model based on UAV visible wavelength images and improve it to enhance its adaptability and form a more complete technical process and methodological system.
Author Contributions
Funding
Institutional Review Board Statement
Informed Consent Statement
Data Availability Statement
Conflicts of Interest
References
- Hang, C.; Shaogang, L. Artificial vegetation extraction for mining area based on object—oriented techniques and the analysis of reconstruction. Resour. Environ. Arid. Areas 2018, 32, 6. [Google Scholar]
- Gitelson, A.A.; Kaufman, Y.J.; Stark, R.; Rundquist, D. Novel algorithms for remote estimation of vegetation fraction. Remote Sens. Environ. 2002, 80, 76–87. [Google Scholar] [CrossRef]
- Kun, J.; Yunjun, Y.; Xiangqin, W.; Shuai, G.; Bo, J.; Xiang, Z. A review on fractional vegetation cover estimation using remote sensing. Adv. Earth Sci. 2013, 28, 9. [Google Scholar]
- Song, W.; Mu, X.; Ruan, G.; Gao, Z.; Li, L.; Yan, G. Estimating fractional vegetation cover and the vegetation index of bare soil and highly dense vegetation with a physically based method. Int. J. Appl. Earth Obs. Geoinf. 2017, 58, 168–176. [Google Scholar] [CrossRef]
- Rundquist, B.C. The influence of canopy green vegetation fraction on spectral measurements over native tallgrass prairie. Remote Sens. Environ. 2002, 81, 129–135. [Google Scholar] [CrossRef]
- Zhou, Q.; Robson, M.; Pilesjo, P. On the ground estimation of vegetation cover in Australian rangelands. Int. J. Remote Sens. 1998, 19, 1815–1820. [Google Scholar] [CrossRef]
- Hongbing, C.; Beibei, H.; Daoli, P. Comparison of pixel decomposition models for the estimation of fractional vegetation coverage. J. Northwest For. Univ. 2018, 33, 6. [Google Scholar]
- Siqin, T.; Yuhai, B.; Qiaofeng, Z.; Wala, D. Spatiotemporal Changes of Vegetation Coverage in Inner Mongolia Based on the Dimidiate Pixel Model and Intensity Analysis. J. Ecol. Environ. 2016, 25, 7. [Google Scholar]
- Miaomiao, L.; Bingfang, W.; Changzhen, Y.; Weifeng, Z. Estimation of vegetation fraction in the upper basin of Myun Reservoir by remote sensing. Resour. Sci. 2004, 26, 7. [Google Scholar]
- Jiawei, H.; Zhongke, B.; Kaijie, L.; Zihao, W. Applicability analysis of normalized difference vegetative index (NDVI) in grassland open-pit coal mine. J. Eng. Sci. 2023, 45, 10. [Google Scholar]
- Xiongyi, Z.; Quanqin, S.; Jia, N.; Xueqing, Y.; Guoli, G.; Guobo, L. Effect of vegetation restoration on soil wind erosion and vegetation restoration potential in the Three-North Afforestation Program. J. Geoinf. Sci. 2022, 24, 18. [Google Scholar]
- Xiaoran, T.; Jin, W.; Zhexiu, Y. Assessment of driving forces contributing to fractional vegetation cover spatio-temporal variation in Lijiang Dam Area. J. Northwest For. Acad. 2022, 37, 180–190. [Google Scholar]
- Jingjing, P.; Ruliu, Y. Monitoring and Influencing Factors Analysis for Vegetation Coverage Dynamic Change in Hunan Province. Anhui Agric. Sci. 2022, 50, 4. [Google Scholar]
- Cangguo, H.; Dongli, S.; Xiang, Z.; Zhen, Y. Research on vegetation index of small watershed in the Loess Plateau based on visible light image analysis. Agric. Mod. Res. 2022, 43, 9. [Google Scholar]
- Yang, L.; Lin, Y.; Zhiyuan, Z.; Jinlei, Z.; Xianye, W.; Liquan, Z. Inversion of tidal flat topography based on unmanned aerial vehicle low-altitude remote sensing and field surveys. Remote Sens. Nat. Resour. 2021, 33, 80–88. [Google Scholar]
- Lanying, H.; Yulin, Y.; Peng, G.; Xinrong, Y.; Jiyong, Y.; Hao, Z.; Wei, H.; Yufeng, W. Temporal and Spatial Variation of Vegetation Coverage and Its Topographical Differentiation in the Upstream of Minjiang River with Landsat Remote Sensing Image. J. Northeast For. Univ. 2023, 51, 54–60. [Google Scholar] [CrossRef]
- Mou, Y.; Huang, Y.; Liang, R.; Wei, C. Analysis of vegetation covering and landscape pattern in Wenshan based on MODIS NDVI. 2023, pp. 174–180. Available online: http://kns.cnki.net/kcms/detail/61.1202.S.20221230.1541.009.html (accessed on 1 January 2023).
- Li, C.L.; Wang, Y.; Gao, Z.H.; Sun, B. Spatial and temporal characteristics of forest and grass cover in the potential range of desertification in China from 2000 to 2020. J. Geogr. 2022, 77, 2803–2816. [Google Scholar]
- Wang, Y.; Hao, L.N.; Xu, Q.; Li, J.Q.; Chang, H. Spatio-Temporal Variations of Vegetation Coverage and Its Geographical Factors Analysis on the Loess Plateau from 2001 to 2019. 2023, pp. 1–11. Available online: http://kns.cnki.net/kcms/detail/11.2031.Q.20221103.1030.050.html (accessed on 1 January 2023).
- Xue, J.; Su, B. Significant remote sensing vegetation indices: A review of developments and applications. J. Sens. 2017, 2017, 1–17. [Google Scholar] [CrossRef]
- Khadanga, G.; Jain, K. Tree Census Using Circular Hough Transform and GRVI. Procedia Comput. Sci. 2020, 171, 389–394. [Google Scholar] [CrossRef]
- Sun, G.; Wang, X.; Yan, T.; Li, X.; Chen, M.; Shi, Y.; Chen, J. Inversion method of flora growth parameters based on machine vision. Trans. Chin. Soc. Agric. Eng. 2014, 30, 187–195. [Google Scholar]
- Hunt, E.R.; Cavigelli, M.; Daughtry, C.S.T.; Mcmurtrey, J.E.; Walthall, C.L. Evaluation of Digital Photography from Model Aircraft for Remote Sensing of Crop Biomass and Nitrogen Status. Precis. Agric. 2005, 6, 359–378. [Google Scholar] [CrossRef]
- Wu, Y.; Zhao, L.; Jiang, H.; Guo, X. Image segmentation method for green crops using improved mean shift. Trans. Chin. Soc. Agric. Eng. 2014, 30, 161–167. [Google Scholar]
- Changchun, L.; Qinglin, N.; Guijun, Y.; Haikuan, F.; Jiangang, L.; Yanjie, W. Estimation of Leaf Area Index of Soybean Breeding Materials Based on UAV Digital Images. J. Agric. Mach. 2017, 48, 147–158. [Google Scholar]
- Chengxing, L.; Hua, L.; Ping, J.; Hong, H.; Xiaohui, W.; Ruixia, H. Estimation of Vegetation Coverage Based on VDVI Index of UAV Visible Image—using the Shelterbelt Research Area as an example. For. Eng. 2021, 37, 10. [Google Scholar]
- Jin, C.; Yunhao, C.; Chunyang, H.; Peijun, S. Sub-pixel Model for Vegetation Fraction Estimation based on Land Cover Classification. J. Remote Sens. 2001, 5, 8. [Google Scholar]
- Dunchao, M.; Jing, Z.; Yubin, L.; Liqun, L.; Huanbo, Y.; Zhiming, L.; Chunyu, Y. Vegetation coverage extraction model of winter wheat based on pixel dichotomy. J. South China Agric. Univ. 2020, 41, 7. [Google Scholar]
- Fangye, C. Landscape Reconstruction of the Abandoned Coal Mine--A Case Study of Taiyuan Wanbailinqu in Xishan Mine; Nanjing Forestry University: Nanjing, China, 2013. [Google Scholar]
- Weiling, Y.; Qingqing, J.; Yingjie, Z.; Xiaohong, W.; Jinzhong, Y. Analysis on typical pattern of mine geological environment restoration and governance based on remote sensing dynamic monitoring in Shandong. Miner. Explor. 2015, 8, 627–633. [Google Scholar]
- Zhihong, A.; Yushu, C.; Baocun, W.; Xiyong, S.; Yajuan, W. A study on the integration of remote sensing monitoring and regulation model in restoration and treatment of mine geological environment in Liaoyuan. Chin. J. Geomech. 2017, 23, 7. [Google Scholar]
- Yaqin, S.; Baogang, D.; Na, A.; Xian, Z.; Yu, X.; Yalin, J.; Yongze, Q.; Ming, Y. Remote Sensing Monitoring of Typical Ecological Restoration Models of Abandoned Open-pit Mines in the Yangtze River Economic Belt: A Case Study of Hubei Province. China Mining Industry: 1-9[2022-09-14]. Available online: http://kns.cnki.net/kcms/detail/11.3033.TD.20220416.1939.002.html (accessed on 2 January 2023).
- Qi, Z. The Research for Landscape Planning of The Coal Mine Wastelands; Zhejiang University: Hangzhou, China, 2015. [Google Scholar]
- Huwei, Q. Research on the Growth of Farmers’ Income from Ecological Garden Construction in Wanbailin District; Shanxi Agricultural University: Jinzhong, China, 2015. [Google Scholar]


| Vegetation Index | Full Name | Formula | References |
|---|---|---|---|
| EXG | Excess green | 2 × G − R − B | [10] |
| GRVI | Green–red vegetation index | (G − R)/(G + R) | [11] |
| EXGR | Excess green–excess red | EXG − (1.4 × R − G) | [12] |
| NGBDI | Normalized green–blue difference index | (G − B)/(G + B) | [13] |
| CIVE | Color index of vegetation extraction | 0.44 × R + 0.88 × G + 0.39 × B + 18.79 | [14] |
| RGBVI | Red–green–blue vegetation index | (G2 − (R × B))/(G2 + (R × B)) | [15] |
| VDVI | Visible–band difference vegetation index | (G − (R + B)/2)/(G + (R + B)/2) | [16] |
| Figure Category | Vegetation | Bare Ground | Road | Fly Ash Deposition Tank | Building |
|---|---|---|---|---|---|
| Total number of pixels | 13,143,311 | 1,267,092 | 1,838,215 | 320,001 | 1,257,173 |
| Cell Information | Pure Soil Cell Information | Pure Vegetation Cell Information | |
|---|---|---|---|
| Index | |||
| EXG | −29.552941 | 50.658824 | |
| GRVI | −0.592157 | 0.223529 | |
| EXGR | −101.218803 | 45.138835 | |
| NGBDI | −0.192157 | 1 | |
| RGBVI | −0.458824 | 1 | |
| VDVI | −0.435294 | 0.427451 | |
| CIVE | 0.105882 | −0.819608 | |
| Vegetation Index Model | Vegetation Cover | Extraction Error/% | ||
|---|---|---|---|---|
| Cell Dichotomy | Supervise Classification | Difference | ||
| EXG | 0.514216 | 0.737320 | 0.223104 | 30.26% |
| GRVI | 0.629308 | 0.737320 | 0.108012 | 14.65% |
| EXGR | 0.580621 | 0.737320 | 0.156699 | 21.25% |
| NGBDI | 0.434810 | 0.737320 | 0.302510 | 41.03% |
| RGBVI | 0.509429 | 0.737320 | 0.227891 | 30.91% |
| VDVI | 0.570686 | 0.737320 | 0.166634 | 22.60% |
| CIVE | 0.750179 | 0.737320 | 0.012859 | 1.74% |
Disclaimer/Publisher’s Note: The statements, opinions and data contained in all publications are solely those of the individual author(s) and contributor(s) and not of MDPI and/or the editor(s). MDPI and/or the editor(s) disclaim responsibility for any injury to people or property resulting from any ideas, methods, instructions or products referred to in the content. |
© 2023 by the authors. Licensee MDPI, Basel, Switzerland. This article is an open access article distributed under the terms and conditions of the Creative Commons Attribution (CC BY) license (https://creativecommons.org/licenses/by/4.0/).
Share and Cite
Tao, W.; Jin, Z. Remote Sensing Image Characteristics and Typical Area Analysis of Taiyuan Xishan Ecological Restoration Area. Sensors 2023, 23, 2108. https://doi.org/10.3390/s23042108
Tao W, Jin Z. Remote Sensing Image Characteristics and Typical Area Analysis of Taiyuan Xishan Ecological Restoration Area. Sensors. 2023; 23(4):2108. https://doi.org/10.3390/s23042108
Chicago/Turabian StyleTao, Wang, and Zhang Jin. 2023. "Remote Sensing Image Characteristics and Typical Area Analysis of Taiyuan Xishan Ecological Restoration Area" Sensors 23, no. 4: 2108. https://doi.org/10.3390/s23042108