
Identification of a Gait Pattern for Detecting Mild Cognitive Impairment in Parkinson’s Disease

 and
and
Abstract
:1. Introduction
2. Materials and Methods
2.1. Participants
- Hoehn and Yahr score ≤ 3;
- Disease duration ≤ 10 years;
- Age ≥ 45 years;
- Dopaminergic treatment at a stable dosage during the previous 4 weeks;
- Ability to walk independently.
- Dementia according to the Diagnostic and Statistical Manual of Mental Disorders 5th edition (DSM-V);
- Other neurological diseases;
- Orthopedic diseases;
- Severe cardiovascular/respiratory diseases;
- Anticholinergic or neuroleptic treatment;
- Brain surgery.
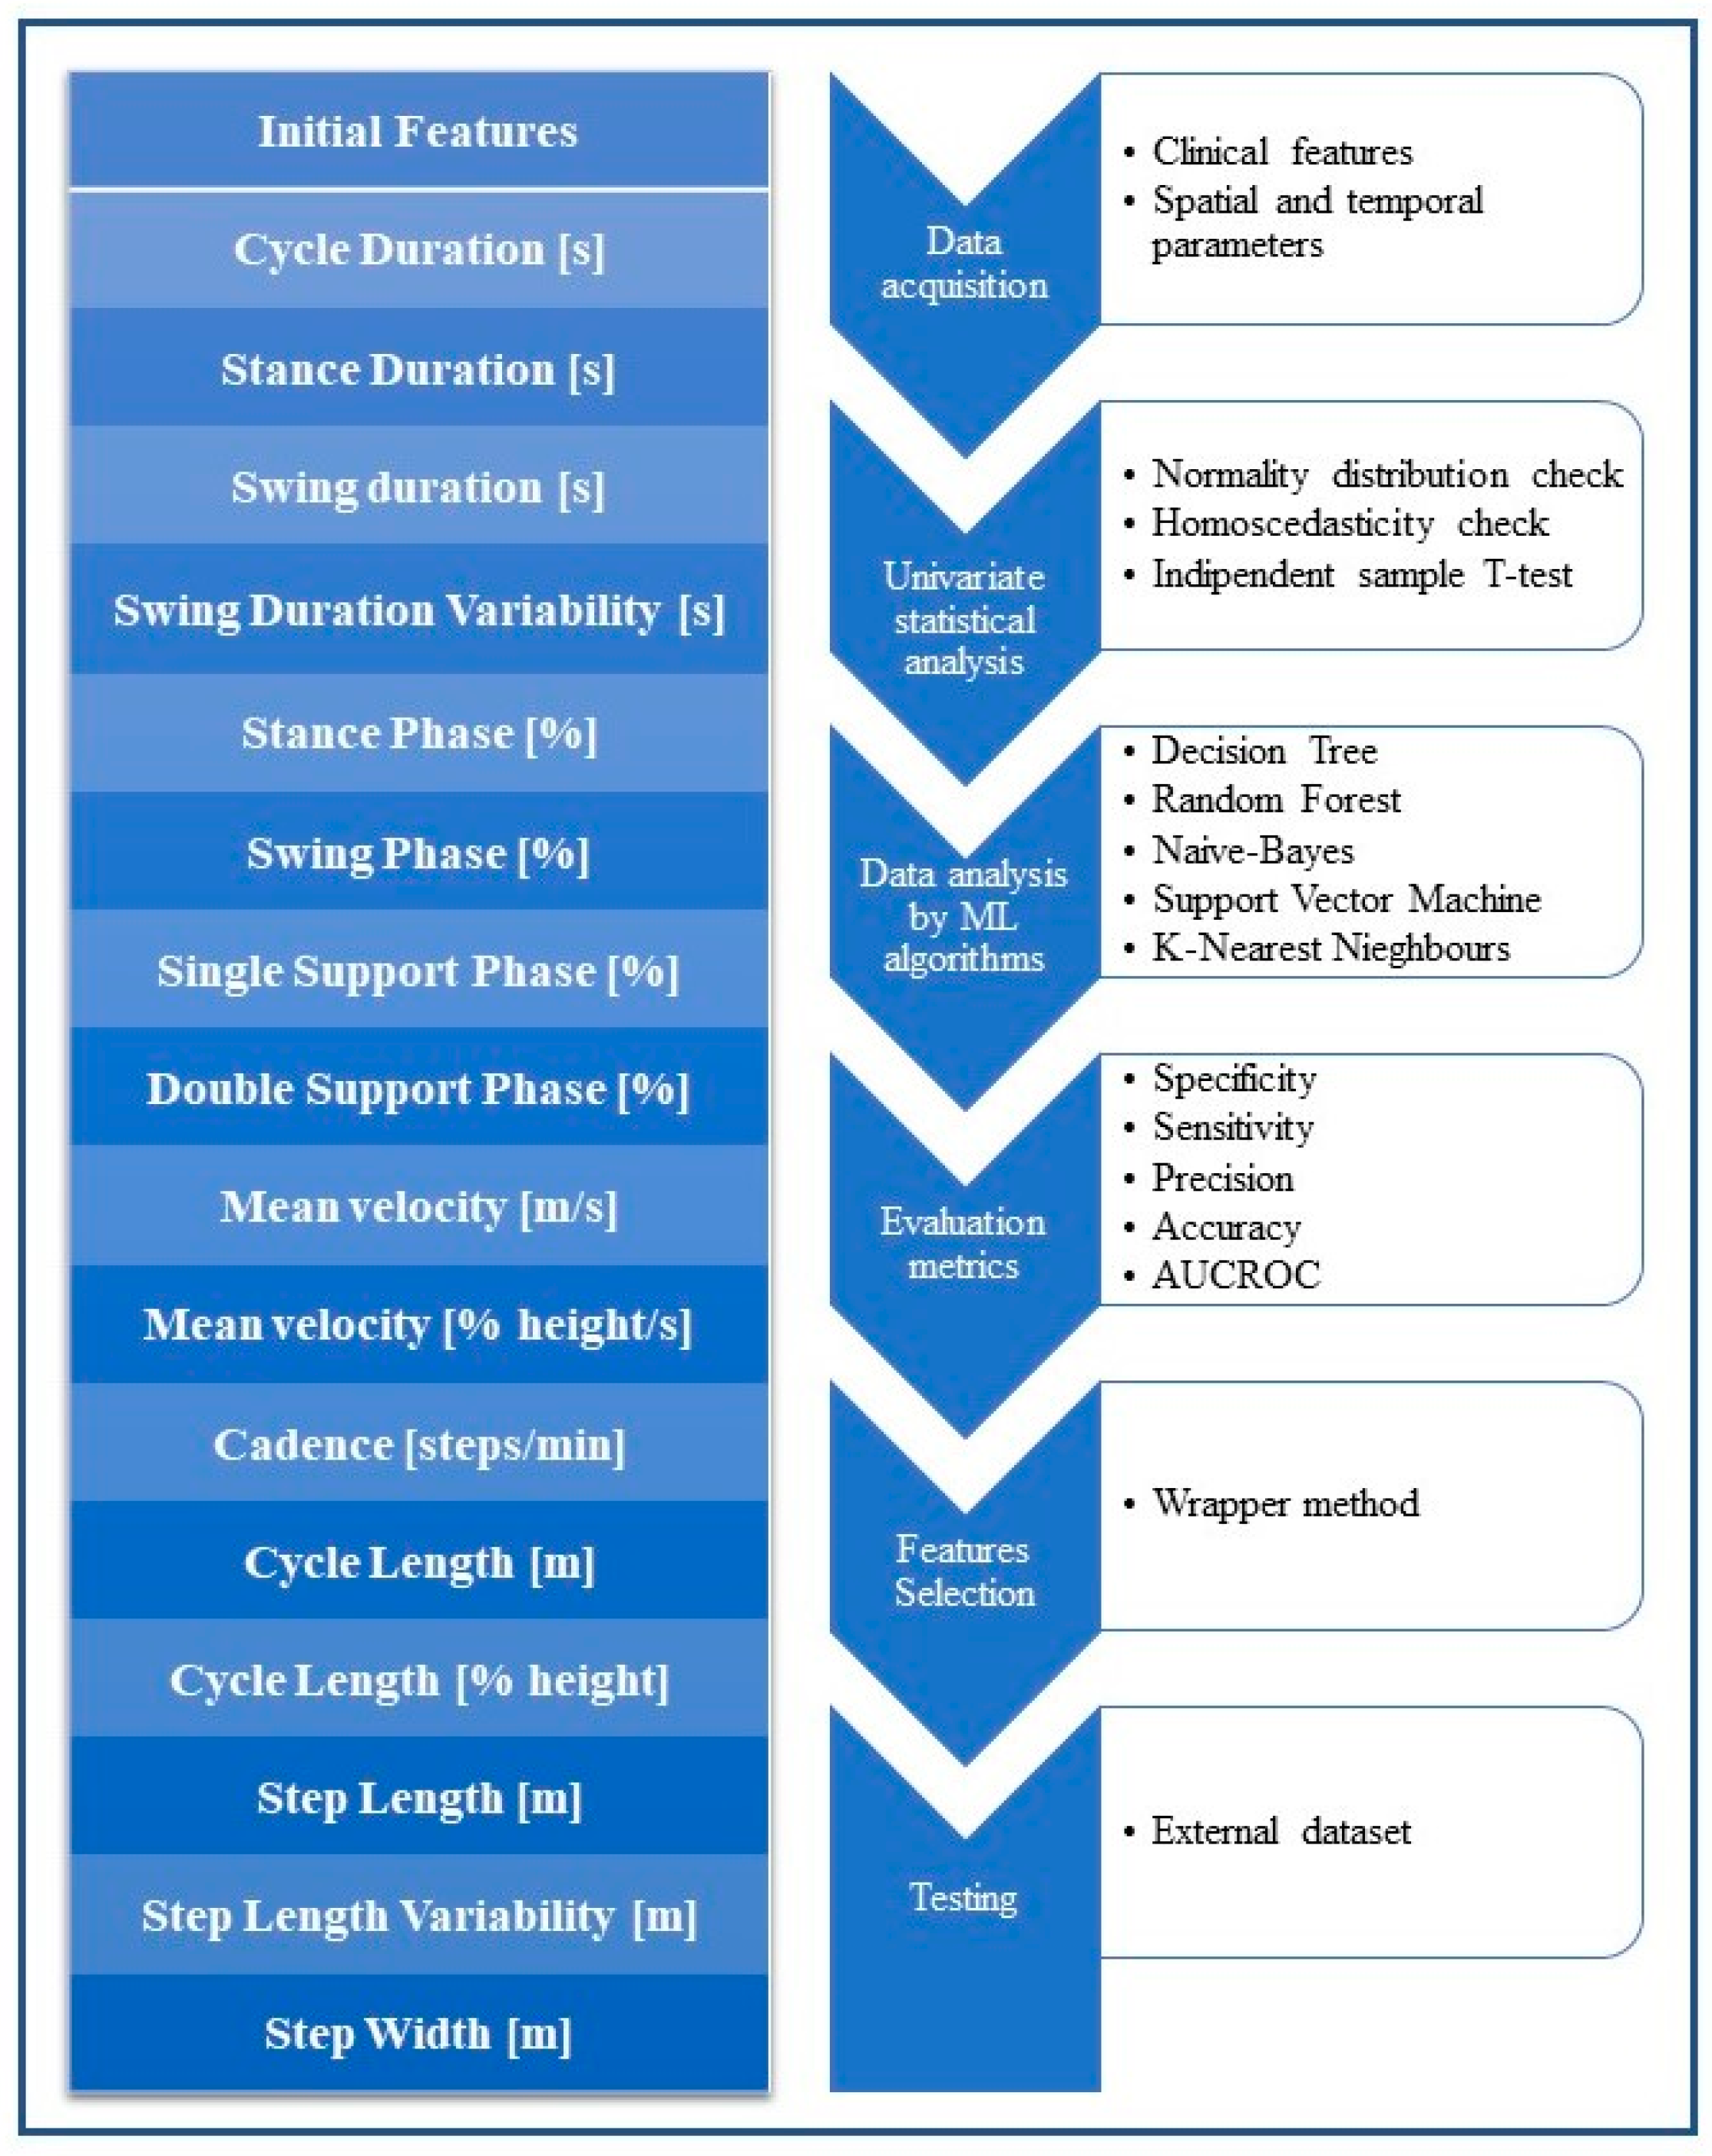
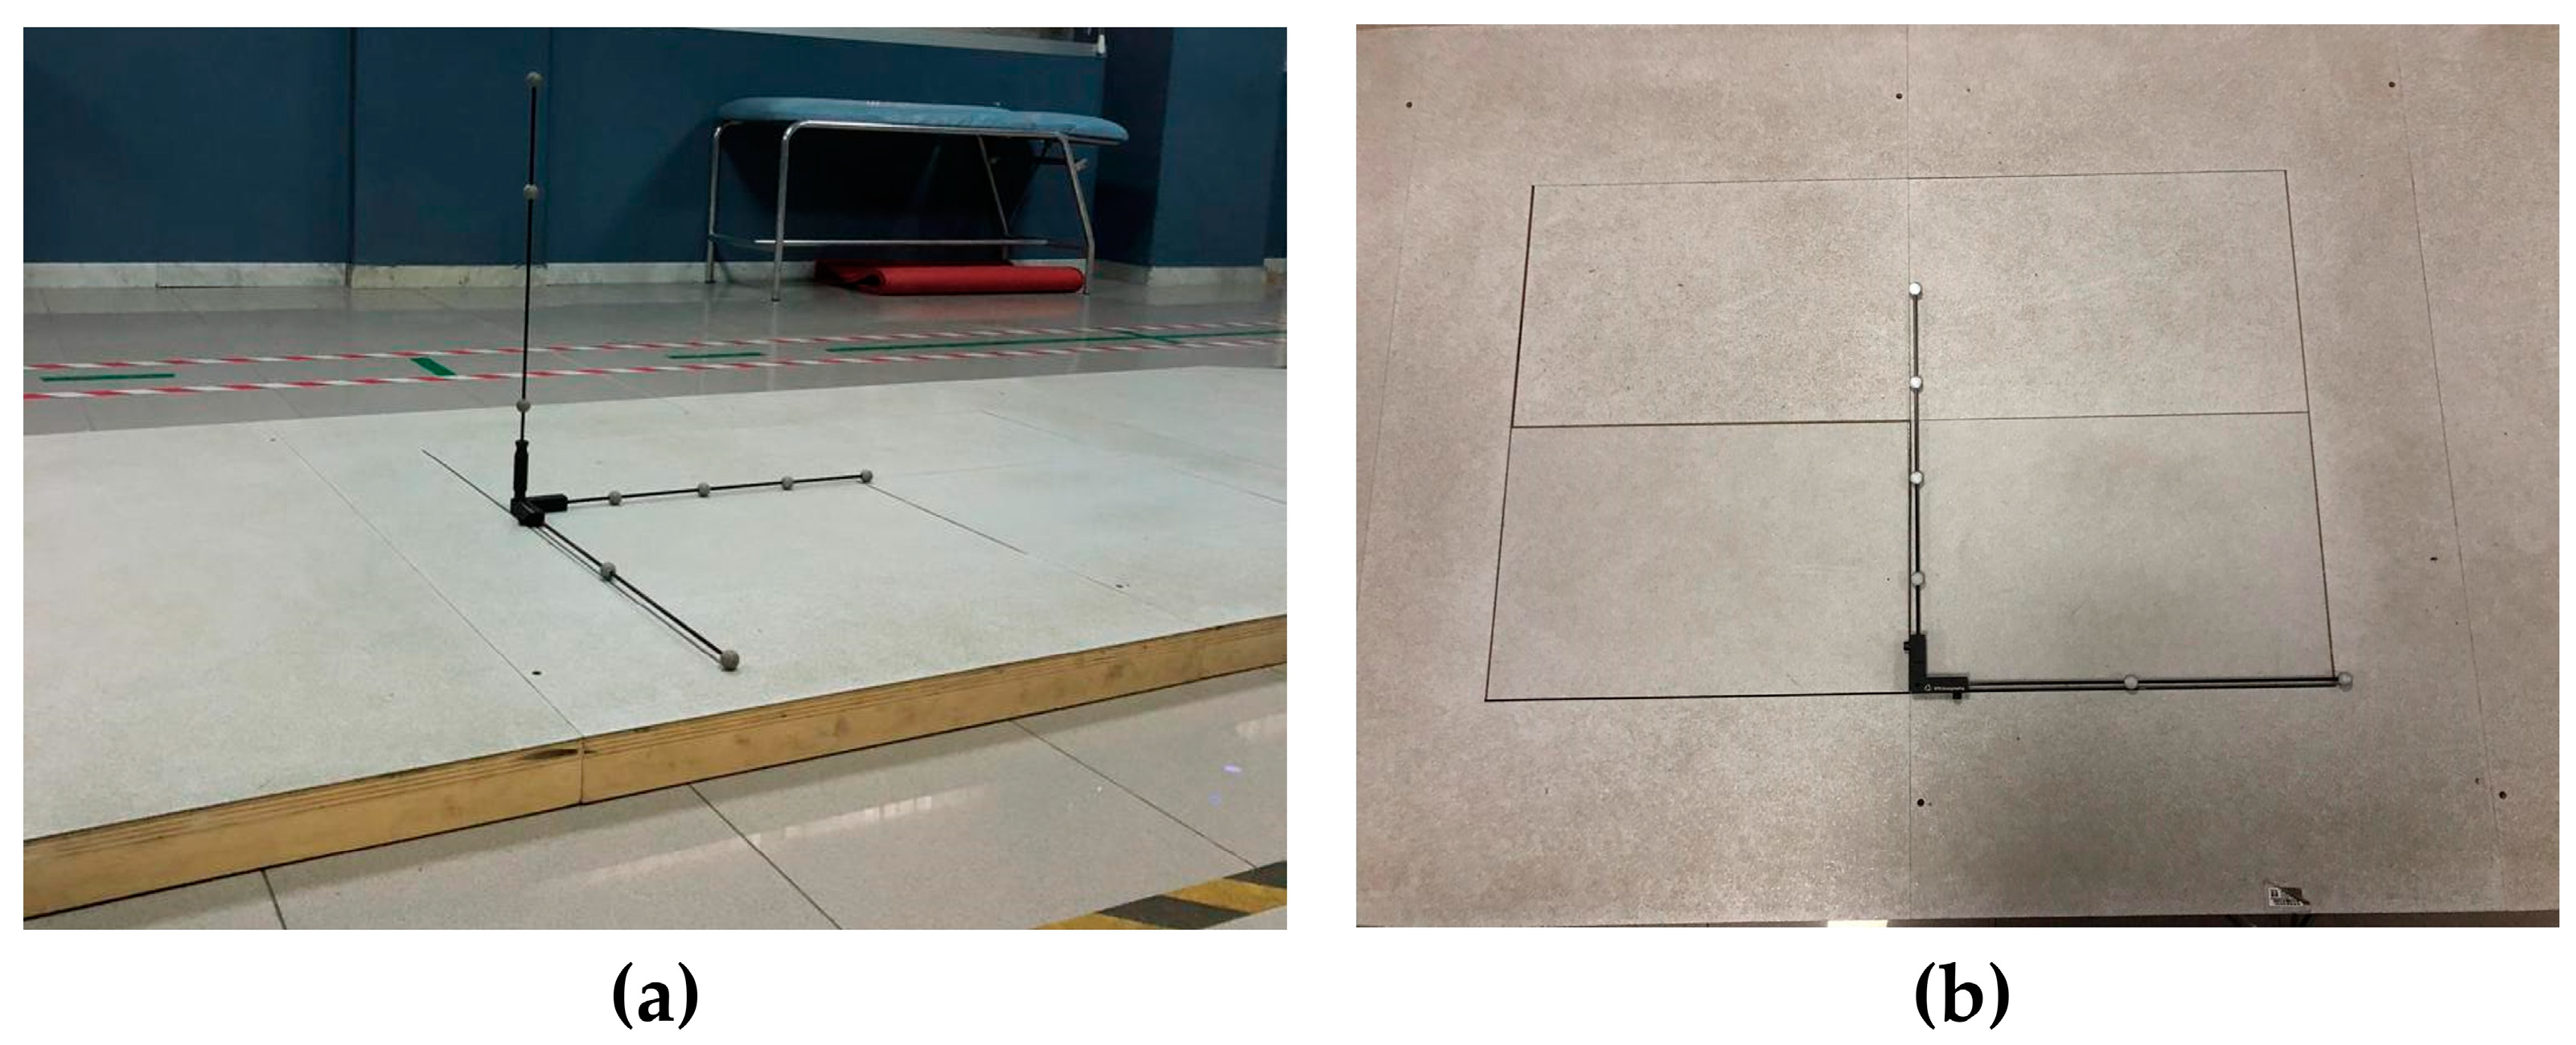
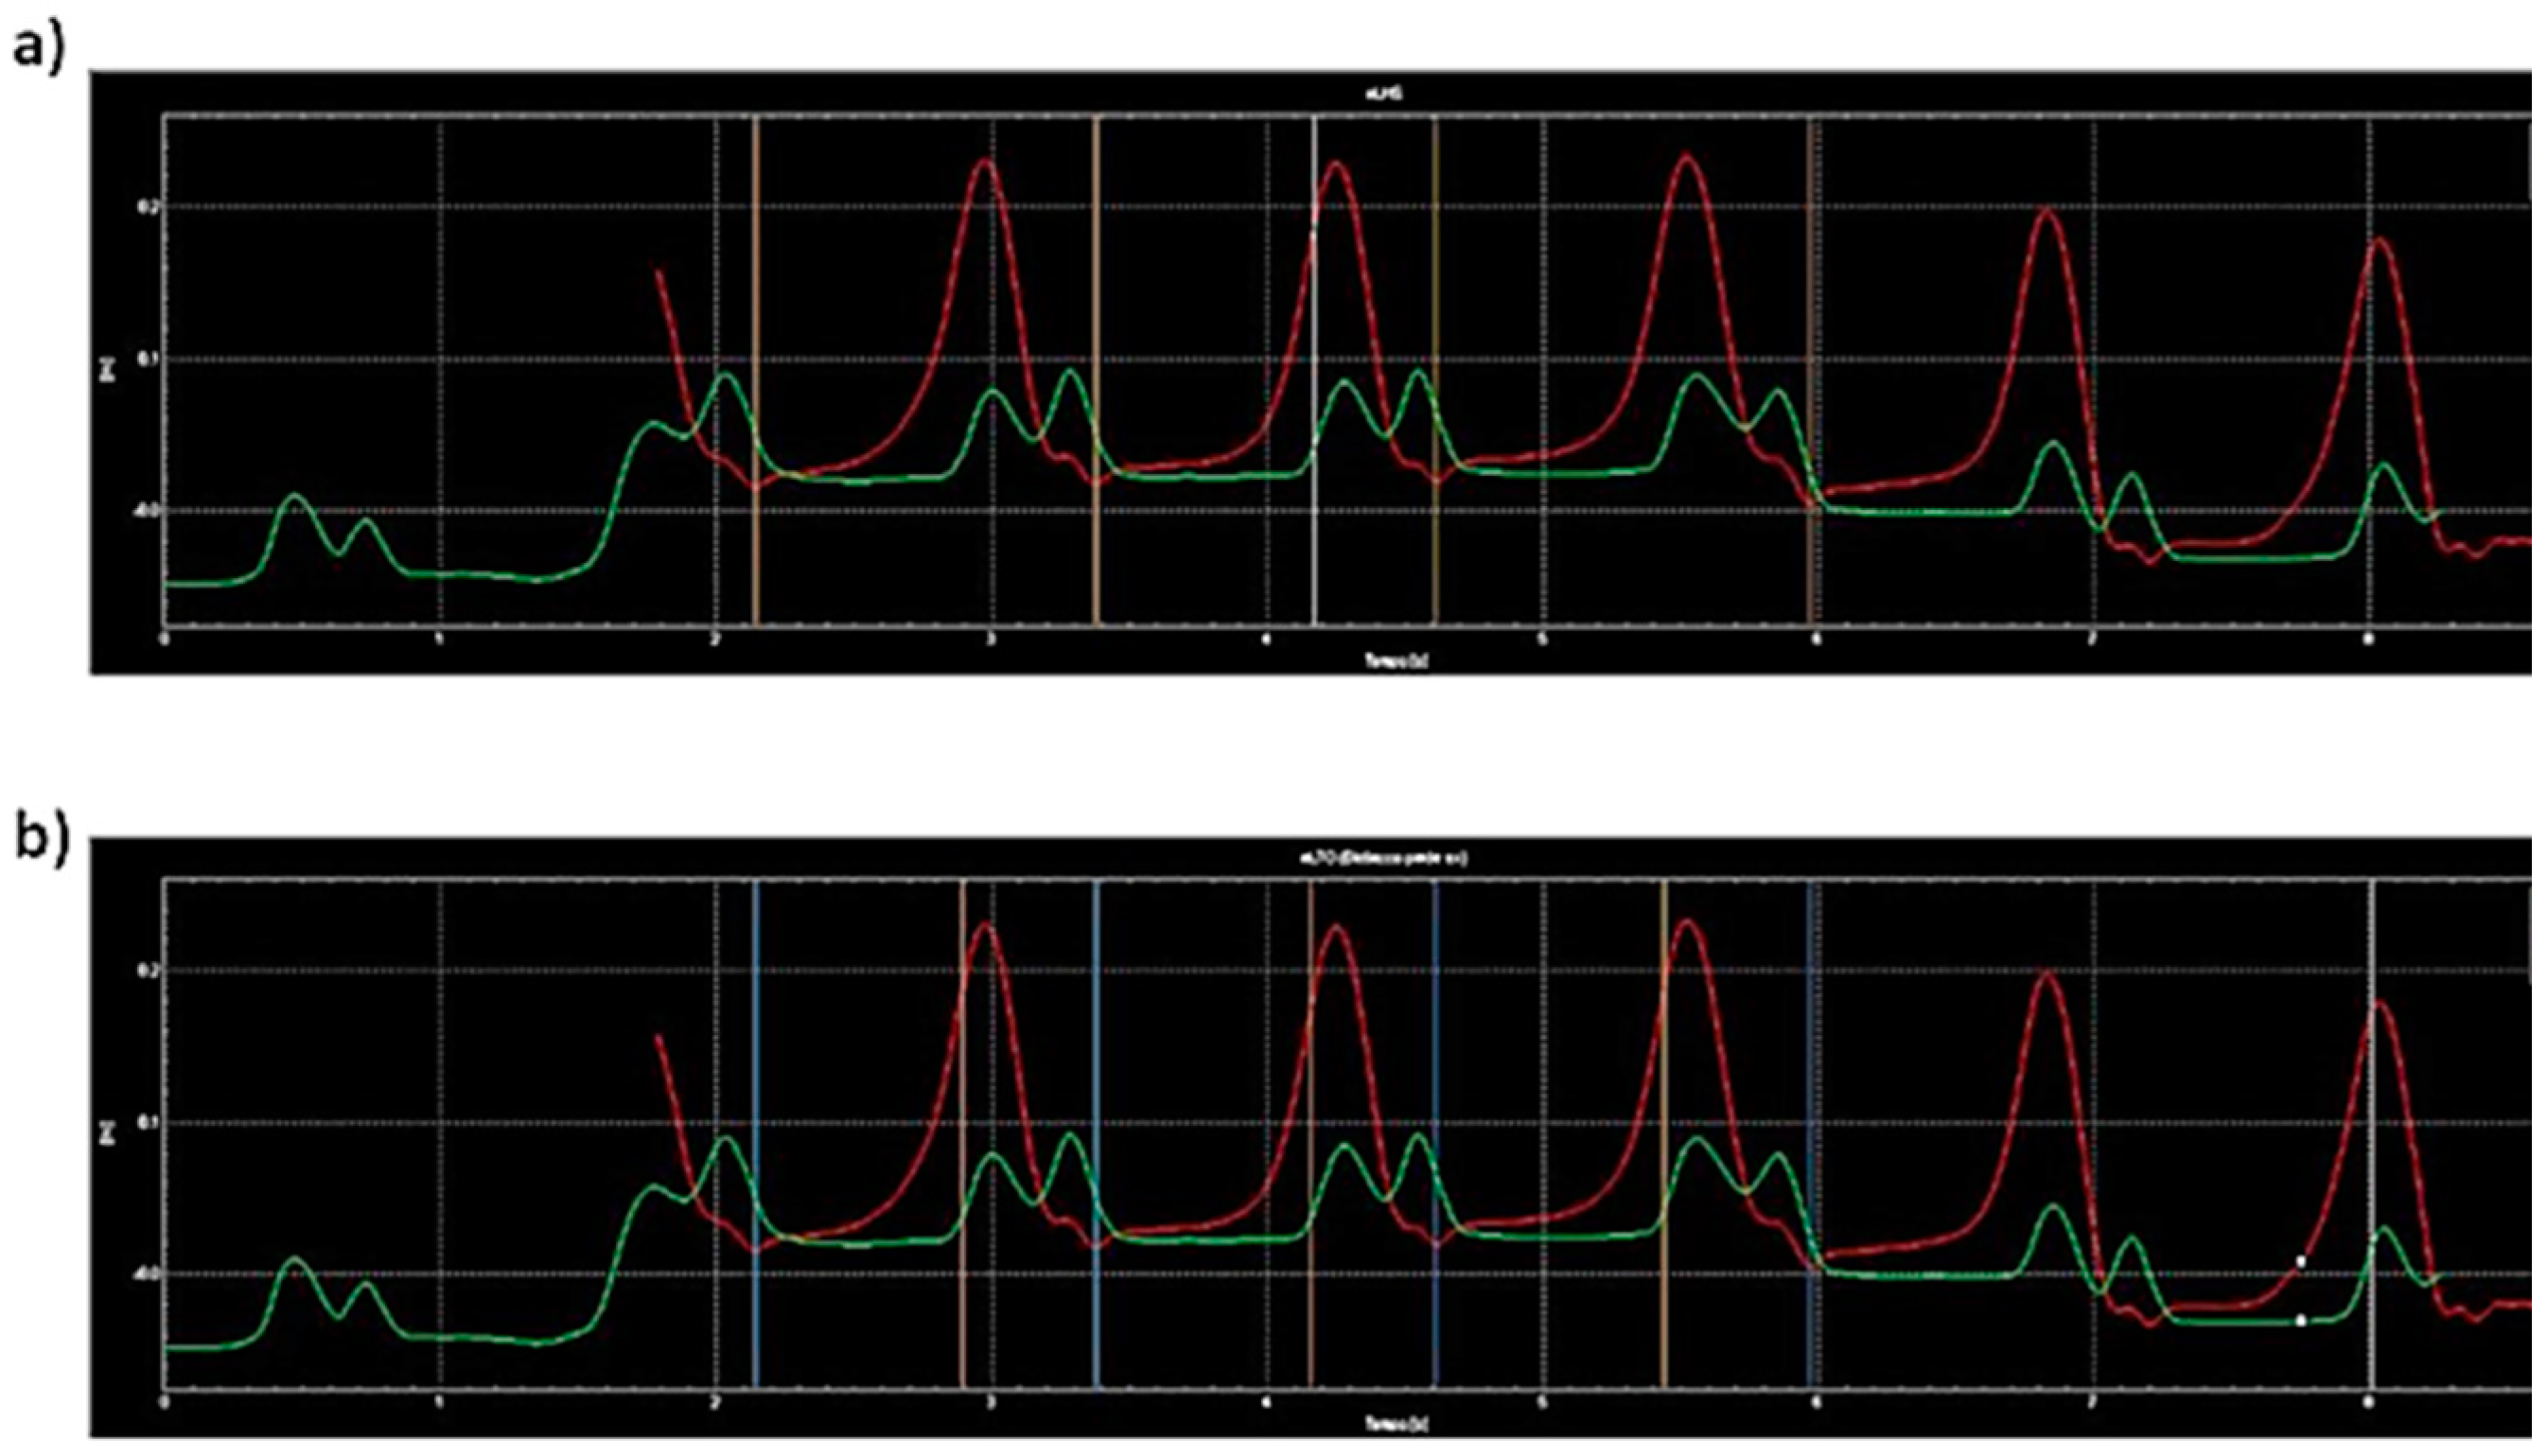
2.2. Gait Analysis
2.3. Tool and Algorithms
- Specificity: capacity to correctly detect subjects not belonging to the group under examination:
- Sensitivity: capacity to correctly detect subjects belonging to the group under examination:
- Precision: a measure of the positive patterns correctly predicted from the total predicted patterns in a positive class:
- Accuracy: the ratio of correct predictions over the total number of records:where TN is the number of true negatives, TP represents the number of true positives predicted by the classifier, FP is the number of false positives, and, consequently, FN is the number of false negatives.
- Area Under the Curve Receiver Operating Characteristic (AUCROC): a qualitative indicator for the binary classification, ranging from 0 to 1, with 0.5 indicating a classification not better than random guessing.
3. Results
4. Discussion
5. Conclusions
Supplementary Materials
Author Contributions
Funding
Institutional Review Board Statement
Informed Consent Statement
Data Availability Statement
Conflicts of Interest
References
- Tysnes, O.-B.; Storstein, A. Epidemiology of Parkinson’s Disease. J. Neural Transm. 2017, 124, 901–905. [Google Scholar] [CrossRef] [PubMed]
- Morris, M.E.; Iansek, R.; Matyas, T.A.; Summers, J.J. The Pathogenesis of Gait Hypokinesia in Parkinson’s Disease. Brain J. Neurol. 1994, 117 Pt 5, 1169–1181. [Google Scholar] [CrossRef]
- Chaudhuri, K.R.; Healy, D.G.; Schapira, A.H. Non-Motor Symptoms of Parkinson’s Disease: Diagnosis and Management. Lancet Neurol. 2006, 5, 235–245. [Google Scholar] [CrossRef] [PubMed]
- Litvan, I.; Goldman, J.G.; Tröster, A.I.; Schmand, B.A.; Weintraub, D.; Petersen, R.C.; Mollenhauer, B.; Adler, C.H.; Marder, K.; Williams-Gray, C.H.; et al. Diagnostic Criteria for Mild Cognitive Impairment in Parkinson’s Disease: Movement Disorder Society Task Force Guidelines. Mov. Disord. Off. J. Mov. Disord. Soc. 2012, 27, 349–356. [Google Scholar] [CrossRef] [PubMed]
- Aarsland, D.; Batzu, L.; Halliday, G.M.; Geurtsen, G.J.; Ballard, C.; Ray Chaudhuri, K.; Weintraub, D. Parkinson Disease-Associated Cognitive Impairment. Nat. Rev. Dis. Primer 2021, 7, 47. [Google Scholar] [CrossRef]
- Morris, R.; Lord, S.; Bunce, J.; Burn, D.; Rochester, L. Gait and Cognition: Mapping the Global and Discrete Relationships in Ageing and Neurodegenerative Disease. Neurosci. Biobehav. Rev. 2016, 64, 326–345. [Google Scholar] [CrossRef] [PubMed]
- Amboni, M.; Barone, P.; Hausdorff, J.M. Cognitive Contributions to Gait and Falls: Evidence and Implications. Mov. Disord. Off. J. Mov. Disord. Soc. 2013, 28, 1520–1533. [Google Scholar] [CrossRef]
- Amboni, M.; Ricciardi, C.; Cuoco, S.; Donisi, L.; Volzone, A.; Ricciardelli, G.; Pellecchia, M.T.; Santangelo, G.; Cesarelli, M.; Barone, P. Mild Cognitive Impairment Subtypes Are Associated With Peculiar Gait Patterns in Parkinson’s Disease. Front. Aging Neurosci. 2022, 14, 781480. [Google Scholar] [CrossRef]
- Morris, R.; Lord, S.; Lawson, R.A.; Coleman, S.; Galna, B.; Duncan, G.W.; Khoo, T.K.; Yarnall, A.J.; Burn, D.J.; Rochester, L. Gait Rather Than Cognition Predicts Decline in Specific Cognitive Domains in Early Parkinson’s Disease. J. Gerontol. Ser. A 2017, 72, 1656–1662. [Google Scholar] [CrossRef]
- Bahureksa, L.; Najafi, B.; Saleh, A.; Sabbagh, M.; Coon, D.; Mohler, M.J.; Schwenk, M. The Impact of Mild Cognitive Impairment on Gait and Balance: A Systematic Review and Meta-Analysis of Studies Using Instrumented Assessment. Gerontology 2017, 63, 67–83. [Google Scholar] [CrossRef] [Green Version]
- Baker, R.; Esquenazi, A.; Benedetti, M.G.; Desloovere, K. Gait Analysis: Clinical Facts. Eur. J. Phys. Rehabil. Med. 2016, 52, 560–574. [Google Scholar] [PubMed]
- Cicirelli, G.; Impedovo, D.; Dentamaro, V.; Marani, R.; Pirlo, G.; D’Orazio, T.R. Human Gait Analysis in Neurodegenerative Diseases: A Review. IEEE J. Biomed. Health Inform. 2022, 26, 229–242. [Google Scholar] [CrossRef]
- Akhtaruzzaman, M.; Shafie, A.A.; Khan, M.R. Gait Analysis: Systems, Technologies, and Importance. J. Mech. Med. Biol. 2016, 16, 1630003. [Google Scholar] [CrossRef]
- Muro-de-la-Herran, A.; Garcia-Zapirain, B.; Mendez-Zorrilla, A. Gait Analysis Methods: An Overview of Wearable and Non-Wearable Systems, Highlighting Clinical Applications. Sensors 2014, 14, 3362–3394. [Google Scholar] [CrossRef] [PubMed]
- Castiglia, S.F.; Tatarelli, A.; Trabassi, D.; De Icco, R.; Grillo, V.; Ranavolo, A.; Varrecchia, T.; Magnifica, F.; Di Lenola, D.; Coppola, G.; et al. Ability of a Set of Trunk Inertial Indexes of Gait to Identify Gait Instability and Recurrent Fallers in Parkinson’s Disease. Sensors 2021, 21, 3449. [Google Scholar] [CrossRef]
- Corona, F.; Pau, M.; Guicciardi, M.; Murgia, M.; Pili, R.; Casula, C. Quantitative Assessment of Gait in Elderly People Affected by Parkinson’s Disease. In Proceedings of the 2016 IEEE International Symposium on Medical Measurements and Applications (MeMeA), Benevento, Italy, 15–18 May 2016; pp. 1–6. [Google Scholar]
- Donisi, L.; Cesarelli, G.; Balbi, P.; Provitera, V.; Lanzillo, B.; Coccia, A.; D’Addio, G.; Donisi, L.; Cesarelli, G.; Balbi, P.; et al. Positive Impact of Short-Term Gait Rehabilitation in Parkinson Patients: A Combined Approach Based on Statistics and Machine Learning. Math. Biosci. Eng. 2021, 18, 6995–7009. [Google Scholar] [CrossRef]
- Landolfi, A.; Ricciardi, C.; Donisi, L.; Cesarelli, G.; Troisi, J.; Vitale, C.; Barone, P.; Amboni, M. Machine Learning Approaches in Parkinson’s Disease. Curr. Med. Chem. 2021, 28, 6548–6568. [Google Scholar] [CrossRef] [PubMed]
- Wahid, F.; Begg, R.K.; Hass, C.J.; Halgamuge, S.; Ackland, D.C. Classification of Parkinson’s Disease Gait Using Spatial-Temporal Gait Features. IEEE J. Biomed. Health Inform. 2015, 19, 1794–1802. [Google Scholar] [CrossRef]
- Ricciardi, C.; Amboni, M.; De Santis, C.; Improta, G.; Volpe, G.; Iuppariello, L.; Ricciardelli, G.; D’Addio, G.; Vitale, C.; Barone, P.; et al. Using Gait Analysis’ Parameters to Classify Parkinsonism: A Data Mining Approach. Comput. Methods Programs Biomed. 2019, 180, 105033. [Google Scholar] [CrossRef]
- Ricciardi, C.; Amboni, M.; De Santis, C.; Ricciardelli, G.; Improta, G.; D’Addio, G.; Cuoco, S.; Picillo, M.; Barone, P.; Cesarelli, M. Machine Learning Can Detect the Presence of Mild Cognitive Impairment in Patients Affected by Parkinson’s Disease. In Proceedings of the 2020 IEEE International Symposium on Medical Measurements and Applications (MeMeA), Bari, Italy, 1 June–1 July 2020; pp. 1–6. [Google Scholar]
- Chen, P.-H.; Lien, C.-W.; Wu, W.-C.; Lee, L.-S.; Shaw, J.-S. Gait-Based Machine Learning for Classifying Patients with Different Types of Mild Cognitive Impairment. J. Med. Syst. 2020, 44, 107. [Google Scholar] [CrossRef] [PubMed]
- Russo, M.; Amboni, M.; Volzone, A.; Ricciardelli, G.; Cesarelli, G.; Ponsiglione, A.M.; Barone, P.; Romano, M.; Ricciardi, C. Interplay between Gait and Neuropsychiatric Symptoms in Parkinson’s Disease. Eur. J. Transl. Myol. 2022, 32, 10463. [Google Scholar] [CrossRef]
- Trabassi, D.; Serrao, M.; Varrecchia, T.; Ranavolo, A.; Coppola, G.; De Icco, R.; Tassorelli, C.; Castiglia, S.F. Machine Learning Approach to Support the Detection of Parkinson’s Disease in IMU-Based Gait Analysis. Sensors 2022, 22, 3700. [Google Scholar] [CrossRef]
- Gelb, D.J.; Oliver, E.; Gilman, S. Diagnostic Criteria for Parkinson Disease. Arch. Neurol. 1999, 56, 33–39. [Google Scholar] [CrossRef]
- Davis, R.B.; Õunpuu, S.; Tyburski, D.; Gage, J.R. A Gait Analysis Data Collection and Reduction Technique. Hum. Mov. Sci. 1991, 10, 575–587. [Google Scholar] [CrossRef]
- Huxhold, O.; Li, S.-C.; Schmiedek, F.; Lindenberger, U. Dual-Tasking Postural Control: Aging and the Effects of Cognitive Demand in Conjunction with Focus of Attention. Brain Res. Bull. 2006, 69, 294–305. [Google Scholar] [CrossRef]
- Ricciardi, C.; Valente, A.S.; Edmund, K.; Cantoni, V.; Green, R.; Fiorillo, A.; Picone, I.; Santini, S.; Cesarelli, M. Linear Discriminant Analysis and Principal Component Analysis to Predict Coronary Artery Disease. Health Inform. J. 2020, 26, 2181–2192. [Google Scholar] [CrossRef]
- Scrutinio, D.; Ricciardi, C.; Donisi, L.; Losavio, E.; Battista, P.; Guida, P.; Cesarelli, M.; Pagano, G.; D’Addio, G. Machine Learning to Predict Mortality after Rehabilitation among Patients with Severe Stroke. Sci. Rep. 2020, 10, 20127. [Google Scholar] [CrossRef]
- Ricciardi, C.; Amboni, M.; De Santis, C.; Ricciardelli, G.; Improta, G.; Iuppariello, L.; D’Addio, G.; Barone, P.; Cesarelli, M. Classifying Different Stages of Parkinson’s Disease Through Random Forests. In XV Mediterranean Conference on Medical and Biological Engineering and Computing—MEDICON 2019; Henriques, J., Neves, N., de Carvalho, P., Eds.; Springer International Publishing: Cham, Switzerland, 2020; pp. 1155–1162. [Google Scholar]
- Varrecchia, T.; Castiglia, S.F.; Ranavolo, A.; Conte, C.; Tatarelli, A.; Coppola, G.; Lorenzo, C.D.; Draicchio, F.; Pierelli, F.; Serrao, M. An Artificial Neural Network Approach to Detect Presence and Severity of Parkinson’s Disease via Gait Parameters. PLoS ONE 2021, 16, e0244396. [Google Scholar] [CrossRef]
- Witten, I.H.; Frank, E.; Hall, M.A. Data Mining: Practical Machine Learning Tools and Techniques; Elsevier: Amsterdam, The Netherlands, 2011; ISBN 978-0-12-374856-0. [Google Scholar]
- Breiman, L. Random Forests. Mach. Learn. 2001, 45, 5–32. [Google Scholar] [CrossRef]
- Rish, I. An Empirical Study of the Naive Bayes Classifier. In Proceedings of the IJCAI 2001 Workshop on Empirical Methods in Artificial Intelligence, Seattle, WA, USA, 4–10 August 2001. [Google Scholar]
- Noble, W.S. What Is a Support Vector Machine? Nat. Biotechnol. 2006, 24, 1565–1567. [Google Scholar] [CrossRef]
- Wu, X.; Kumar, V.; Ross Quinlan, J.; Ghosh, J.; Yang, Q.; Motoda, H.; McLachlan, G.J.; Ng, A.; Liu, B.; Yu, P.S.; et al. Top 10 Algorithms in Data Mining. Knowl. Inf. Syst. 2008, 14, 1–37. [Google Scholar] [CrossRef]
- Kohavi, R. A Study of Cross-Validation and Bootstrap for Accuracy Estimation and Model Selection. In Proceedings of the 14th International Joint Conference on Artificial Intelligence, Montreal, QC, Canada, 20–25 August 1995; pp. 1137–1143. [Google Scholar]
- Hossin, M.; Sulaiman, M.N. A Review on Evaluation Metrics for Data Classification Evaluations. Int. J. Data Min. Knowl. Manag. Process 2015, 5, 1–11. [Google Scholar] [CrossRef]
- Kohavi, R.; Sommerfield, D. Feature Subset Selection Using the Wrapper Method: Overfitting and Dynamic Search Space Topology. In KDD’95: Proceedings of the First International Conference on Knowledge Discovery and Data Mining; AAAI Press: Montreal, QC, Canada, 1995; pp. 192–197. [Google Scholar]
- Baiano, C.; Barone, P.; Trojano, L.; Santangelo, G. Prevalence and Clinical Aspects of Mild Cognitive Impairment in Parkinson’s Disease: A Meta-Analysis. Mov. Disord. 2020, 35, 45–54. [Google Scholar] [CrossRef] [PubMed]
- Amboni, M.; Barone, P.; Iuppariello, L.; Lista, I.; Tranfaglia, R.; Fasano, A.; Picillo, M.; Vitale, C.; Santangelo, G.; Agosti, V.; et al. Gait Patterns in Parkinsonian Patients with or without Mild Cognitive Impairment. Mov. Disord. 2012, 27, 1536–1543. [Google Scholar] [CrossRef]
- Morris, R.; Martini, D.N.; Smulders, K.; Kelly, V.E.; Zabetian, C.P.; Poston, K.; Hiller, A.; Chung, K.A.; Yang, L.; Hu, S.C.; et al. Cognitive Associations with Comprehensive Gait and Static Balance Measures in Parkinson’s Disease. Parkinsonism Relat. Disord. 2019, 69, 104–110. [Google Scholar] [CrossRef] [PubMed]
- Ghoraani, B.; Boettcher, L.N.; Hssayeni, M.D.; Rosenfeld, A.; Tolea, M.I.; Galvin, J.E. Detection of Mild Cognitive Impairment and Alzheimer’s Disease Using Dual-Task Gait Assessments and Machine Learning. Biomed. Signal Process. Control 2021, 64, 102249. [Google Scholar] [CrossRef]
- Boettcher, L.N.; Hssayeni, M.; Rosenfeld, A.; Tolea, M.I.; Galvin, J.E.; Ghoraani, B. Dual-Task Gait Assessment and Machine Learning for Early-Detection of Cognitive Decline. In Proceedings of the 2020 42nd Annual International Conference of the IEEE Engineering in Medicine & Biology Society (EMBC), Montreal, QC, Canada, 20–24 July 2020; pp. 3204–3207. [Google Scholar]


| PD-MCI (Sample Size = 31) | PD-NO MCI (Sample Size = 29) | ||||
|---|---|---|---|---|---|
| Variables | Mean | SD | Mean | SD | p-Value |
| Age | 66.20 | 8.50 | 61.32 | 8.10 | 0.015 * |
| BMI | 28.30 | 3.98 | 26.98 | 3.09 | 0.429 |
| Disease Duration | 5.41 | 2.44 | 4.74 | 2.64 | 0.545 |
| LEDD | 576.60 | 378.91 | 554.81 | 442.98 | 0.901 |
| Hoehn &Yahr | 1.95 | 0.30 | 1.76 | 0.41 | 0.045 * |
| MDS-UPDRS: Part I | 9.23 | 6.89 | 7.20 | 4.36 | 0.070 |
| MDS-UPDRS: Part II | 8.10 | 5.50 | 7.98 | 6.31 | 0.524 |
| MDS-UPDRS: Part III | 25.56 | 8.61 | 20.98 | 7.67 | 0.041 * |
| MDS-UPDRS: Part IV | 1.50 | 2.93 | 2.10 | 3.15 | 0.434 |
| PD-MCI (Sample Size = 9) | PD-NO MCI (Sample Size = 11) | ||||
|---|---|---|---|---|---|
| Variables | Mean | SD | Mean | SD | p-Value |
| Age | 71.33 | 7.57 | 63.55 | 11.19 | 0.092 |
| BMI | 28.91 | 4.49 | 24.48 | 3.31 | 0.134 |
| Disease Duration | 3.83 | 1.76 | 4.18 | 3.10 | 0.768 |
| LEDD | 718.13 | 567.98 | 569.55 | 569.24 | 0.581 |
| Hoehn &Yahr | 2.06 | 0.17 | 1.90 | 0.17 | 0.210 |
| MDS-UPDRS: Part I | 9.56 | 5.70 | 9.73 | 5.04 | 0.944 |
| MDS-UPDRS: Part II | 10.11 | 2.93 | 10.91 | 8.79 | 0.798 |
| MDS-UPDRS: Part III | 23.78 | 4.74 | 22.91 | 9.77 | 0.810 |
| MDS-UPDRS: Part IV | 0.67 | 1.32 | 2.09 | 3.17 | 0.226 |
| GAIT TASK | PD-MCI (Sample Size = 40) | PD-NO MCI (Sample Size = 40) | |||
|---|---|---|---|---|---|
| Parameters | Mean | SD | Mean | SD | p-Value |
| Cycle Duration [s] | 1.12 | 0.13 | 1.10 | 0.11 | 0.532 |
| Stance Duration [s] | 0.68 | 0.09 | 0.66 | 0.07 | 0.279 |
| Swing duration [s] | 0.43 | 0.04 | 0.44 | 0.04 | 0.738 |
| Swing Duration Variability [s] | 0.03 | 0.02 | 0.04 | 0.06 | 0.382 |
| Stance Phase [%] | 61.14 | 1.87 | 60.04 | 2.29 | 0.020 * |
| Swing Phase [%] | 38.88 | 1.87 | 39.52 | 1.85 | 0.128 |
| Single Support Phase [%] | 38.89 | 1.87 | 39.36 | 2.61 | 0.353 |
| Double Support Phase [%] | 11.47 | 3.15 | 10.25 | 1.71 | 0.034 * |
| Mean velocity [m/s] | 0.97 | 0.18 | 1.05 | 0.16 | 0.037 * |
| Mean velocity [%height/s] | 58.28 | 10.95 | 62.48 | 9.56 | 0.072 |
| Cadence [steps/min] | 108.91 | 11.62 | 108.83 | 12.15 | 0.976 |
| Cycle Length [m] | 1.06 | 0.15 | 1.15 | 0.15 | 0.007 ** |
| Cycle Length [%height] | 64.01 | 9.97 | 68.66 | 7.79 | 0.023 * |
| Step Length [m] | 0.48 | 0.12 | 0.55 | 0.10 | 0.009 ** |
| Step Length Variability [m] | 0.25 | 0.49 | 0.15 | 0.37 | 0.289 |
| Step Width [m] | 0.09 | 0.05 | 0.09 | 0.04 | 0.536 |
| MOT TASK | PD-MCI (N = 40) | PD-NO MCI (N = 40) | |||
| Cycle Duration [s] | 1.09 | 0.13 | 1.08 | 0.12 | 0.754 |
| Stance Duration [s] | 0.67 | 0.10 | 0.65 | 0.08 | 0.340 |
| Swing duration [s] | 0.45 | 0.17 | 0.43 | 0.05 | 0.567 |
| Swing Duration Variability [s] | 0.03 | 0.02 | 0.03 | 0.02 | 0.568 |
| Stance Phase [%] | 61.45 | 2.34 | 60.37 | 1.74 | 0.018 * |
| Swing Phase [%] | 38.54 | 2.34 | 39.74 | 1.63 | 0.010 * |
| Single Support Phase [%] | 38.53 | 2.31 | 39.80 | 1.75 | 0.007 ** |
| Double Support Phase [%] | 12.11 | 2.75 | 11.38 | 3.21 | 0.276 |
| Mean velocity [m/s] | 0.95 | 0.20 | 1.04 | 0.17 | 0.045 * |
| Mean velocity [%height/s] | 57.30 | 11.58 | 61.77 | 9.63 | 0.064 |
| Cadence [steps/min] | 110.98 | 11.49 | 111.95 | 11.76 | 0.710 |
| Cycle Length [m] | 1.02 | 0.17 | 1.11 | 0.17 | 0.017 * |
| Cycle Length [%height] | 61.75 | 10.59 | 66.39 | 9.10 | 0.039 * |
| Step Length [m] | 0.48 | 0.11 | 0.54 | 0.09 | 0.008 ** |
| Step Length Variability [m] | 0.19 | 0.50 | 0.08 | 0.15 | 0.193 |
| Step Width [m] | 0.09 | 0.05 | 0.09 | 0.04 | 0.876 |
| COG TASK | PD-MCI (N = 40) | PD-NO MCI (N = 40) | |||
| Cycle Duration [s] | 1.20 | 0.20 | 1.15 | 0.14 | 0.122 |
| Stance Duration [s] | 0.76 | 0.15 | 0.70 | 0.09 | 0.040 * |
| Swing duration [s] | 0.45 | 0.06 | 0.44 | 0.05 | 0.647 |
| Swing Duration Variability [s] | 0.05 | 0.05 | 0.03 | 0.02 | 0.071 |
| Stance Phase [%] | 63.07 | 2.51 | 61.36 | 2.17 | 0.002 ** |
| Swing Phase [%] | 37.91 | 5.07 | 38.58 | 2.18 | 0.447 |
| Single Support Phase [%] | 37.25 | 2.58 | 38.27 | 2.92 | 0.101 |
| Double Support Phase [%] | 14.09 | 3.90 | 11.73 | 1.96 | 0.001 ** |
| Mean velocity [m/s] | 0.79 | 0.19 | 0.95 | 0.17 | 0.000 *** |
| Mean velocity [%height/s] | 48.29 | 11.71 | 56.70 | 10.53 | 0.001 ** |
| Cadence [steps/min] | 102.16 | 14.50 | 106.33 | 12.77 | 0.175 |
| Cycle Length [m] | 0.93 | 0.18 | 1.07 | 0.15 | 0.000 *** |
| Cycle Length [%height] | 56.74 | 12.37 | 63.74 | 8.43 | 0.004 ** |
| Step Length [m] | 0.42 | 0.11 | 0.52 | 0.10 | 0.000 *** |
| Step Length Variability [m] | 0.28 | 0.45 | 0.08 | 0.22 | 0.015 * |
| Step Width [m] | 0.10 | 0.06 | 0.11 | 0.12 | 0.636 |
| Task GAIT | Task MOT | Task COG | |||||
|---|---|---|---|---|---|---|---|
| Evaluation Metrics | Dataset | RF | KNN | RF | DT | RF | SVM |
| AUCROC | Internal | 0.557 | 0.616 | 0.623 | 0.658 | 0.500 | 0.784 |
| External | 0.555 | 0.720 | 0.655 | 0.680 | 0.518 | 0.773 | |
| Accuracy | Internal | 55.0 | 61.7 | 63.3 | 63.3 | 70.0 | 73.3 |
| External | 65.0 | 57.1 | 70.0 | 61.9 | 71.4 | 66.7 | |
| Sensitivity | Internal | 54.8 | 67.7 | 61.3 | 51.6 | 74.2 | 71.0 |
| External | 90.0 | 70.0 | 80.0 | 50.0 | 70.0 | 60.0 | |
| Specificity | Internal | 58.6 | 58.6 | 65.5 | 75.9 | 65.5 | 75.9 |
| External | 40.0 | 45.5 | 60.0 | 72.7 | 72.7 | 72.7 | |
| Precision | Internal | 57.1 | 62.5 | 65.5 | 69.6 | 69.7 | 75.9 |
| External | 60.0 | 53.8 | 66.7 | 62.5 | 70.0 | 66.7 | |
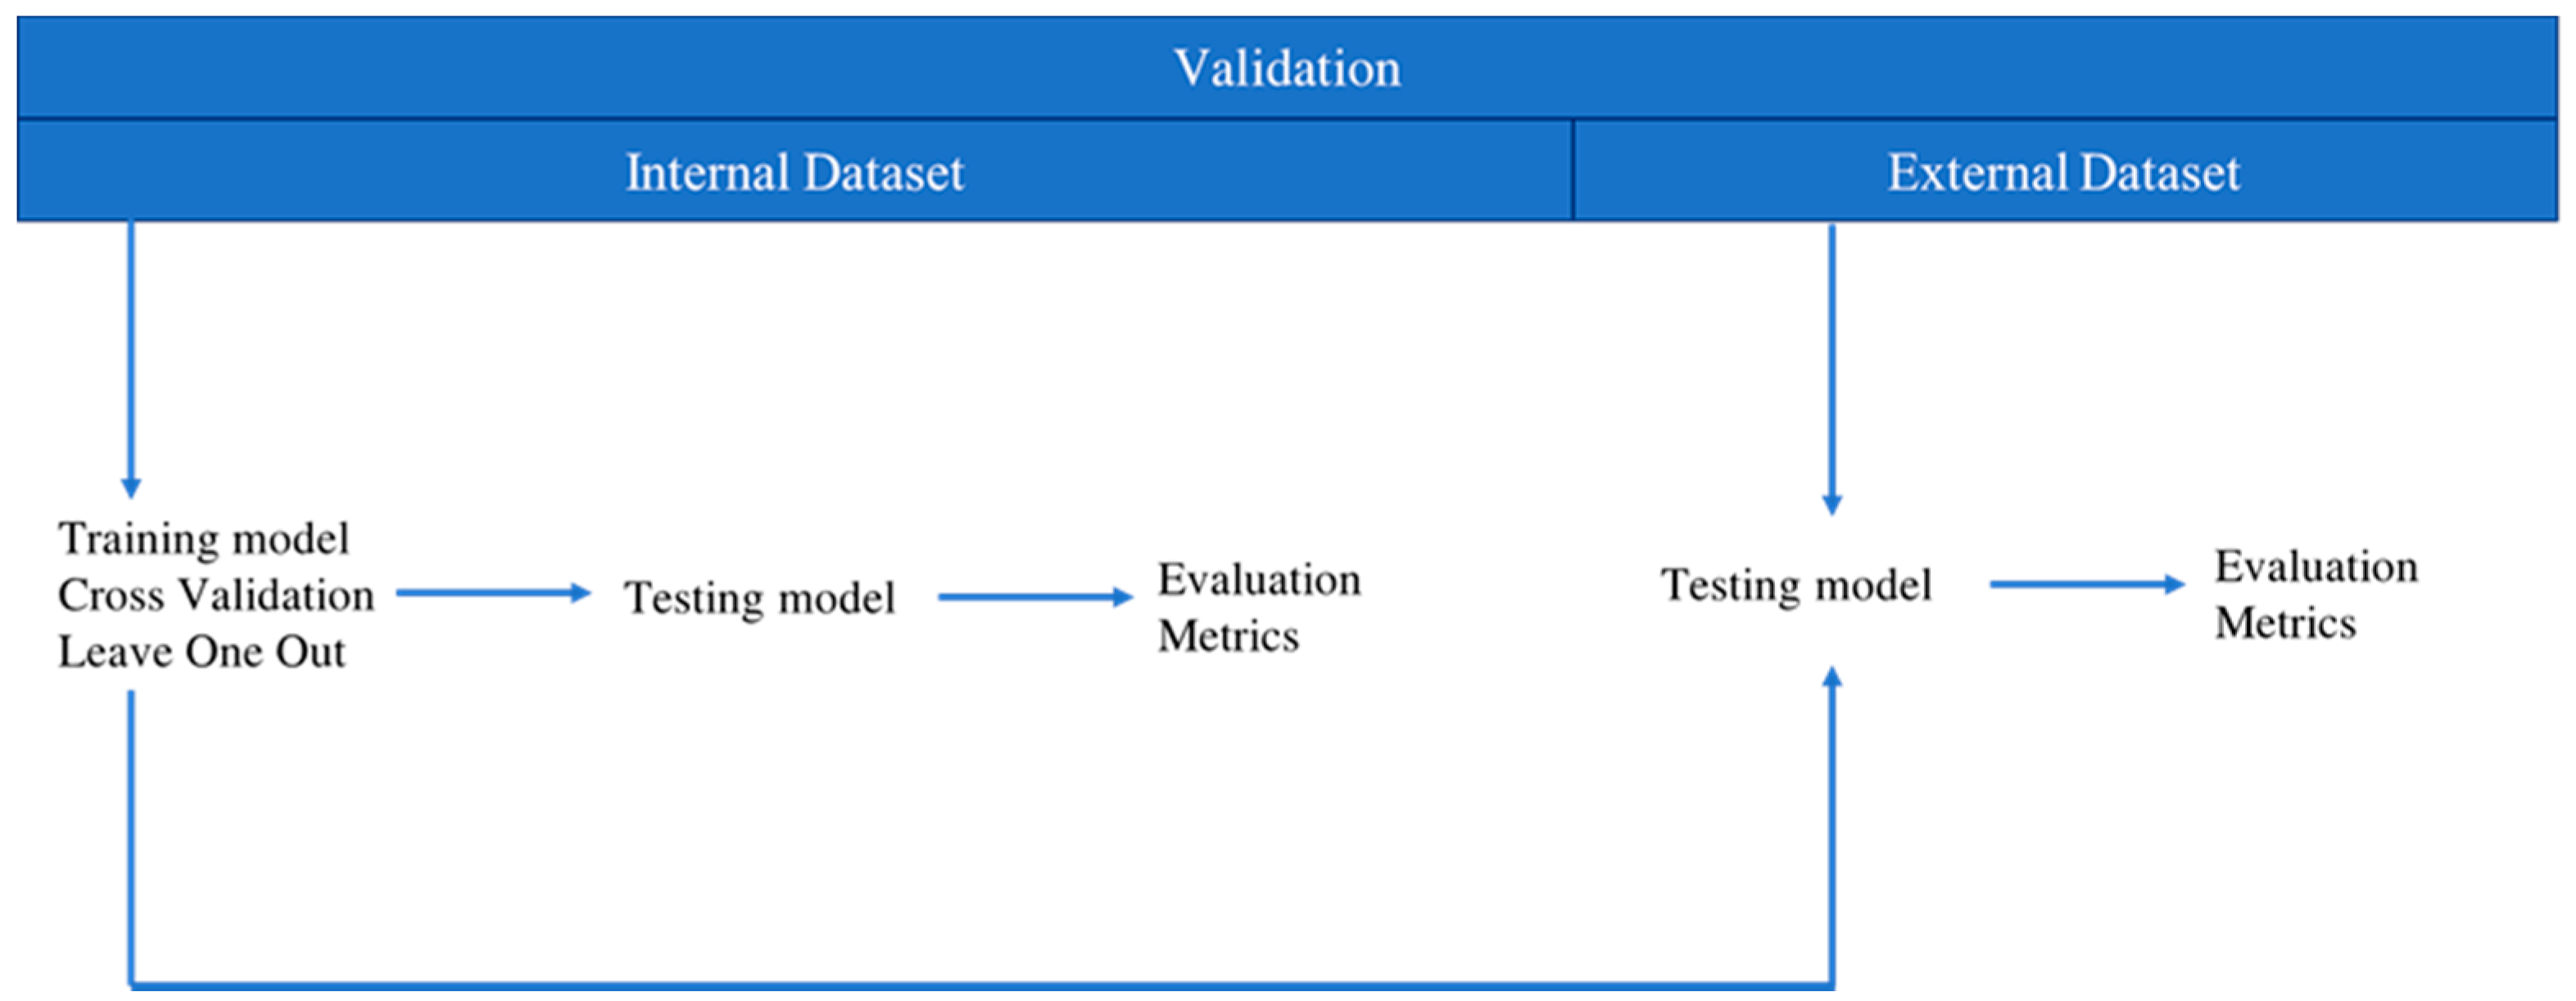
| Classifier | Features Selection | Internal Dataset Accuracy | External Dataset | ||
|---|---|---|---|---|---|
| Accuracy | Sensitivity | Specificity | |||
| DT | g_Swing Duration g_Swing Duration Variability c_Step Length Variability | 67.7 (43.7–3.7) | 79.1 (57.4–90.1) | 70.0 (39.7–89.2) | 90.0 (59.6–98.2) |
| RF | g_Step Length g_ Step Width c_ Step Length c_ Step Width | 72.3 (49.1–85.7) | 81.0 (60.0–92.3) | 60.0 (31.3–83.2) | 100.0 (72.3–100) |
| NB | g_Cadence m_Swing Duration Variability c_Stance Phase c_ Cycle Length c_Step Length c_Step Length Variability | 2.3 (49.1–85.7) | 85.7 (65.4–95.0) | 70.1 (39.7–89.2) | 100.0 (72.3–100) |
| SVM | m_Mean Velocity c_ Mean Velocity | 77.8 (54.8–91.0) | 81.0 (60.0–92.3) | 70.0 (39.7–89.2) | 90.0 (59.6–98.2) |
| KNN | m_Swing Duration Variability c_ Cycle Length | 61.2 (38.6–79.7) | 81.0 (60.0–92.3) | 80.0 (49.0–94.3) | 80.0 (49.0–94.3) |
Disclaimer/Publisher’s Note: The statements, opinions and data contained in all publications are solely those of the individual author(s) and contributor(s) and not of MDPI and/or the editor(s). MDPI and/or the editor(s) disclaim responsibility for any injury to people or property resulting from any ideas, methods, instructions or products referred to in the content. |
© 2023 by the authors. Licensee MDPI, Basel, Switzerland. This article is an open access article distributed under the terms and conditions of the Creative Commons Attribution (CC BY) license (https://creativecommons.org/licenses/by/4.0/).
Share and Cite
Russo, M.; Amboni, M.; Barone, P.; Pellecchia, M.T.; Romano, M.; Ricciardi, C.; Amato, F. Identification of a Gait Pattern for Detecting Mild Cognitive Impairment in Parkinson’s Disease. Sensors 2023, 23, 1985. https://doi.org/10.3390/s23041985
Russo M, Amboni M, Barone P, Pellecchia MT, Romano M, Ricciardi C, Amato F. Identification of a Gait Pattern for Detecting Mild Cognitive Impairment in Parkinson’s Disease. Sensors. 2023; 23(4):1985. https://doi.org/10.3390/s23041985
Chicago/Turabian StyleRusso, Michela, Marianna Amboni, Paolo Barone, Maria Teresa Pellecchia, Maria Romano, Carlo Ricciardi, and Francesco Amato. 2023. "Identification of a Gait Pattern for Detecting Mild Cognitive Impairment in Parkinson’s Disease" Sensors 23, no. 4: 1985. https://doi.org/10.3390/s23041985