
An Improved CatBoost-Based Classification Model for Ecological Suitability of Blueberries

Abstract
:1. Introduction
- The classification model created a dataset with features containing only a single dimension and a sample of largely unbalanced data, so it fails to reflect multi-dimensionality.
- Existing studies have used machine learning or artificial intelligence approaches to create a universal model for blueberry suitability classification, but the specificity of the model has led to more significant differences in the accuracy of blueberry suitability classification when the model is applied under different conditions.
- Some factors in the development of blueberry crops can lead to changes in other elements under combined constraints. Current studies failed to consider this issue, resulting in simplistic model structures, long training time, and strong subjectivity.
- It analyzed the applicability of different machine learning algorithms to classify blueberry ecological suitability. It surmounted the drawbacks of traditional machine learning models with simple structure and strong subjectivity. Additionally, the most suitable model for blueberry ecological suitability classification was identified.
- Considering the constraints of comprehensive environmental factors on blueberry growth, the influence of some feature data on blueberry ecological suitability classification results were compared, which further confirms the applicability of the model.
- The influence of different optimization algorithms (particle swarm optimization (PSO), whale optimization algorithm (WOA), and sparrow search algorithm (SSA)) on the parameters of classification models were explored to resolve the challenge of the long model training time and to improve the accuracy of classification results.
2. Materials and Methods
2.1. Borderline-SMOTE Algorithms
- (1)
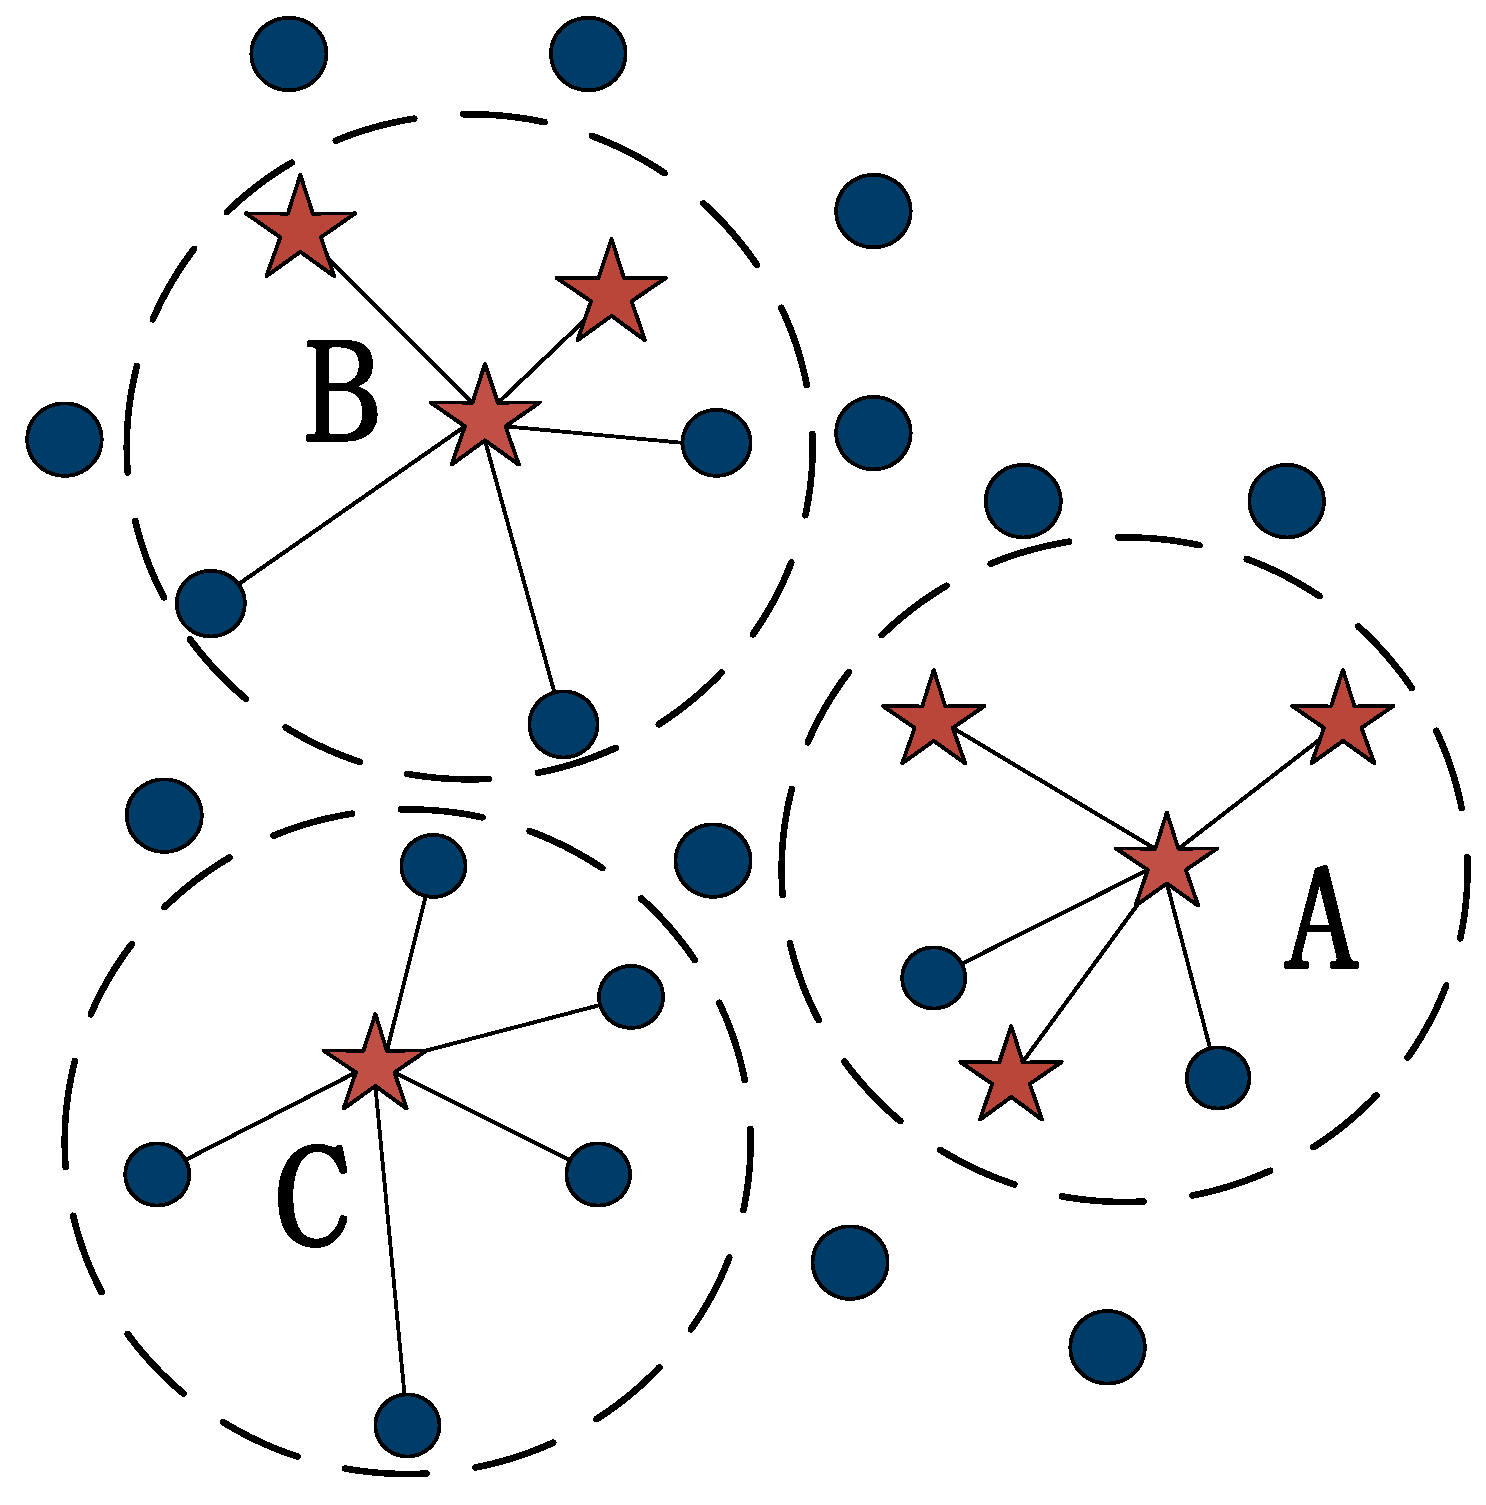
- According to the Euclidean distance, the minority category samples are divided into three categories: safe, danger, and noise; safe represents the nearest neighbors more than the ordinary for the minority category; danger refers to the nearest neighbors more than half for the majority category samples; noise is the nearest neighbors all for the majority category samples, in turn, as marked by A, B, and C in Figure 2.
- (2)
- A sampling ratio was set according to the imbalance rate, a sampling multiple was determined, and for each sample of a danger minority class, a number of samples were randomly drawn from its nearest neighbor samples.
- (3)
- For each randomly selected nearest neighbor sample, a synthetic sample is obtained by the synthetic formula.

2.2. CatBoost Algorithm
2.3. Sparrow Search Algorithm
3. Study Area and Data
3.1. Study Area
3.2. Data Source
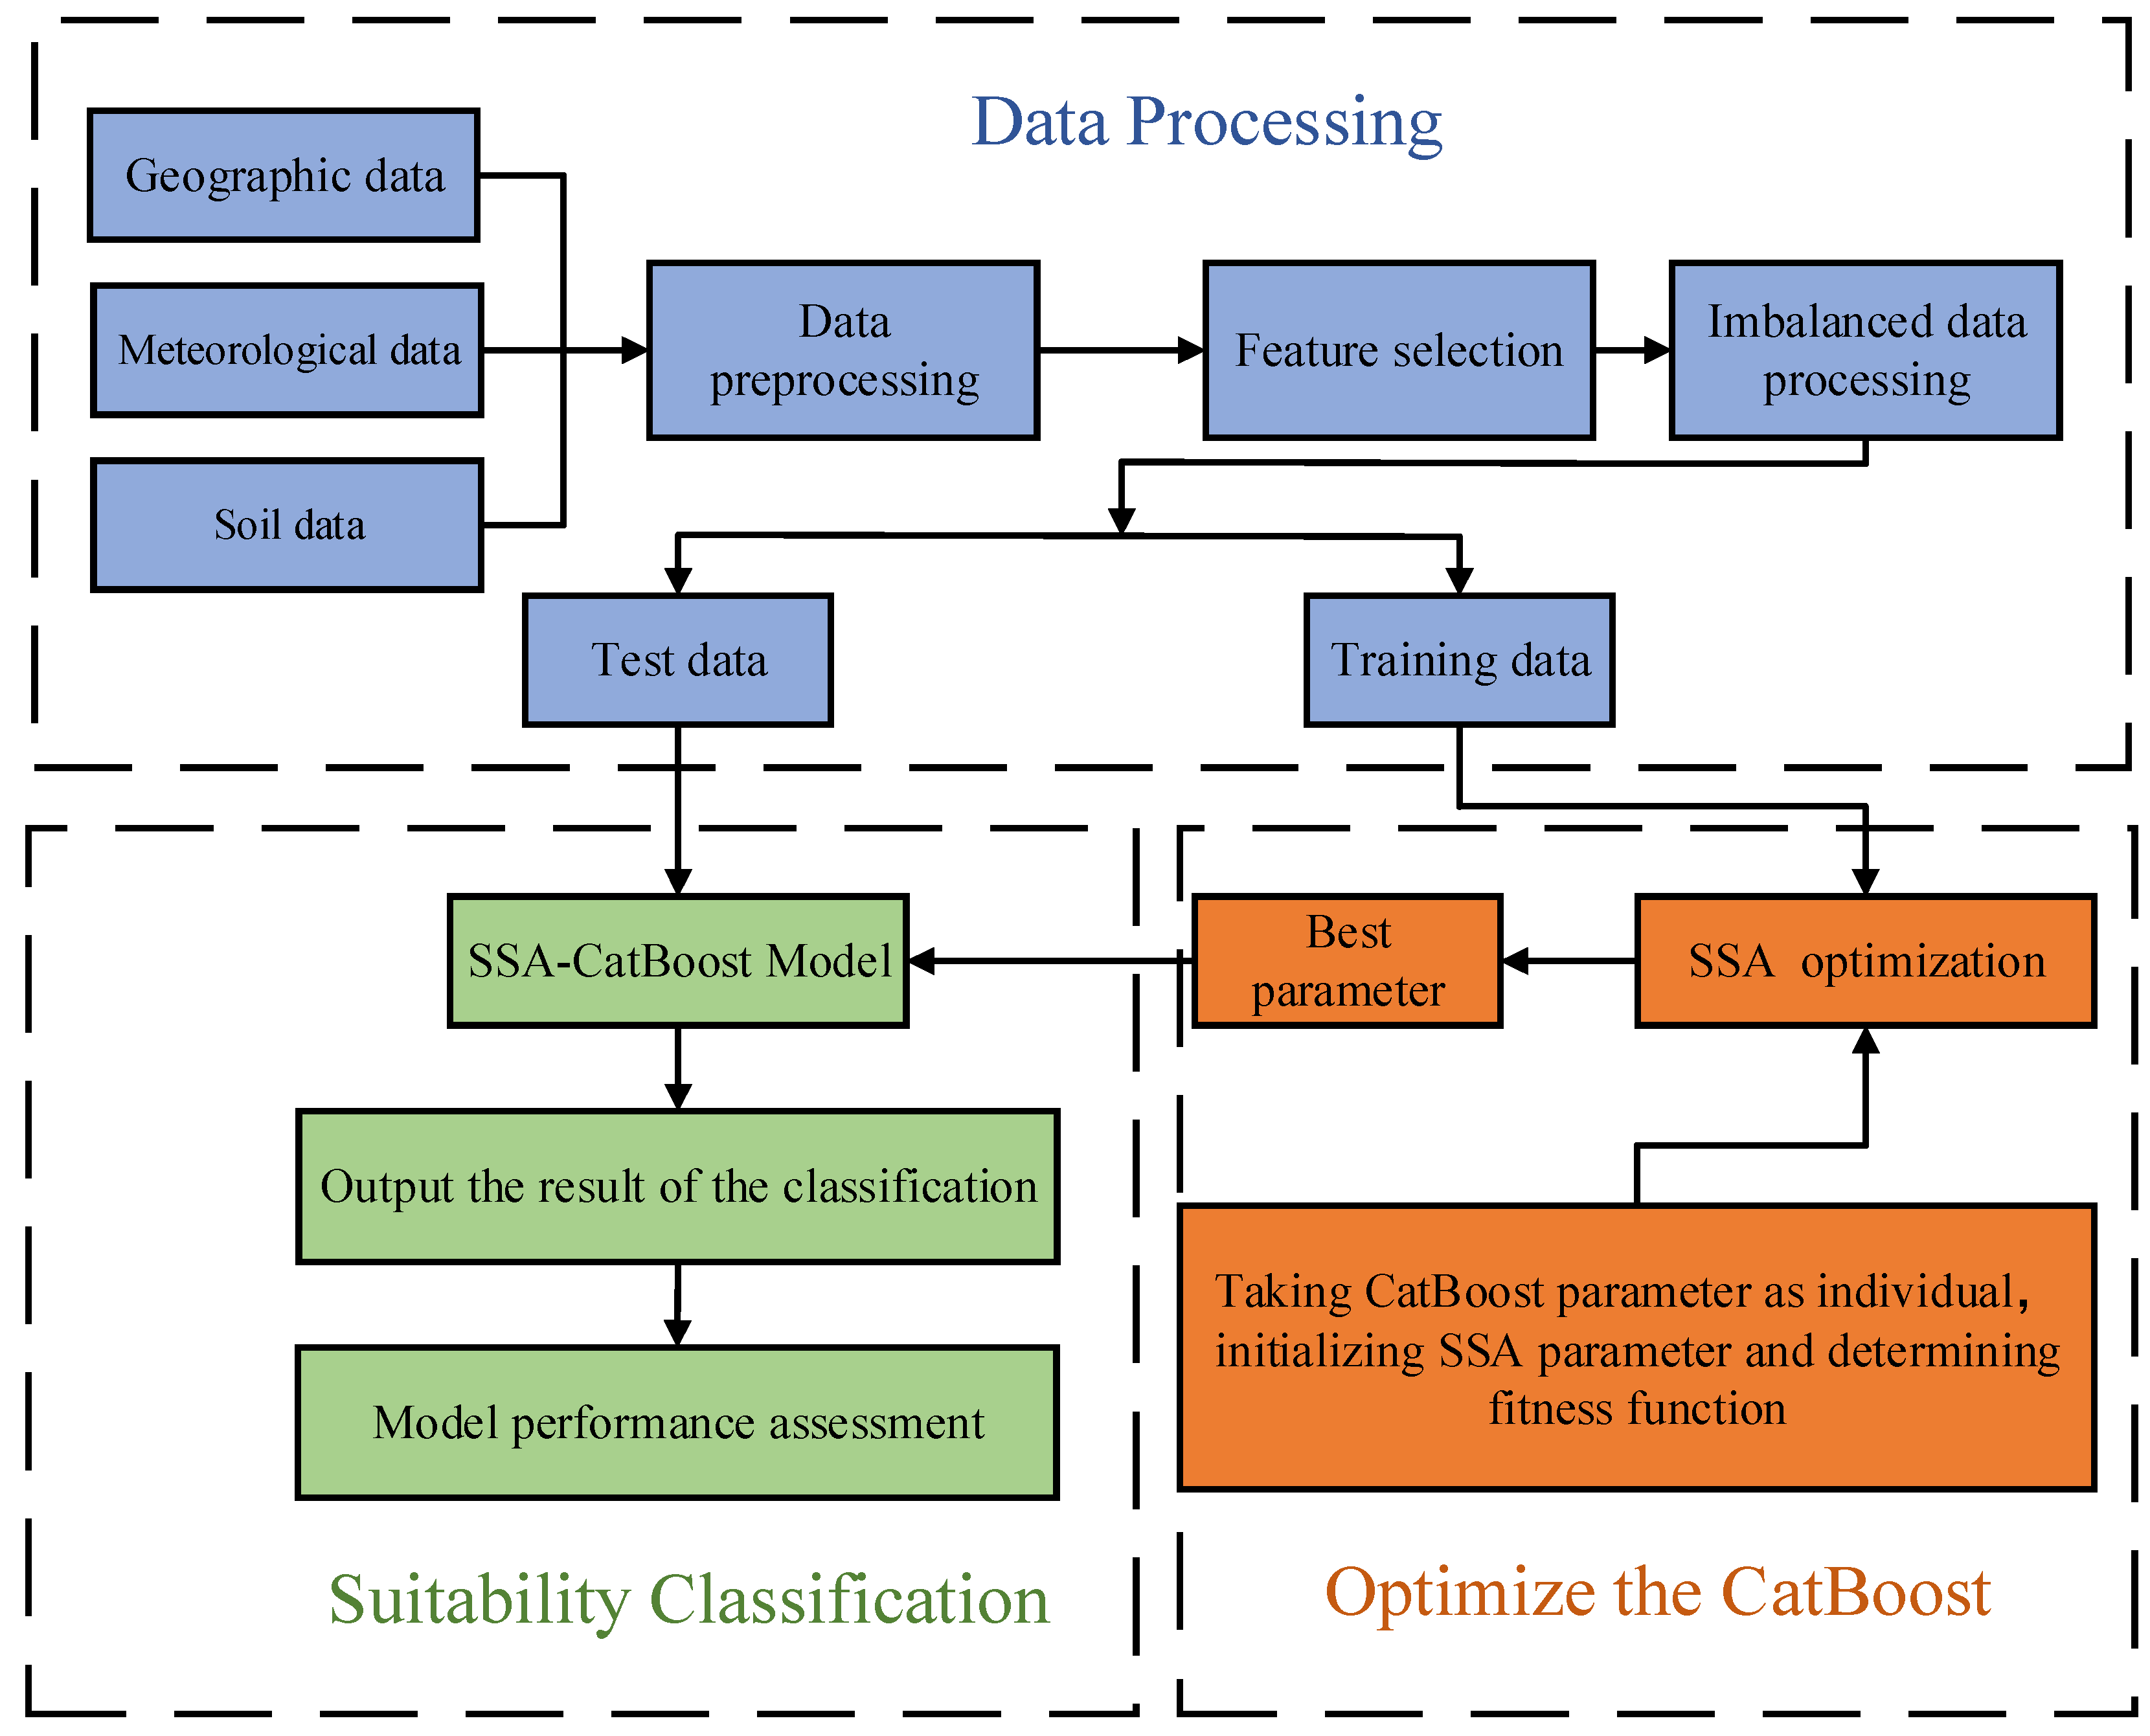
4. Modeling Process
4.1. Overall Framework
4.2. Data Pre-Processing and Feature Selection
4.2.1. Data Pre-Processing
- Removal of duplicate data.
- Filling of missing values, adopting the mean for continuous features and the plural for categorical features.
- Data Bucketing, bucketing, and label encoding for continuous features according to the data distribution by quantile, and direct label coding of categorical features. The specific coding method can be seen in Table 3.

| Number | Features | Coded Instructions |
|---|---|---|
| 1 | Elevation (m) | ➀ <593; ➁ 593–816; ➂ 817–974; ➃ 975–1130; ➄ 1131–1328; ➅ 1329–1811; ➆ >1812 |
| 2 | Slope (°) | ➀ <10; ➁ 11–25; ➂ 25–35; ➃ 35–50; ➄ >50 |
| 3 | Slope aspect | ➀ Flat; ➁ North; ➂ North-east; ➃ East; ➄ Southeast; ➅ South; ➆ South-west; ➇ West; ➈ North-west |
| 4 | NDVI | ➀ <3.5; ➁ 3.5–5.5; ➂ 5.5–9; ➃ >9 |
| 5 | Monthly precipitation | ➀ <50; ➁ 50–100; ➂ 100–170; ➃ 170–260; ➄ 260–300; ➅ >300 |
| 6 | Monthly average temperature (°C) | ➀ <0; ➁ 0–8; ➂ 8–15; ➃ 15–24; ➄ 24–30; ➅ >30 |
| 7 | 10 °C cumulative temperature (d·°C) | ➀ <3000; ➁ 3000–4200; ➂ 4200–5500; ➃ >5500 |
| 8 | Illumination Intensity (Lux) | ➀ <1600; ➁ 1600–3200; ➂ 3200–4500; ➃ 4500–7000; ➄ 7000–10,000; ➅ >10,000 |
| 9 | Soil pH | ➀ <3.5; ➁ 3.5–4.5; ➂ 4.5–5.5; ➃ 5.5–7.1; ➄ >7.1 |
| 10 | Soil organic carbon content (g/kg) | ➀ <2; ➁ 2–4; ➂ 4–6; ➃ 6–8; ➄ >8 |
4.2.2. Feature Selection
4.3. Imbalanced Data Processing
5. Results
5.1. Experimental Environment and Evaluation Metrics
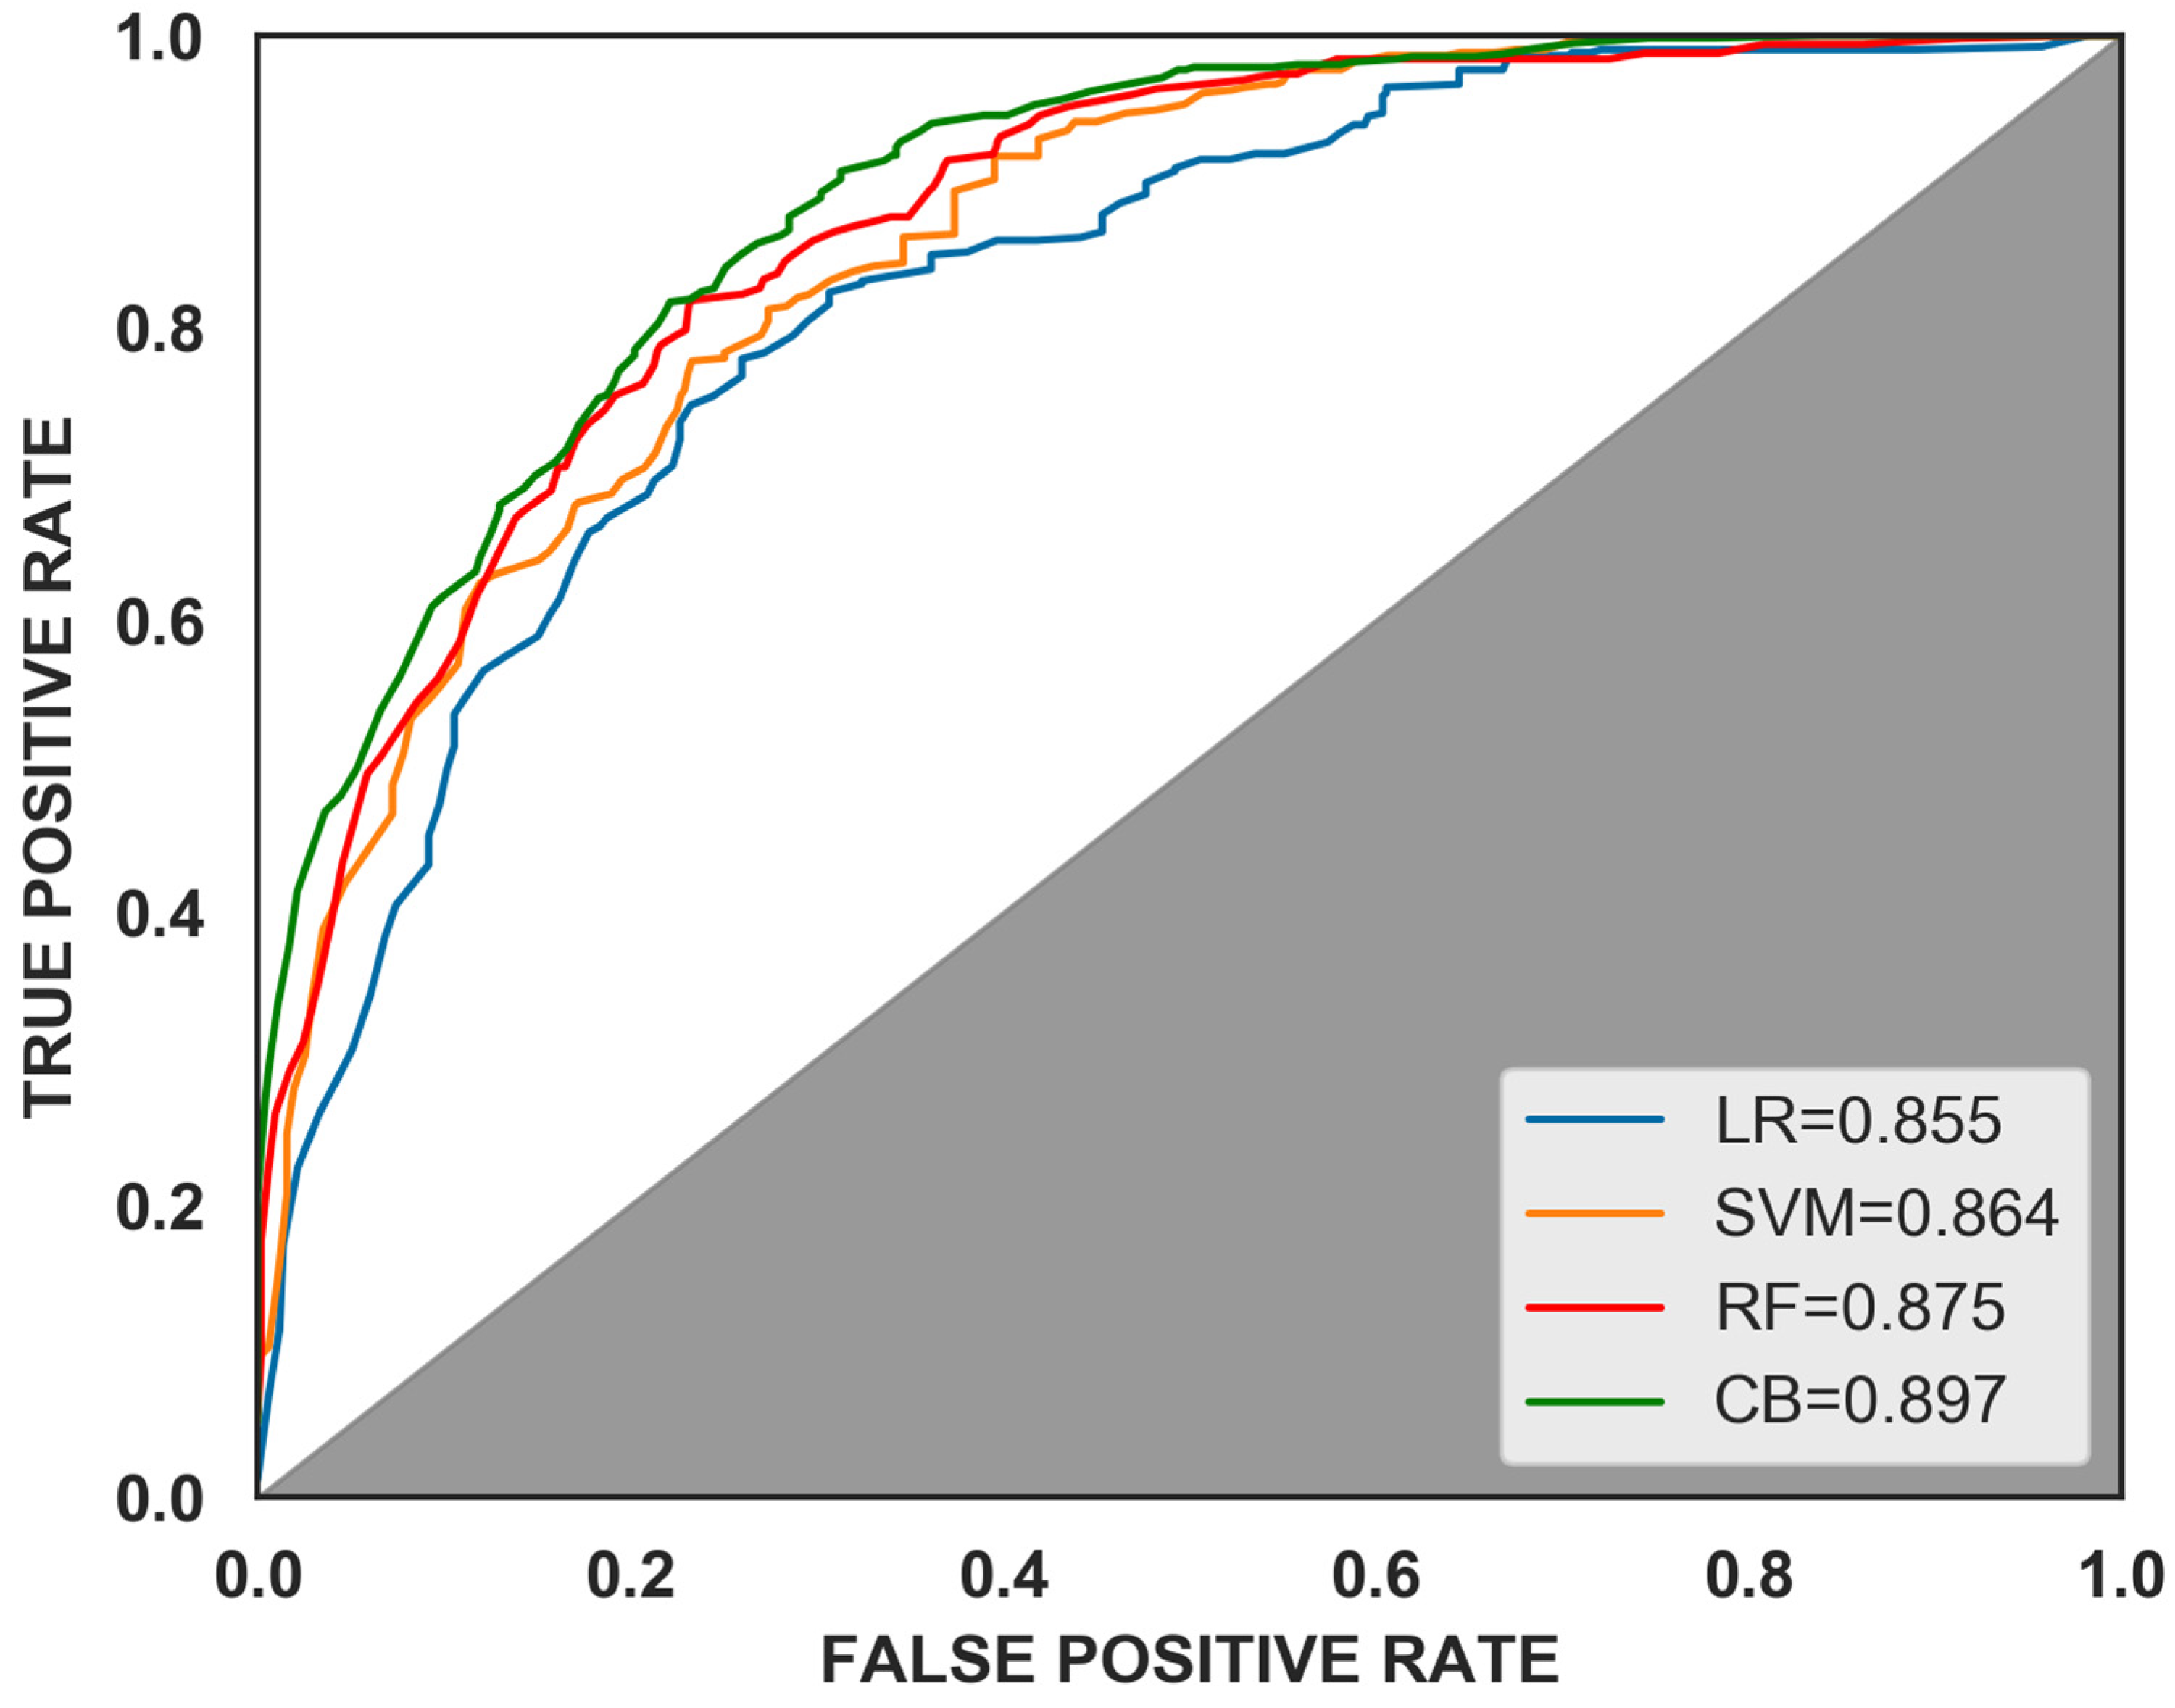
5.2. Model Comparison
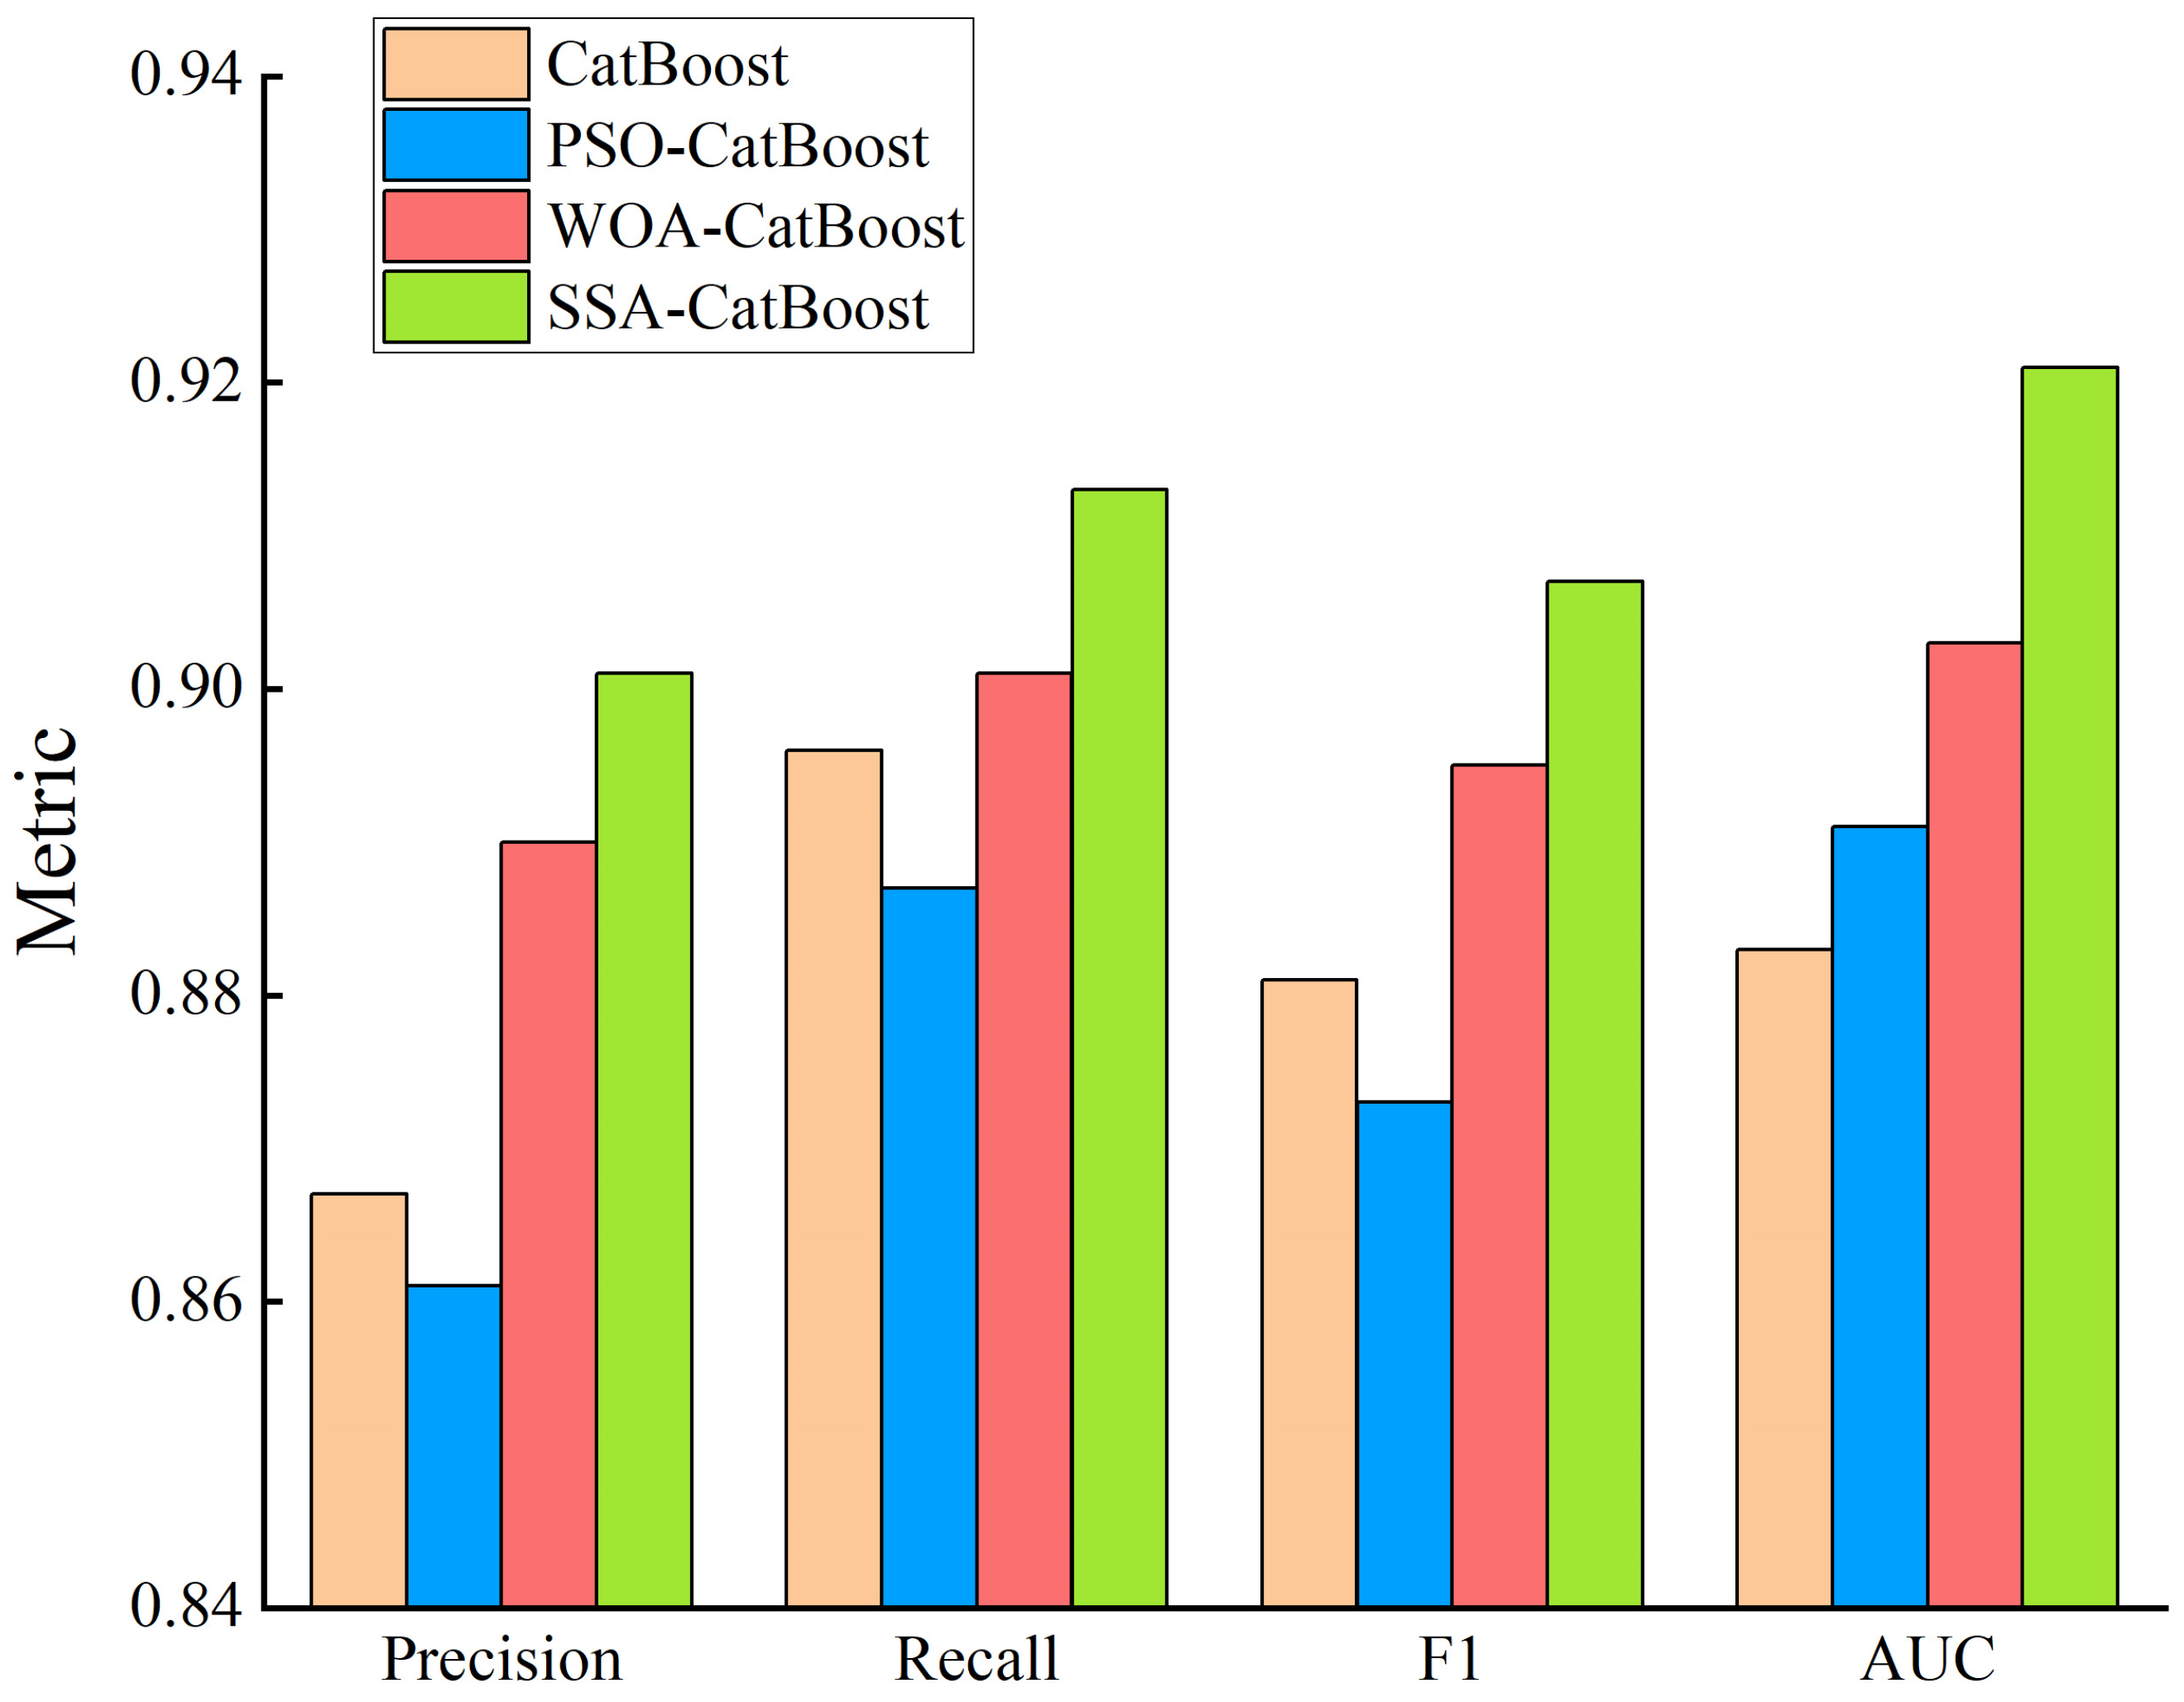
5.3. Model Optimization
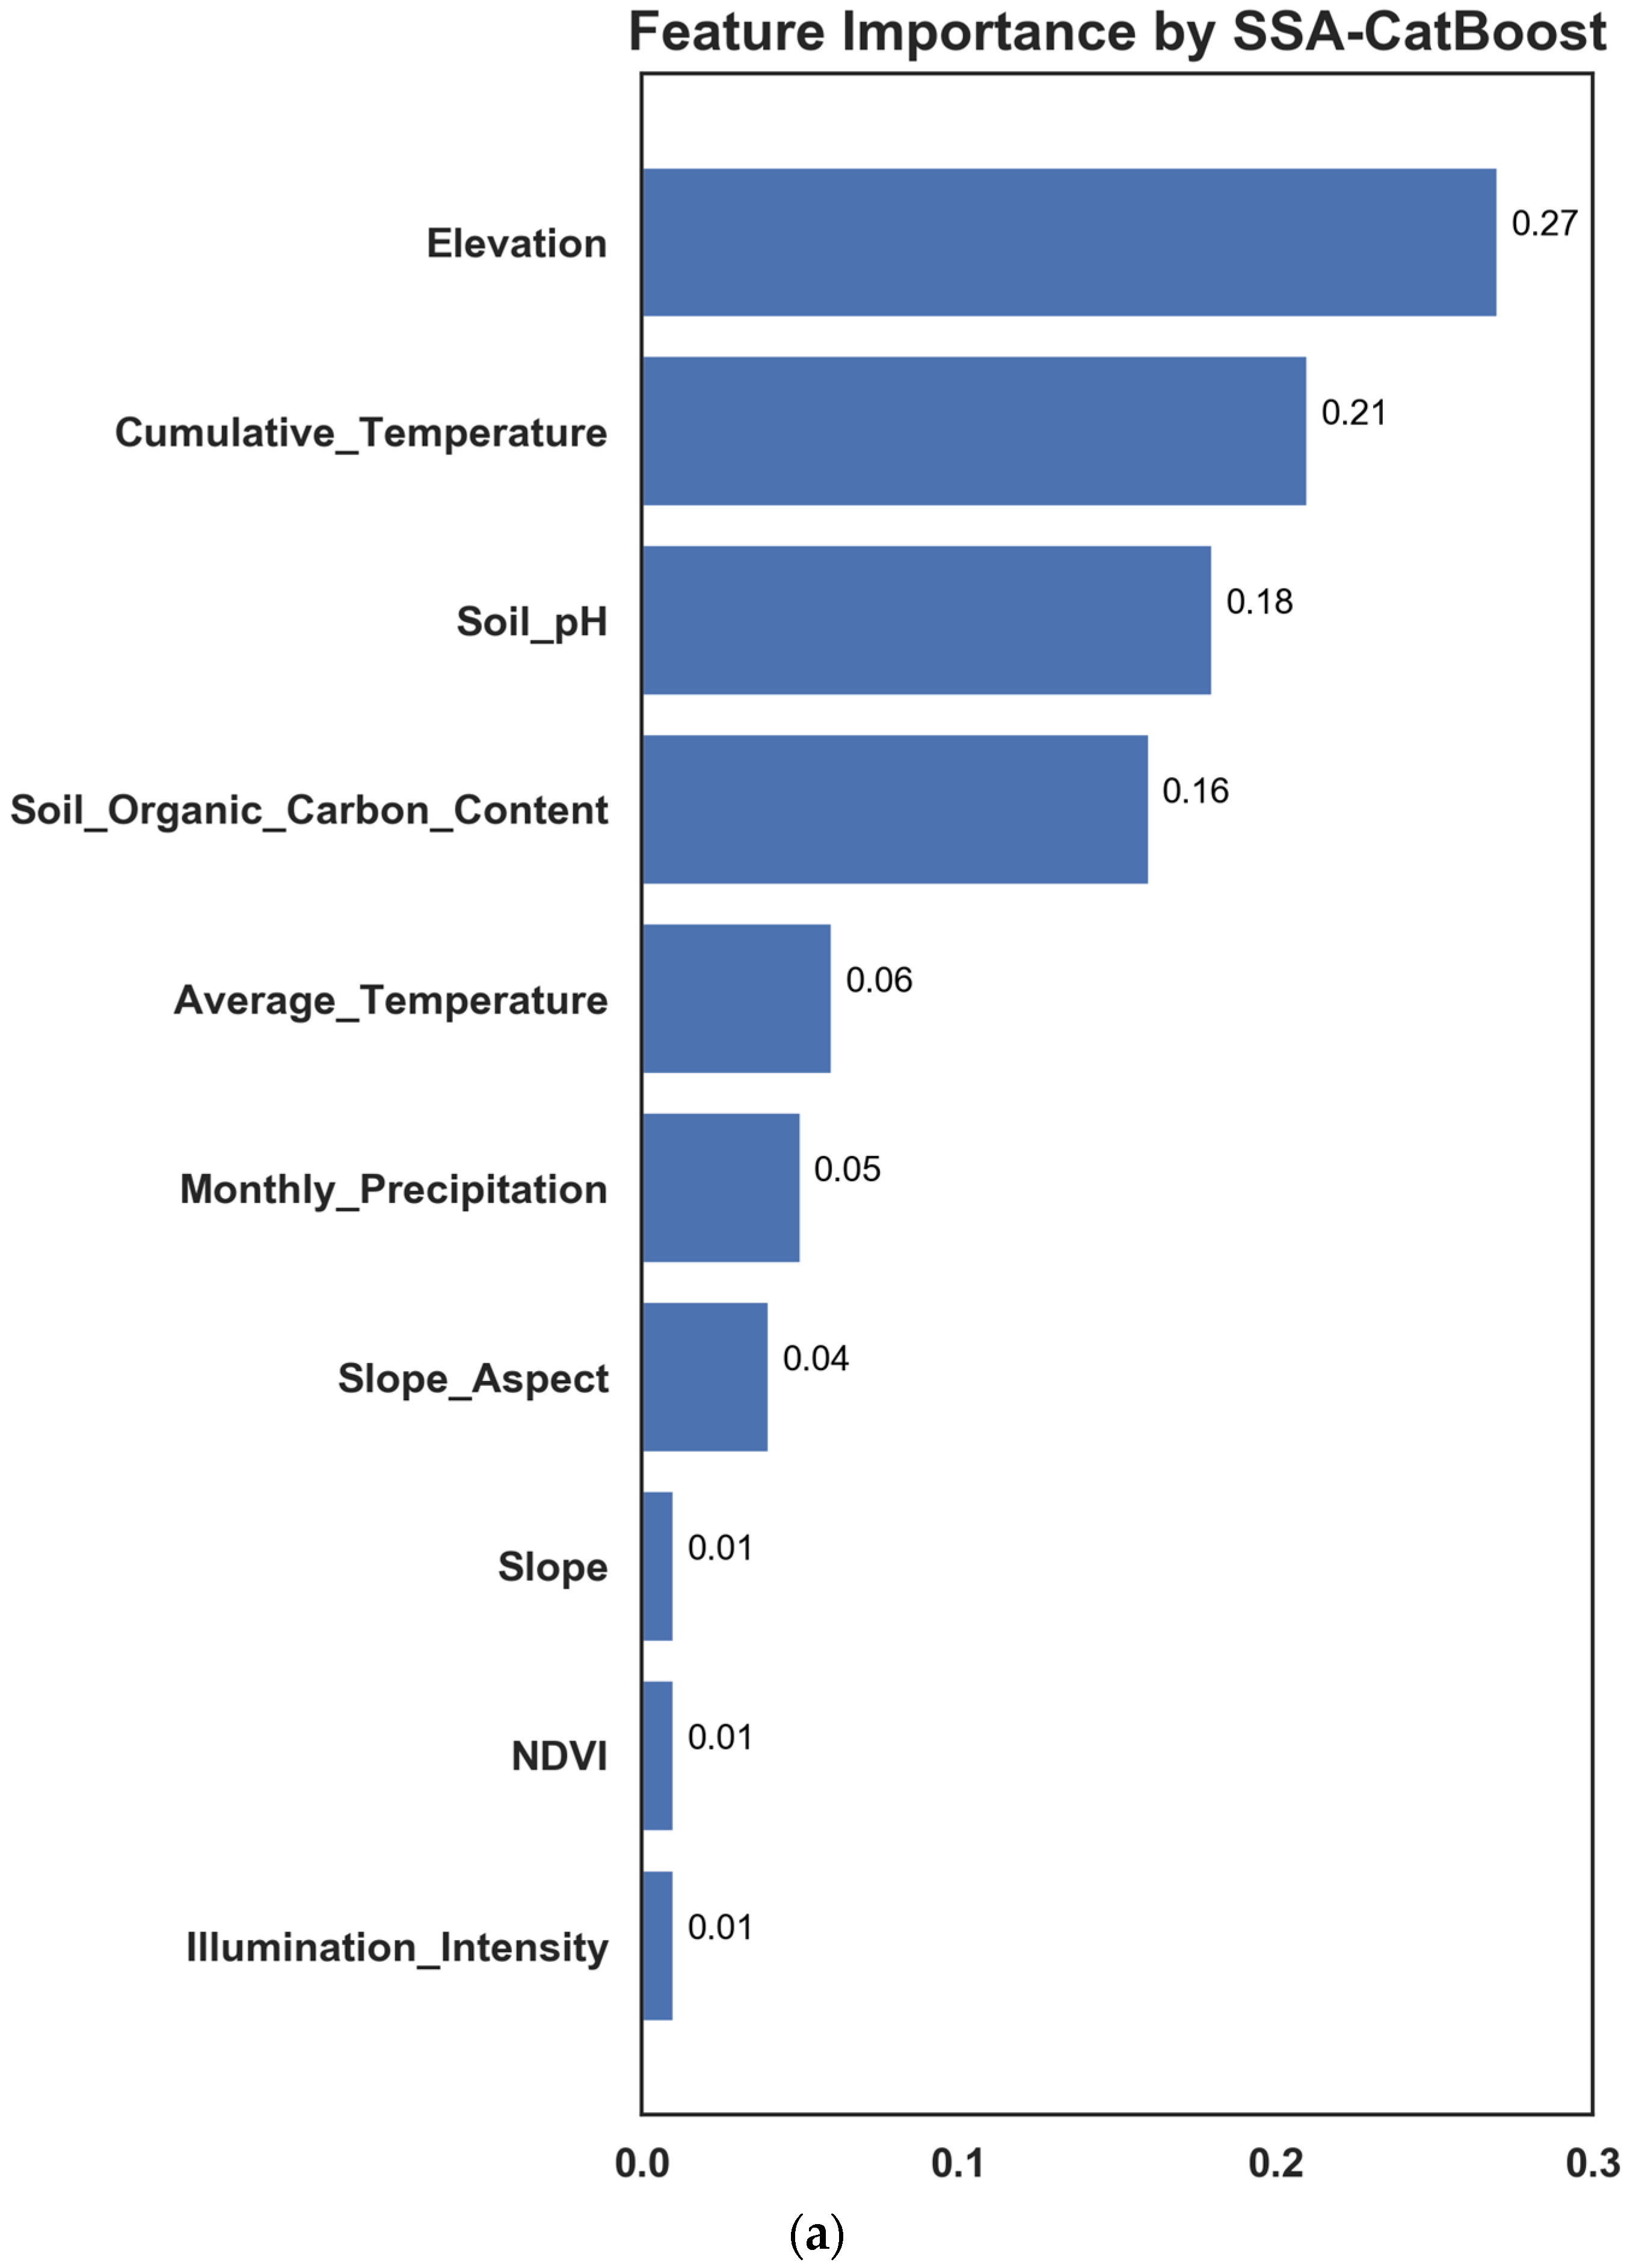
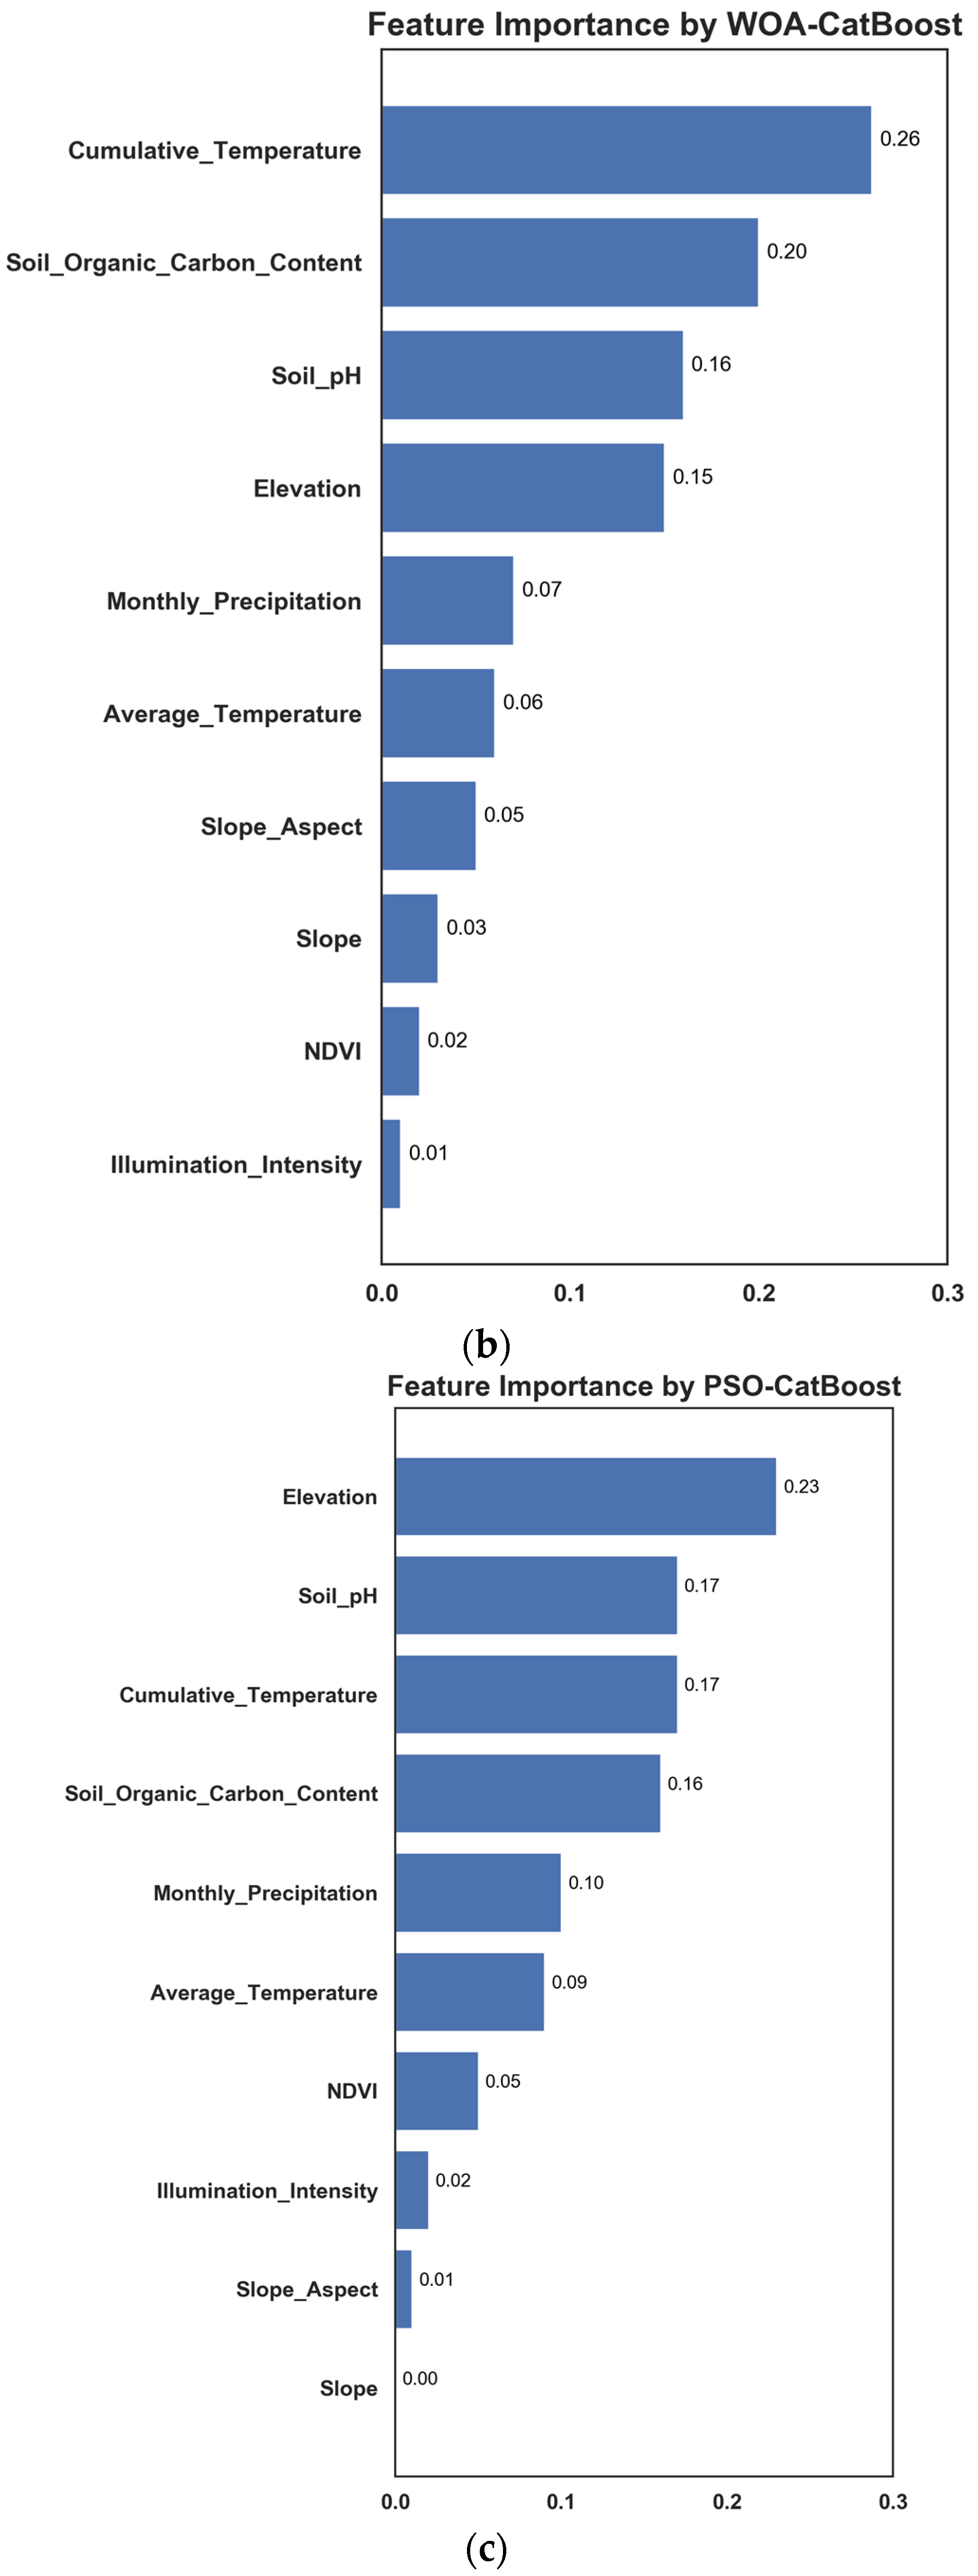
5.4. Feature Importance Analysis
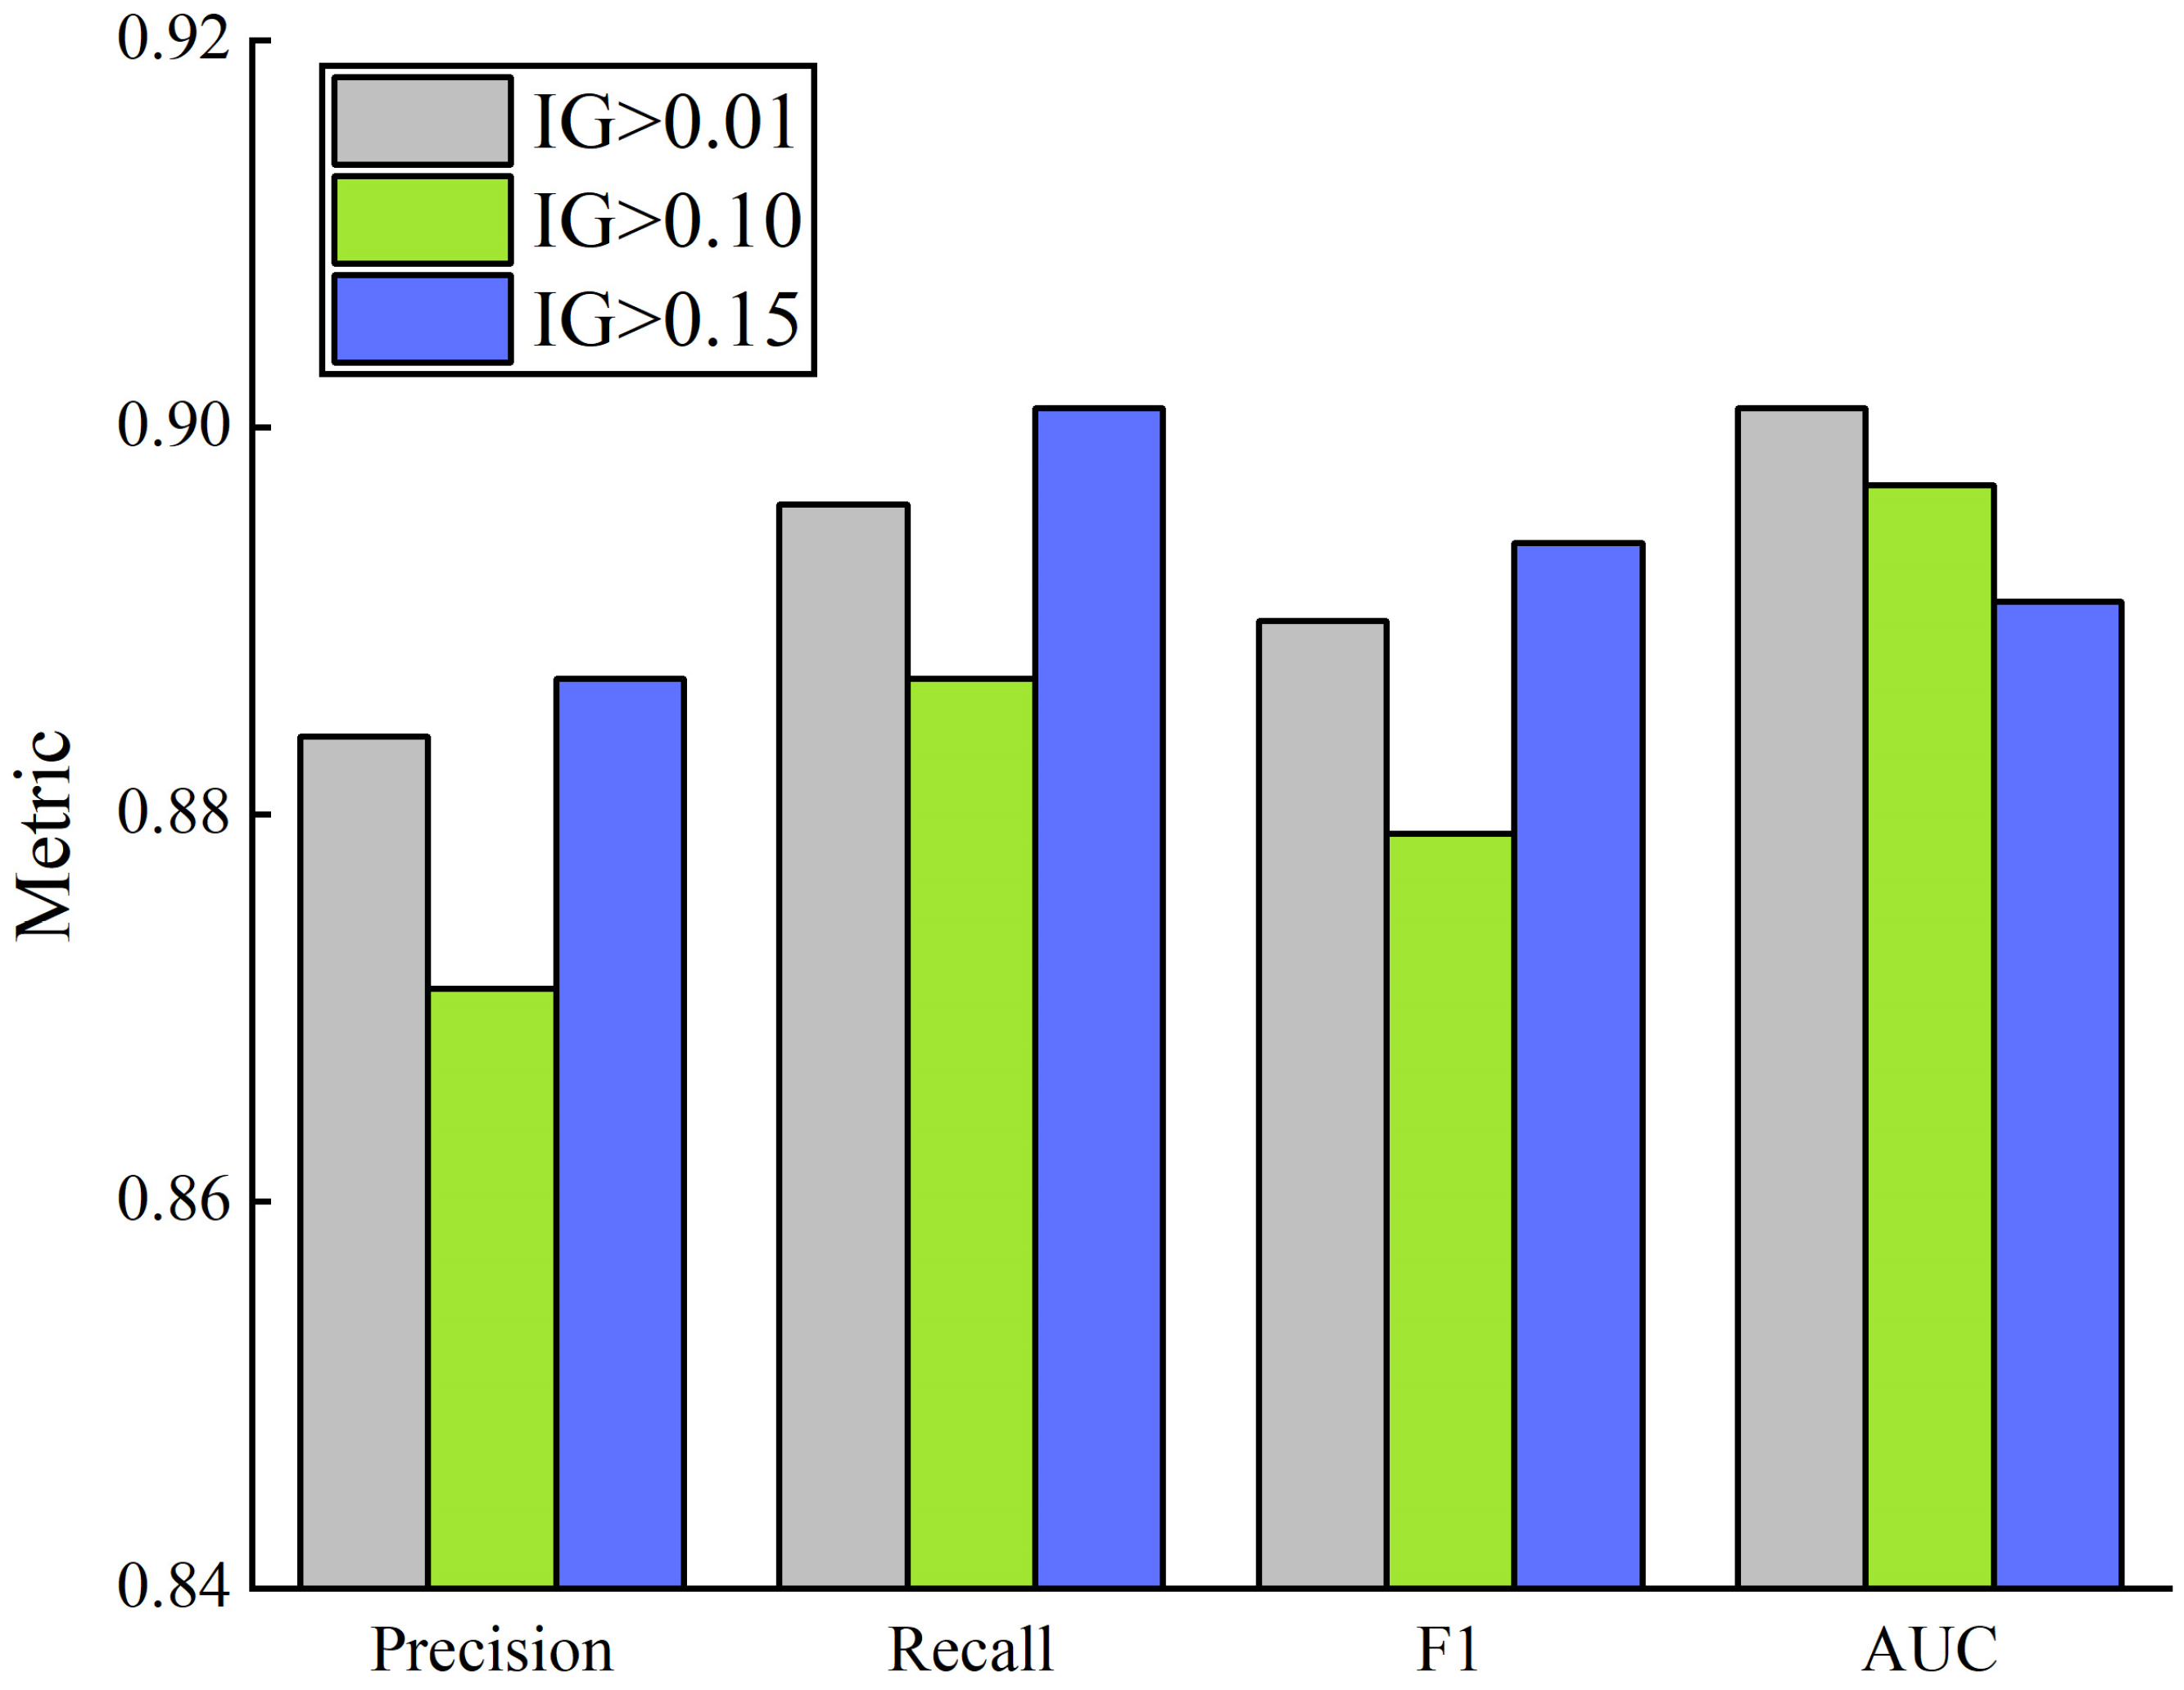
5.5. Analysis of the Effect of Different Inputs on the Model
5.6. Mapping the Ecological Suitability of Blueberries
6. Discussion
6.1. Main Findings
6.2. Model Performance
6.3. Main Features
6.4. Model Inputs
6.5. Model Advantages
7. Conclusions
Supplementary Materials
Author Contributions
Funding
Data Availability Statement
Conflicts of Interest
References
- Romo, M.; Dote, P.; Garrido, H.; Araneda, F.; GilJ, M. Blueberry consumption and healthy lifestyles in an emerging market. Span. J. Agric. Res. 2020, 17, 4. [Google Scholar]
- Strik, B. Organic Blueberry Production Systems—Advances in Research and Industry. In Proceedings of the 10th International Symposium on Vaccinium and Other Superfruits, Maastricht, The Netherlands, 17–22 June 2012. [Google Scholar]
- Kim, J.; Yun, H. Current status and prospects of blueberry genomics research. J. Plant Biochem. Biotechnol. 2015, 42, 336–341. [Google Scholar] [CrossRef]
- Guo, X.; Shi, G.Q.; Wu, Q.C. The current situation of the whole industry chain development of blueberry in Guizhou Province and suggestions for countermeasures. China Fruits 2022, 09, 93–97. [Google Scholar]
- Li, Y.D.; Pei, J.B.; Chen, L. 2020 Annual report on China’s blueberry industry. J. Jilin Agric. Univ. 2021, 43, 1–8. [Google Scholar]
- Ma, L.J.; Du, E.W.; Hu, X.L. Ideas and measures for the construction of organic agriculture wisdom system in Majiang County. Guizhou Agric. Sci. 2018, 46, 139–142. [Google Scholar]
- Zhang, L. Study on climate quality evaluation criteria for blueberries. Stand. Sci. 2022, 04, 103–108. [Google Scholar]
- Mo, J.G.; Yu, F.; Zhang, S.H. Research on the effect of meteorological conditions on blueberry quality. Chin. Agric. Sci. Bull. 2016, 32, 170–175. [Google Scholar]
- Zhang, S.; Gu, X.P.; Mo, J.G. GIS-based ecological suitability zoning of blueberries in Guizhou. Guizhou Agric. Sci. 2014, 42, 255–257. [Google Scholar]
- Xiao, X.Z.; Liu, J.M.; Sun, C.F. Climate suitability zoning for blueberry cultivation in Fujian Province. Chin. J. Agrometeorol. 2020, 41, 520–528. [Google Scholar]
- Qin, G.W.; Lin, H.H.; Zhang, J. GIS-based potential suitable areas for blueberry cultivation in Shaanxi Province. J. China Agric. Univ. 2019, 24, 53–63. [Google Scholar]
- Vera, L.; Montalba, R.; Vieli, L.; Jorquera, E.; Gonzalez, I. Methodology for determining the suitability of land for the cultivation of highbush blueberry: A case study on a farm in southern Chile. Cienc. Investig. Agrar. 2015, 42, 353–364. [Google Scholar] [CrossRef]
- Cui, J.L.; Wei, H.Y.; Sang, M.J. Prediction of potential distribution area of blueberry based on maximum entropy model. Shandong Agric. Sci. 2015, 47, 36–41+45. [Google Scholar]
- Condran, S.; Bewong, M.; Islam, M.Z.; Maphosa, L.; Zheng, L.h. Machine Learning in Precision Agriculture: A Survey on Trends, Applications and Evaluations Over Two Decades. IEEE Access 2022, 10, 73786–73803. [Google Scholar] [CrossRef]
- Shaikh, T.A.; Rasool, T.; Lone, F.R. Towards leveraging the role of machine learning and artificial intelligence in precision agriculture and smart farming. Comput. Electron. Agr. 2022, 198, 107119. [Google Scholar] [CrossRef]
- Rashid, M.; Bari, B.S.; Yusup, Y.; Kamaruddin, M.A.; Khan, N. A Comprehensive Review of Crop Yield Prediction Using Machine Learning Approaches with Special Emphasis on Palm Oil Yield Prediction. IEEE Access 2021, 9, 63406–63439. [Google Scholar] [CrossRef]
- Zhai, Z.Y.; Cao, Y.F.; Xu, H.L. A review of key technologies for crop pest and disease identification. Trans. Chin. Soc. Agric. 2021, 52, 1–18. [Google Scholar]
- Taghizadeh, R.; Nabiollahi, K.; Rasoli, L.; Kerry, R.; Scholten, T. Land Suitability Assessment and Agricultural Production Sustainability Using Machine Learning Models. Agronomy 2020, 10, 573. [Google Scholar] [CrossRef]
- Poongodi, S.; Babu, M.R. Analysis of crop suitability using clustering technique in Coimbatore region of Tamil Nadu. Concurr. Comput.-Pract. Exp. 2021, 31, 109–115. [Google Scholar] [CrossRef]
- Rivera, W.A.; Xanthopoulos, P. A priori synthetic over-sampling methods for increasing classification sensitivity in imbalanced data sets. Expert Syst. Appl. 2016, 66, 124–135. [Google Scholar] [CrossRef]
- Gao, Q.J.; Jin, X.; Xia, E.H.; Wu, X.W. Identification of Orphan Genes in Unbalanced Datasets Based on Ensemble Learning. Front. Genet. 2020, 11, 820. [Google Scholar] [CrossRef]
- Lee, T.J.; Kim, M.J.; Kim, S.P. Improvement of P300-Based Brain-Computer Interfaces for Home Appliances Control by Data Balancing Techniques. Sensors 2020, 20, 5576. [Google Scholar] [CrossRef] [PubMed]
- Hancock, J.T.; Khoshgoftaar, T.M. CatBoost for big data: An interdisciplinary review. J. Big Data 2020, 7, 94. [Google Scholar] [CrossRef] [PubMed]
- Zhang, H.; Chen, L.; Wei, Z.Q. Abnormal Traffic Detection Technology Based on Data Augmentation and Model Update. Netinfo Secur. 2020, 20, 66–74. [Google Scholar]
- Bentejac, C.; Csorgo, A.; Martinez, M.G. A comparative analysis of gradient boosting algorithms. Artif. Intell. Rev. 2021, 54, 1937–1967. [Google Scholar] [CrossRef]
- Wang, G.J.; Wang, X.H.; Wang, Z.X.; Ma, C.R.; Song, Z.X. A VMD-CISSA-LSSVM Based Electricity Load Forecasting Model. Mathematics 2022, 10, 28. [Google Scholar] [CrossRef]
- Yan, S.Q.; Yang, P.; Zhu, D.L.; Zheng, W.X.L.; Wu, F.X.; Yang, P.; Zhu, D.; Zheng, W.; Wu, F. Improved Sparrow Search Algorithm Based on Iterative Local Search. Comput. Intell. Neurosci. 2022, 2021, 6860503. [Google Scholar]
- Luo, X.; Lin, F.K.; Zhu, S.; Yu, M.L. Mine landslide susceptibility assessment using IVM, ANN and SVM models considering the contribution of affecting factors. PLoS ONE 2019, 14, e0215134. [Google Scholar] [CrossRef]
- Bancha, A.; Chen, Y.; Chen, V.C.P.; Kim, S.B. Data mining for state space orthogonalization in adaptive dynamic programming. Expert Syst. Appl. 2017, 76, 46–58. [Google Scholar]
- Wu, G.; Xu, J. Optimized Approach of Feature Selection based on Information Gain. In Proceedings of the International Conference on Computer Science and Mechanical Automation, Hangzhou, China, 23–25 October 2015. [Google Scholar]
- Xiao, L.X.; Wen, C.; Yan, F.S. Over-sampling algorithm for imbalanced data classification. J. Syst. Eng. Electron. 2019, 30, 1182–1191. [Google Scholar]
- Douzas, G.; Douzas, G.; Fonseca, J.; Khudinyan, M. Imbalanced Learning in Land Cover Classification: Improving Minority Classes’ Prediction Accuracy Using the Geometric SMOTE Algorithm. Remote Sens. 2019, 11, 3040. [Google Scholar] [CrossRef]
- Li, K.; Ren, B.Y.; Guan, T.; Wang, J.J. A hybrid cluster-borderline SMOTE method for imbalanced data of rock groutability classification. Bull. Eng. Geol. Environ. 2021, 81, 39. [Google Scholar] [CrossRef]
- Sun, Y.; Que, H.K.; Cai, Q.Q.; Zhao, J.M. Borderline SMOTE Algorithm and Feature Selection-Based Network Anomalies Detection Strategy. Energies 2022, 15, 4751. [Google Scholar] [CrossRef]
- Dev, V.A.; Eden, M.R. Gradient boosted decision trees for lithology classification. Comput. Aided Chem. Eng. 2019, 47, 113–118. [Google Scholar]
- Rodrigo, Z.V.; Christopher, T.R.; Jim, H.; Stuart, J.C. Machine Learning to Predict Outcomes and Cost by Phase of Care After Coronary Artery Bypass Grafting. Ann. Thorac. Surg. 2022, 114, 711–719. [Google Scholar]
- Lin, R.T.; Chan, K.C.G.; Shi, H.L. A unified Bayesian framework for exact inference of area under the receiver operating characteristic curve. Stat. Methods Med. Res. 2021, 30, 2269–2287. [Google Scholar] [CrossRef]
- Barah, M.; Mehrotra, S. Predicting Kidney Discard Using Machine Learning. Transplantation 2021, 105, 2057–2071. [Google Scholar] [CrossRef] [PubMed]
- Bao, F.; Bambil, D. Applicability of computer vision in seed identification: Deep learning, random forest, and support vector machine classification algorithms. Acta Bot. Bras. 2021, 35, 17–21. [Google Scholar] [CrossRef]
- Koklu, M.; Sarigil, S.; Ozbek, O. The use of machine learning methods in classification of pumpkin seeds (Cucurbita pepo L.). Genet. Resour. Crop Evol. 2021, 38, 2713–2726. [Google Scholar] [CrossRef]
- Zhang, M.; Chen, W.; Zhang, Y.; Liu, F. Fault Diagnosis of Oil-Immersed Power Transformer Based on Difference-Mutation Brain Storm Optimized Catboost Model. IEEE Access 2022, 9, 168767–168782. [Google Scholar] [CrossRef]
- Cai, Y.Y.; Amit, S. Swarm Intelligence Optimization: An Exploration and Application of Machine Learning Technology. J. Intell. Syst. 2021, 30, 460–469. [Google Scholar] [CrossRef]
- Qiu, Y.G.; Zhou, J.; Khandelwal, M.; Yang, H.T. Performance evaluation of hybrid WOA-XGBoost, GWO-XGBoost and BO-XGBoost models to predict blast-induced ground vibration. Eng. Comput. 2021, 38, 4145–4162. [Google Scholar] [CrossRef]
- Nguyen, H.; Moayedi, H.; Foong, L.K. Optimizing ANN models with PSO for predicting short building seismic response. Eng. Comput. 2020, 36, 823–837. [Google Scholar] [CrossRef]
- Gao, B.W.; Shen, W.; Guan, H.; Zheng, L.T. Research on Multistrategy Improved Evolutionary Sparrow Search Algorithm and its Application. IEEE Access 2022, 10, 62520–62534. [Google Scholar] [CrossRef]
- Yuan, J.; Zeng, X.; Wu, H.; Zhang, W.; Zhou, J. Analytical determination of interwell connectivity based on interwell influence. Tsinghua Sci. Technol. 2021, 26, 813–820. [Google Scholar] [CrossRef]
- Majhi, S.K. Fuzzy clustering algorithm based on modified whale optimization algorithm for automobile insurance fraud detection. Evol. Intell. 2019, 14, 35–46. [Google Scholar] [CrossRef]
- Zhang, M.; Chen, W.; Yin, J.; Feng, T. Health Factor Extraction of Lithium-Ion Batteries Based on Discrete Wavelet Transform and SOH Prediction Based on CatBoost. Energies 2022, 15, 5331. [Google Scholar] [CrossRef]
- Qin, Y.; Wu, J.; Xiao, W.; Wang, K.; Huang, A.; Liu, B.; Yu, J.; Li, C.; Yu, F.; Ren, Z. Machine Learning Models for Data-Driven Prediction of Diabetes by Lifestyle Type. Int. J. Environ. Res. Public Health 2022, 19, 15027. [Google Scholar] [CrossRef]
- Zhang, C.Y.; Chen, X.F.; Wang, S.; Hu, J.J.; Wang, C.P.; Liu, X. Using CatBoost algorithm to identify middle-aged and elderly depression, national health and nutrition examination survey 2011–2018. Psychiatry Res. 2021, 306, 114261. [Google Scholar] [CrossRef] [PubMed]
- Wang, B.W.; Lin, Q.G.; Jiang, T.; Yin, H.X.; Zhou, J.; Sun, J.H.; Wang, D.F. Evaluation of linear, nonlinear and ensemble machine learning models for landslide susceptibility assessment in southwest China. Geocarto Int. 2022, 10, 4016. [Google Scholar] [CrossRef]


| Data Type | Data Source | Years |
|---|---|---|
| Geographic data | Geospatial data (http://www.gscloud.cn, accessed on 3 May 2022) | 2021 |
| Meteorological data | Meteorological Bureau of Guizhou Province (http://gz.cma.gov.cn, accessed on 3 May 2022) | 2018 |
| Soil data | Soil Science Database (http://vdb3.soil.csdb.cn, accessed on 3 May 2022) | 2018 |
| Number | Elevation (m) | Slope (°) | Slope Aspect | NDVI | Monthly Average Temperature (°C) | 10 °C Cumulative Temperature (d·°C) | Illumination Intensity (Lux) | Soil pH | Soil Organic Carbon Content (g/kg) | Quality of Blueberries |
|---|---|---|---|---|---|---|---|---|---|---|
| 1 | 756 | 27 | North-east | 3.7 | 20.7 | 3666 | 4913 | 4.8 | 5.1 | High |
| 2 | 1350 | 18 | West | 10.1 | 10.3 | 5431 | 11,254 | 6.8 | 1.7 | Low |
| 3 | 689 | 17 | Flat | 2.7 | 13.9 | 3875 | 7964 | 4.6 | 3.6 | High |
| 4 | 901 | 18 | Flat | 4.1 | 14.3 | 4233 | 6582 | 4.6 | 2.0 | High |
| 5 | 1465 | 25 | North | 11.0 | 11.7 | 2981 | 8974 | 6.9 | 3.8 | Low |
| 6 | 1227 | 15 | North | 6.1 | 10.1 | 5513 | 7512 | 5.7 | 3.6 | Low |
| 7 | 1228 | 9 | Flat | 2.9 | 11.9 | 4192 | 12,641 | 5.7 | 4.1 | Low |
| 8 | 1090 | 7 | South-east | 5.4 | 12.1 | 3112 | 3347 | 5.6 | 1.7 | Low |
| 9 | 717 | 11 | East | 7.3 | 21.4 | 3751 | 7994 | 4.3 | 3.9 | High |
| 10 | 689 | 26 | Flat | 3.4 | 11.2 | 2983 | 5971 | 4.7 | 5.8 | High |
| 11 | 1210 | 27 | North | 8.5 | 12.8 | 2469 | 11,342 | 5.2 | 5.1 | Low |
| 12 | 631 | 1 | North-east | 5.1 | 24.1 | 4891 | 6034 | 4.2 | 6.7 | High |
| Number | Elevation | Slope | Slope Aspect | NDVI | Monthly Average Temperature | 10 °C Cumulative Temperature | Illumination Intensity | Soil pH | Soil Organic Carbon Content | Ecological Suitability |
|---|---|---|---|---|---|---|---|---|---|---|
| 1 | 2 | 3 | 3 | 2 | 4 | 2 | 4 | 3 | 3 | 1 |
| 2 | 5 | 2 | 8 | 4 | 3 | 3 | 6 | 4 | 1 | 0 |
| 3 | 1 | 1 | 1 | 1 | 3 | 2 | 5 | 3 | 2 | 1 |
| 4 | 3 | 1 | 1 | 2 | 3 | 3 | 4 | 3 | 1 | 1 |
| 5 | 6 | 2 | 2 | 4 | 2 | 1 | 5 | 4 | 2 | 0 |
| 6 | 5 | 2 | 2 | 3 | 3 | 4 | 5 | 4 | 2 | 0 |
| 7 | 5 | 1 | 1 | 1 | 2 | 1 | 6 | 4 | 3 | 0 |
| 8 | 4 | 2 | 5 | 2 | 3 | 2 | 3 | 4 | 1 | 0 |
| 9 | 2 | 2 | 4 | 3 | 4 | 2 | 5 | 2 | 2 | 1 |
| 10 | 1 | 1 | 1 | 1 | 3 | 1 | 4 | 3 | 3 | 1 |
| 11 | 4 | 4 | 2 | 3 | 2 | 1 | 6 | 3 | 3 | 0 |
| 12 | 2 | 2 | 3 | 2 | 4 | 3 | 4 | 2 | 4 | 1 |
| Number | Feature | VIF | IG |
|---|---|---|---|
| 1 | Elevation | 1.948 | 0.266 |
| 2 | Slope | 1.620 | 0.032 |
| 3 | Slope aspect | 1.031 | 0.027 |
| 4 | NDVI | 1.718 | 0.076 |
| 5 | Monthly precipitation | 1.256 | 0.128 |
| 6 | Monthly average temperature | 1.134 | 0.093 |
| 7 | 10 °C cumulative temperature | 1.537 | 0.193 |
| 8 | Illumination intensity | 1.371 | 0.136 |
| 9 | Soil pH | 2.109 | 0.198 |
| 10 | Soil organic carbon content | 1.441 | 0.271 |
| Data | Number of Samples | Positive Samples (Well-Suited) | Negative Samples (Non-Well-Suited) | Number of Features |
|---|---|---|---|---|
| Before processing | 918 | 632 | 286 | 10 |
| After processing | 1106 | 632 | 474 | 10 |
| Model | Main Parameters |
|---|---|
| LR | penality=l2, C=2, l1_ratio=0.3, max_iter=100, solver=‘lbfgs’, class_weight=None, random_state=None |
| SVM | C=8, gamma=0.3, kernel=’rbf’, probability=False, gamma=’Scale’, max_iter=1000, degree=3 |
| RF | n_estimators=80, max_depth=3, min_samples_split=2, min_samples_leaf=5, mini_impurity_decrease=0.4, criterion=‘gini’, boostrap=Ture, oob_score=False, max_leaf_node=None |
| CatBoost | loss_function=’Logloss’, eval_metric=’AUC’, task_type=’CPU’, learning_rate=0.1, iterations=10, depth=6, l2_leaf_reg=10, boosting_type=‘Ordered’, random_seed=‘123’, |
| Model | Evaluation Index | |||
|---|---|---|---|---|
| Precision | Recall | F1-Score | AUC | |
| LR | 0.768 | 0.851 | 0.807 | 0.855 |
| SVM | 0.883 | 0.823 | 0.851 | 0.864 |
| RF | 0.853 | 0.843 | 0.862 | 0.875 |
| CatBoost | 0.891 | 0.874 | 0.882 | 0.897 |
| Model | Training Time/s |
|---|---|
| LR | 17 |
| SVM | 39 |
| RF | 17 |
| CatBoost | 21 |
| Optimization Algorithm | Optimal Parameters for CatBoost |
|---|---|
| PSO | loss_function=’Logloss’, eval_metric=’AUC’, task_type=’CPU’, boosting_type=‘Ordered’, random_seed=‘123’, learning_rate=0.03, iterations=100, depth=6, l2_leaf_reg=20 |
| WOA | loss_function=’Logloss’, eval_metric=’AUC’, task_type=’CPU’, boosting_type=‘Ordered’, random_seed=‘123’, learning_rate=0.2, iterations=60, depth=8, l2_leaf_reg=27 |
| SSA | loss_function=’Logloss’, eval_metric=’AUC’, task_type=’CPU’, boosting_type=‘Ordered’, random_seed=‘123’, learning_rate=0.1, iterations=50, depth=8, l2_leaf_reg=18 |
| Model | Training Time/s |
|---|---|
| CatBoost | 21 |
| PSO-CatBoost | 18 |
| WOA-CatBoost | 11 |
| SSA-CatBoost | 7 |
Disclaimer/Publisher’s Note: The statements, opinions and data contained in all publications are solely those of the individual author(s) and contributor(s) and not of MDPI and/or the editor(s). MDPI and/or the editor(s) disclaim responsibility for any injury to people or property resulting from any ideas, methods, instructions or products referred to in the content. |
© 2023 by the authors. Licensee MDPI, Basel, Switzerland. This article is an open access article distributed under the terms and conditions of the Creative Commons Attribution (CC BY) license (https://creativecommons.org/licenses/by/4.0/).
Share and Cite
Chang, W.; Wang, X.; Yang, J.; Qin, T. An Improved CatBoost-Based Classification Model for Ecological Suitability of Blueberries. Sensors 2023, 23, 1811. https://doi.org/10.3390/s23041811
Chang W, Wang X, Yang J, Qin T. An Improved CatBoost-Based Classification Model for Ecological Suitability of Blueberries. Sensors. 2023; 23(4):1811. https://doi.org/10.3390/s23041811
Chicago/Turabian StyleChang, Wenfeng, Xiao Wang, Jing Yang, and Tao Qin. 2023. "An Improved CatBoost-Based Classification Model for Ecological Suitability of Blueberries" Sensors 23, no. 4: 1811. https://doi.org/10.3390/s23041811