Article

Discriminative ‘Turn-on’ Detection of Al3+ and Ga3+ Ions as Well as Aspartic Acid by Two Fluorescent Chemosensors

1
Department of Chemistry, University of Delhi, Delhi 110007, India
2
Department of Applied Chemistry, Maulana Abul Kalam Azad University of Technology, Nadia 742149, India
*
Author to whom correspondence should be addressed.
Sensors 2023, 23(4), 1798; https://doi.org/10.3390/s23041798
Submission received: 26 December 2022 / Revised: 1 February 2023 / Accepted: 2 February 2023 / Published: 6 February 2023
(This article belongs to the Special Issue Editorial Board Members' Collection Series: Fluorescent Sensors)

Abstract

:
In this work, two Schiff-base-based chemosensors L1 and L2 containing electron-rich quinoline and anthracene rings were designed. L1 is AIEE active in a MeOH-H2O solvent system while formed aggregates as confirmed by the DLS measurements and fluorescence lifetime studies. The chemosensor L1 was used for the sensitive, selective, and reversible ‘turn-on’ detection of Al3+ and Ga3+ ions as well as Aspartic Acid (Asp). Chemosensor L2, an isomer of L1, was able to selectively detect Ga3+ ion even in the presence of Al3+ ions and thus was able to discriminate between the two ions. The binding mode of chemosensors with analytes was substantiated through a combination of 1H NMR spectra, mass spectra, and DFT studies. The ‘turn-on’ nature of fluorescence sensing by the two chemosensors enabled the development of colorimetric detection, filter-paper-based test strips, and polystyrene film-based detection techniques.

1. Introduction

Earth’s crust consists of various metals, out of which aluminum is the third most abundant [1,2]. Aluminum metal and its compounds enter into the environment through various anthropogenic activities such as building materials, transportation, electronics, industrial effluents, wastewater treatment plants, utensils, and food additives [3,4,5,6]. As a result, aluminum gets absorbed and accumulated in the human body due to its excessive exposure [6,7,8]. Although aluminum is a nonessential metal in the human body, once inside, it competes with other important metals with similar properties (e.g., Mg2+, Ca2+, and Fe3+ ions) to bind to various proteins [9,10,11,12]. The high concentration of aluminum in humans can cause severe neurodegenerative diseases such as Alzheimer’s, amyotrophic lateral sclerosis, and Parkinson’s diseases along with various other diseases including microcytic hypochromic anemia, dialysis encephalopathy, and Al-related bone disease [1,13,14,15]. As per the World Health Organization (WHO), the permissible limit of aluminum ions in drinking water is 7.4 μM while the daily average intake should not exceed 3–10 mg [15,16,17]. Therefore, efforts have been made to develop efficient sensors that can detect aluminum ion (Al3+) selectively and sensitively [10]. Similarly, gallium ions (Ga3+), belonging to the identical IIIA group as Al3+, have also been recognized as a potential risk to human health [4,18,19,20].
Amino acids, as building blocks, are essential for living organisms for various vital functions [21,22,23]. Amongst all nonessential amino acids, Aspartic Acid (Asp) plays several critical roles in various biological and physiological processes [24,25,26]. Asp is specifically required for its role in the tricarboxylic acid (TCA) cycle [27,28]. Asp also serves as the main precursor for the synthesis of two amino acids, i.e., Glutamic acid and Glycine [24,29]. Asp acts as a major excitatory neurotransmitter in the mammalian central nervous system [24,30]. Studies have shown the use of K+Asp as a cure for heart and liver diseases and diabetes, but a higher amount of Asp can also cause Lou Gehrig’s disease, and it is also connected with the early onset of Alzheimer’s disease [25,27,30]. Therefore, the selective and sensitive detection of Asp is quite essential. The literature presents a number of chemosensors that can detect both Al3+ and Ga3+ ions, but only a few chemosensors are known for the discriminative detection of Al3+ and Ga3+ ions [31]. Similarly, a very limited number of examples are available where a chemosensor can detect Al3+ and Ga3+ ions as well as Asp [31].
Many chemosensors suffer from the Aggregation Caused Quenching (ACQ) at higher concentrations [32,33]. Hence, anti-ACQ materials, also known as the Aggregation-Induced Enhanced Emission (AIEE) materials have generated a lot of interest due to their unique light-emitting properties [34,35]. Such AIEE-active fluorophores are usually nonemissive or poorly emissive at the lower concentration but are brightly emissive at the higher concentration or in the aggregated state [36,37]. Moreover, AIEE-active chemosensors offer the advantages of low background noise and a large Stokes shift [35,38]. Thus, the development of rapid, low-cost, and AIEE-active chemosensors that can selectively and sensitively detect Al3+ and Ga3+ ions as well as Asp is of utmost importance [39,40,41].
In this work, we present two isomeric quinoline- and anthracene-based Schiff bases L1 and L2 as the ‘turn-on’ fluorescent chemosensors. L1 displays the AIEE properties in a MeOH-H2O system while also acting as a sensitive, selective, and fluorescent chemosensor for the detection of Al3+ and Ga3+ ions and Asp. In contrast, L2, a positional isomer of L1, was exclusively selective for the Ga3+ ion and can be used as a discriminative tool for the detection of Ga3+ ion even in the presence of Al3+ ion. The sensing abilities of L1 were further utilized to fabricate low-cost detection methods for both Al3+ and Ga3+ ions and Asp. It is important to note that very few reports are available in the literature where an AIEE active chemosensor can detect Al3+ and Ga3+ ions and Asp [31].

2. Materials and Methods

2.1. Synthesis and Characterization

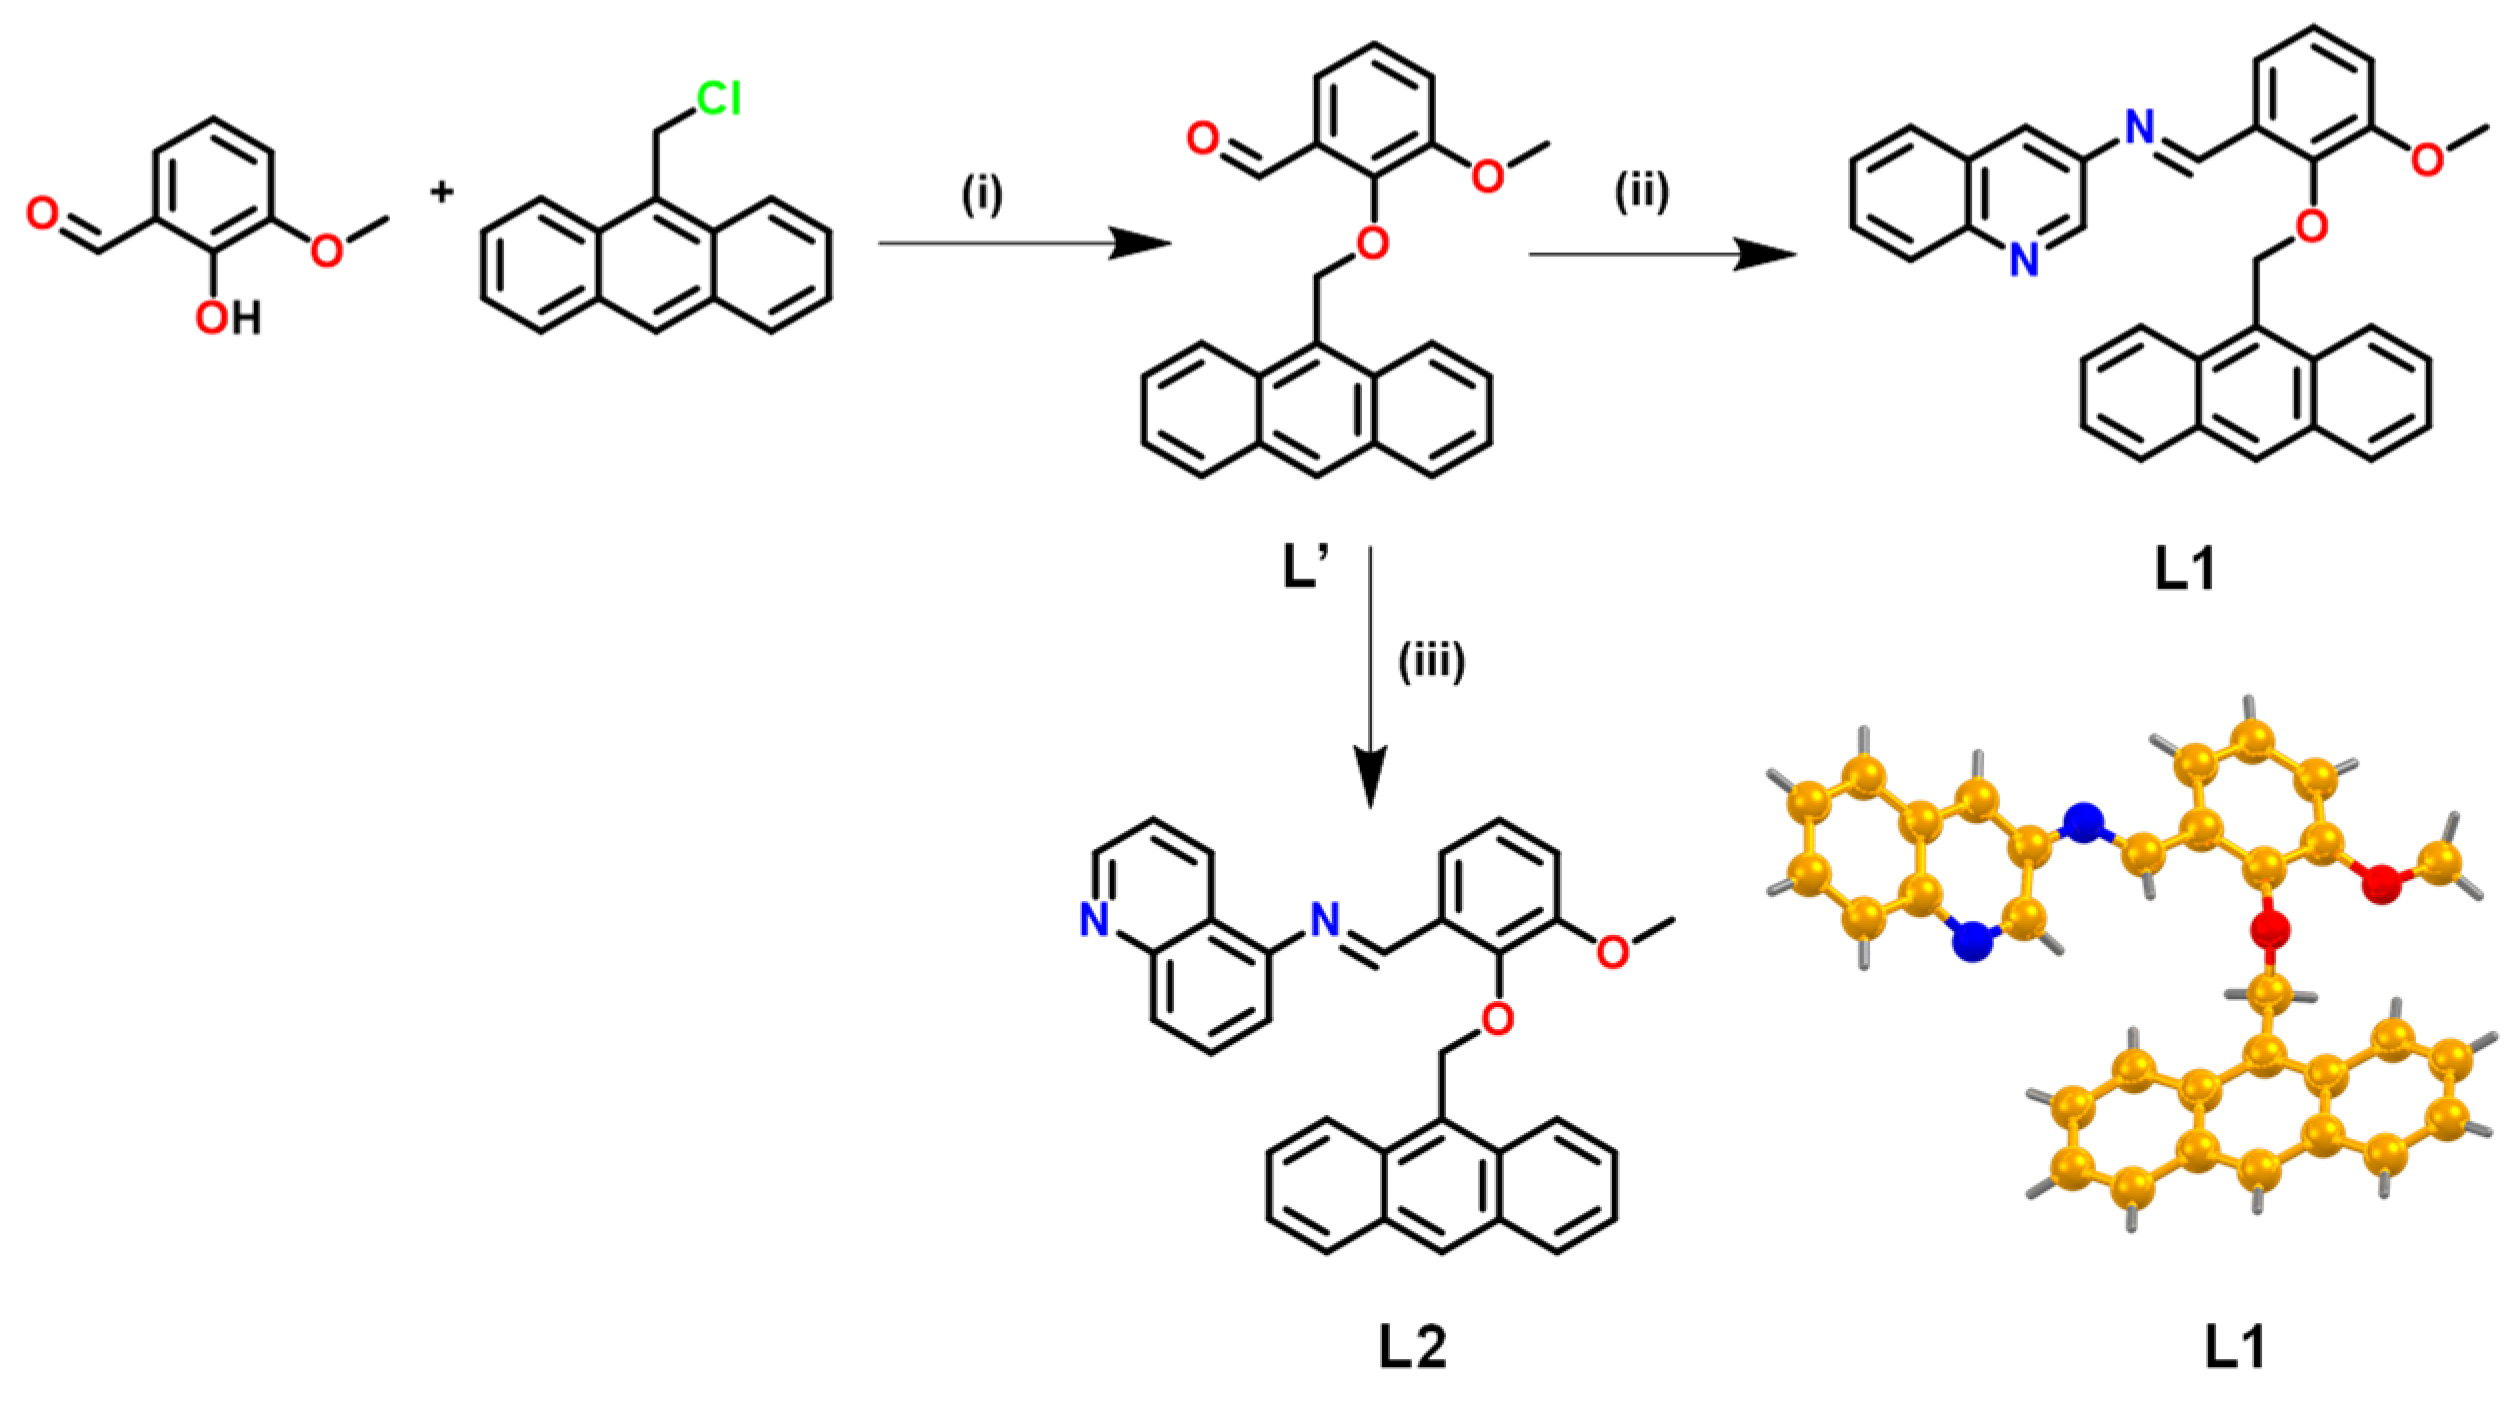
2.1.1. 2-(Anthracen-9-ylmethoxy)-3-methoxybenzaldehyde (L’)

Ortho-Vanillin (500 mg, 3.28 mmol) was taken in a round-bottomed flask (RBF) and dissolved in 5 mL of N,N-dimethyl formamide (DMF). To this solution, CsCO3 (1.07 g, 3.28 mmol) was added, and the mixture was stirred at room temperature for 30 minutes. Subsequently, 9-(chloromethyl)anthracene (745 mg, 3.38 mmol) was added and the reaction was stirred at room temperature for 12 h. Ice-cold water was added to this mixture, which resulted in an instantaneous thick off-white precipitate. This precipitate was filtered, thoroughly washed with water, and then dried under a vacuum. Yield: 1030 mg (92%). FTIR spectrum (Zn-Se ATR, selected peaks): 2855 (aldehyde C-H str.), 1688 (νC=O) cm−1. 1H NMR spectrum (400 MHz, CDCl3): δ 9.99 (s, 1H), 8.52 (s, 1H), 8.42 (d, J = 8.8 Hz, 1H), 8.03 (d, J = 8.4 Hz, 1H), 7.51 (dt, J = 14.6, 6.8 Hz, 1H), 7.34 (d, J = 7.7 Hz, 1H), 7.25 (s, 1H), 7.15 (t, J = 7.9 Hz, 1H), 6.24 (s, 1H), 4.10 (s, 1H). 13C NMR spectrum (101 MHz, CDCl3): δ 190.22, 153.37, 151.53, 131.45, 131.27, 130.50, 129.34, 129.19, 127.08, 126.72, 125.11, 124.37, 123.87, 119.22, 117.98, 67.98, 56.29. ESI+ mass spectrum (CH3OH): calcd. 365.11 for C23H18O3 + Na+ (L’ + Na+); obsd. 365.11 for L’ + Na+.

2.1.2. (E)-1-(2-(Anthracen-9-ylmethoxy)-3-methoxyphenyl)-N-(quinolin-3-yl)methanimine (L1)

L’ (150 mg, 0.44 mmol) was dissolved in 25 ml of EtOH, and to this solution, 3-aminoquioline (63.4 mg, 0.44 mmol) was added and the mixture was refluxed at 80 °C for 30 min. After that, 400 μL of acetic acid was added and the mixture was further refluxed for 8 h. The reaction mixture was allowed to cool, which resulted in a precipitate that was filtered, was washed with EtOH, and was dried in a vacuum. Yield: 170 mg (83%). FTIR spectrum (Zn-Se ATR, selected peaks): 3047–3014 (aromatic C-H str.), 1624 (νC=N) cm−1. 1H NMR spectrum (400 MHz, CDCl3): 8.51 (s, 1H), 8.42 (s, 1H), 8.38 (s, 2H), 8.36 (s, 1H), 8.07 (s, 1H), 7.92 (s, 2H), 7.65 (td, J = 6.7, 3.3 Hz, 1H), 7.62–7.56 (m, 2H), 7.53 (ddd, J = 8.0, 6.7, 1.1 Hz, 1H), 7.43–7.35 (m, 2H), 7.33–7.27 (m, 2H), 7.20–7.12 (m, 2H), 6.96 (d, J = 2.3 Hz, 1H), 6.22 (s, 2H), 4.15 (s, 3H). 13C NMR spectrum (101 MHz, CDCl3): δ 158.98, 153.24, 149.19, 147.87, 146.52, 144.77, 131.36, 131.26, 130.52, 129.18, 129.11, 129.09, 128.42, 128.29, 127.85, 127.42, 126.71, 126.65, 125.03, 124.60, 123.81, 122.50, 118.92, 115.39, 67.41, 56.27. ESI+ mass spectrum (CH3OH): calcd. 469.18 for C32H24N2O2 + H+ (L1 + H+); obsd. 469.19 for L1 + H+.

2.1.3. (E)-1-(2-(Anthracen-9-ylmethoxy)-3-methoxyphenyl)-N-(quinolin-5-yl)methanimine (L2)

Chemosensor L2 was synthesized using a procedure similar to that used for L1 but with the following reagents: L’, (150 mg, 0.44 mmol) and 5-aminoquioline (63.4 mg, 0.44 mmol). Yield: 160 mg (78%). FTIR spectrum (Zn−Se ATR, selected peaks): 1617 (νC=N) cm−1. 1H NMR spectrum (400 MHz, CDCl3): δ 8.91 (s, 1H), 8.41 (d, J = 8.4 Hz, 1H), 8.35 (dd, J = 6.5, 3.5 Hz, 2H), 8.32 (s, 1H), 8.31 (s, 1H), 7.85 (dd, J = 6.3, 3.2 Hz, 3H), 7.67 (dd, J = 6.5, 2.9 Hz, 1H), 7.39–7.32 (m, 6H), 7.20–7.14 (m, 2H), 6.22 (s, 2H), 6.03 (dd, J = 7.3, 0.8 Hz, 1H), 4.16 (s, 3H). 13C NMR spectrum (101 MHz, CDCl3): δ 157.63, 153.31, 150.48, 148.96, 148.74, 148.31, 132.72, 131.34, 131.29, 130.88, 129.39, 129.12, 129.00, 127.34, 126.58, 124.97, 124.50, 124.41, 123.85, 120.42, 119.00, 115.12, 112.85, 67.24, 56.29. ESI+ mass spectrum (CH3OH): calcd. 469.18 for C32H24N2O2 + H+ (L2 + H+); obsd. 469.19 for L2 + H+.

2.2. General Information and Methods

Reagents of analytical grade were procured from Sigma-Aldrich, Alfa-Aesar, and Spectrochem and were used without further purification. The solvents were purified using the standard literature methods [42]. HPLC-grade solvents were used for the UV–Visible and fluorescence spectral studies. A stock solution of L1 and L2 (1 mM) was prepared in Tetrahydrofuran (THF). All stock solutions of metal salts of NaCl, KCl, BeCl2, MgCl2, Al(NO3)3, GaCl3, Pb(NO3)2, CrCl3, MnCl2, FeSO4, FeCl3, LiCl, CoCl2, NiCl2, CuSO4, ZnCl2, AgNO3, Pd(CH3COO)2, Cd(NO3)2, In(OTf)3, and HgCl2 (2.5 mM) were prepared in EtOH. All stock solutions of amino acids of Glutamic acid (Glu), Proline (Pro), Cysteine (Cys), Isoleucine (Ile), Tyrosine (Tyr), Arginine (Arg), Glutamine (Gln), Lysine (Lys), Threonine (Thr), Aspartic acid (Asp), Alanine (Ala), Asparagine (Asn), Glycine (Gly), Histidine (His), Leucine (Leu), Methionine (Met), Phenylalanine (Phe), Serine (Ser), Tryptophan (Trp), and Valine (Val) were prepared in H2O. All UV-Vis and fluorescence spectral experiments were performed with a 1.0 cm path length cuvette at 25 °C in EtOH.

2.3. Physical Measurements

FTIR spectra (Zn-Se ATR) were recorded using a PerkinElmer, USA Spectrum-Two spectrometer. NMR spectra were obtained from a JEOL, Japan 400 MHz spectrometer. High-resolution mass spectra were obtained with an Agilent G6530AA, USA (Q-TOF LC-HRMS) mass spectrometer. Fluorescence spectral studies were performed with a Cary Eclipse fluorescence spectrometer or Edinburgh Instrument, UK FLS 900 luminescence spectrometer. Time-resolved fluorescence spectra were recorded using a picosecond Fluorimeter from Horiba Jobin Yvon (FluoroHub), USA. DLS measurements were recorded on a Malvern zetasizer ZS90 instrument, UK.

2.4. Crystallography

X-ray diffraction intensity data of L1 (CCDC No. 2232788) were collected at 298 K on a Bruker SMART APEX-II CCD diffractometer equipped with graphite-monochromatic Mo Kα radiation (λ = 0.71073 Å) [43]. The structure was solved using direct methods using the SIR97 program [44] and was refined on F2 using all data by full-matrix least squares procedures with SHELXL 2018/3 [45]. The hydrogen atoms were placed at the calculated positions and were included in the last cycles of the refinement. All the calculations were conducted using the WinGX (ver. 2018.3) software package [46]. The crystallographic data collection and structure solution parameters are summarized in Table S1 in the Supplementary Materials.

2.5. DFT Studies

The geometrical optimization of chemosensors L1 and L2 and their complexes L1–Al3+, L1–Ga3+, and L2–Ga3+ was achieved under C1 symmetry by employing the density functional theory (DFT) method [47]. Becke’s three parameter exchange correlation functional by Lee, Yang, and Parr (B3LYP) was utilized as a hybrid functional for the calculations using Gaussian09W suits [48]. Two different basis sets were used for the geometrical optimization: viz., LANL2DZ for the Al3+ and Ga3+ ions and 6-311 + G (d, p) for the rest of the atoms [49,50]. The solvent effect was taken into account with a conductor-like polarizable continuum model (CPCM) using ethanol as a solvent [51]. The optimized geometries were subjected to frequency calculations to confirm if the global minima was achieved. The frontier molecular orbitals (FMOs) and molecular electrostatic potential surfaces were visualized using the optimized structures. All geometrical modifications were made using GaussView 5.0 package [52]. The FMOs were plotted using the Avogadro software [53].

2.6. Determination of Binding Constant (Kb)

The binding constant (Kb) was computed using the Benesi–Hildebrand Equation (1) where I, I0, and Imax are the emission intensities of the chemosensors (L1 or L2) in the presence of analytes (Al3+, Ga3+, or Asp), in the absence of analytes, and the maximum fluorescence intensity in the presence of the analytes, respectively [54]. Kb was obtained by using the ratio of the intercept and slope from 1/(I − I0) vs. 1/[A] plot where [A] refers to the concentration of analytes, i.e., Al3+, Ga3+, or Asp.
1/(I − I0) = 1/{Kb(I0 − Imax)[A]} + 1/(I0 − Imax)

2.7. Determination of Detection Limit

The detection limit was calculated from the fluorescence spectral titration according to Equation (2), where k is the slope of a plot of the emission intensity of the chemosensors (L1 or L2) versus the concentration of analytes (Al3+, Ga3+ or Asp) while σ is the standard deviation of ten blank replicate fluorescence measurements of chemosensors (L1 or L2) [55,56].
Detection limit: 3σ/k

2.8. Determination of Quantum Yield

The relative fluorescence quantum yields (ΦF) of L1, L1 at fw = 70% L1–Al, L1–Ga, L1–Asp, L2, and L2–Ga were calculated using Equation (3) [57,58,59]:
ΦF = Φst× Su/Sst× Ast/Au× n2Du/n2Dst
where ΦF is the fluorescence quantum yield of the samples. Here in the equation, the subscripts u and st refer to the unknown and standard samples, respectively. Φst refers to the fluorescence quantum yield of the Quinine sulfate (Φst = 0.54) used as the standard sample here. Au and Ast are the absorbance of the unknown and standard samples, respectively. Su and Sst refer to the integrated emission band areas of the unknown and standard samples, respectively. nDst and nDu represent the solvent refractive index of the standard and the unknown sample, respectively.

2.9. Colorimetric Analysis

For colorimetric analysis, standard solutions of assorted metal ions and amino acids (2.5 equiv.) were added to a solution of chemosensor L1 in EtOH. Their photographs were taken under a UV lamp (λex = 365 nm) [4,56].

2.10. Fabrication of Filter Paper Strips

Strips of Whatman filter paper were dipped in an ethanolic solution of chemosensor L1 followed by drying in the open air to prepare the test strips. Such L1 coated test strips were dipped into an aqueous solution of Al3+ and Ga3+ ions as well as Asp (2.5 equiv.). These paper test strips were then investigated under the UV lamp (λex = 365 nm) [58,59].

2.11. Fabrication of Polystyrene Films

The chemosensor L1 was mixed with styrene (0.5 mL) and α,α’-azoisobutyronitrile (AIBN; 1 mg) in EtOH (0.5 mL). The resultant mixture was heated in a water bath at 80 °C for 30 min. Subsequently, a few drops of the hot clear solution were poured over a glass slide and the resultant glass slide was dried in air to produce the thin films of chemosensor L1-loaded polystyrene. Such polystyrene films were peeled off from the glass slide and were used to detect Al3+ and Ga3+ ions as well as Asp by dipping them in their respective aqueous solutions (2.5 equiv.). These polystyrene films were then photographed under the UV lamp (λex = 365 nm) [4,57].

3. Results and Discussion

3.1. Synthesis and Characterization of Chemosensors L1 and L2

An anthracene-based aldehyde, L’, was synthesized by reacting o-vanillin with 9-(chloromethyl)anthracene (Scheme 1). L’ was characterized by various spectroscopic studies (Figures S1–S4). The chemosensors L1 and L2 were synthesized by the condensation of L’ with 3-aminoquinoline and 5-aminoquinoline, respectively (Scheme 1). The positional isomers L1 and L2 were characterized by various spectroscopic techniques. Both L1 and L2 displayed the characteristic νC = N stretches at 1626 and 1623 cm−1, respectively (Figures S5 and S9). 1H NMR spectra of L1 and L2 exhibited the imine-H signal at 8.52 and 8.91 ppm, respectively (Figures S6 and S10). The 13C resonances for the imine-C were noted at approx. 159 and 158 ppm for L1 and L2, respectively (Figures S7 and S11). The ESI+ mass spectra of both chemosensors L1 and L2 displayed a peak at m/z 469.19 corresponding to [L1/L2 + H]+ (Figures S8 and S12). To further authenticate the molecular structure, L1 was characterized by the single crystal X-ray diffraction technique (Scheme 1). L1 crystallized in a centrosymmetric space group C2/c. Notably, arene, quinoline, and anthracene rings were making different angles with each other due to the electron cloud repulsion and thus created a cavity to potentially accommodate a suitable analyte.

3.2. Photophysical Properties of L1 and L2
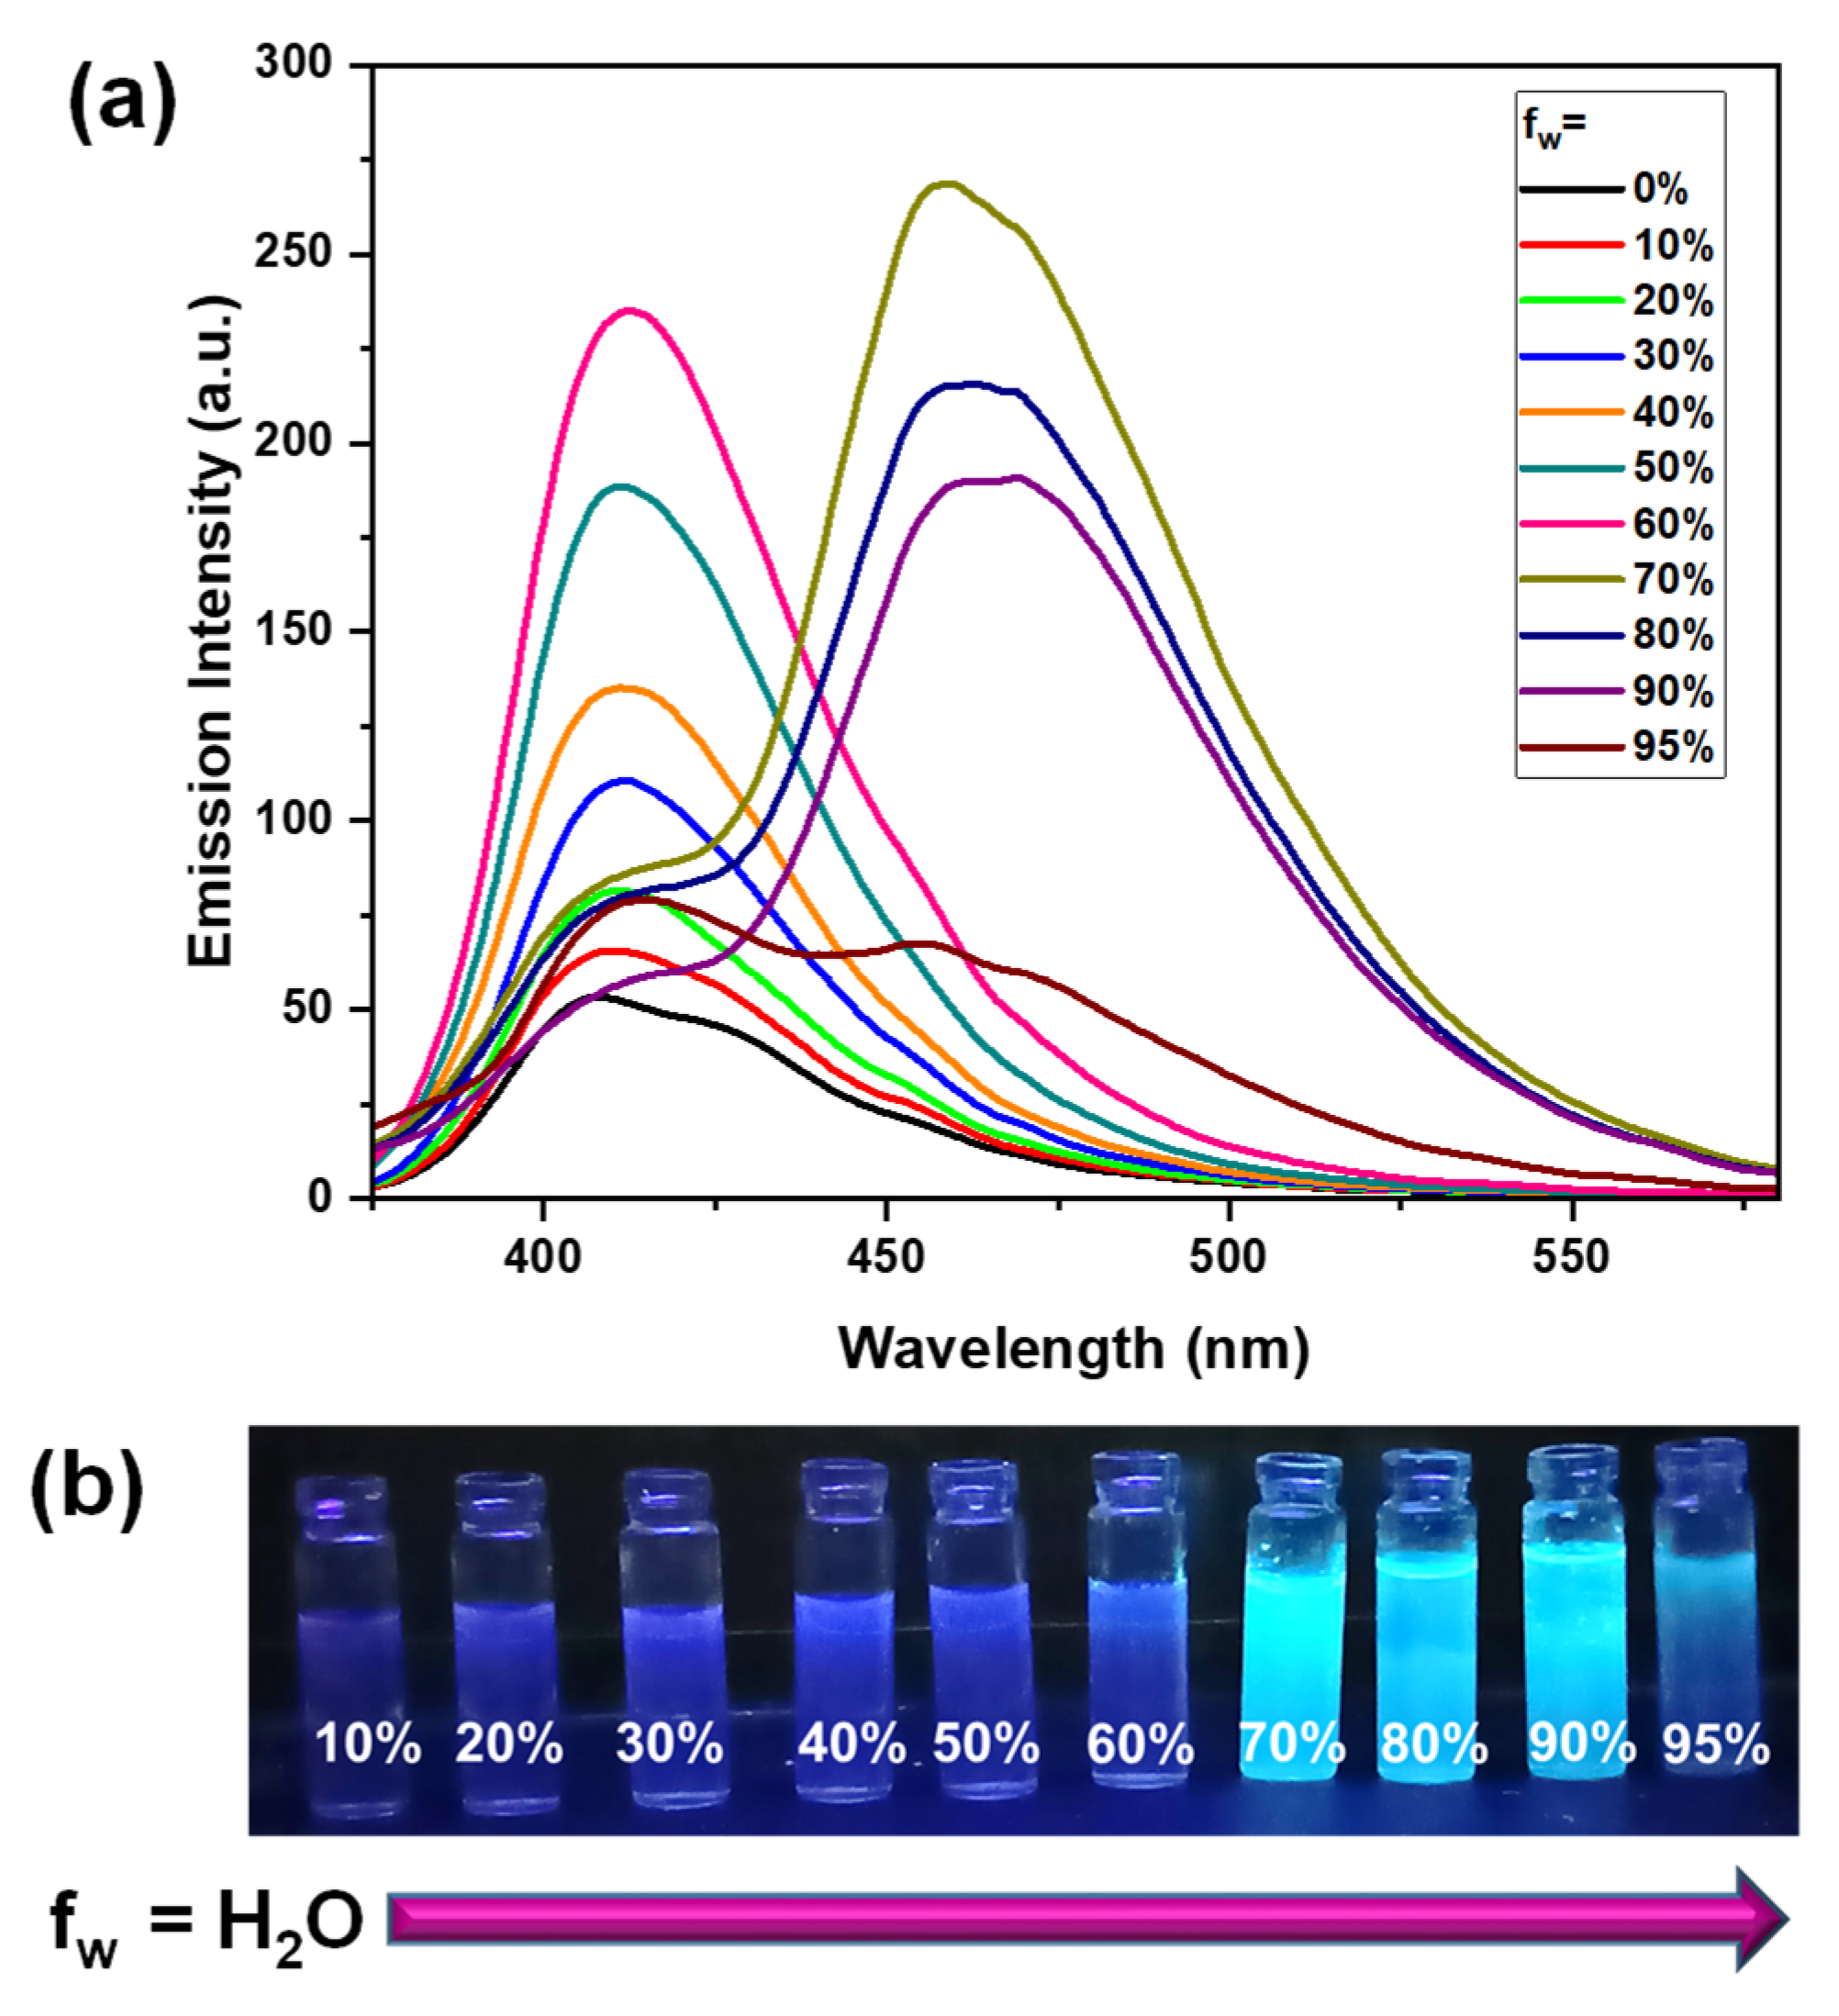
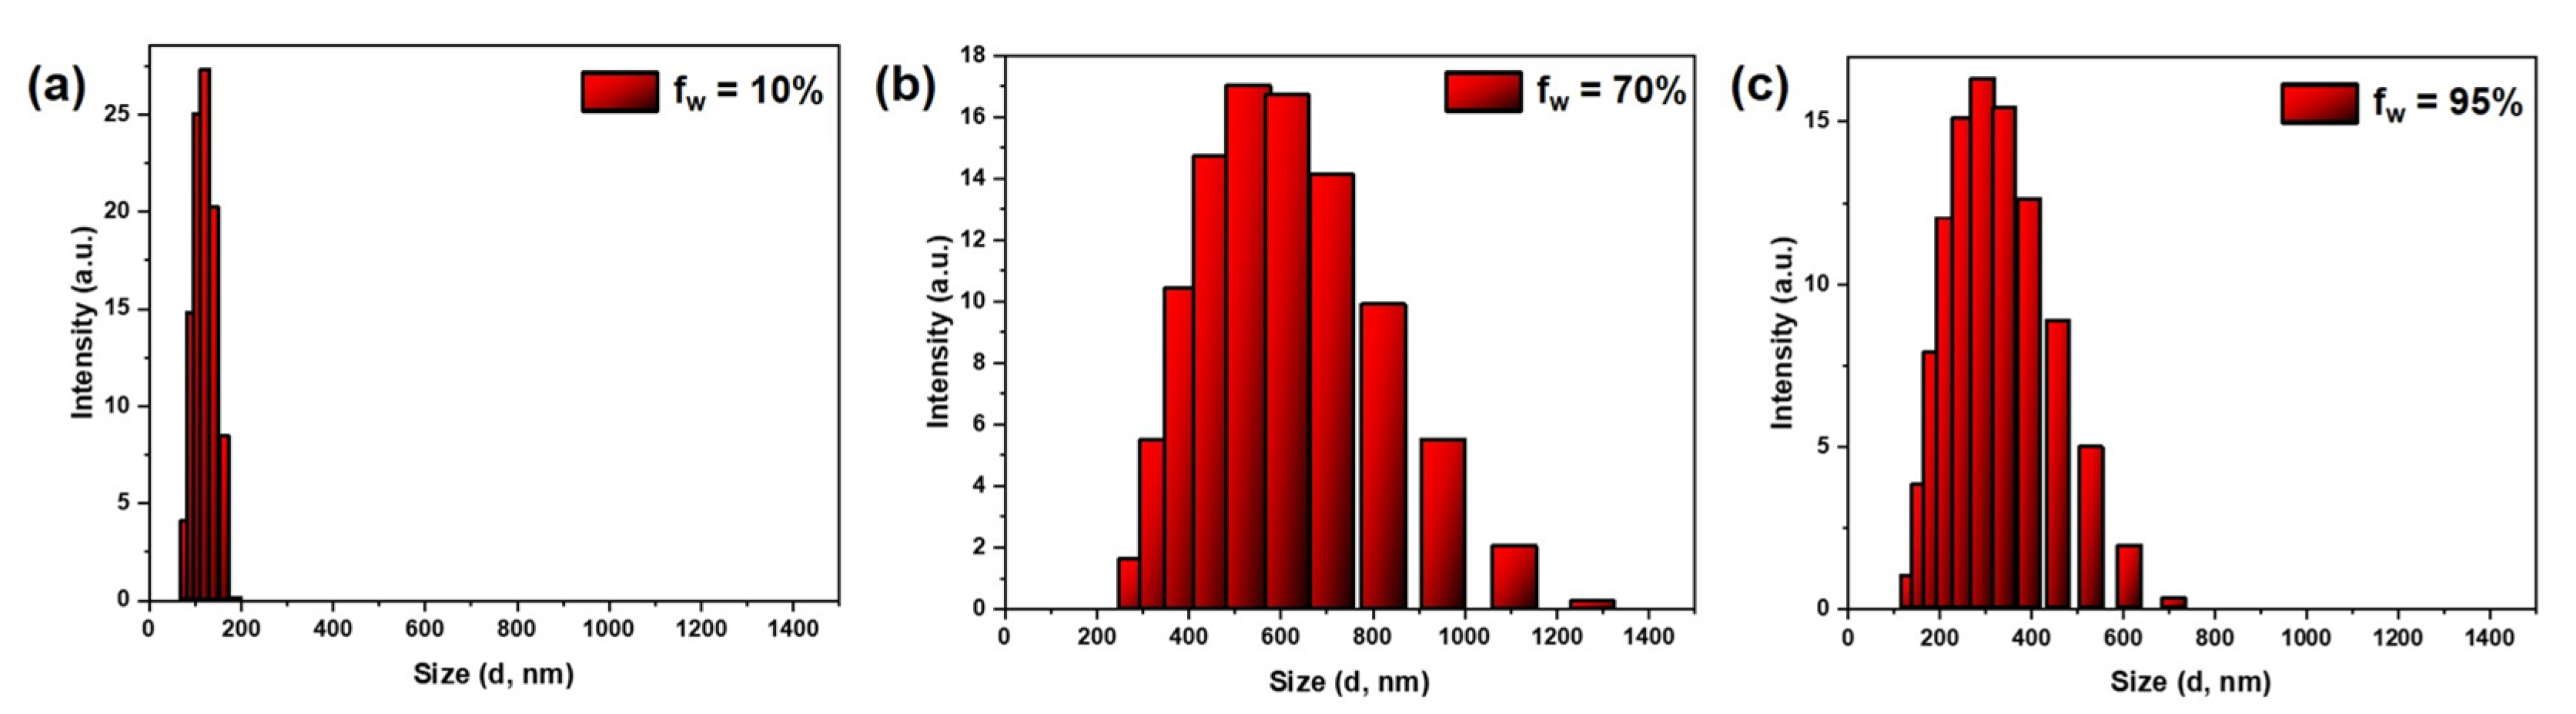
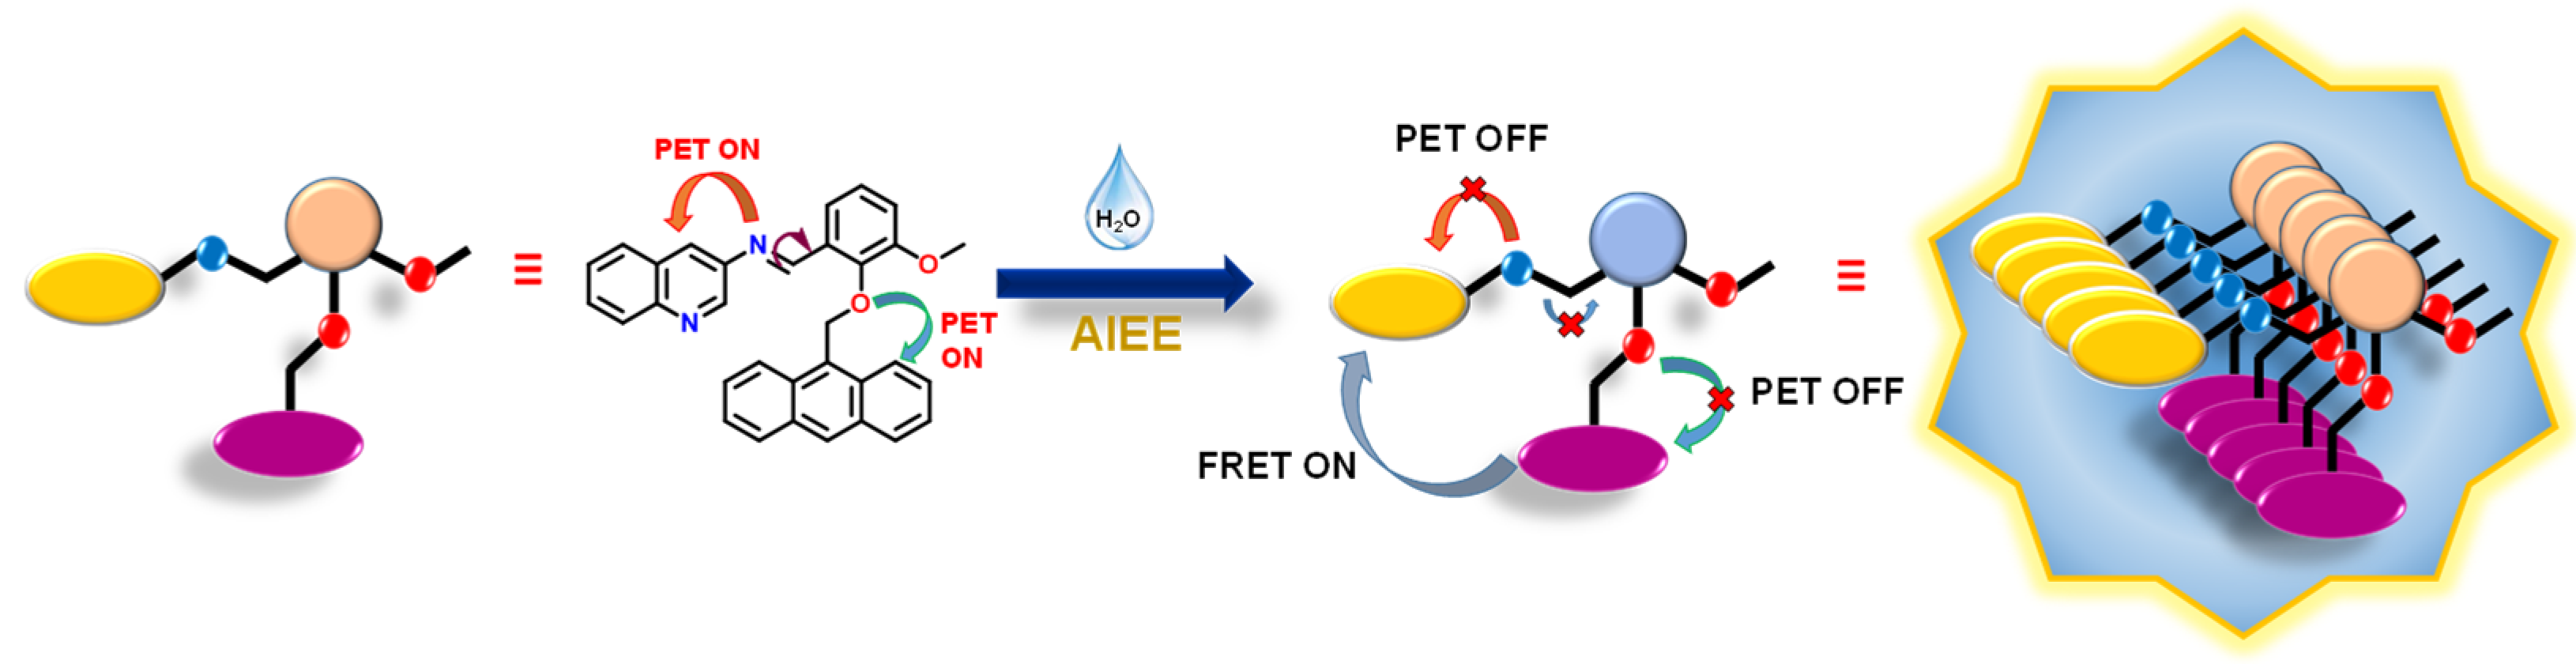
The absorption and emission spectra of both L1 and L2 (c, 20 μM) were recorded in EtOH. The absorption spectrum of L1 exhibited two intense high-energy bands at 288 nm (ε = 45,765 M−1 cm−1) and 333 nm (ε = 47,500 M−1 cm−1) corresponding to π→π* and n→π* transitions, respectively, with shoulders at 365 nm (ε = 29,270 M−1 cm−1) and 386 nm (ε = 16,645 M−1 cm−1 (Figure S13) [56,60,61]. The absorption spectrum of L2 displayed a high energy band at 348 nm (ε = 42,500 M−1 cm−1) along with various shoulders at 335 (ε = 41,000 M−1 cm−1), 367 (ε = 32,500 M−1 cm−1), and 387 nm (ε = 21,000 M−1 cm−1) (Figure S13). The emission behavior of L1 and L2 was examined at different excitation wavelengths (320–370 nm); however, the maximum emission intensity for both L1 (at 410 nm) and L2 (at 430 nm with shoulders at 408 and 460 nm) was observed when excited at λex = 350 nm (Figure S14). Thus, all subsequent studies were conducted at an excitation wavelength of 350 nm for both chemosensors.

3.3. AIEE Studies

Both L1 and L2 were soluble in various polar and nonpolar solvents such as MeOH, EtOH, THF, CHCl3, DCM, DMF, and DMSO but were insoluble in water. Therefore, in order to induce AIEE, the optical properties of L1 and L2 were examined in MeOH (c, 50 μM) after adding different percentages of water (fw = 0 to 95%). In fluorescence spectra, as the percentage of water (fw, %) increased from 0 to 60 in a MeOH solution of L1, the emission intensity increased constantly at 411 nm and attained a maxima at this wavelength (Figure 1a). This enhancement is attributed to the aggregation of L1 [32,38]. Notably, as the water percentage was further increased to 70%, a significant bathochromic shift to 460 nm (∆λ = 50 nm) was observed. Furthermore, when the water percentage was further increased, the emission intensity decreased but without any shift in wavelength. At fw = 95%, the emission bands were distributed equally at both wavelengths. We believe as the hydrophobic anthracene rings repel water, they minimize their contact with water and thus rupture the aggregates beyond a water percentage of 70% [62,63]. Figure 1b displays changes at various percentages of water varying from 10% to 95% in a MeOH-H2O system under UV light. Notably, the emission spectrum of L2 did not display any change with different percentages of water and hence L2 was AIEE inactive (Figure S15) [32]. In the case of L1, aggregate formation was confirmed by the dynamic light scattering (DLS) studies (Figure 2). DLS measurements revealed that the average diameter of the aggregates increased from 118 nm at fw = 10% to 610 nm at fw = 70%. However, at fw = 95%, the size of aggregates decreased to 293 nm. These results thus confirm that not only does L1 form aggregates in the presence of water, but maximum aggregation was possible at fw = 70%.
Time-resolved fluorescence spectroscopy was employed to further confirm AIEE and aggregate formation in L1. Since lifetime measurements are independent of the excitation wavelength and concentration, such studies are more conclusive [64]. The fluorescence lifetime (τav) increased from 3.38 ns at fw = 0 % to 5.73 ns at fw = 70%, implying the aggregate formation (Figure S16 and Table S2). However, τav decreased to 4.47 ns at fw = 95%, further confirming that the maximum aggregation was possible at fw = 70%. To obtain further support, the fluorescence quantum yield (ΦF) was calculated for L1. The quantum yield was very low (ΦF = 0.008) at fw = 0%; however, it increased nearly four-fold at fw = 70% (ΦF = 0.031). As expected, ΦF again decreased to 0.023 at fw = 95%, confirming the formation of maximum aggregates only at fw = 70%.
For L1, both the low quantum yield and lifetime at fw = 0% suggested the operation of Photoinduced Electron Transfer (PET) from imine-N and phenolic-OR (R: -CH2-) to the quinoline and anthracene moieties, respectively (Scheme 2). In addition, the intramolecular rotation of the imine-C bond further quenched the emission intensity via nonradiative decay at fw = 0%. However, as water was added, both imine-N and phenolic-OR groups started forming H-bonds with the water molecule(s), which in turn subdued PET and restricted the intramolecular bond rotation [32,65,66]. Moreover, fluorescence resonance energy transfer (FRET) also occurred from the anthracene ring to the quinoline ring [67]. As a result, aggregation occurred, and the emission intensity increased.

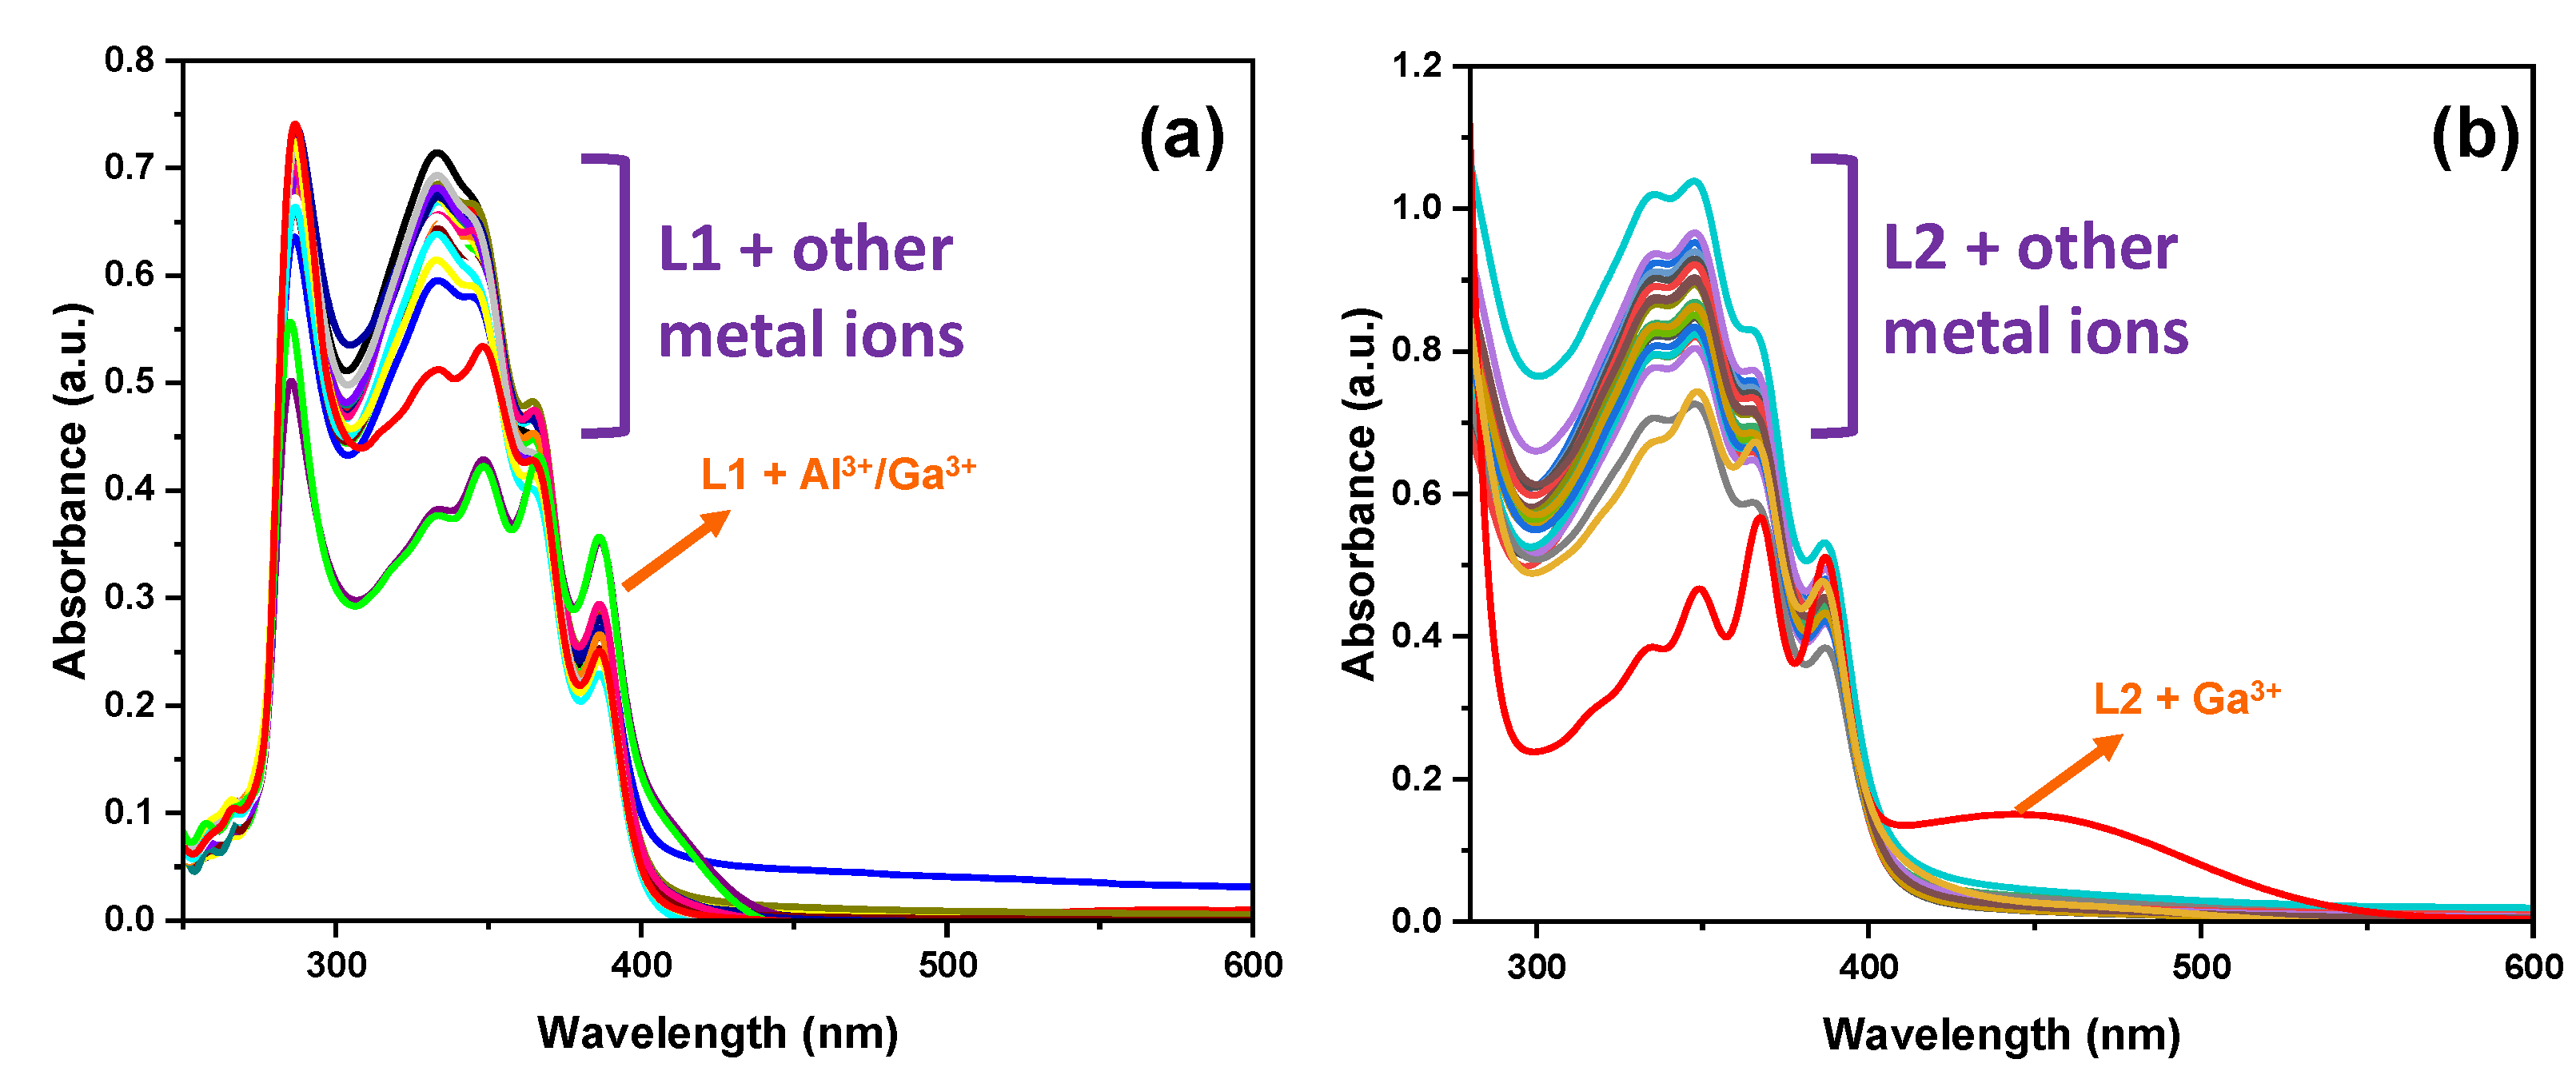
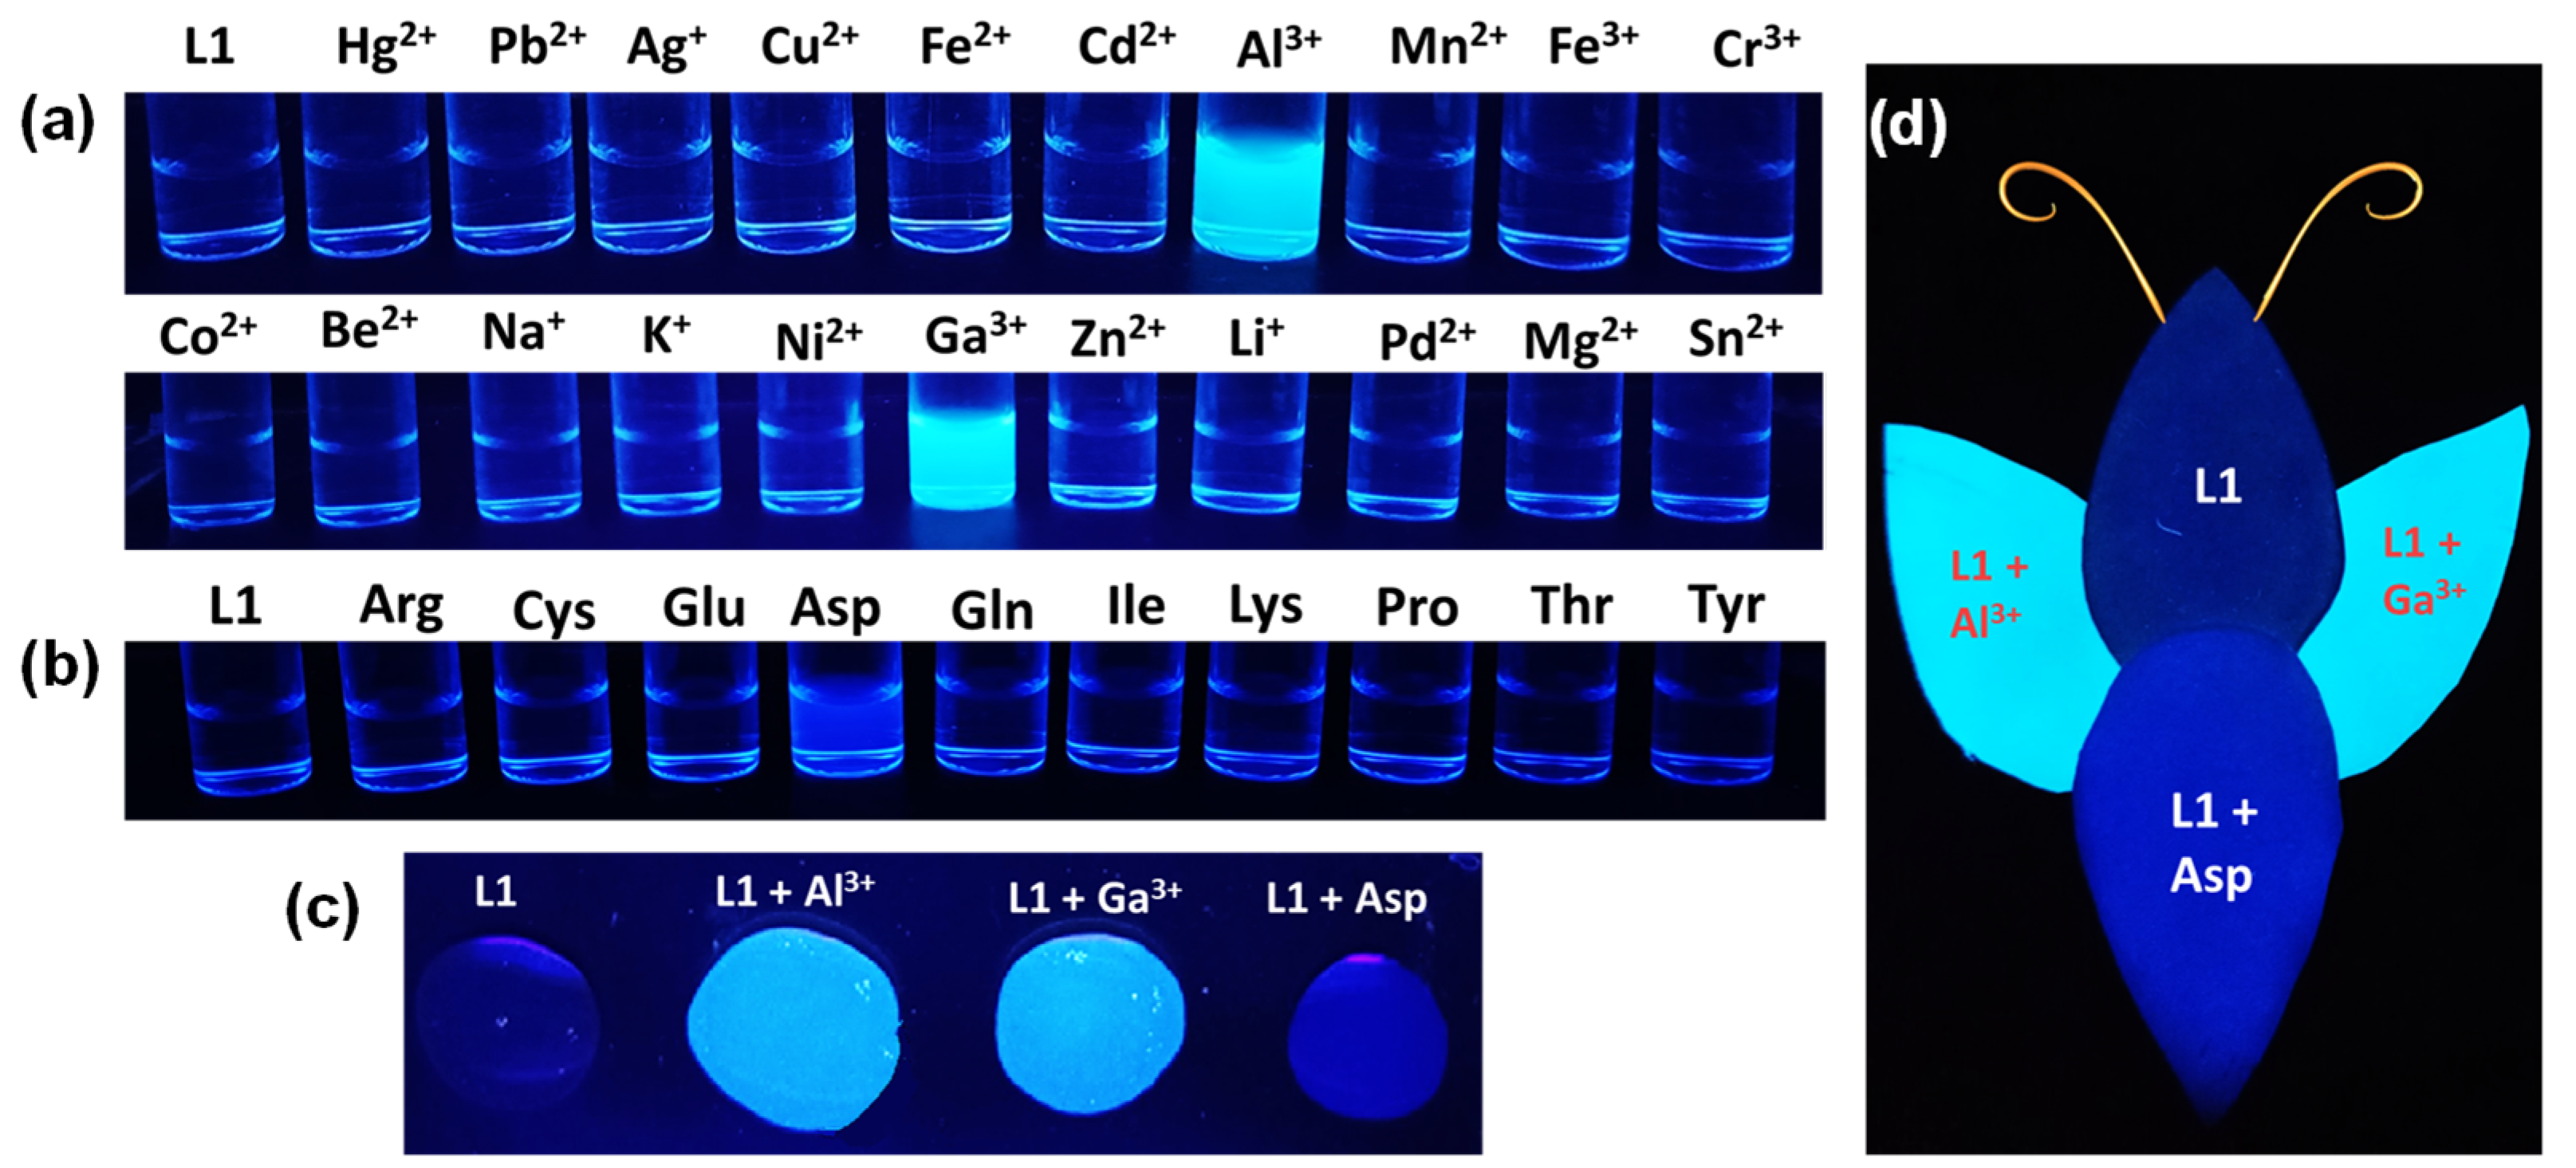
3.4. Detection of Al3+ and Ga3+ Ions by UV-Vis Spectral Studies

To understand the detection ability of L1 and L2, absorption spectra of L1 (c, 20 μM) and L2 (c, 20 μM) were examined in the presence of 2.5 equiv. of assorted metal ions (Ag+, Cd2+, Mn2+, Zn2+, Hg2+, K+, Na+, Co2+, Pd2+, Mg2+, Pb2+, Be2+, Ni2+, Sn2+, Li+, Cr3+, Fe2+, Fe3+, Cu2+, Al3+, Ga3+, In3+) (Figure 3). The absorption spectra of L1 did not show prominent changes with any of the metal ions except the Al3+ and Ga3+ ions. In contrast, the absorption spectra of L2 displayed a significant change only in the presence of Ga3+ ions. During the absorption spectral titration of L1, the spectral bands at 333, 365, and 385 nm were altered with an isosbestic point at 360 nm, suggesting the formation of a new species (Figure S17). In the case of L2, the band at 348 nm decreased while two new bands appeared at 270 and 465 nm with an isosbestic point at 283 nm [56]. These spectral titrations supported the formation of a complex between the chemosensors and metal ions.

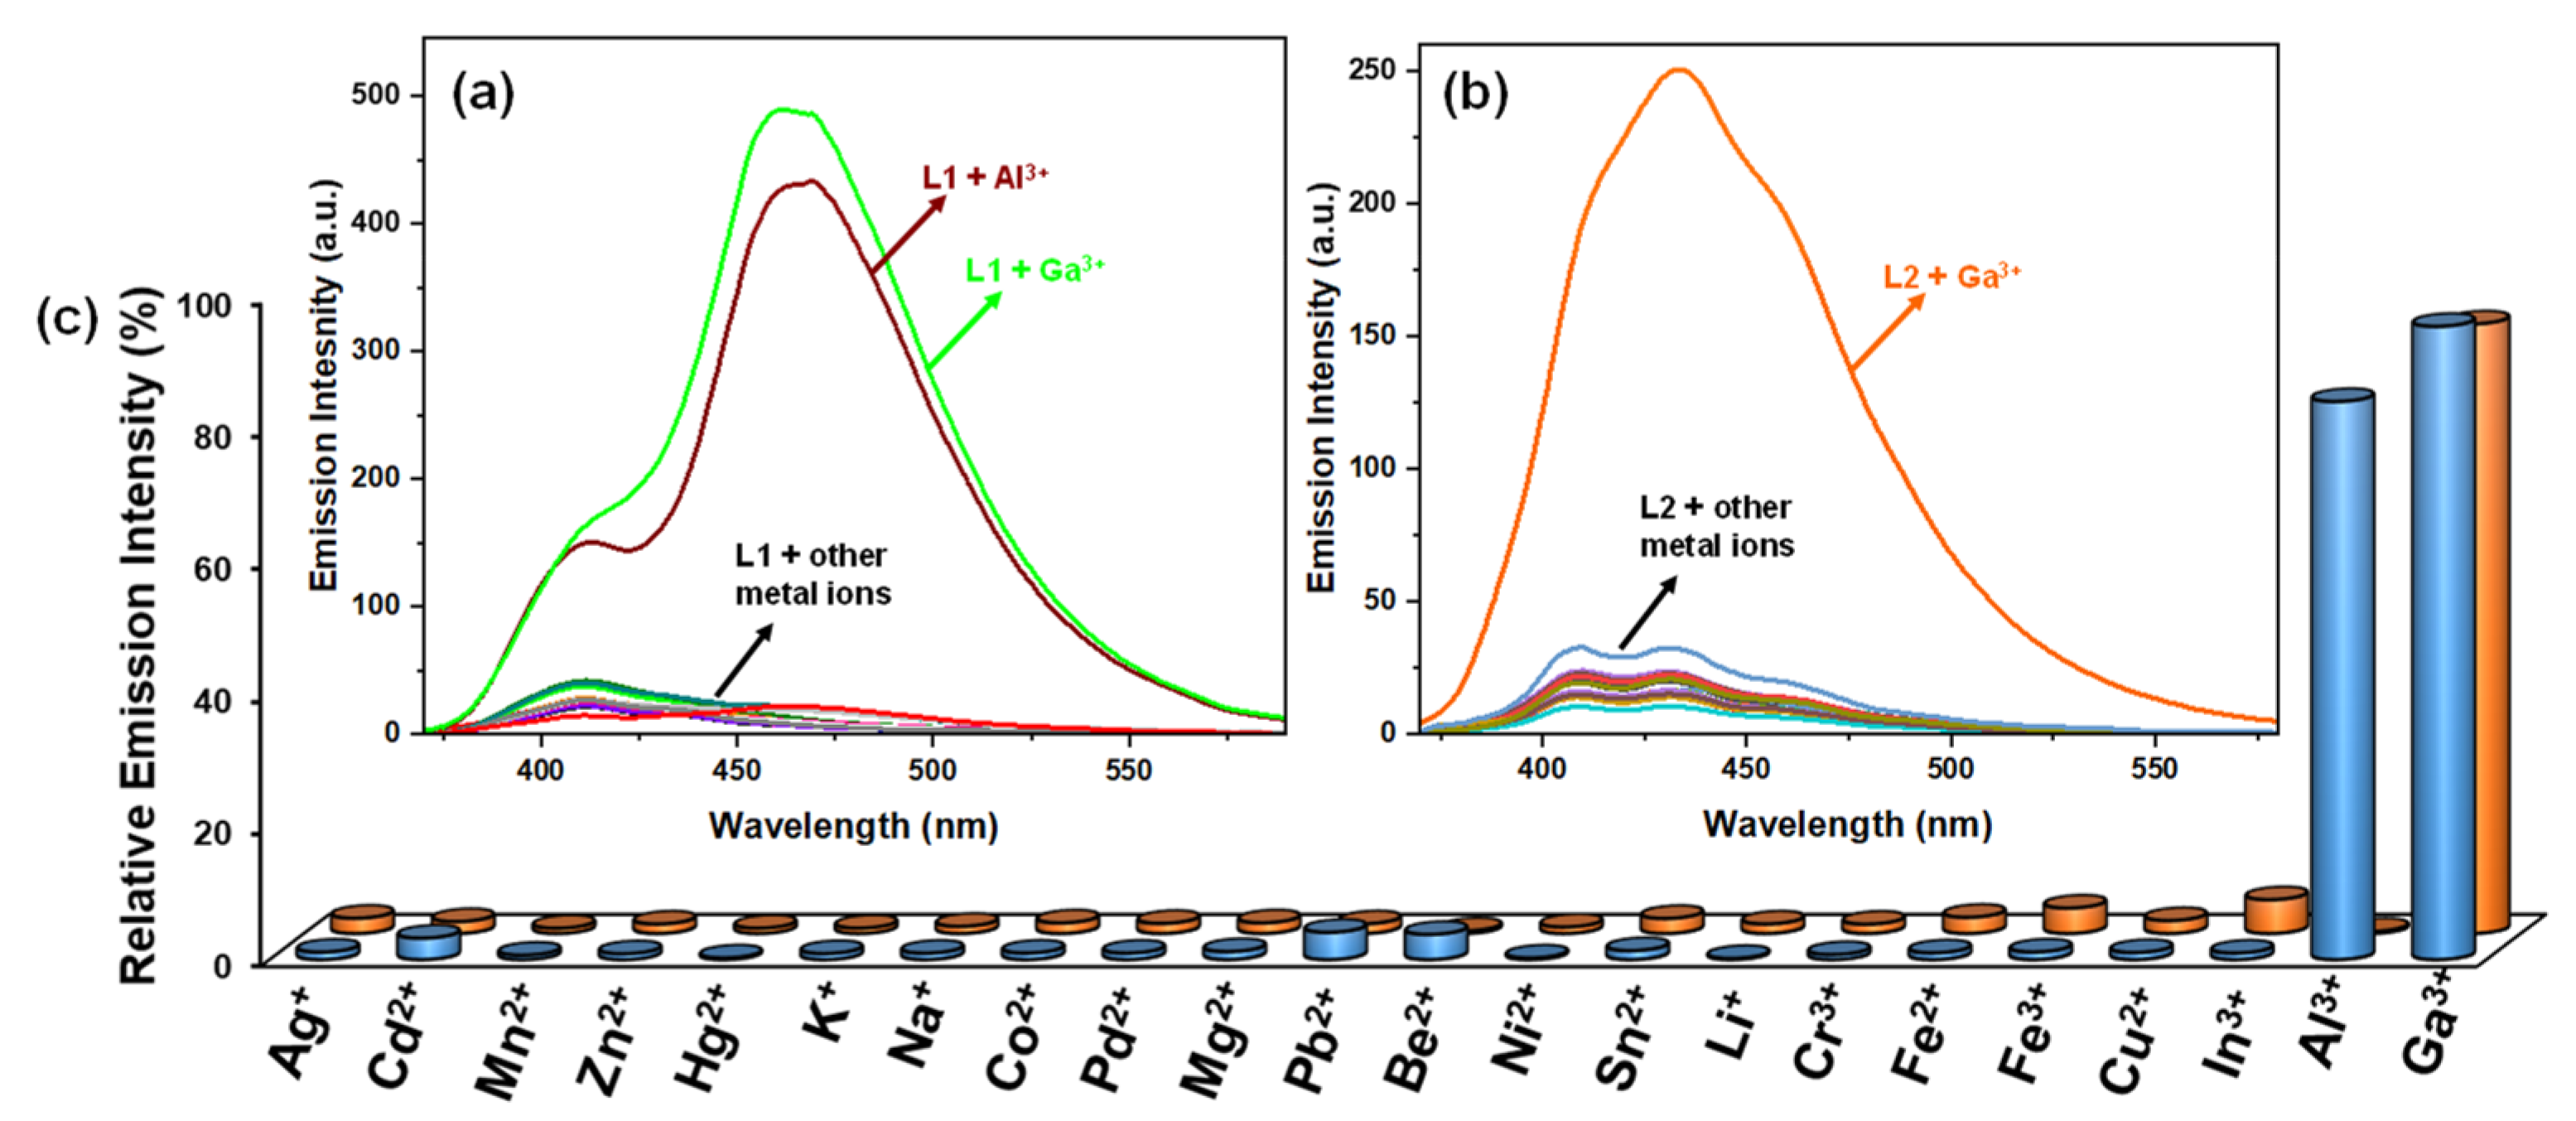
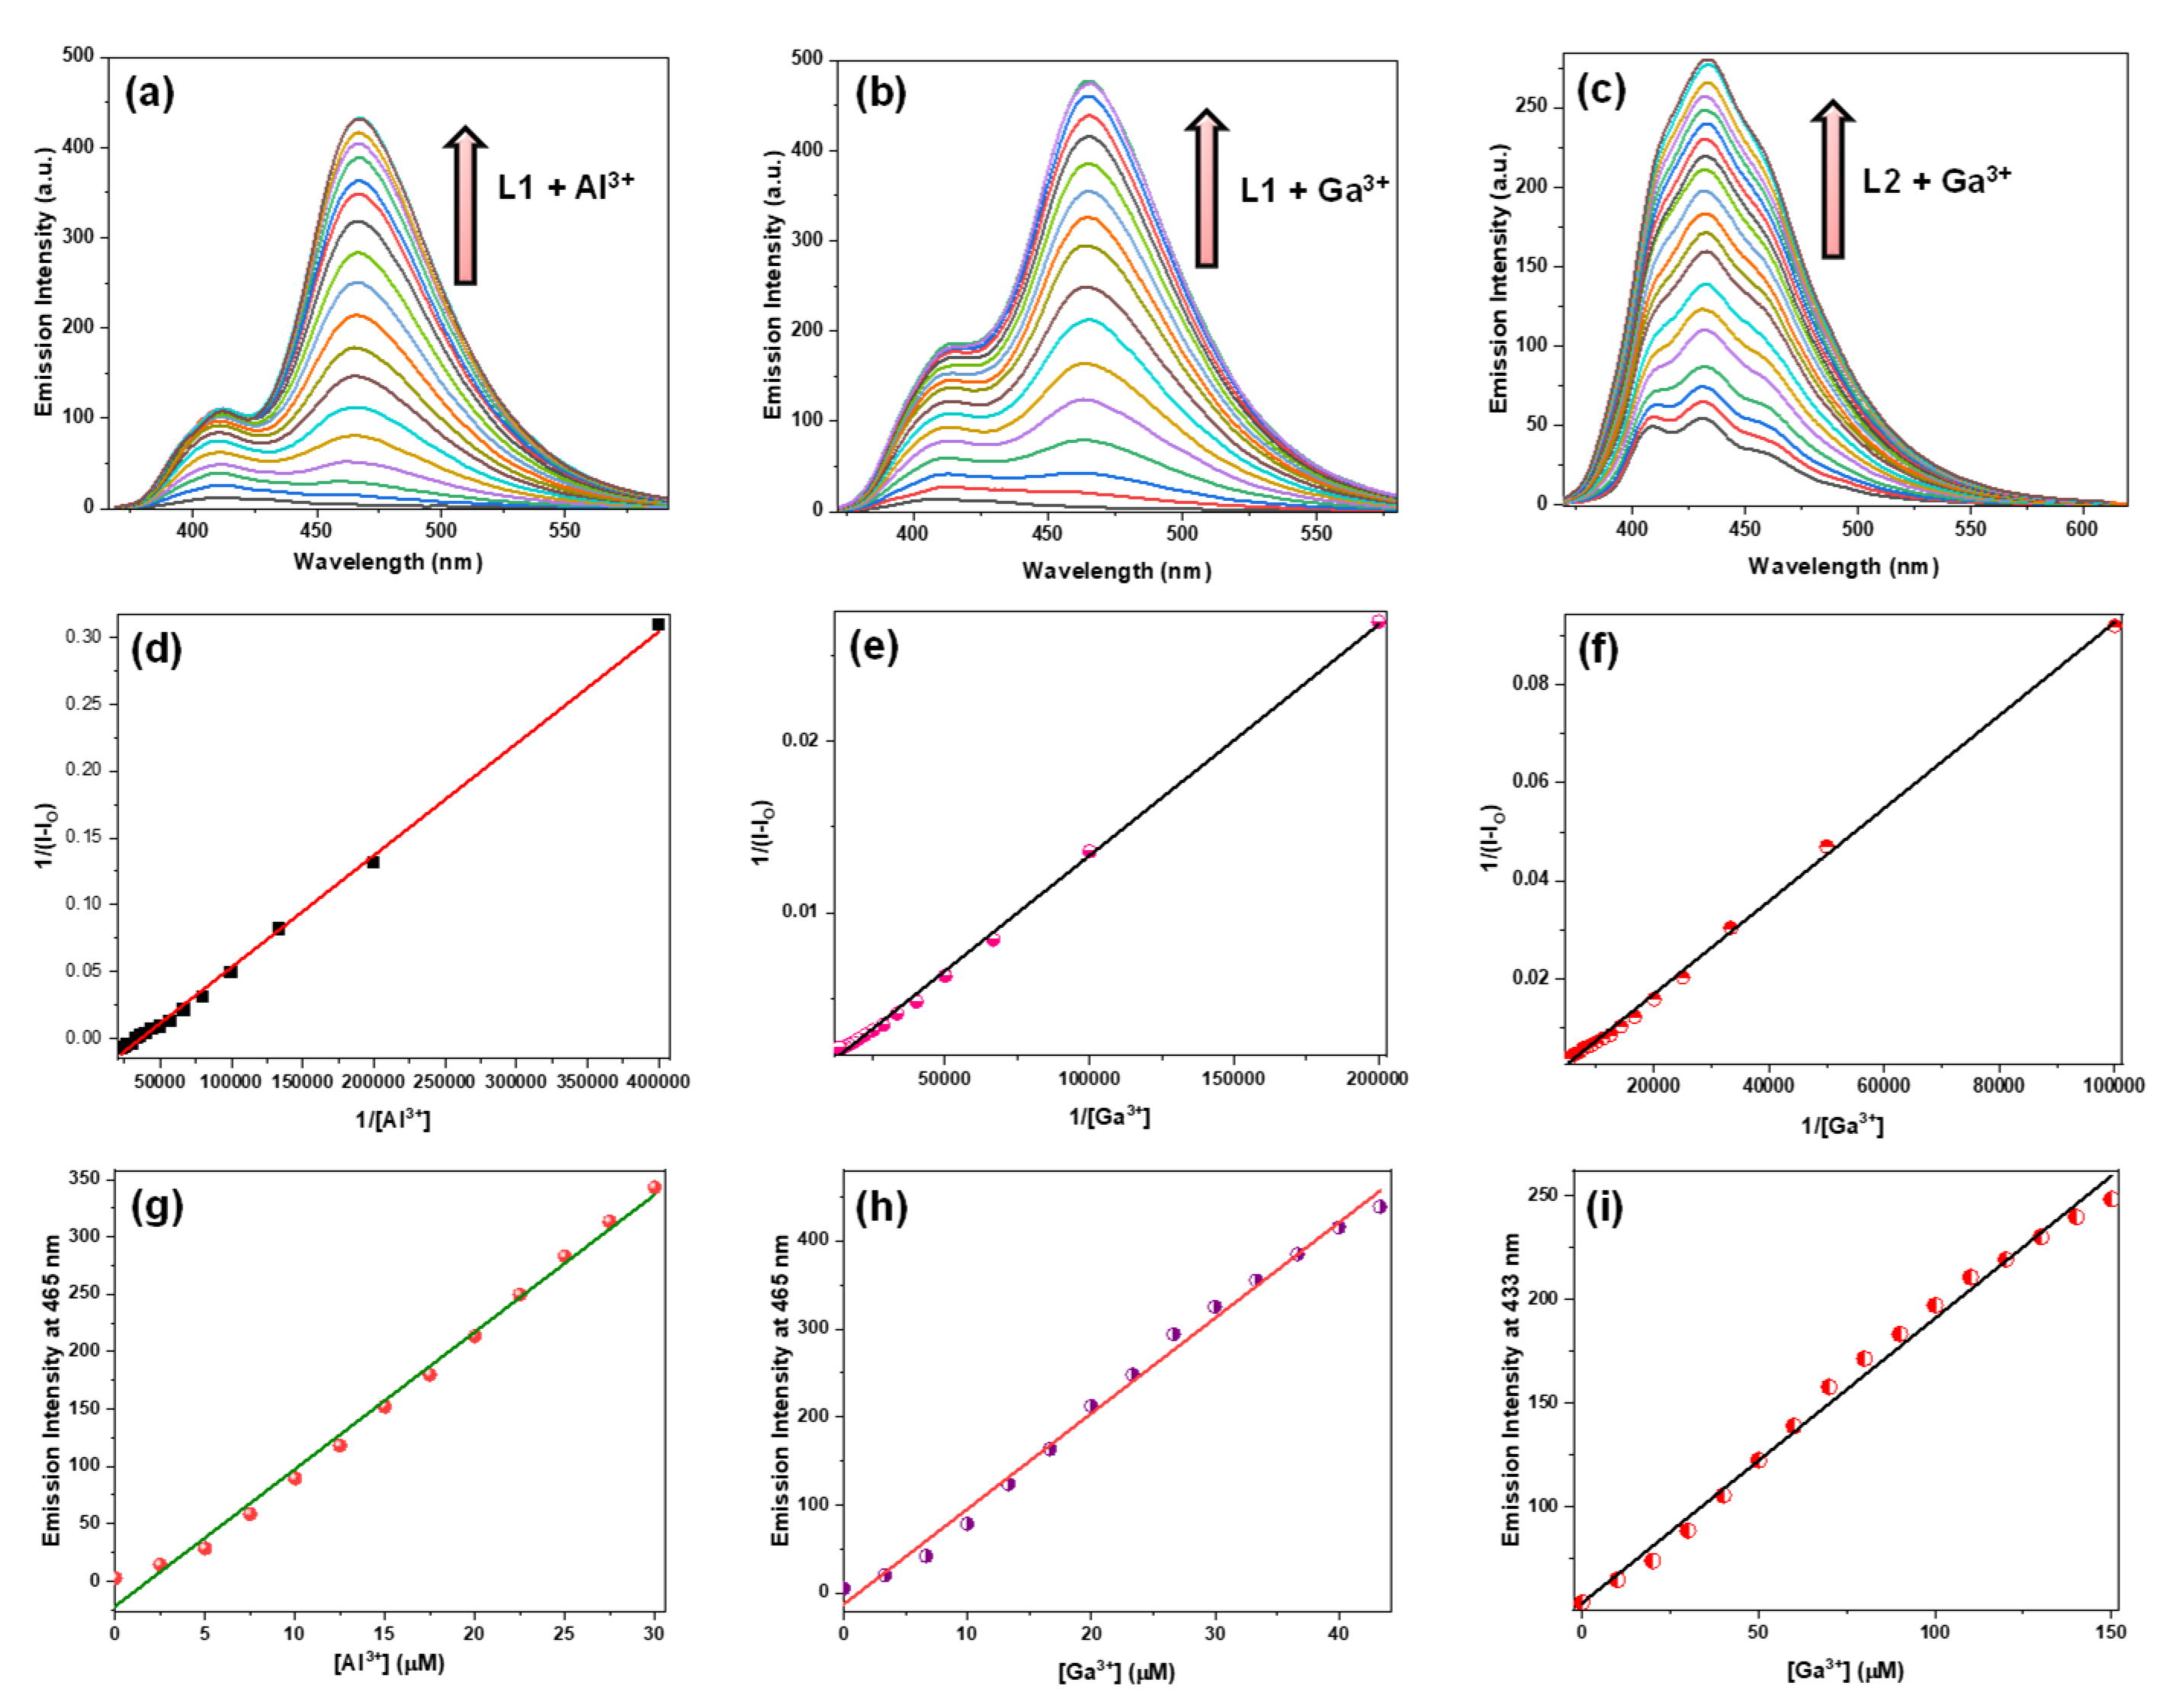
3.5. Detection of Al3+ and Ga3+ Ions by Fluorescence Spectral Studies

The emission spectra of both chemosensors L1 (c, 20 μM) and L2 (c, 20 μM) were measured in the presence of 2.5 equiv. of different metal ions: Ag+, Cd2+, Mn2+, Zn2+, Hg2+, K+, Na+, Co2+, Pd2+, Mg2+, Pb2+, Be2+, Ni2+, Sn2+, Li+, Cr3+, Fe2+, Fe3+, Cu2+, Al3+, Ga3+, and In3+ (Figure 4). In the case of L1, the emission spectral profile remained unchanged in the presence of nearly all the metal ions except for the Al3+ and Ga3+ ions. It is significant to note that L1 showed a ‘turn-on’ response in the presence of both Al3+ and Ga3+ ions with the observation of a new emission band at 465 nm. In contrast, L2 displayed an enhanced emission at 430 nm only in the presence of Ga3+ ions while no change was noted with the Al3+ ion as well as other metal ions [6]. Therefore, the chemosensor L2 was able to discriminate between the Al3+ and Ga3+ ions. The bar diagram nicely illustrates the change in the emission intensity of L1 and L2 after the addition of different metal ions (Figure 4c). It is important to mention that both chemosensors did not exhibit any spectral change with the In3+ ion.
To determine the extent of binding, emission spectral titrations were performed (Figure 5a–c). From the concentration variation plots, binding constants (Figure 5d–f) and detection limits (Figure 5g–i) were calculated by using the linear fitting methods. L1 displayed high binding constants of 3.58 × 10⁴ and 2.80 × 10⁴ M−1 for the Al3+ and Ga3+ ions, respectively [54,68]. Further, L1 exhibited remarkable detection limits of 0.19 and 0.22 μM for the Al3+ and Ga3+ ions, respectively [69]. On the other hand, L2 displayed a detection limit of 1.31 μM and a binding constant of 2.24 × 10³ M−1 towards the Ga3+ ion, which was impressive but a little inferior to that of L1. Importantly, both the detection limit and linear range of the metal ions exhibited by the present chemosensor were better than that of other chemosensors reported in the literature (Table S3).

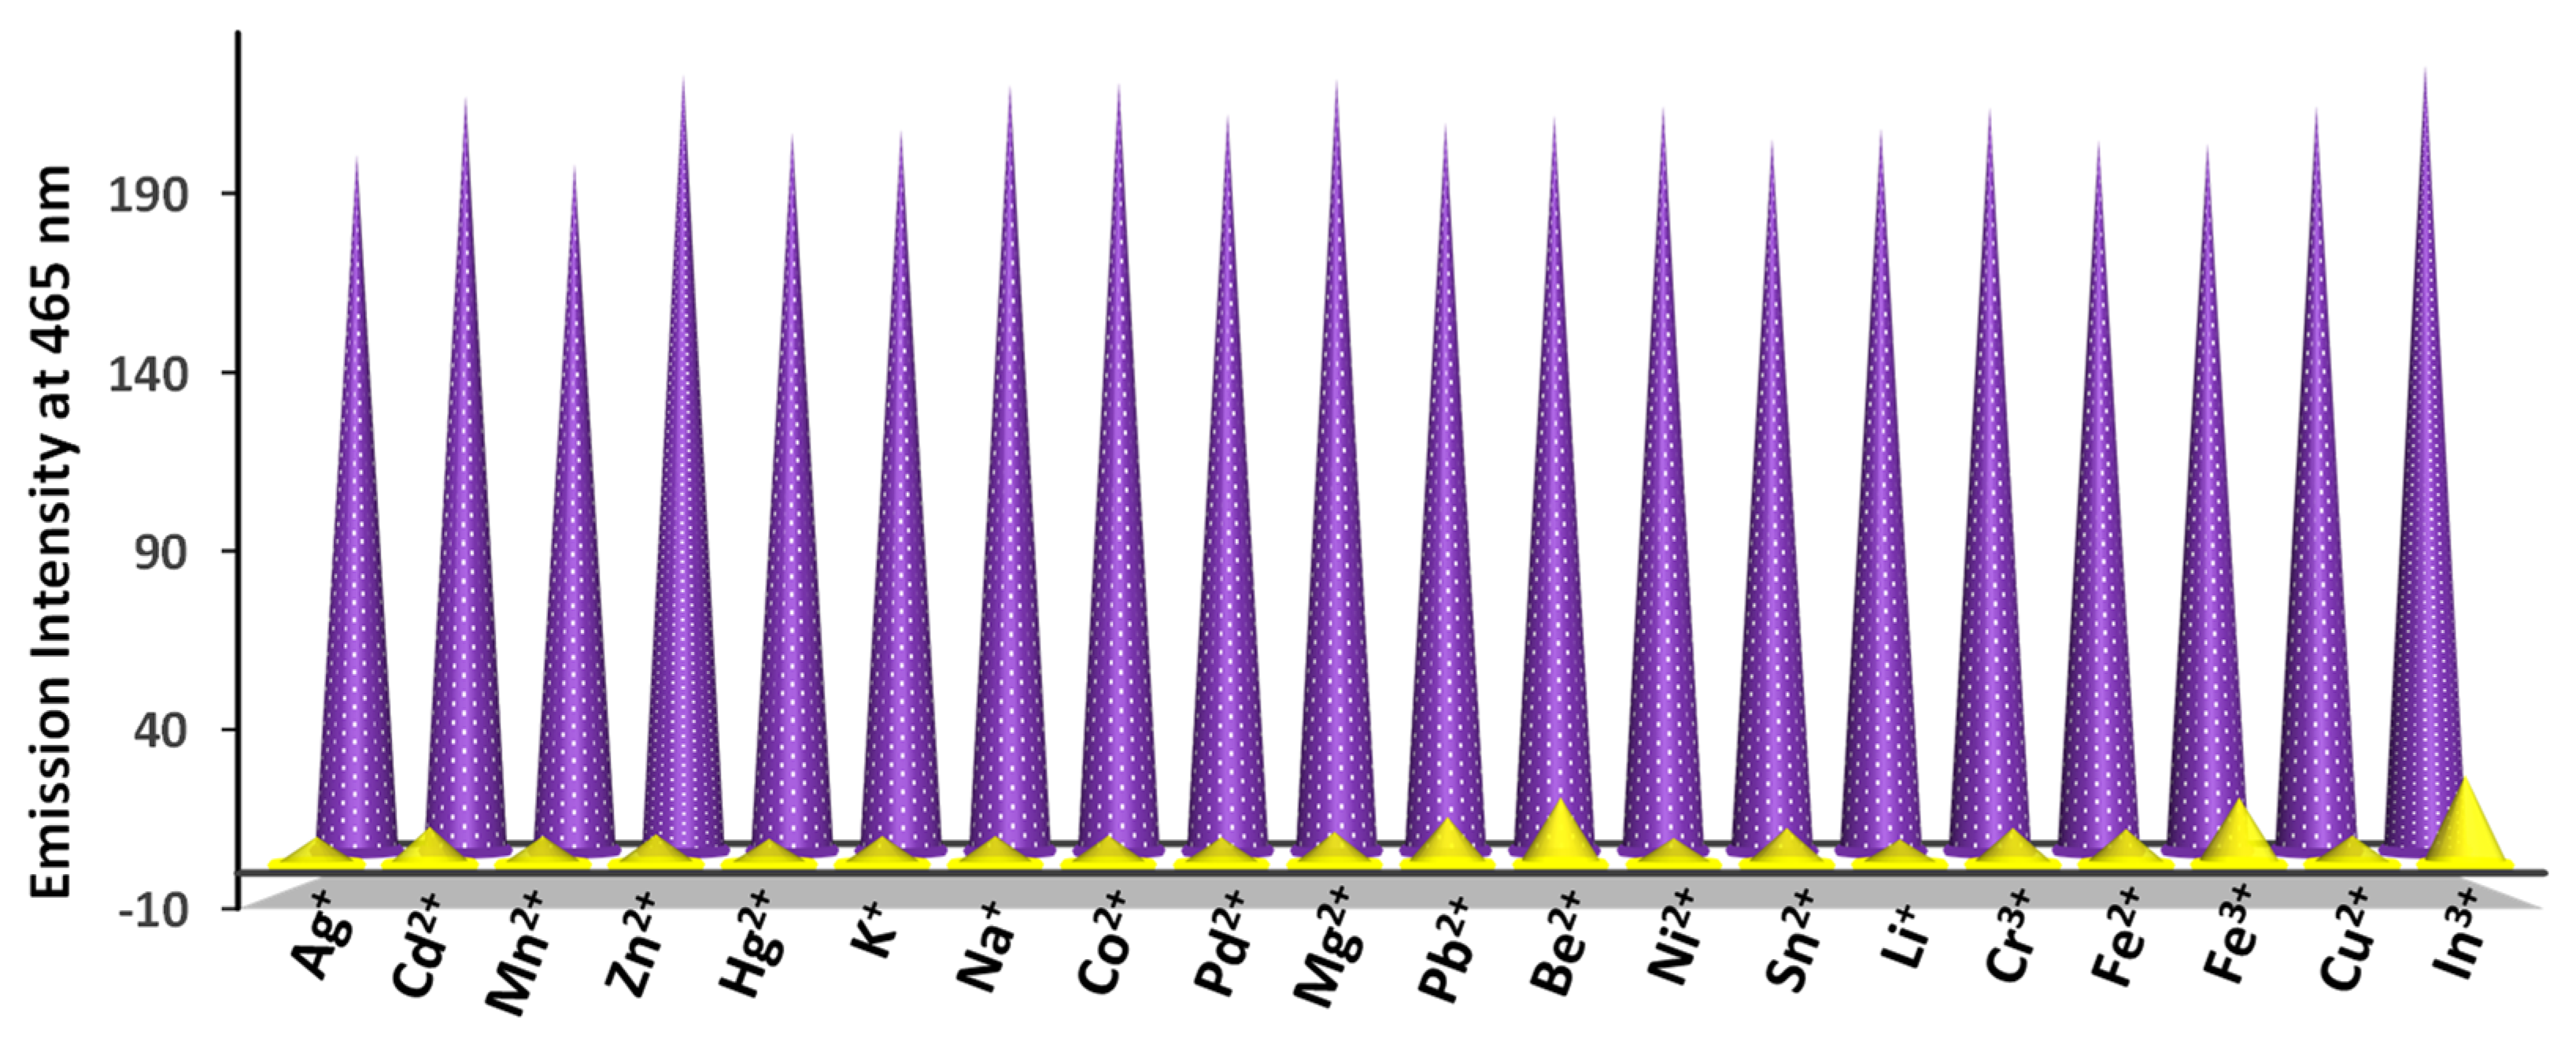
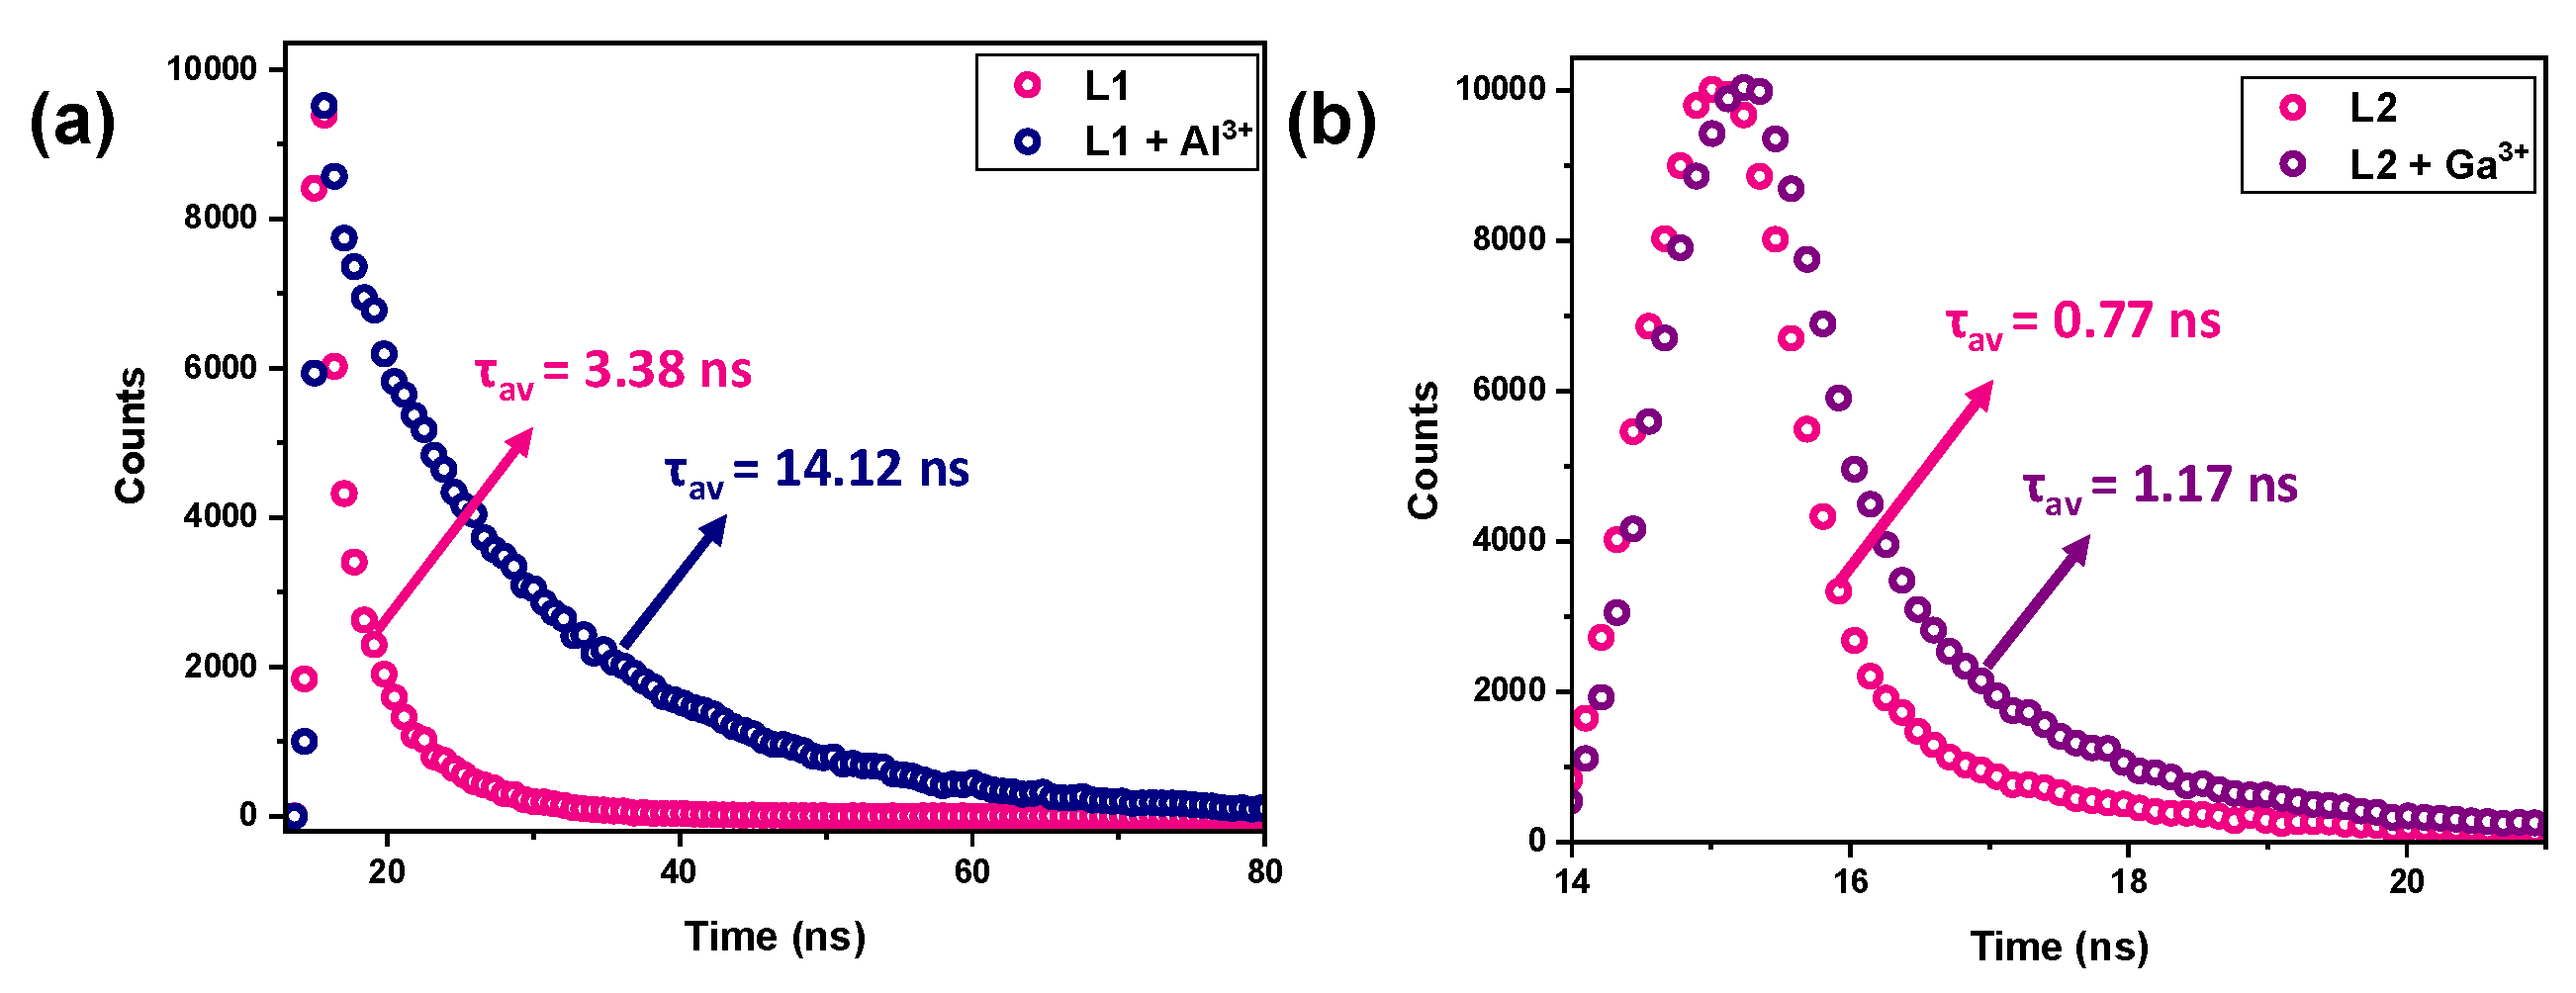
3.6. Selectivity, Lifetime, and Quantum Yield Measurements

For a chemosensor, selectivity towards a particular analyte is crucial as a chemosensor may have to identify a specific analyte in a competing environment [70,71]. Thus, the selectivity of L1 and L2 towards Al3+/Ga3+ ions in the presence of other competing metal ions was attempted by studying the competitive binding studies (Figure 6 and Figure S18). The emission spectra of L1 and L2 were recorded with Al3+/Ga3+ ions in the presence of the equimolar concentration of other metal ions. Both for L1 and L2, no measurable change in the emission intensity was observed towards the detection of Al3+/Ga3+ ions in the presence of different metal ions including In3+ ions. Notably, for L2, the emission intensity was unaffected even in the presence of Al3+ ions. It is, therefore, evident that both L1 and L2 were highly selective for Al3+/Ga3+ ions even in the presence of assorted metal ions.
The excitation energy of a chemosensor may change after its interaction with an analyte. Hence, the excited state behavior of L1 and L2 in the absence and presence of Al3+/Ga3+ ions was evaluated through the lifetime measurements [70]. L1 exhibited a biexponential decay with an average lifetime (τav) of 3.38 ns. In the presence of Al3+ and Ga3+ ions, τav increased to 14.12 and 13.62 ns, respectively (Figure 7a, Figure S19, and Table S2). A similar four-fold enhancement in τav of L1 in the presence of Al3+ and Ga3+ ions suggested that both these ions offered a similar mode of interaction with L1. However, L2 displayed a triexponential decay with τav of 0.77 ns, which increased 1.5-fold times to 1.17 ns in the presence of Ga3+ ions (Figure 7b). The quantum yields of L1 and L2 were also measured in the absence and presence of Al3+/ Ga3+ ions by taking Quinine sulfate (ΦF = 0.54) as a reference [55]. The resultant ΦF for L1, L1−Al3+, and L1−Ga3+ were found to be 0.008, 0.065, and 0.062, respectively. Thus, enhancement in the quantum yield was approximately eight-fold both for the Al3+ and Ga3+ ions. The calculated ΦF for L2−Ga3+ (0.010) displayed a 2.5-fold enhancement when compared to L2 (0.003). These results further support the fluorescence lifetime studies. Collectively, all studies suggest that the binding mechanisms of L1 and L2 towards the Al3+/Ga3+ ions were different.

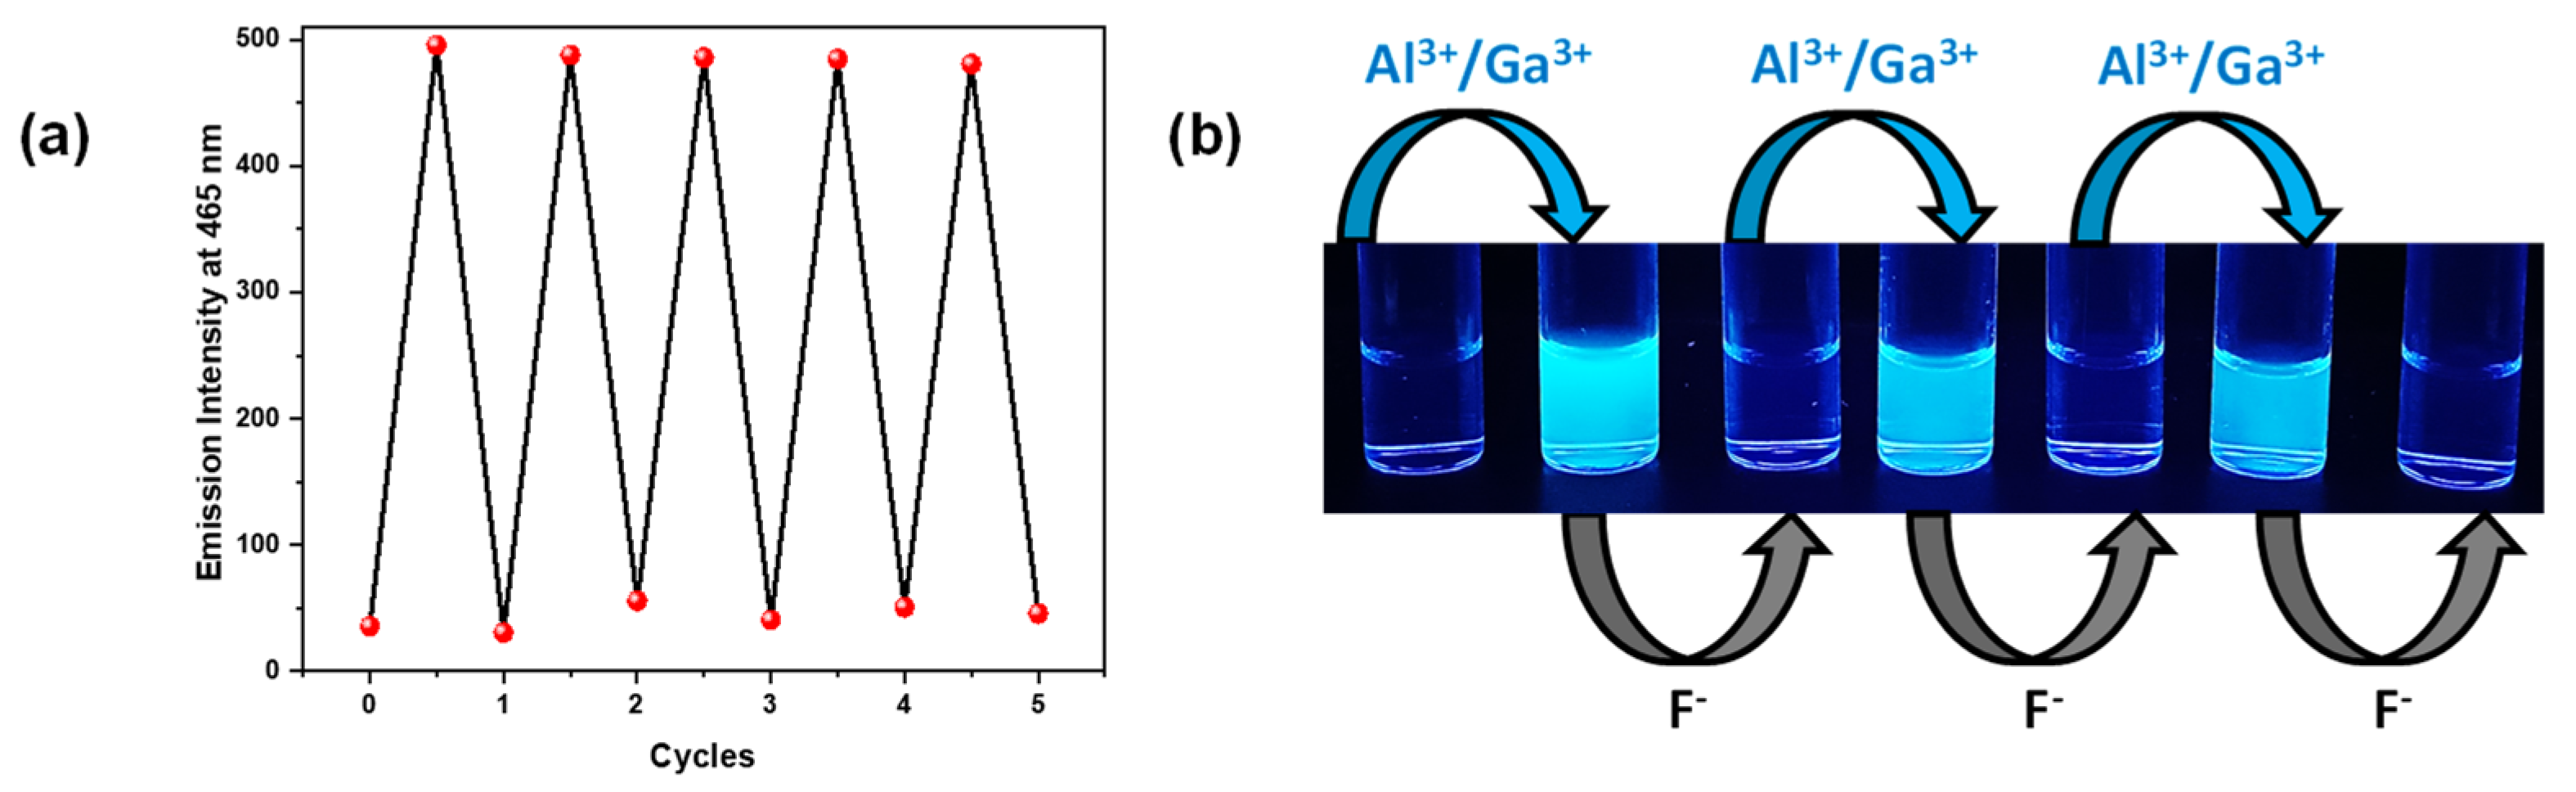
3.7. Reversibility Studies

The reversibility of a chemosensor is an essential requirement that endows it for practical applications. The reversibility of L1–Al3+ and L1–Ga3+ complexes was checked with various anions; however, the reversibility was only achieved by the addition of fluoride ions (as NaF) (Figure 8) [6]. In fact, the F ion was able to show multiples cycles of reversibility without any potential loss in the chemical and emission behavior of L1. Such a fact suggests that the F ion removed the Al3+ and Ga3+ ions from their metal complexes while generating free L1 and were ready for the next round of detection of Al3+ and Ga3+ ions.

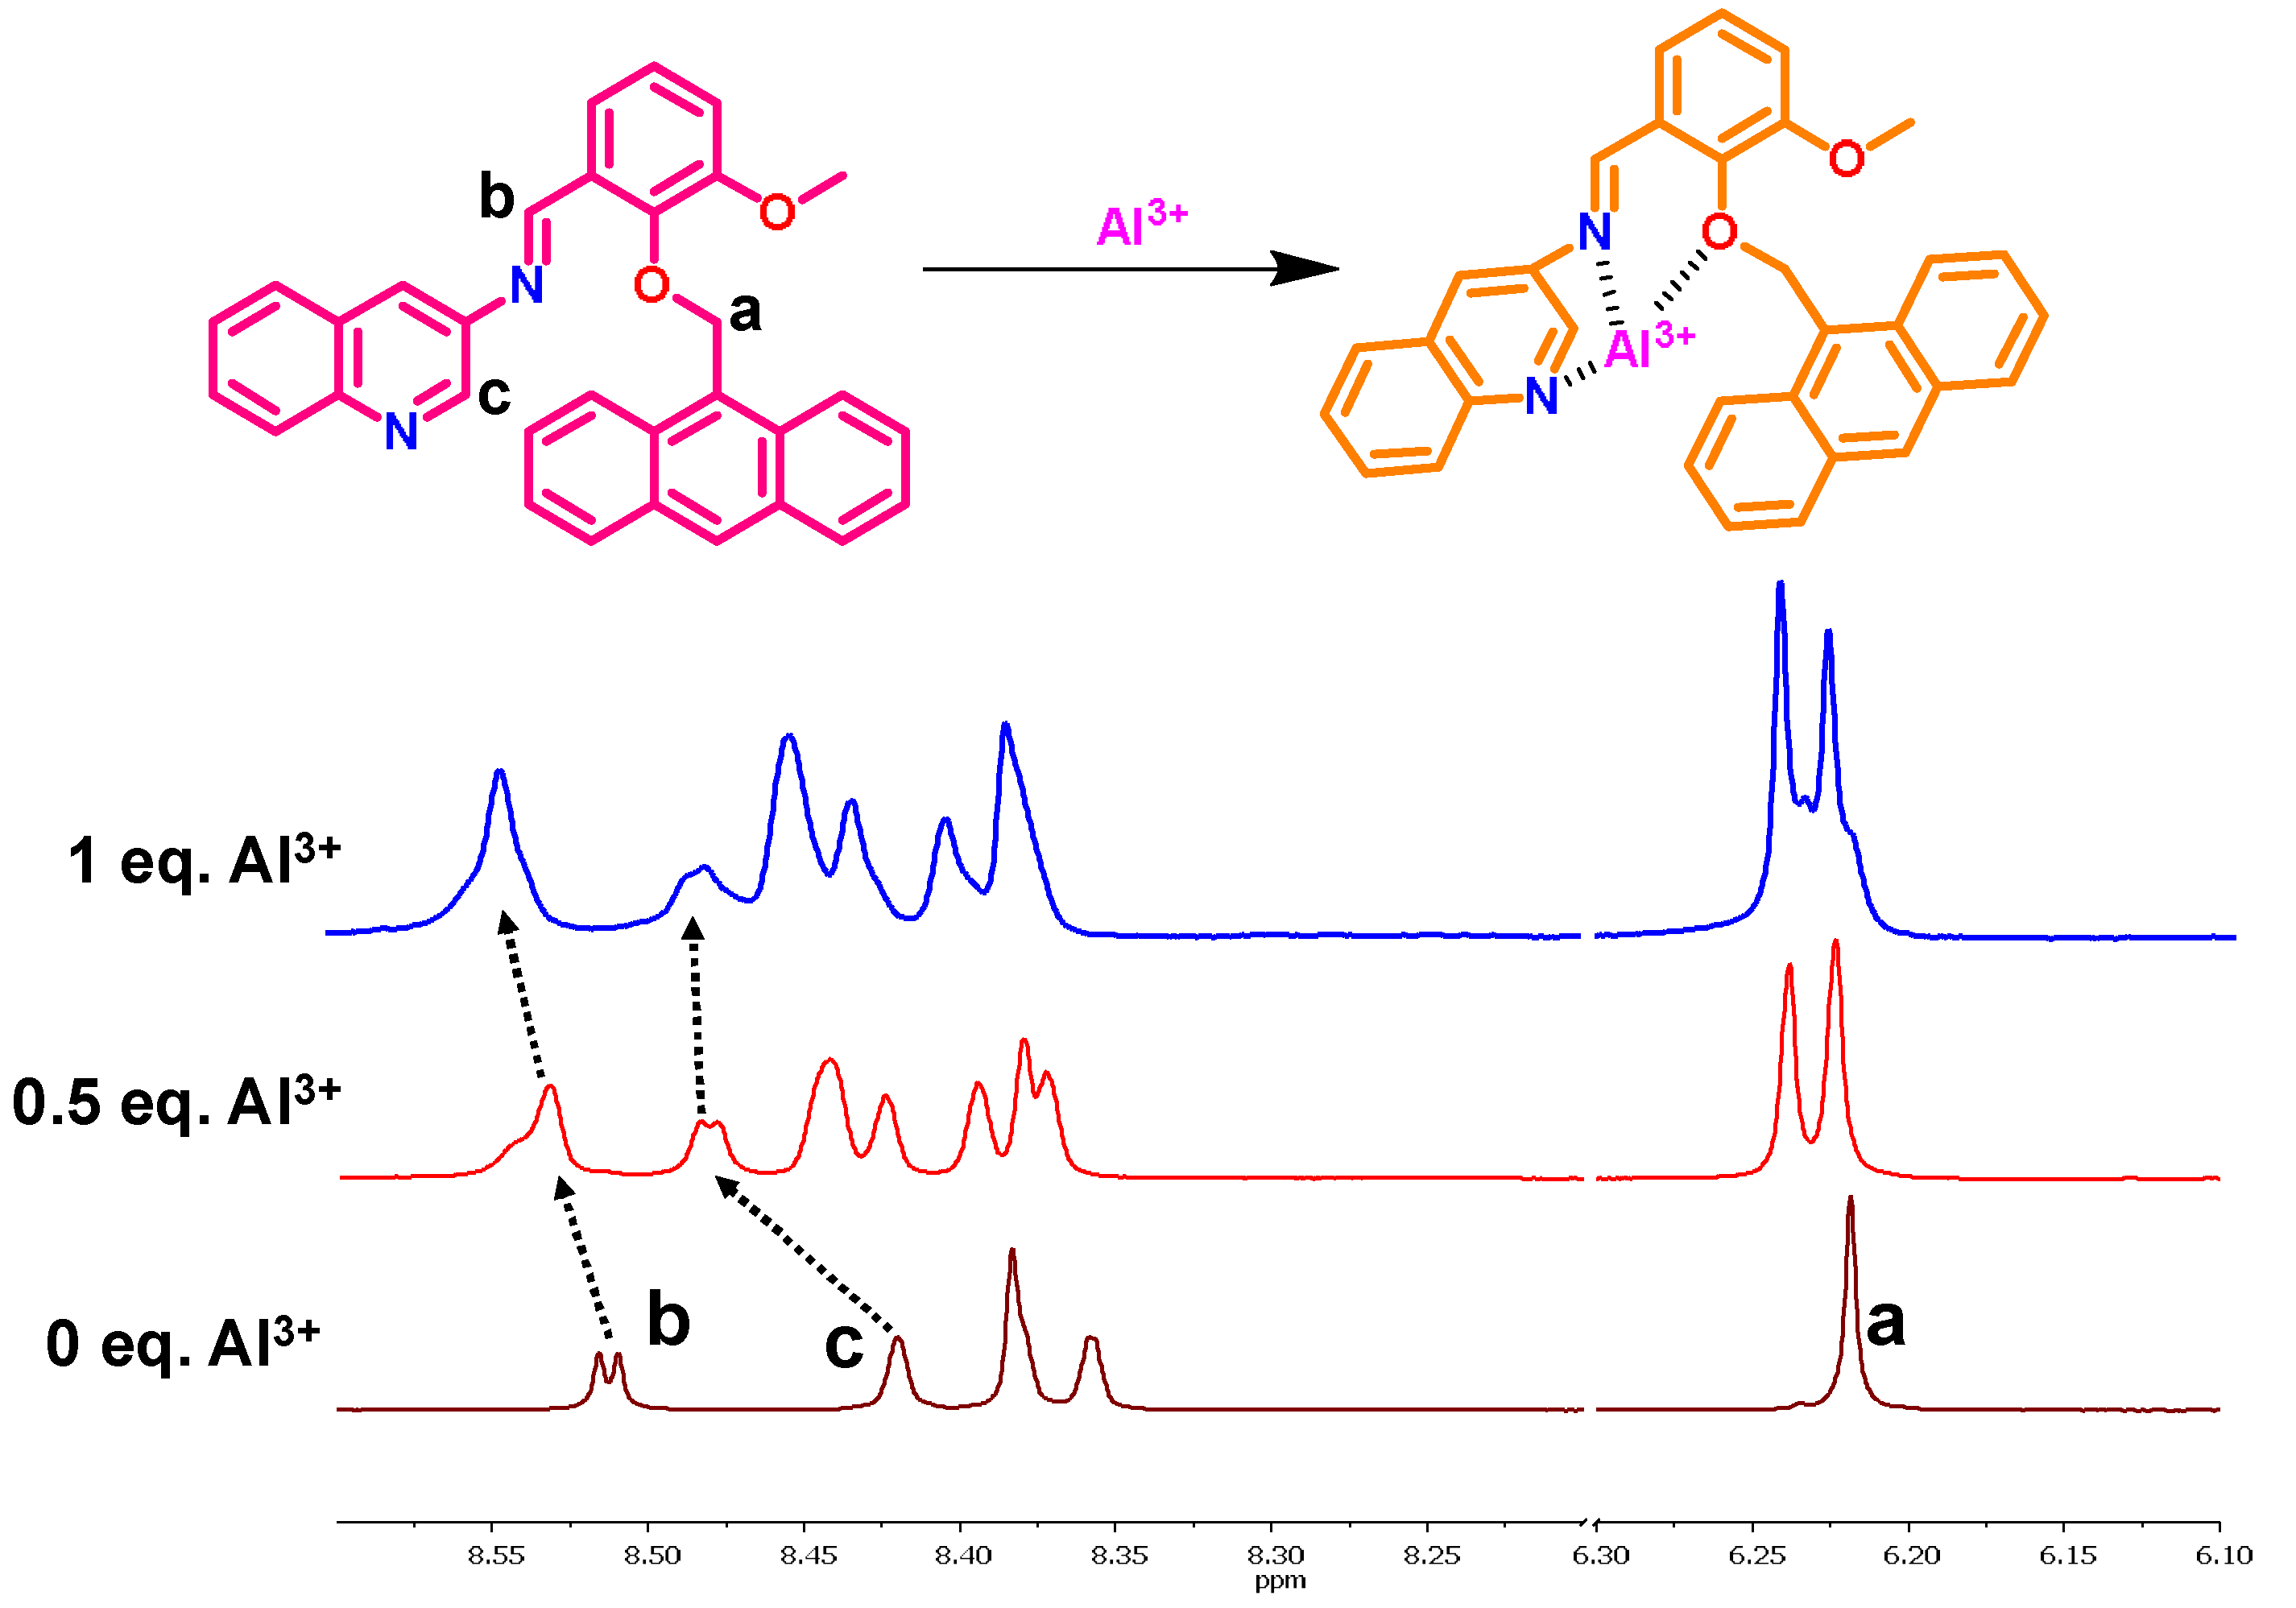
3.8. Mode of Binding
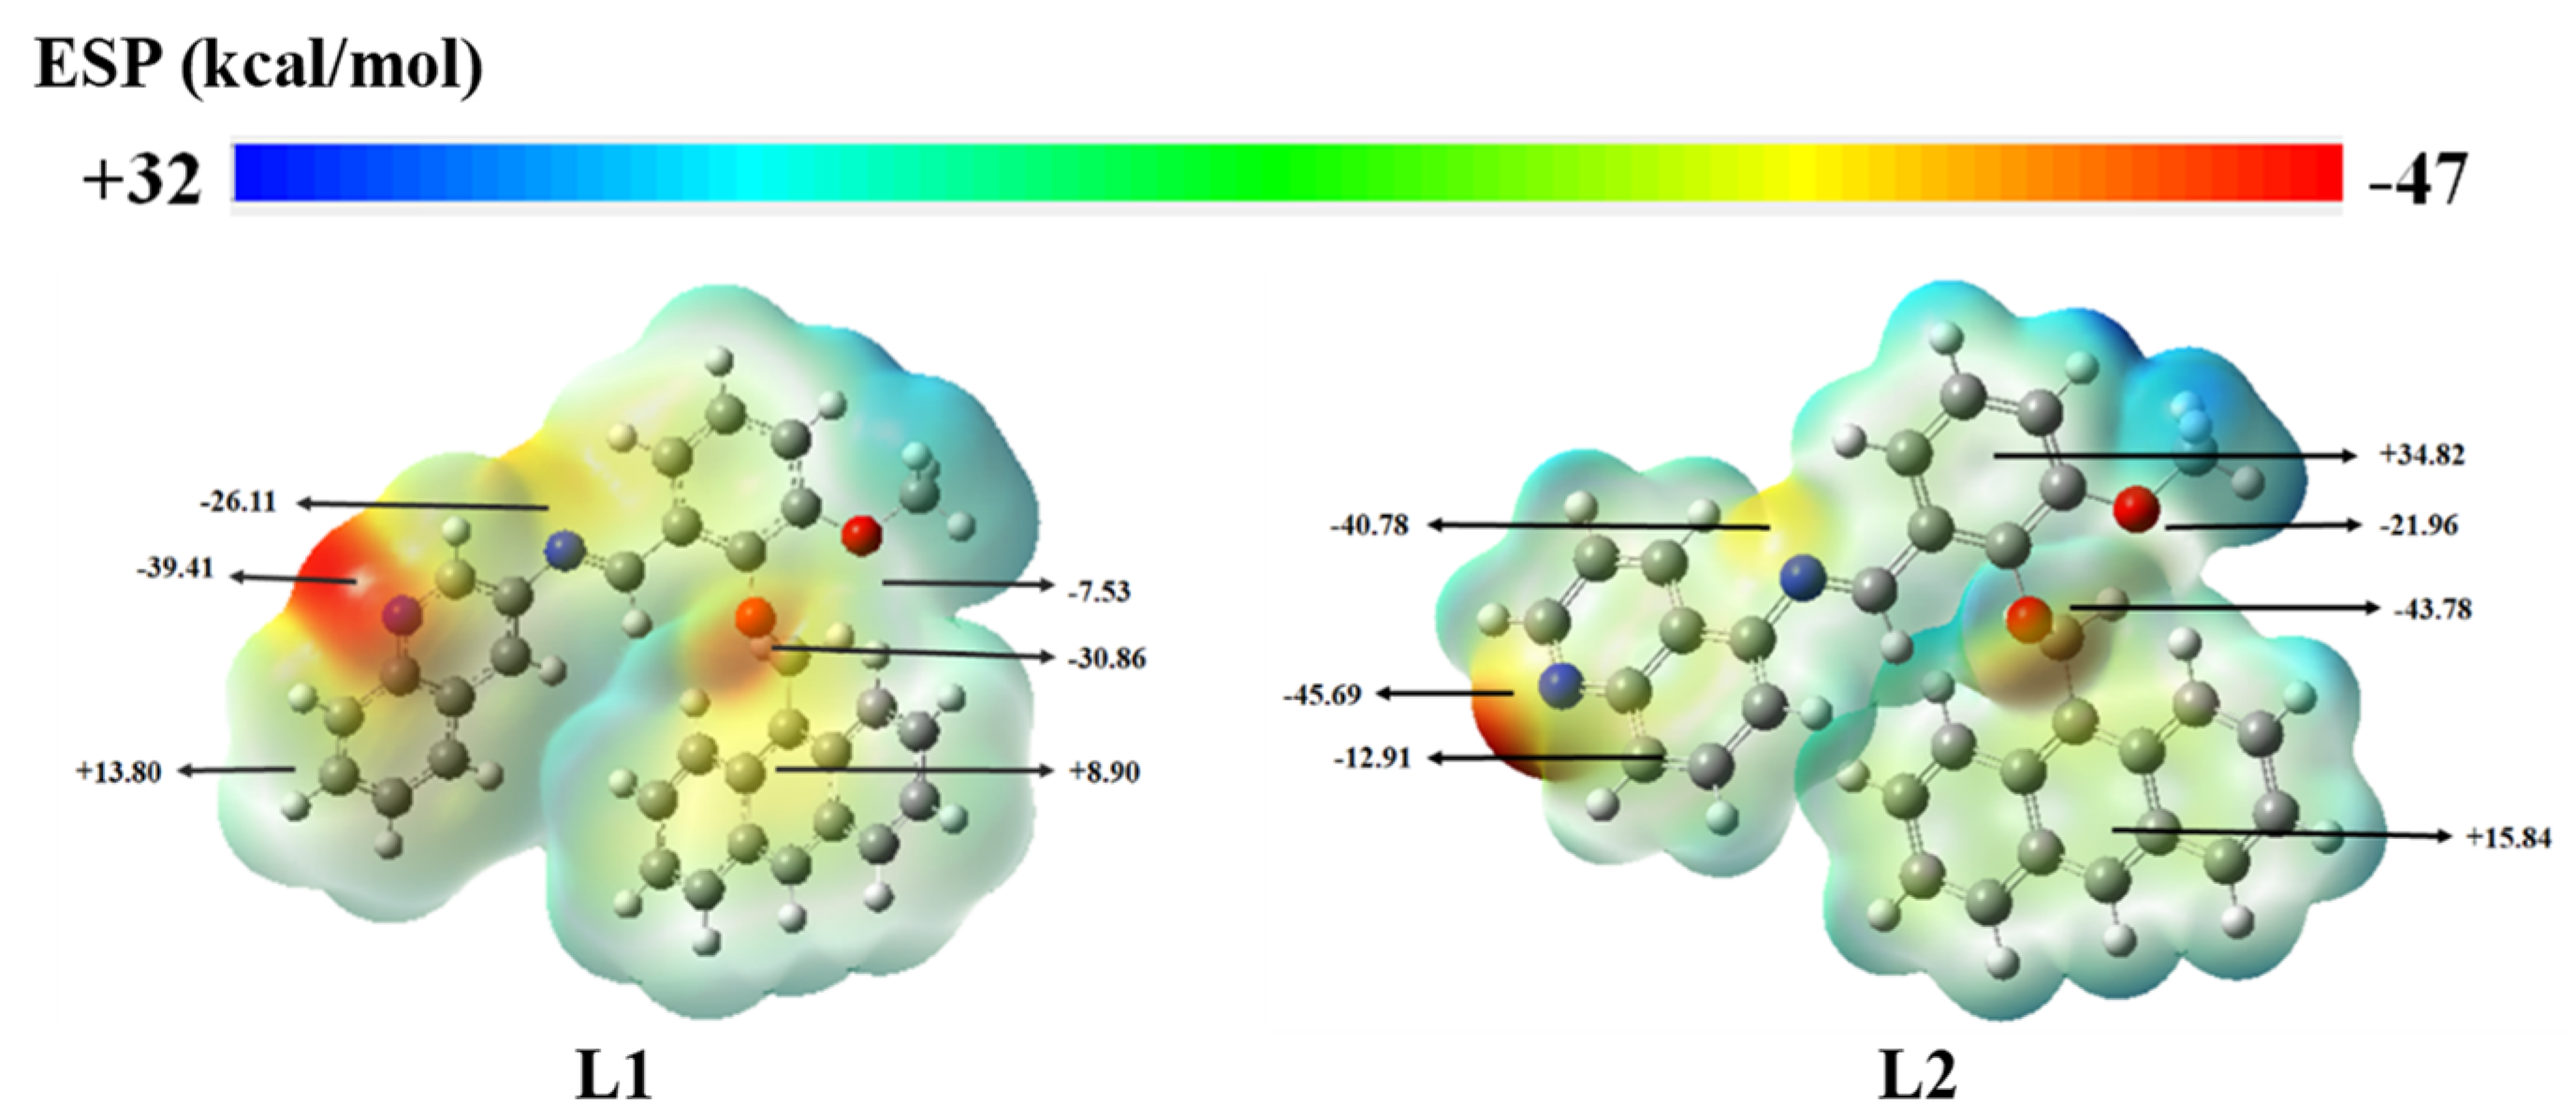
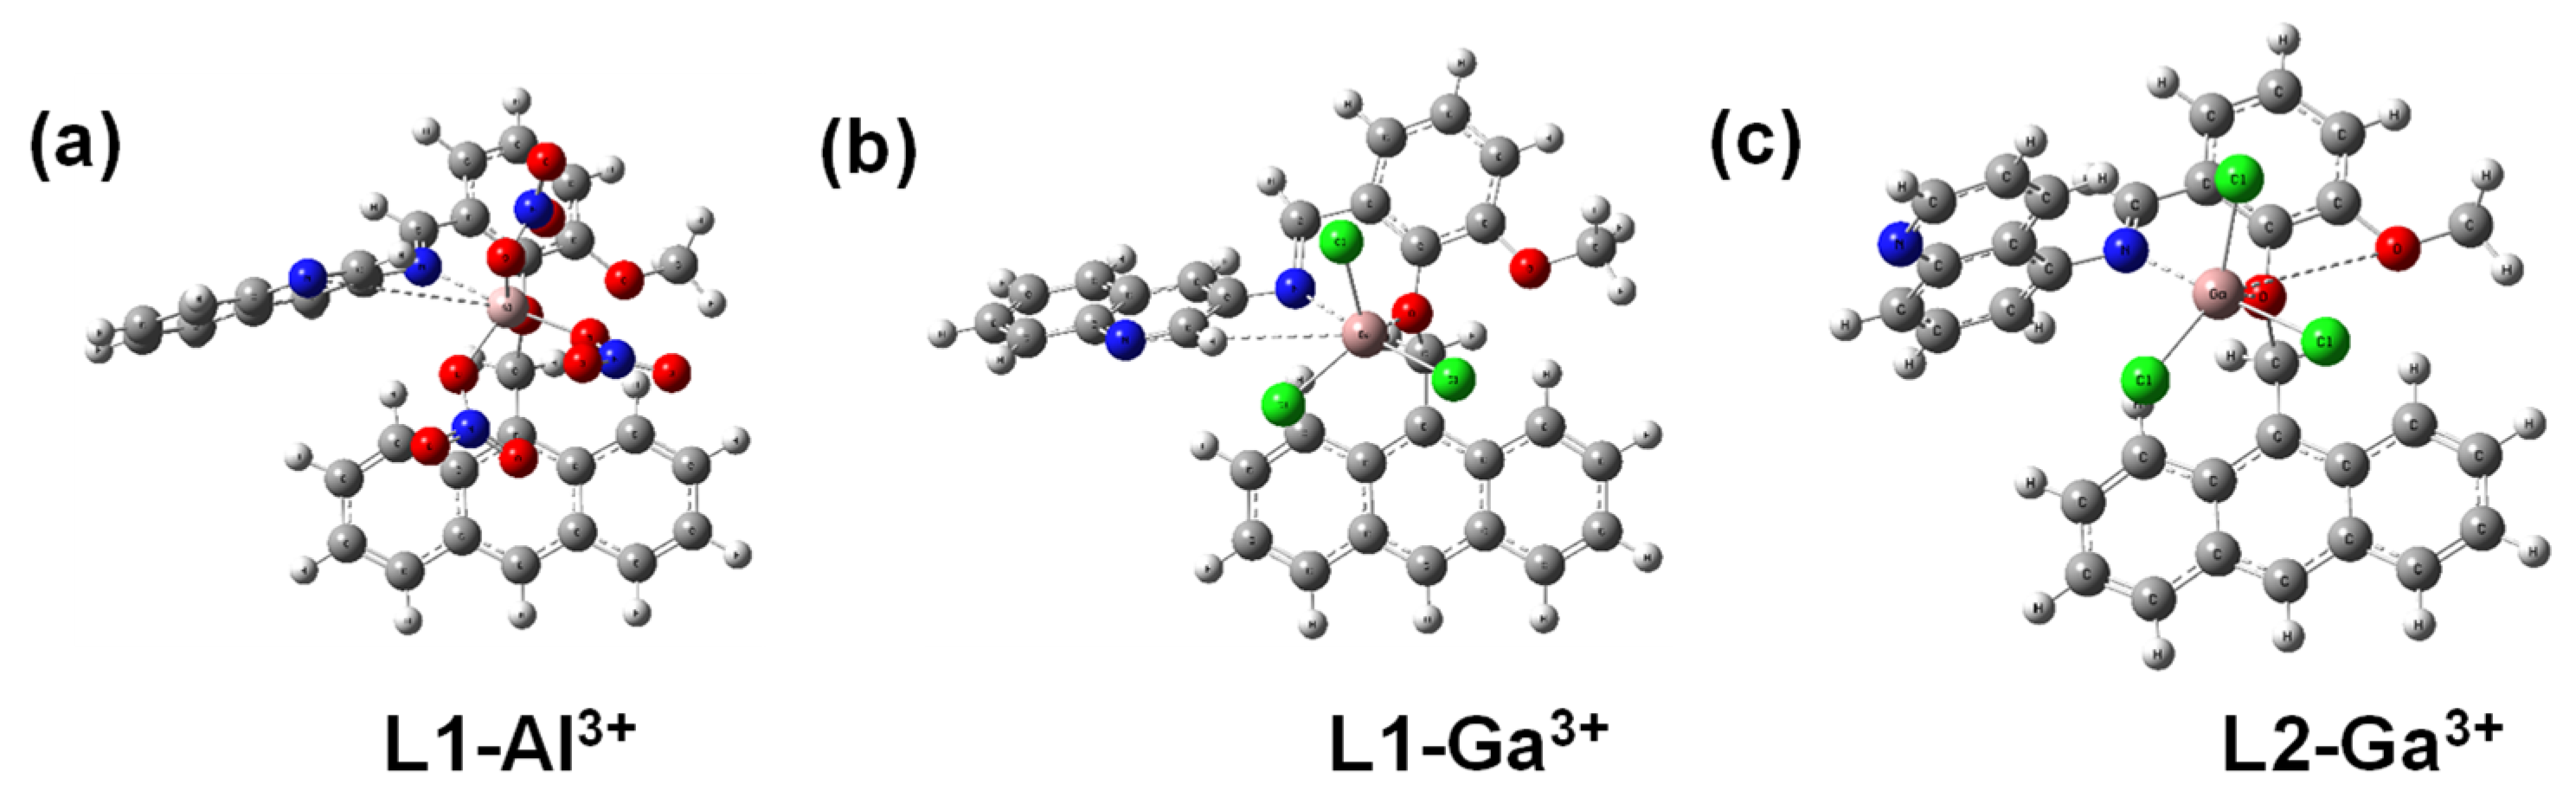
The absorption and emission spectral studies confirmed the interaction and/or binding of Al3+/Ga3+ ions to L1 and L2. Both chemosensors L1 and L2 offer three types of functional groups: phenolic-OR (R = -CH2- or -CH3), imine-N, and quinoline-N. Both Al3+ and Ga3+ ions are hard acids and are thus likely to interact and/or bind preferentially with the phenolic-OR followed by imine-N [4,14]. For positional isomers L1 and L2, the position of the quinoline-N is likely to play a crucial role. In the case of L1, the binding of a metal ion through phenolic-OR (R = -CH2-), imine-N, and quinoline-N results in the formation of both six- and five-membered chelate rings and supports chelation-enhanced fluorescence. It is important to mention that a metal ion (Al3+/Ga3+) is situated significantly above (approx. 2.7–2.8 Å) the plane of L1 to facilitate the simultaneous coordination of phenolic-OR, imine-N, and quinoline groups, as depicted by the DFT studies (vide infra). Due to the formation of such chelate rings, L1 achieves structural rigidity while the intramolecular bond rotation of the imine-N group becomes restricted (Scheme 3). At the same time, excited-state electron transfer from imine-N and phenolic-OR to quinoline rings and anthracenyl moieties also gets inhibited. Collectively, these points suppress the PET [72,73]. Moreover, as PET is subdued, the fluorescence resonance energy transfer (FRET) takes place between the anthracene and quinoline rings [2]. Therefore, as a result of the turning off of the PET process and turning-on of CHEF and FRET, the emission intensity of L1 increases in the presence of Al3+/Ga3+ ions.
All studies pointed to a similar mode of binding of both Al3+ and Ga3+ ions with L1. To further confirm the binding mode of L1, an 1H NMR spectral titration with Al3+ ions was performed (Figure 9 and Figure S20). When sequentially adding one equivalent of Al3+ ions to a solution of L1, imine-N, phenolic-OR (R = -CH2-), and quinoline-N were shifted downfield, confirming their involvement in binding to the Al3+ ion. Moreover, the quinoline ring protons also shifted downfield, thus further confirming their role in binding. Importantly, both -CH2- and -CH3 protons were completely resolved, indicating a difference in their chemical environment after the binding of the Al3+ ion. Further, anthracene ring protons were also perturbed after the potential coordination of an Al3+ ion. Notably, various aromatic protons were found to split to give multiplets. We propose that imine-N, phenolic-OR, and quinoline-N form a pocket in which a metal ion nicely resides. Such a binding mode affects the chemical environment of nearby arene rings and hence multiplets were observed [4].
In L2, the position of quinoline-N was changed, which is now anti to the imine-N group. As a result, the formation of a common binding pocket was not possible. It is therefore proposed that a larger Ga3+ ion is able to interact with both phenolic-OR (R = -CH2-, -CH3) groups and imine-N. As the Al3+ ion is smaller in size, it could not interact with all three groups, and hence L2 did not show its recognition. The enhanced emission was observed due to the suppression of PET and ‘turn-on’ of CHEF. As the quinoline ring was not involved in binding to a Ga3+ ion, FRET was not operative [74,75]. This proposition was further confirmed by the 1H NMR spectral studies where protons of both phenolic-OR and imine-N displayed a downfield shift whereas both quinoline and anthracene rings remained unaffected (Figure S21).
To characterize the actual species formed between L1 and Al3+/Ga3+ ions, ESI+ mass spectra were recorded. The mass spectra of L1−Al3+ species displayed a peak at m/z 673.27 which corresponded to [L1 + Al3+ + 2NO3 + OCH3 + Na+]+. On the other hand, L1−Ga3+ species showed a peak at m/z 669.30 corresponding to [L1 + Ga3+ + 3OCH3 + K+]+ (Figures S22 and S23). The sources of the NO3 and OCH3 ions were from an aluminum precursor, Al(NO3)3, and a CH3OH solvent, respectively. It is important to note that, for both species, the isotopic distribution patterns nicely matched that of the simulated patterns. The mass spectra further asserted a 1:1 metal binding stoichiometry to L1 [58]. The said binding stoichiometry was further confirmed by Job’s plot for both Al3+ and Ga3+ ions (Figure S24) [59].

3.9. DFT Studies

All chemical structures were optimized by the DFT using the suitable basis sets and functional (see Table S4 for the Cartesian coordinates). The molecular electrostatic potential surface (MESP) maps are often employed for the qualitative investigation of the charge distribution in a system. Hence, the optimized structures of chemosensors L1 and L2 were used to study the electropositive and electronegative centers. As shown in Figure 10, the electrostatic potential was scaled between −47.0 and +32.0 kcal/mol for both L1 and L2 with their approximate values marked. Notably, both oxygen and nitrogen centers in L1 and L2 were relatively more electronegative as depicted from the red-colored region around them. The MESP maps therefore suggest that the metal ions can bind with these groups: quoniline-N, imine-N, and phenolic-OR (-CH2-).
The experimental results show that L1 exhibited FRET with both Al3+ and Ga3+ ions; however, FRET was not observed for L2 with the Ga3+ ion. In order to obtain insights about the differences in their binding modes, the structures of chemosensor–metal complexes were optimized (Figure 11). The DFT optimized structures of L1–Al3+, L1–Ga3+, and L2–Ga3+ were in line with the experimental results. Notably, in the case of L1, both the Al3+ and Ga3+ ions were situated significantly above (approx. 2.7–2.8 Å) the plane of the chemosensor to facilitate the simultaneous coordination of all binding sites. The optimized structure of L2–Ga3+ confirmed the involvement of the phenolic-OCH3 group (ESP: −21.96 kcal/mol) in binding in addition to the phenolic-OCH2- group. In contrast, quinoline-N was situated farthest at 6.19 Å from the Ga3+ ion and thus remained uncoordinated. To better understand the electron density shifts, contour plots of the frontier molecular orbitals (FMOs) from HOMO-4 to LUMO+4 were visualized (Figure S25; see Figure S26 for a magnified view of the HOMO-1 to LUMO+1 orbitals). The electron density was found to be localized on the anthracene ring in HOMO but shifted to the quinoline ring in LUMO. In addition, the HOMO-LUMO band gap energy for L1 (3.42 eV) and L2 (3.64 eV) decreased to 2.42, 2.85, and 3.44 eV corresponding to L1–Al3+, L1–Ga3+, and L2–Ga3+, respectively (see Table S5 for energy values (in eV) for all FMOs). Thus, a decrease in the energy gaps upon metal complexation further supports the chemosensing behavior of these chemosensors.

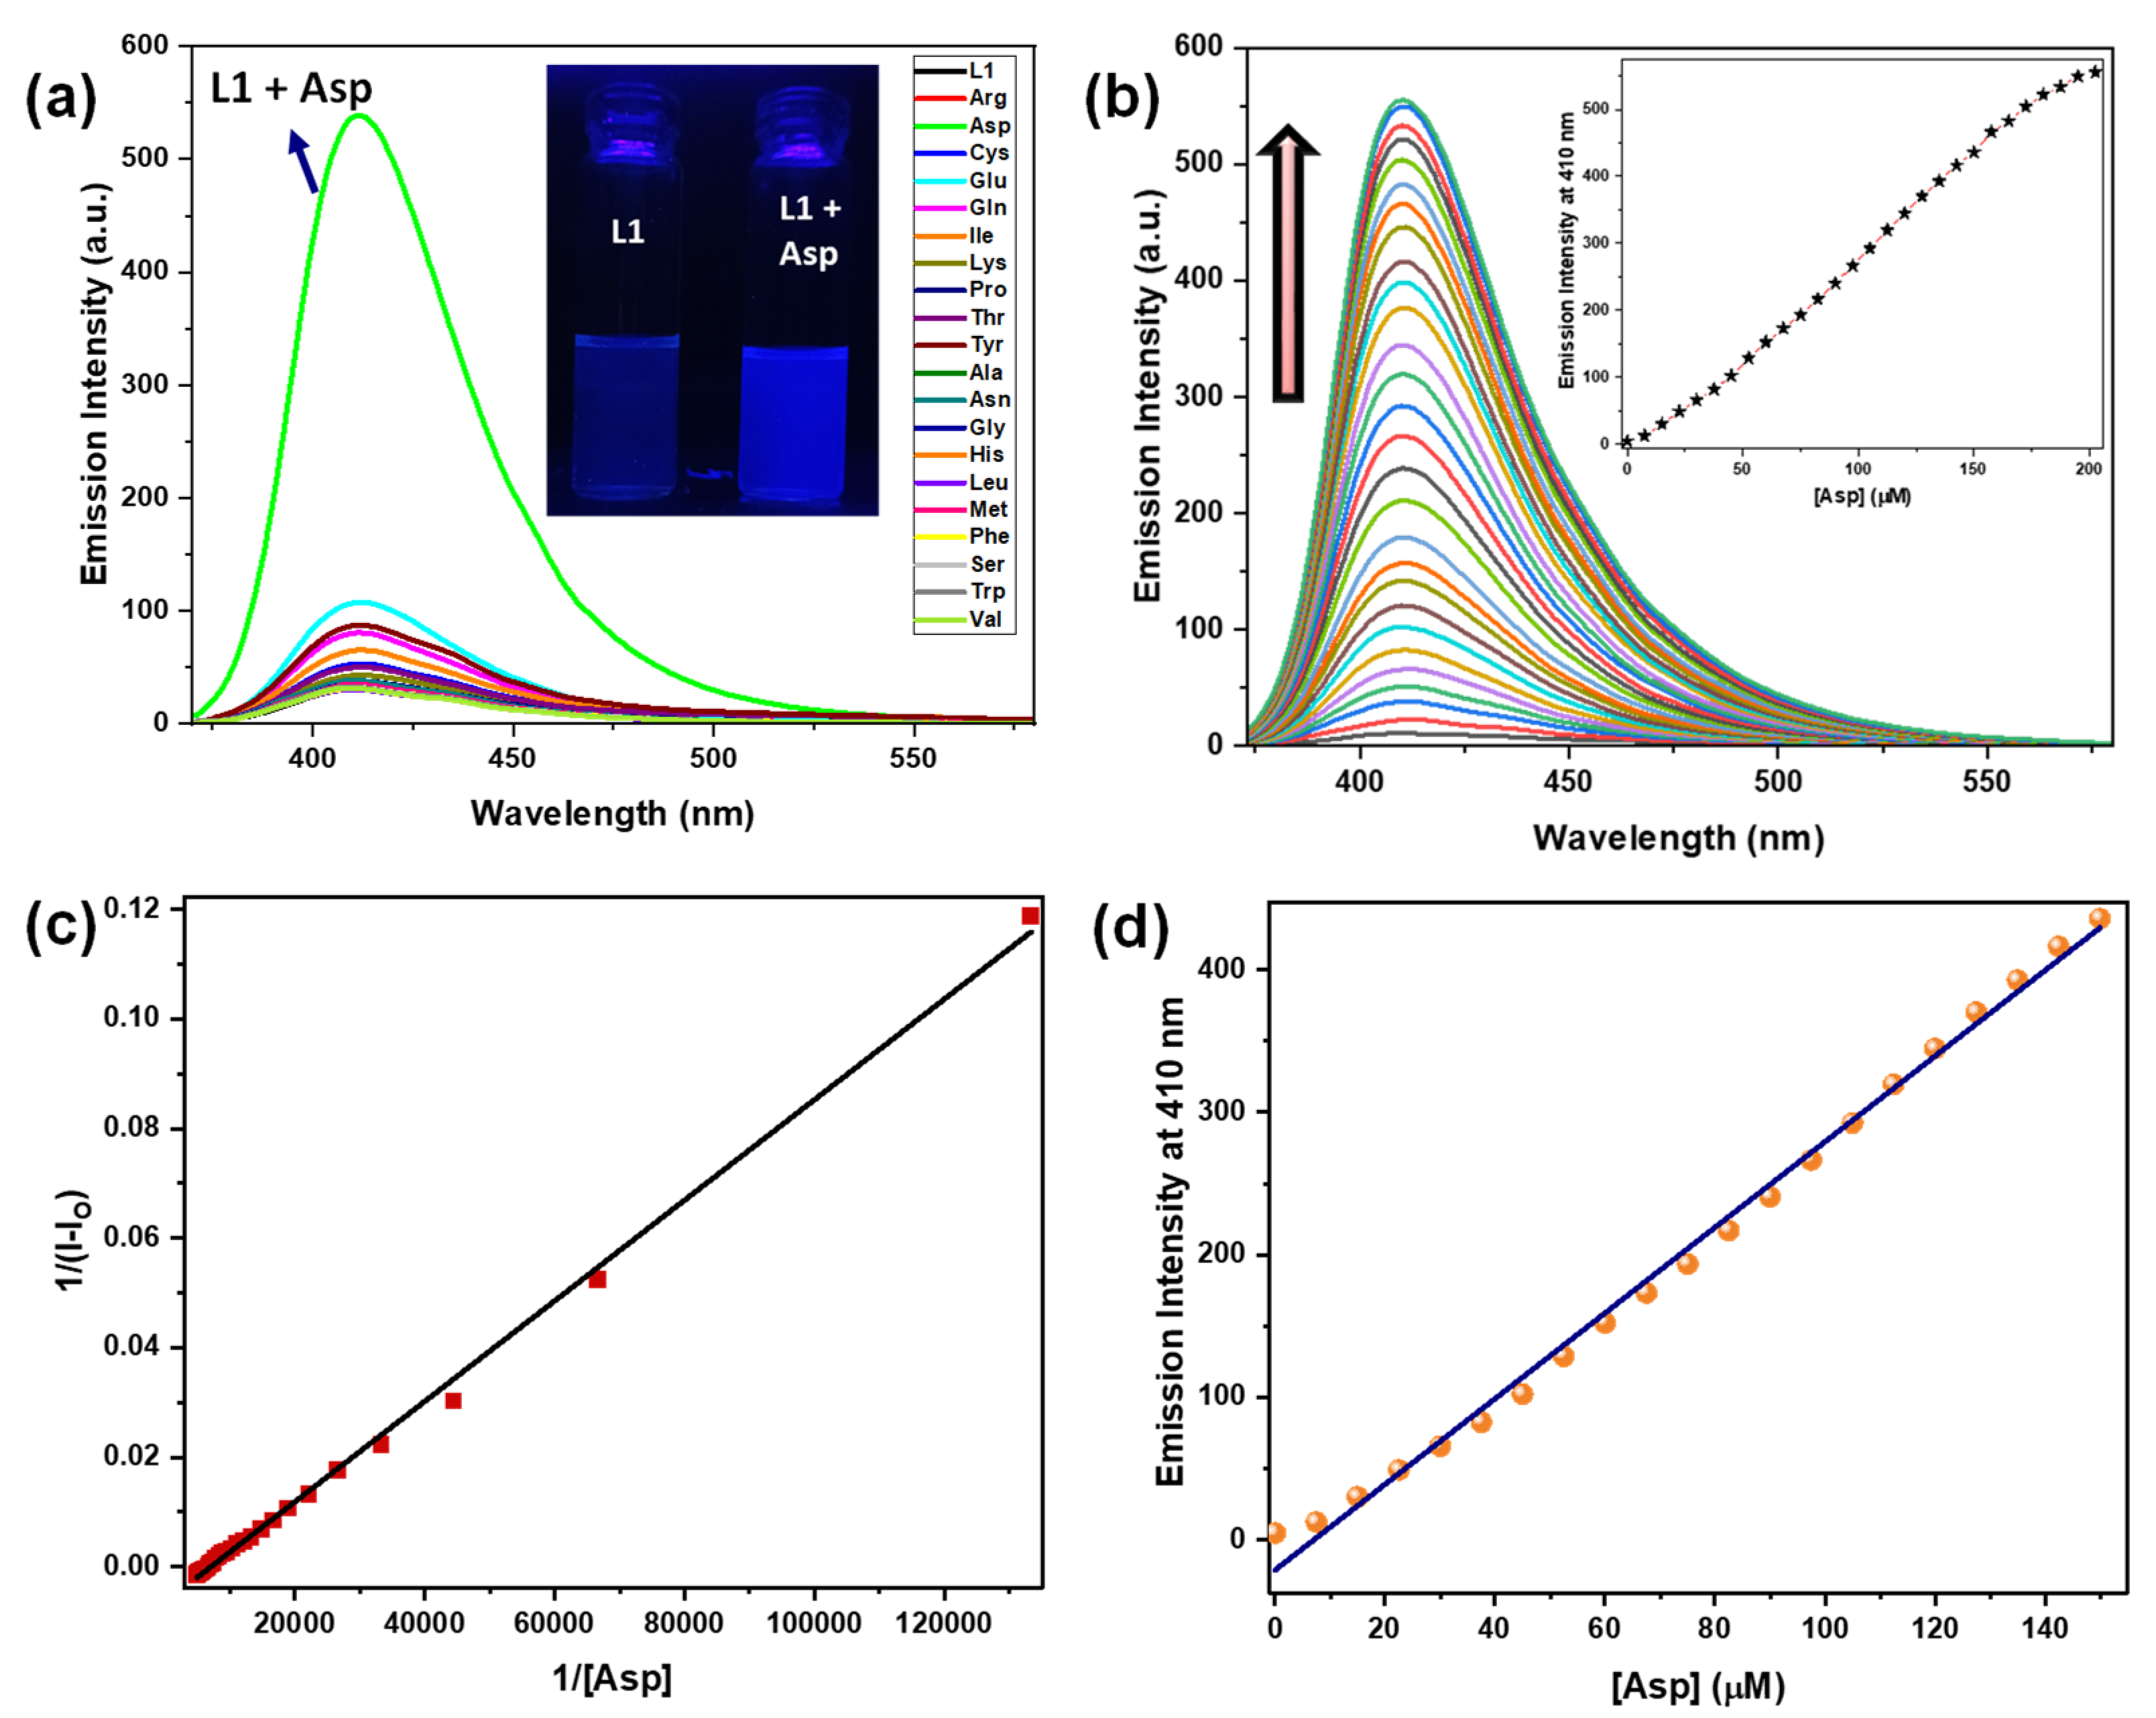
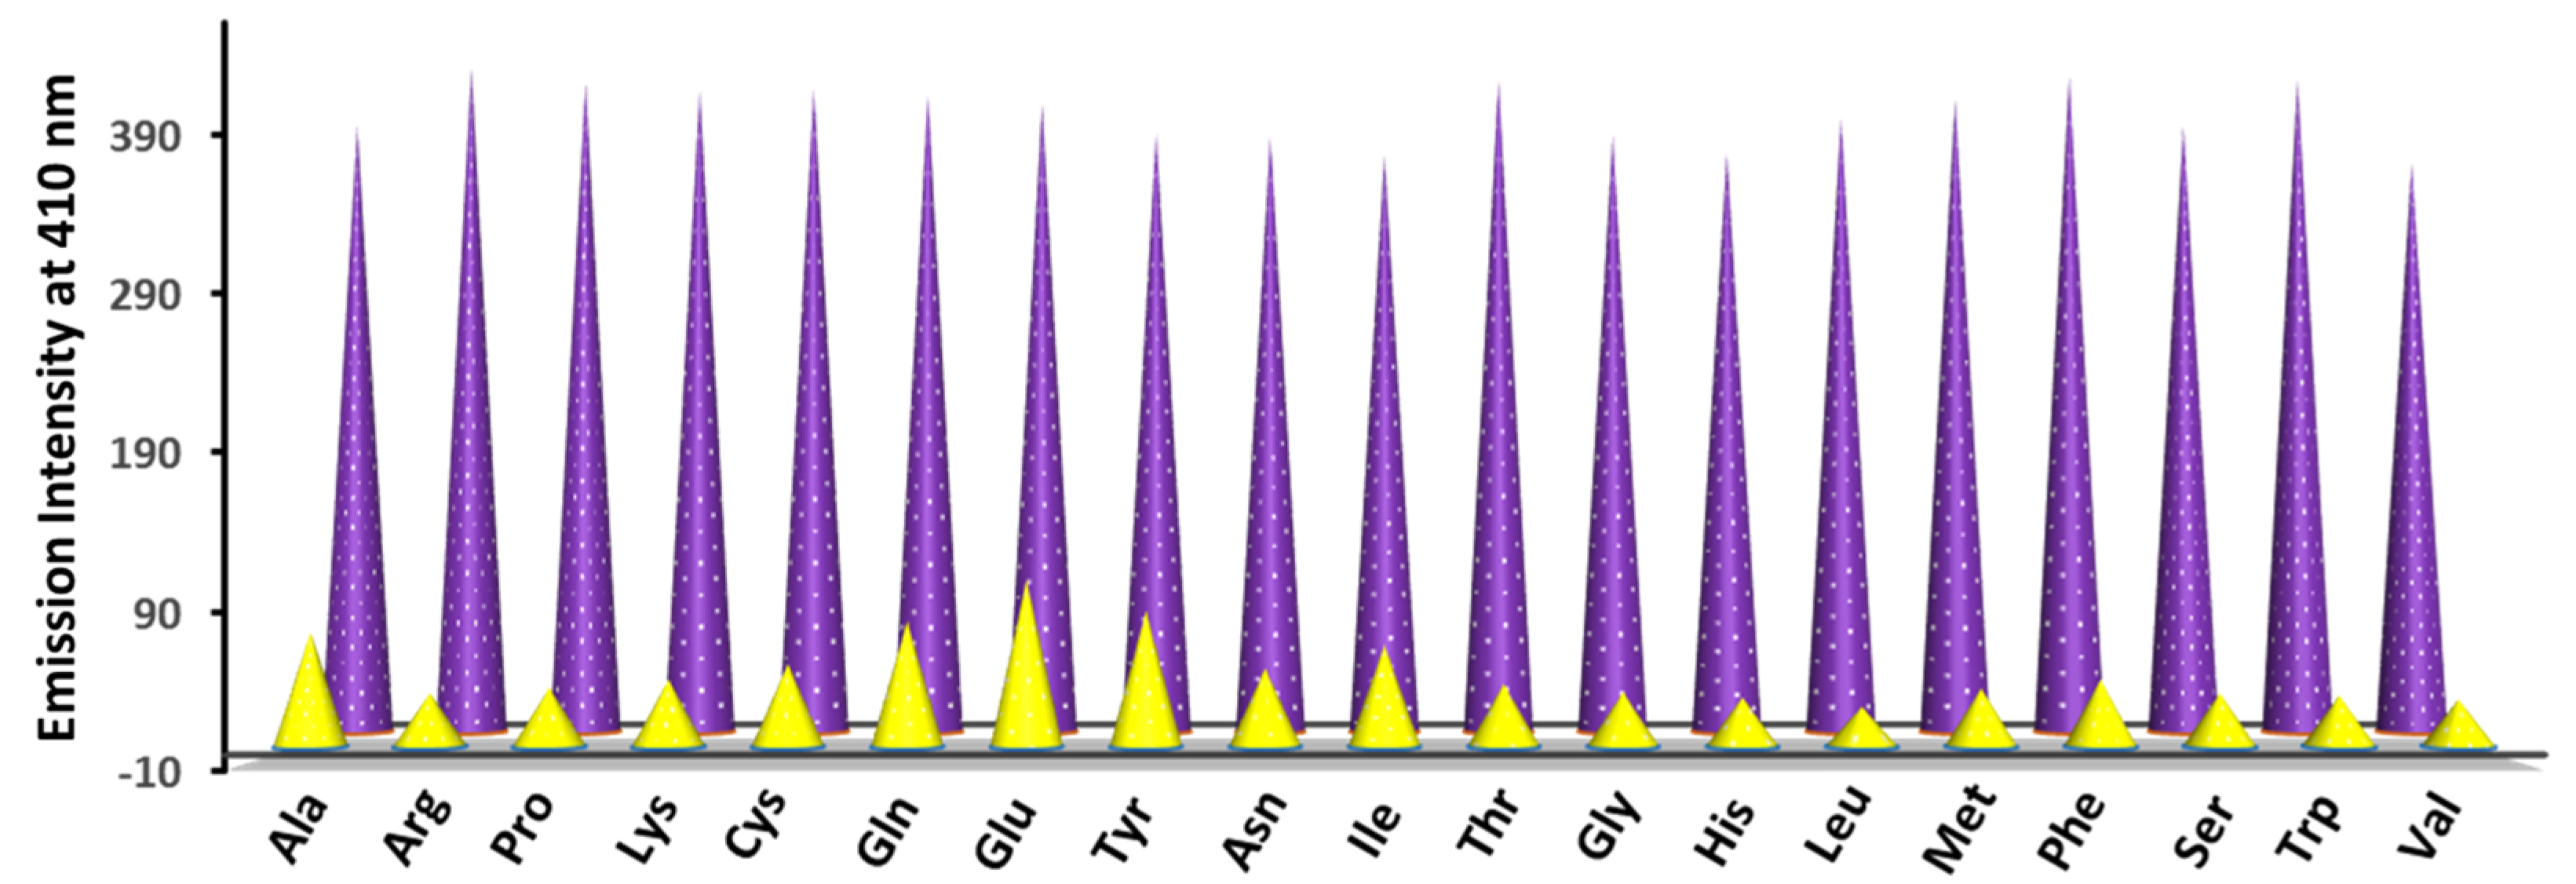
3.10. Detection of Aspartic Acid

The recognition of amino acids is challenging as they contain both carboxylic acid and amino groups [24,76]. Therefore, designing a chemosensor that can selectively detect an amino acid is always difficult [77]. Chemosensors L1 and L2 containing electron-rich groups and various binding sites make them ideal for the detection of amino acids [27,29]. Hence, the detection ability of L1 and L2 was checked towards all 20 amino acids: Gly, Ala, Glu, Pro, Cys, Ile, Tyr, Arg, Gln, Lys, Thr, Asp, Asn, His, Leu, Met, Phe, Ser, Trp, and Val. Notably, for L1, the emission intensity increased only in the presence of Asp at 410 nm. In contrast, L2 did not display any change in its emission spectra with any of the amino acids (Figure 12a and Figure S27). It is thus clear that chemosensor L1 is able to selectively detect Asp. Subsequently, an emission spectral titration of L1 was performed after the incremental addition of Asp from 0–200 μM (Figure 12b). From the concentration variation plot, the binding constant and limit of detection were found to be 2.89 × 10³ M−1 and 0.80 μM, respectively (Figure 12c,d) [78].
The selectivity of L1 towards Asp was evaluated by the competitive binding studies in the presence of an equimolar amount of all 20 amino acids [28]. The emission intensity of L1−Asp at 410 nm remained unaffected in the presence of other amino acids (Figure 13). The excited state behavior of L1 was studied in the presence of Asp with the lifetime measurement. With Asp, L1 displayed a biexponential decay with an average lifetime (τav) of 5.09 ns with a nearly 1.5-fold enhancement (Figure S28 and Table S2). The quantum yield of L1−Asp was found to be 0.027 with an approx. three-fold enhancement. Therefore, enhancement both in the lifetime measurement and quantum yield in the presence of Asp supports the interaction of L1 with Asp [57].
To identify the binding sites, an 1H NMR spectrum of L1 was recorded in the presence of 1 eq. of Asp. The imine-N and phenolic-OR (R = -CH2- and -CH3) protons displayed a downfield shift (Figure S29). Notably, a small downfield shift in the quinoline ring protons was also noted, suggesting that the quinoline-N was interacting with Asp. Such an interaction aligns with both L1 and Asp to maximize their interaction. However, the aromatic ring protons, i.e., anthracene and arene, remained unaffected. These results suggest that imine-N, both phenolic-OR groups, and quinoline-N are the potential interacting sites of L1 towards a molecule of Asp [29]. We propose that due to such interactions, PET in L1 was suppressed, resulting in an enhanced emission. Importantly, Asp was not recognized by L2 because of the fact that the quinoline-N group was farthest located, which did not allow it to interact with Asp to achieve the correct conformation and hence its sensing was not observed.

3.11. Low-Cost Detection Methods

The ‘turn-on’ detection of Al3+ and Ga3+ ions by both chemosensors prompted us to attempt different low-cost detection methods. As the best sensing results were observed for L1, low-cost detection methods were explored using the chemosensor L1 (Figure 14). The colorimetric detection was attempted by introducing different metals (c, 2.5 mM) and amino acids (c, 2.5 mM) to an EtOH solution of L1. Notably, L1 displayed detectable enhanced emission under UV light (λex = 365 nm) with both Al3+ and Ga3+ ions and Asp when compared to other metals and amino acids [79]. Next, polystyrene films were prepared containing the chemosensor L1 [4]. Such peelable polystyrene films displayed enhanced emission under UV light for the detection of both Al3+ and Ga3+ ions as well as Asp from their aqueous solutions. Similarly, filter paper test strips containing L1 were able to detect both Al3+ and Ga3+ ions (c, 2.5 mM) and Asp (c, 2.5 mM) from the aqueous solutions of different metal ions and amino acids [56]. Importantly, such filter paper test strips, tested with different concentrations of Al3+ ions (0, 5, 20, and 50 μM), were able to detect concentrations as low as 5 μM by showing color change from blue to cyan under the UV lamp (Figure S30). Hence, low-cost detection methods can be utilized to detect both Al3+ and Ga3+ ions as well as Asp for practical on-site detections.

4. Conclusions

This work illustrates two Schiff-base-based chemosensors, L1 and L2, decorated with electron-rich quinoline and anthracene rings. Chemosensor L1 displayed AIEE in a MeOH-H2O solvent system due to the suppression of PET. DLS measurements and fluorescence lifetime studies confirmed the aggregation of L1 in the presence of water. Chemosensor L1 was utilized for the sensitive, selective, and reversible detection of Al3+ and Ga3+ ions in the presence of other metal ions. L1 displayed ‘turn-on’ emission in the presence of both Al3+ and Ga3+ ions with high binding constants and low detection limits. Chemosensor L2, a structural isomer of L1, was able to discriminate between the Al3+ and Ga3+ ions and was exclusively selective for the Ga3+ ion with an impressive detection limit and a high binding constant. The discriminative sensing ability of L2 was due to the presence of different binding sites which was substantiated by the 1H NMR spectra, mass spectra, and DFT studies. The chemosensor L1 was further utilized for the selective and sensitive detection of Asp amongst all 20 amino acids. Chemosensor L1 exhibited a ‘turn-on’ fluorescence response in the presence of Asp with a remarkable detection limit and binding constant. The ‘turn-on’ nature of the fluorescence sensing by these chemosensors allowed for the fabrication of colorimetric detection, filter-paper-based test strips, and polystyrene-film-based detection strategies.

Supplementary Materials

The following supporting information can be downloaded at https://www.mdpi.com/article/10.3390/s23041798/s1: Figures S1–S12: FTIR, 1H NMR, 13C NMR, and HR-mass spectra of L’, L1 and L2; Figures S13-S14: absorption spectra and emission spectra of L1 and L2; Figures S15–S16: Emission spectra of L2 and Lifetime profile of L1 in different water percentages; Figures S17–S18: absorption spectral titrations and selectivity of L1 and L2; Figure S19: Lifetime profile of L1 in the absence and presence of Ga3+ ion; Figures S20–S21: 1H NMR spectral titration of L1 with Al3+ and L2 with Ga3+; Figures S22–S23: ESI+ mass spectrum of L1-Al and L1-Ga species; Figure S24: Job’s plot of L1 with Al3+ and Ga3+ ions; Figure S25–S26: Contour plots and respective energy gaps of the L1, L2, L1–Al3+, L1–Ga3+, and L2–Ga3+ FMOs; Figure S27: Emission spectra of L2 with amino acids; Figure S28: Lifetime profiles for L1 in the absence and presence of Asp; Figure S29: 1H NMR spectral titration of L1 with Asp; Figure S30: Optical images of L1-loaded filter paper test strips tested with different concentrations of Al3+ ion; Table S1: Crystallographic data collection and structure solution parameters for chemosensor L1; Table S2: Fluorescence lifetime parameters for L1, L2, L1@ fw = 70%, 95% L1–Al3+, L1–Ga3+, L2–Ga3+, L1–Asp species; Table S3: A comparison of sensing performance of selected chemosensors for the detection of Al3+/Ga3+ ions; Table S4: xyz coordinates of the optimized geometries of L1, L2, L1–Al3+, L1–Ga3+, and L2–Ga3+; and Table S5: Energy (in eV) of frontier molecular orbitals for L1, L2, L1–Al3+, L1–Ga3+, and L2–Ga3+ species. References [4,9,18,20,80,81] are cited in the Supplementary Materials.

Author Contributions

Conceptualization, H.G. and R.G.; methodology, H.G.; software, H.G., D.A. and A.B.; validation, H.G. and R.G.; formal analysis, H.G., I.A. and D.A.; investigation, H.G. and I.A.; resources, R.G.; data curation, H.G. and I.A.; writing—original draft preparation, H.G.; writing—review and editing, R.G.; visualization, R.G.; supervision, R.G.; project administration, R.G.; funding acquisition, R.G. All authors have read and agreed to the published version of the manuscript.

Funding

This research was funded by the Institution of Eminence, University of Delhi.

Data Availability Statement

The data that support the findings of this study are available in the supplementary materials of this article.

Acknowledgments

H.G. thanks CSIR, New Delhi, for her SRF fellowship. The authors thank USIC, University of Delhi, for the instrumental facilities, and P. Venkatesu, University of Delhi, for the DLS measurements.

Conflicts of Interest

The authors declare no conflict of interest.

References

  1. Balamurugan, G.; Velmathi, S.; Thirumalaivasan, N.; Wu, S.P. New Phenazine Based AIE Probes for Selective Detection of Aluminium(III) Ions in Presence of Other Trivalent Metal Ions in Living Cells. Analyst 2017, 142, 4721–4726. [Google Scholar] [CrossRef] [PubMed]
  2. Manna, A.; Sain, D.; Guchhait, N.; Goswami, S. FRET Based Selective and Ratiometric Detection of Al(III) with Live-Cell Imaging. New J. Chem. 2017, 41, 14266–14271. [Google Scholar] [CrossRef]
  3. Wang, H.; Xu, X.; Yin, J.; Zhang, Z.; Xue, L. A Highly Selective “Turn-On” Fluorescent Sensor for Aluminum Ion Detection in Aqueous Solution Based on Imidazo[2,1-b]Thiazole Schiff Base. ChemistrySelect 2021, 6, 6454–6459. [Google Scholar] [CrossRef]
  4. Kumar, V.; Kumar, P.; Kumar, S.; Singhal, D.; Gupta, R. Turn-On Fluorescent Sensors for the Selective Detection of Al3+ (and Ga3+) and PPi Ions. Inorg. Chem. 2019, 58, 10364–10376. [Google Scholar] [CrossRef]
  5. Purwanti, I.F.; Kurniawan, S.B.; Ismail, N.I.; Imron, M.F.; Abdullah, S.R.S. Aluminium Removal and Recovery from Wastewater and Soil Using Isolated Indigenous Bacteria. J. Environ. Manage. 2019, 249, 109412. [Google Scholar] [CrossRef]
  6. Roy, A.; Dey, S.; Roy, P. A Ratiometric Chemosensor for Al3+ Based on Naphthalene-Quinoline Conjugate with the Resultant Complex as Secondary Sensor for F: Interpretation of Molecular Logic Gates. Sens. Actuators B Chem. 2016, 237, 628–642. [Google Scholar] [CrossRef]
  7. Cai, D.-G.; Qiu, C.-Q.; Zhu, Z.-H.; Zheng, T.-F.; Wei, W.-J.; Chen, J.-L.; Liu, S.-J.; Wen, H.-R. Fabrication and DFT Calculation of Amine-Functionalized Metal–Organic Framework as a Turn-On Fluorescence Sensor for Fe3+ and Al3+ Ions. Inorg. Chem. 2022, 61, 14770–14777. [Google Scholar] [CrossRef]
  8. Chai, B.-L.; Yao, S.-L.; Xie, X.; Xu, H.; Zheng, T.-F.; Li, J.-Y.; Chen, J.-L.; Liu, S.-J.; Wen, H.-R. Luminescent Metal–Organic Framework-Based Fluorescence Turn-On and Red-Shift Sensor toward Al3+ and Ga3+: Experimental Study and DFT Calculation. Cryst. Growth Des. 2022, 22, 277–284. [Google Scholar] [CrossRef]
  9. Liu, Q.; Liu, Y.; Xing, Z.; Huang, Y.; Ling, L.; Mo, X. A Novel Dual-Function Probe for Fluorescent Turn-on Recognition and Differentiation of Al3+ and Ga3+ and Its Application. Spectrochim. Acta Part A Mol. Biomol. Spectrosc. 2023, 287, 122076. [Google Scholar] [CrossRef]
  10. Gupta, A.; Kumar, N. A Review of Mechanisms for Fluorescent “Turn-on” Probes to Detect Al3+ Ions. RSC Adv. 2016, 6, 106413–106434. [Google Scholar] [CrossRef]
  11. Dudev, T.; Cheshmedzhieva, D.; Doudeva, L. Competition between Abiogenic Al3+ and Native Mg2+, Fe2+ and Zn2+ Ions in Protein Binding Sites: Implications for Aluminum Toxicity. J. Mol. Model. 2018, 24, 55. [Google Scholar] [CrossRef] [PubMed]
  12. Hazra, A.; Roy, A.; Mukherjee, A.; Maiti, G.P.; Roy, P. Remarkable Difference in Al3+ and Zn2+ Sensing Properties of Quinoline Based Isomers. Dalton Trans. 2018, 47, 13972–13989. [Google Scholar] [CrossRef]
  13. Tian, J.; Yan, X.; Yang, H.; Tian, F. A Novel Turn-on Schiff-Base Fluorescent Sensor for Aluminum(III) Ions in Living Cells. RSC Adv. 2015, 5, 107012–107019. [Google Scholar] [CrossRef]
  14. Roy, P. Recent Advances in the Development of Fluorescent Chemosensors for Al3+. Dalton Trans. 2021, 50, 7156–7165. [Google Scholar] [CrossRef]
  15. Banerjee, S.; Brandão, P.; Saha, A. A Robust Fluorescent Chemosensor for Aluminium Ion Detection Based on a Schiff Base Ligand with an Azo Arm and Application in a Molecular Logic Gate. RSC Adv. 2016, 6, 101924–101936. [Google Scholar] [CrossRef]
  16. Garg, M.; Sud, D. Tracking the Concentration of Al3+ in the Aqueous System up to the Nanomolar Range Using a Modified Biopolymer Chitosan Based Fluorophore. New J. Chem. 2022, 46, 6946–6955. [Google Scholar] [CrossRef]
  17. Ghorai, P.; Pal, K.; Karmakar, P.; Saha, A. The Development of Two Fluorescent Chemosensors for the Selective Detection of Zn2+ and Al3+ Ions in a Quinoline Platform by Tuning the Substituents in the Receptor Part: Elucidation of the Structures of the Metal-Bound Chemosensors and Biological Studies. Dalton Trans. 2020, 49, 4758–4773. [Google Scholar] [CrossRef]
  18. Mishra, S.; Mamidi, P.; Chattopadhyay, S.; Singh, A.K. Economically Viable Multi-Responsive Probes for Fluorimetric Detection of Trace Levels of Ga3+, Al3+ and PPi in near Aqueous Medium. J. Photochem. Photobiol. Chem. 2023, 434, 114225. [Google Scholar] [CrossRef]
  19. Xiang, H.; Wang, T.; Tang, S.; Wang, Y.; Xiao, N. A Novel Hydrazone-Based Fluorescent “off-on-off” Probe for Relay Sensing of Ga3+ and PPi Ions. Spectrochim. Acta Part A Mol. Biomol. Spectrosc. 2022, 267, 120510. [Google Scholar] [CrossRef]
  20. Yang, L.; Li, M.; Wang, Y.; Zhang, Y.; Liu, Z.; Ruan, S.; Wang, Z.; Wang, S. An Isocamphanyl-Based Fluorescent “Turn-on” Probe for Highly Sensitive and Selective Detection of Ga3+ and Application In Vivo and In Vitro. Analyst 2021, 146, 7294–7305. [Google Scholar] [CrossRef]
  21. Zhu, Y.-Y.; Wu, X.-D.; Gu, S.-X.; Pu, L. Free Amino Acid Recognition: A Bisbinaphthyl-Based Fluorescent Probe with High Enantioselectivity. J. Am. Chem. Soc. 2019, 141, 175–181. [Google Scholar] [CrossRef]
  22. Wang, B.; Han, J.; Bojanowski, N.M.; Bender, M.; Ma, C.; Seehafer, K.; Herrmann, A.; Bunz, U.H.F. An Optimized Sensor Array Identifies All Natural Amino Acids. ACS Sens. 2018, 3, 1562–1568. [Google Scholar] [CrossRef]
  23. Yang, A.-F.; Hou, S.-L.; Shi, Y.; Yang, G.-L.; Qin, D.-B.; Zhao, B. Stable Lanthanide–Organic Framework as a Luminescent Probe To Detect Both Histidine and Aspartic Acid in Water. Inorg. Chem. 2019, 58, 6356–6362. [Google Scholar] [CrossRef] [PubMed]
  24. Guria, S.; Ghosh, A.; Manna, K.; Pal, A.; Adhikary, A.; Adhikari, S. Rapid Detection of Aspartic Acid and Glutamic Acid in Water by BODIPY-Based Fluorescent Probe: Live-Cell Imaging and DFT Studies. Dye. Pigment. 2019, 168, 111–122. [Google Scholar] [CrossRef]
  25. Ji, G.; Zheng, T.; Gao, X.; Liu, Z. A Highly Selective Turn-on Luminescent Logic Gates Probe Based on Post-Synthetic MOF for Aspartic Acid Detection. Sens. Actuators B Chem. 2019, 284, 91–95. [Google Scholar] [CrossRef]
  26. Zhu, Y.; Cui, M.; Ma, J.; Zhang, Q. Fluorescence Detection of D-Aspartic Acid Based on Thiol-Ene Cross-Linked Molecularly Imprinted Optical Fiber Probe. Sens. Actuators B Chem. 2020, 305, 127323. [Google Scholar] [CrossRef]
  27. Elamathi, C.; Butcher, R.J.; Mohankumar, A.; Sundararaj, P.; Elango, K.P.; Kalaivani, P.; Prabhakaran, R. Dual Sensing of Methionine and Aspartic Acid in Aqueous Medium by a Quinoline-Based Fluorescent Probe. Dalton Trans. 2021, 50, 8820–8830. [Google Scholar] [CrossRef]
  28. Nasomphan, W.; Tangboriboonrat, P.; Tanapongpipat, S.; Smanmoo, S. Selective Fluorescent Detection of Aspartic Acid and Glutamic Acid Employing Dansyl Hydrazine Dextran Conjugate. J. Fluoresc. 2014, 24, 7–11. [Google Scholar] [CrossRef]
  29. Ranjani, M.; Kalaivani, P.; Dallemer, F.; Selvakumar, S.; Kalpana, T.; Prabhakaran, R. Fluorescent Cu(II) Complex as Chemosensor for the Detection of l-Aspartic Acid with High Selectivity and Sensitivity. Inorg. Chim. Acta 2022, 530, 120683. [Google Scholar] [CrossRef]
  30. Tian, J.; Wang, Y.; Chen, Y.; Zhao, F.; Jiang, Y.; Yu, S.; Yu, X.; Pu, L. Chemoselective and Enantioselective Fluorescent Recognition of Glutamic and Aspartic Acids. Chem. Commun. 2020, 56, 15012–15015. [Google Scholar] [CrossRef]
  31. Ren, T.-L.; Zhang, X.-N.; Hu, J.-J.; Wen, H.-R.; Liu, S.-J.; Peng, Y. Stable Terbium Metal–Organic Framework with Turn-on and Blue-Shift Fluorescence Sensing for Acidic Amino Acids (L-Aspartate and L-Glutamine) and Cations (Al3+ and Ga3+). Dalton Trans. 2022, 51, 14858–14864. [Google Scholar] [CrossRef] [PubMed]
  32. Goyal, H.; Kumar, V.; Saini, A.K.; Kedawat, G.; Gupta, B.K.; Gupta, R. A Multifunctional Schiff Base with Aggregation-Induced Enhanced Emission, Gelation, and Mechanochromic Properties for Anti-Counterfeiting Applications. Mater. Today Chem. 2023, 27, 101306. [Google Scholar] [CrossRef]
  33. Khanra, S.; Ta, S.; Ghosh, M.; Chatterjee, S.; Mukherjee, P.; Das, D. Al3+ Triggered Aggregation Induced Emission of an Anthracence Based Azine Derivative in SDS Medium. New J. Chem. 2020, 44, 8477–8485. [Google Scholar] [CrossRef]
  34. Mao, L.; Liu, Y.; Yang, S.; Li, Y.; Zhang, X.; Wei, Y. Recent Advances and Progress of Fluorescent Bio-/Chemosensors Based on Aggregation-Induced Emission Molecules. Dye. Pigment. 2019, 162, 611–623. [Google Scholar] [CrossRef]
  35. R, S.G.; Pandey, M.; Chakravarthy, A.S.J. Review on New Horizons of Aggregation Induced Emission: From Design to Development. Mater. Chem. Front. 2021, 5, 1541–1584. [Google Scholar] [CrossRef]
  36. Würthner, F. Aggregation-Induced Emission (AIE): A Historical Perspective. Angew. Chem. Int. Ed. 2020, 59, 14192–14196. [Google Scholar] [CrossRef] [PubMed]
  37. Wang, J.; Meng, Q.; Yang, Y.; Zhong, S.; Zhang, R.; Fang, Y.; Gao, Y.; Cui, X. Schiff Base Aggregation-Induced Emission Luminogens for Sensing Applications: A Review. ACS Sens. 2022, 7, 2521–2536. [Google Scholar] [CrossRef] [PubMed]
  38. Munir, F.; Waseem, M.T.; Khan, Z.A.; Majeed, S.; Farooq, U.; Shahzad, S.A. Synthesis of AIEE Active Triazine Based New Fluorescent and Colorimetric Probes: A Reversible Mechanochromism and Sequential Detection of Picric Acid and Ciprofloxacin. J. Photochem. Photobiol. Chem. 2022, 429, 113921. [Google Scholar] [CrossRef]
  39. Parambil, A.R.U.; P, K.; Silswal, A.; Koner, A.L. Water-Soluble Optical Sensors: Keys to Detect Aluminium in Biological Environment. RSC Adv. 2022, 12, 13950–13970. [Google Scholar] [CrossRef]
  40. Xu, Z.; Liu, Y.; Wang, R.; Zhang, J.; Cheng, J.; Chen, S.; Miao, M.; Zhang, D. AIEE Based “Turn-on” Fluorescent Sensor for Al3+ Ions and Induced Tetraphenylethene Self-Assemblies. Org. Electron. 2020, 85, 105820. [Google Scholar] [CrossRef]
  41. Nguyen, H.L.; Kumar, N.; Audibert, J.-F.; Ghasemi, R.; Lefevre, J.-P.; Ha-Thi, M.-H.; Mongin, C.; Leray, I. Water-Soluble Aluminium Fluorescent Sensor Based on Aggregation-Induced Emission Enhancement. New J. Chem. 2019, 43, 15302–15310. [Google Scholar] [CrossRef]
  42. Armarego, W.L.F. Purification of Laboratory Chemicals; Butterworth-Heinemann: Oxford, UK, 2017; ISBN 978-0-12-805456-7. [Google Scholar]
  43. CrysAlisPro; Version 1.171.33.49b; Oxford Diffraction Ltd.: Abingdon, UK, 2009.
  44. Altomare, A.; Burla, M.C.; Camalli, M.; Cascarano, G.L.; Giacovazzo, C.; Guagliardi, A.; Moliterni, A.G.G.; Polidori, G.; Spagna, R. SIR97: A New Tool for Crystal Structure Determination and Refinement. J. Appl. Crystallogr. 1999, 32, 115–119. [Google Scholar] [CrossRef]
  45. Sheldrick, G.M. A Short History of SHELX. Acta Crystallogr. A 2008, 64, 112–122. [Google Scholar] [CrossRef]
  46. Farrugia, L.J. WinGX, v. 1.70, An Integrated System of Windows Programs for the Solution, Refinement and Analysis of Single-Crystal X-ray Diffraction Data; Department of Chemistry, University of Glasgow: Glasgow, Scotland, 2003. [Google Scholar]
  47. Hohenberg, P.; Kohn, W. Inhomogeneous Electron Gas. Phys. Rev. 1964, 136, B864–B871. [Google Scholar] [CrossRef]
  48. Frisch, M.J.; Trucks, G.W.; Schlegel, H.B.; Scuseria, G.E.; Robb, M.A.; Cheeseman, J.R.; Scalmani, G.; Barone, V.; Petersson, G.A.; Nakatsuji, H.; et al. Gaussian 09 Rev. A.01; Gaussian, Inc.: Wallingford, CT, USA, 2009. [Google Scholar]
  49. Chiodo, S.; Russo, N.; Sicilia, E. LANL2DZ Basis Sets Recontracted in the Framework of Density Functional Theory. J. Chem. Phys. 2006, 125, 104107. [Google Scholar] [CrossRef] [PubMed]
  50. Blaudeau, J.-P.; McGrath, M.P.; Curtiss, L.A.; Radom, L. Extension of Gaussian-2 (G2) Theory to Molecules Containing Third-Row Atoms K and Ca. J. Chem. Phys. 1997, 107, 5016–5021. [Google Scholar] [CrossRef]
  51. Tomasi, J.; Mennucci, B.; Cammi, R. Quantum Mechanical Continuum Solvation Models. Chem. Rev. 2005, 105, 2999–3094. [Google Scholar] [CrossRef]
  52. Dennington, R.; Keith, T.A.; Millam, J.M. GaussView, Version 6; Shawnee Mission, K.; Semichem Inc.: Shawnee, KS, USA, 2016. [Google Scholar]
  53. Hanwell, M.D.; Curtis, D.E.; Lonie, D.C.; Vandermeersch, T.; Zurek, E.; Hutchison, G.R. Avogadro: An Advanced Semantic Chemical Editor, Visualization, and Analysis Platform. J. Cheminformatics 2012, 4, 17. [Google Scholar] [CrossRef] [PubMed]
  54. Benesi, H.A.; Hildebrand, J.H. A Spectrophotometric Investigation of the Interaction of Iodine with Aromatic Hydrocarbons. J. Am. Chem. Soc. 1949, 71, 2703–2707. [Google Scholar] [CrossRef]
  55. Kumar, V.; Singh, D.; Kumar, P.; Chaudhary, G.; Singh, A.P.; Gupta, R. Turn-on Fluorescent Detection of Nickel and Zinc Ions by Two Related Chemosensors Containing Naphthalimide Ring(s). J. Mol. Struct. 2022, 1261, 132901. [Google Scholar] [CrossRef]
  56. Singh, D.; Tomar, S.; Singh, S.; Chaudhary, G.; Singh, A.P.; Gupta, R. A Fluorescent PH Switch Probe for the ‘Turn-on’ Dual-Channel Discriminative Detection of Magnesium and Zinc Ions. J. Photochem. Photobiol. Chem. 2023, 435, 114334. [Google Scholar] [CrossRef]
  57. Prabha, D.; Singh, D.; Kumar, P.; Gupta, R. Selective Detection of Picric Acid and Pyrosulfate Ion by Nickel Complexes Offering a Hydrogen-Bonding-Based Cavity. Inorg. Chem. 2021, 60, 17889–17899. [Google Scholar] [CrossRef]
  58. Singh, D.; Ibrahim, A.; Gupta, R. Coumarin-Based Reversible Fluorescent Chemosensors for the Sequential Detection of Copper and Citrate Ions. ChemistrySelect 2022, 7, e202203326. [Google Scholar] [CrossRef]
  59. Singh, D.; Ibrahim, A.; Kumar, P.; Gupta, R. Methylene Spacer Mediated Detection Switch Between Copper and Zinc Ions by Two Coumarin-Pyrene Based Chemosensors. ChemistrySelect 2022, 7, e202202574. [Google Scholar] [CrossRef]
  60. Di Bella, S.; Fragalà, I.; Ledoux, I.; Diaz-Garcia, M.A.; Marks, T.J. Synthesis, Characterization, Optical Spectroscopic, Electronic Structure, and Second-Order Nonlinear Optical (NLO) Properties of a Novel Class of Donor−Acceptor Bis(Salicylaldiminato)Nickel(II) Schiff Base NLO Chromophores. J. Am. Chem. Soc. 1997, 119, 9550–9557. [Google Scholar] [CrossRef]
  61. Cheng, J.; Wei, K.; Ma, X.; Zhou, X.; Xiang, H. Synthesis and Photophysical Properties of Colorful Salen-Type Schiff Bases. J. Phys. Chem. C 2013, 117, 16552–16563. [Google Scholar] [CrossRef]
  62. Luo, H.; Li, N.; Liu, L.; Wang, H.; He, F. Synthesis of New AIEE-Active Chalcones for Imaging of Mitochondria in Living Cells and Zebrafish In Vivo. Int. J. Mol. Sci. 2021, 22, 8949. [Google Scholar] [CrossRef] [PubMed]
  63. Islam, A.S.M.; Sasmal, M.; Maiti, D.; Dutta, A.; Show, B.; Ali, M. Design of a Pyrene Scaffold Multifunctional Material: Real-Time Turn-On Chemosensor for Nitric Oxide, AIEE Behavior, and Detection of TNP Explosive. ACS Omega 2018, 3, 10306–10316. [Google Scholar] [CrossRef] [PubMed]
  64. Goyal, H.; Pachisia, S.; Gupta, R. Systematic Design of a Low-Molecular-Weight Gelator and Its Application in the Sensing and Retention of Residual Antibiotics. Cryst. Growth Des. 2020, 20, 6117–6128. [Google Scholar] [CrossRef]
  65. Shyamal, M.; Mazumdar, P.; Maity, S.; Sahoo, G.P.; Salgado-Morán, G.; Misra, A. Pyrene Scaffold as Real-Time Fluorescent Turn-on Chemosensor for Selective Detection of Trace-Level Al(III) and Its Aggregation-Induced Emission Enhancement. J. Phys. Chem. A 2016, 120, 210–220. [Google Scholar] [CrossRef]
  66. Kathiravan, A.; Sundaravel, K.; Jaccob, M.; Dhinagaran, G.; Rameshkumar, A.; Arul Ananth, D.; Sivasudha, T. Pyrene Schiff Base: Photophysics, Aggregation Induced Emission, and Antimicrobial Properties. J. Phys. Chem. B 2014, 118, 13573–13581. [Google Scholar] [CrossRef] [PubMed]
  67. Jinbo, D.; Imato, K.; Ooyama, Y. Fluorescent Sensor for Water Based on Photo-Induced Electron Transfer and Förster Resonance Energy Transfer: Anthracene-(Aminomethyl)Phenylboronic Acid Ester-BODIPY Structure. RSC Adv. 2019, 9, 15335–15340. [Google Scholar] [CrossRef]
  68. Kumar, S.; Kishan, R.; Kumar, P.; Pachisia, S.; Gupta, R. Size-Selective Detection of Picric Acid by Fluorescent Palladium Macrocycles. Inorg. Chem. 2018, 57, 1693–1697. [Google Scholar] [CrossRef]
  69. Sudheer; Kumar, V.; Kumar, P.; Gupta, R. Detection of Al3+ and Fe3+ Ions by Nitrobenzoxadiazole Bearing Pyridine-2,6-Dicarboxamide Based Chemosensors: Effect of Solvents on Detection. New J. Chem. 2020, 44, 13285–13294. [Google Scholar] [CrossRef]
  70. Kumar, P.; Kumar, V.; Pandey, S.; Gupta, R. Detection of Sulfide Ion and Gaseous H2S Using a Series of Pyridine-2,6-Dicarboxamide Based Scaffolds. Dalton Trans. 2018, 47, 9536–9545. [Google Scholar] [CrossRef] [PubMed]
  71. Kumar, P.; Kumar, V.; Gupta, R. Arene-Based Fluorescent Probes for the Selective Detection of Iron. RSC Adv. 2015, 5, 97874–97882. [Google Scholar] [CrossRef]
  72. Kumar Goshisht, M.; Kumar Patra, G.; Tripathi, N. Fluorescent Schiff Base Sensors as a Versatile Tool for Metal Ion Detection: Strategies, Mechanistic Insights, and Applications. Mater. Adv. 2022, 3, 2612–2669. [Google Scholar] [CrossRef]
  73. Gupta, A.S.; Paul, K.; Luxami, V. A New ‘Turn-on’ PET-CHEF Based Fluorescent Sensor for Al3+ and CN Ions: Applications in Real Samples. Anal. Methods 2018, 10, 983–990. [Google Scholar] [CrossRef]
  74. Wang, P.; Meng, F.; Su, H.; Liu, L.; Khan, M.A.; Li, H. A Highly Selective “Turn-on” Water-Soluble Fluorescent Sensor for Gallium Ion Detection. RSC Adv. 2021, 11, 19747–19754. [Google Scholar] [CrossRef]
  75. Noh, J.Y.; Kim, S.; Hwang, I.H.; Lee, G.Y.; Kang, J.; Kim, S.H.; Min, J.; Park, S.; Kim, C.; Kim, J. Solvent-Dependent Selective Fluorescence Assay of Aluminum and Gallium Ions Using Julolidine-Based Probe. Dye. Pigment. 2013, 99, 1016–1021. [Google Scholar] [CrossRef]
  76. Tabaraki, R.; Abdi, O. Microwave Assisted Synthesis of N-Doped Carbon Dots: An Easy, Fast and Cheap Sensor for Determination of Aspartic Acid in Sport Supplements. J. Fluoresc. 2019, 29, 751–756. [Google Scholar] [CrossRef]
  77. Zhou, Y.; Yoon, J. Recent Progress in Fluorescent and Colorimetric Chemosensors for Detection of Amino Acids. Chem. Soc. Rev. 2012, 41, 52–67. [Google Scholar] [CrossRef] [PubMed]
  78. Goyal, H.; Gupta, R. Sensing and Formation of a Stable Gel in the Presence of Picric Acid by a Low-Molecular-Weight-Gelator. J. Indian Chem. Soc. 2022, 99, 100521. [Google Scholar] [CrossRef]
  79. Kumar, G.; Pachisia, S.; Kumar, P.; Kumar, V.; Gupta, R. Zn- and Cd-Based Coordination Polymers Offering H-Bonding Cavities: Highly Selective Sensing of S2O72− and Fe3+ Ions. Chem.—Asian J. 2019, 14, 4594–4600. [Google Scholar] [CrossRef] [PubMed]
  80. Chen, Y.; Wei, T.; Zhang, Z.; Chen, T.; Li, J.; Qiang, J.; Lv, J.; Wang, F.; Chen, X. A Benzothiazole-Based Fluorescent Probe for Ratiometric Detection of Al3+ in Aqueous Medium and Living Cells. Ind. Eng. Chem. Res. 2017, 56, 12267–12275. [Google Scholar] [CrossRef]
  81. Guo, A.; Zhu, R.; Zhang, Z.; Ren, Y.; Dong, J.; Feng, L. A “Turn-on” Fluorescent Chemosensor for Aluminum Ion and Cell Imaging Application. Spectrochim. Ind. Eng. Chem. Res. 2016, 153, 530–534. [Google Scholar] [CrossRef]
Scheme 1. Preparative routes for the synthesis of chemosensors L1 and L2. Conditions: (i) CsCO3, DMF, RT, 12 h; (ii) 3-aminoquinoline, EtOH, CH3COOH, reflux, 12 h; (iii) 5-aminoquinoline, EtOH, CH3COOH, reflux, 12 h. Crystal structure of L1 in ball and stick model where carbon atoms are shown in golden color while N and O atoms are represented in blue and red colors, respectively.
Sensors 23 01798 sch001
Figure 1. (a) Emission spectra of L1 (c, 50 µM, λex = 350 nm) in a MeOH-H2O mixture with water fraction increasing from 0–95%; (b) optical images of vials containing L1 in MeOH with water fraction increasing from 10–95% under the UV illumination.
Sensors 23 01798 g001
Figure 2. DLS measurements of L1-aggregates formed in (a) 10, (b) 70, and (c) 95% MeOH–water solvent system.
Sensors 23 01798 g002
Scheme 2. Proposed AIEE mechanism exhibited by L1.
Sensors 23 01798 sch002
Figure 3. Absorption spectra of chemosensors (a) L1 (c, 20 μM) and (b) L2 (c, 20 μM) in EtOH in the presence of assorted metal ions (c, 50 μM).
Sensors 23 01798 g003
Figure 4. Emission spectra of chemosensors (a) L1 (c, 20 μM) and (b) L2 (c, 20 μM) in EtOH in the presence of assorted metal ions (c, 50 μM). (c) Bar diagram showing the relative change in the emission intensity of L1 (blue bars) and L2 (orange bars) in the presence of assorted metal ions (c, 50 μM).
Sensors 23 01798 g004
Figure 5. Change in the emission spectra of L1 (c, 20 μM) on successive addition of (a) Al3+ ion (0–75 μM) and (b) Ga3+ ion (0–75 μM); (c) L2 (c, 20 μM) on successive addition of Ga3+ ion (0–200 μM). Determination of binding constants by Benesi–Hildebrand plots for the detection of (d) Al3+ ion, (e) Ga3+ ion by L1, and (f) Ga3+ ion by L2 from the emission spectral profiles. Determination of detection limit of L1 towards the (g) Al3+ ion, (h) Ga3+ ion, and (i) L2 towards the Ga3+ ion. All studies were carried out in EtOH.
Sensors 23 01798 g005
Figure 6. Selectivity of chemosensor L1 towards the Al3+ ion in the presence of other metal ions: L1 + metal ions (yellow cones) and L1 + metal ions + Al3+ ion (purple cones). All studies were conducted in EtOH.
Sensors 23 01798 g006
Figure 7. Lifetime profiles of chemosensors (a) L1 and (b) L2 in the absence and presence of Al3+ and Ga3+ ions, respectively, in EtOH.
Sensors 23 01798 g007
Figure 8. (a) Reversibility cycles for L1 (c, 20 μM) upon subsequent addition of Al3+ ion (as Al(NO3)3, 2.5 equiv.) and F ion (as NaF, 2.5 equiv.) in EtOH. (b) Reversibility cycles for L1 using Al3+ ion (as Al(NO3)3)/Ga3+ ion (as GaCl3) and F ion (as NaF) under the UV light.
Sensors 23 01798 g008
Scheme 3. Sensing mechanism of L1 towards Al3+/Ga3+ ions via fluorescence ‘turn-on’ strategy.
Sensors 23 01798 sch003
Figure 9. Selected part of 1H NMR spectra displaying the titration of L1 with the Al3+ ion (0–1 equiv.) in CDCl3. See Figure S20 for full-range spectrum.
Sensors 23 01798 g009
Figure 10. Electrostatic potential maps with the approximate potentials (in kcal/mol) across the marked regions.
Sensors 23 01798 g010
Figure 11. Optimized structures of (a) L1-Al3+, (b) L1–Ga3+, and (c) L2–Ga3+ complexes (Isovalue = 0.02). The associated anions (NO3 and Cl) are shown in their usual colors.
Sensors 23 01798 g011
Figure 12. (a) Emission spectra of chemosensor L1 (c, 20 μM) in the presence of assorted amino acids. Inset displays a vial containing L1 and L1+Asp under the UV lamp illumination. (b) Change in the emission spectra of L1 (c, 20 μM) on successive addition of Asp. (c) Determination of the binding constant by Benesi–Hildebrand plot for the detection of Asp by L1 from the emission spectral titration. (d) Determination of detection limit of L1 towards Asp. All studies were conducted in EtOH.
Sensors 23 01798 g012
Figure 13. Selectivity of chemosensor L1 towards Asp in the presence of other amino acids: L1 + amino acids (yellow cones) and L1 + amino acids + Asp (purple cones). All studies were conducted in EtOH.
Sensors 23 01798 g013
Figure 14. Optical images of chemosensor L1 (a) with different metal ions (2.5 equiv.) and (b) amino acids (2.5 equiv.) in solution state; (c) polystyrene films loaded with L1 in the absence and presence of Al3+ and Ga3+ ions and Asp. (d) Filter paper test strips of L1 in the absence and presence of Al3+ and Ga3+ ions and Asp. All images were taken under a UV lamp (λex = 365 nm).
Sensors 23 01798 g014
Disclaimer/Publisher’s Note: The statements, opinions and data contained in all publications are solely those of the individual author(s) and contributor(s) and not of MDPI and/or the editor(s). MDPI and/or the editor(s) disclaim responsibility for any injury to people or property resulting from any ideas, methods, instructions or products referred to in the content.

