
A GPS-Referenced Wavelength Standard for High-Precision Displacement Interferometry at λ = 633 nm
 , , , , and
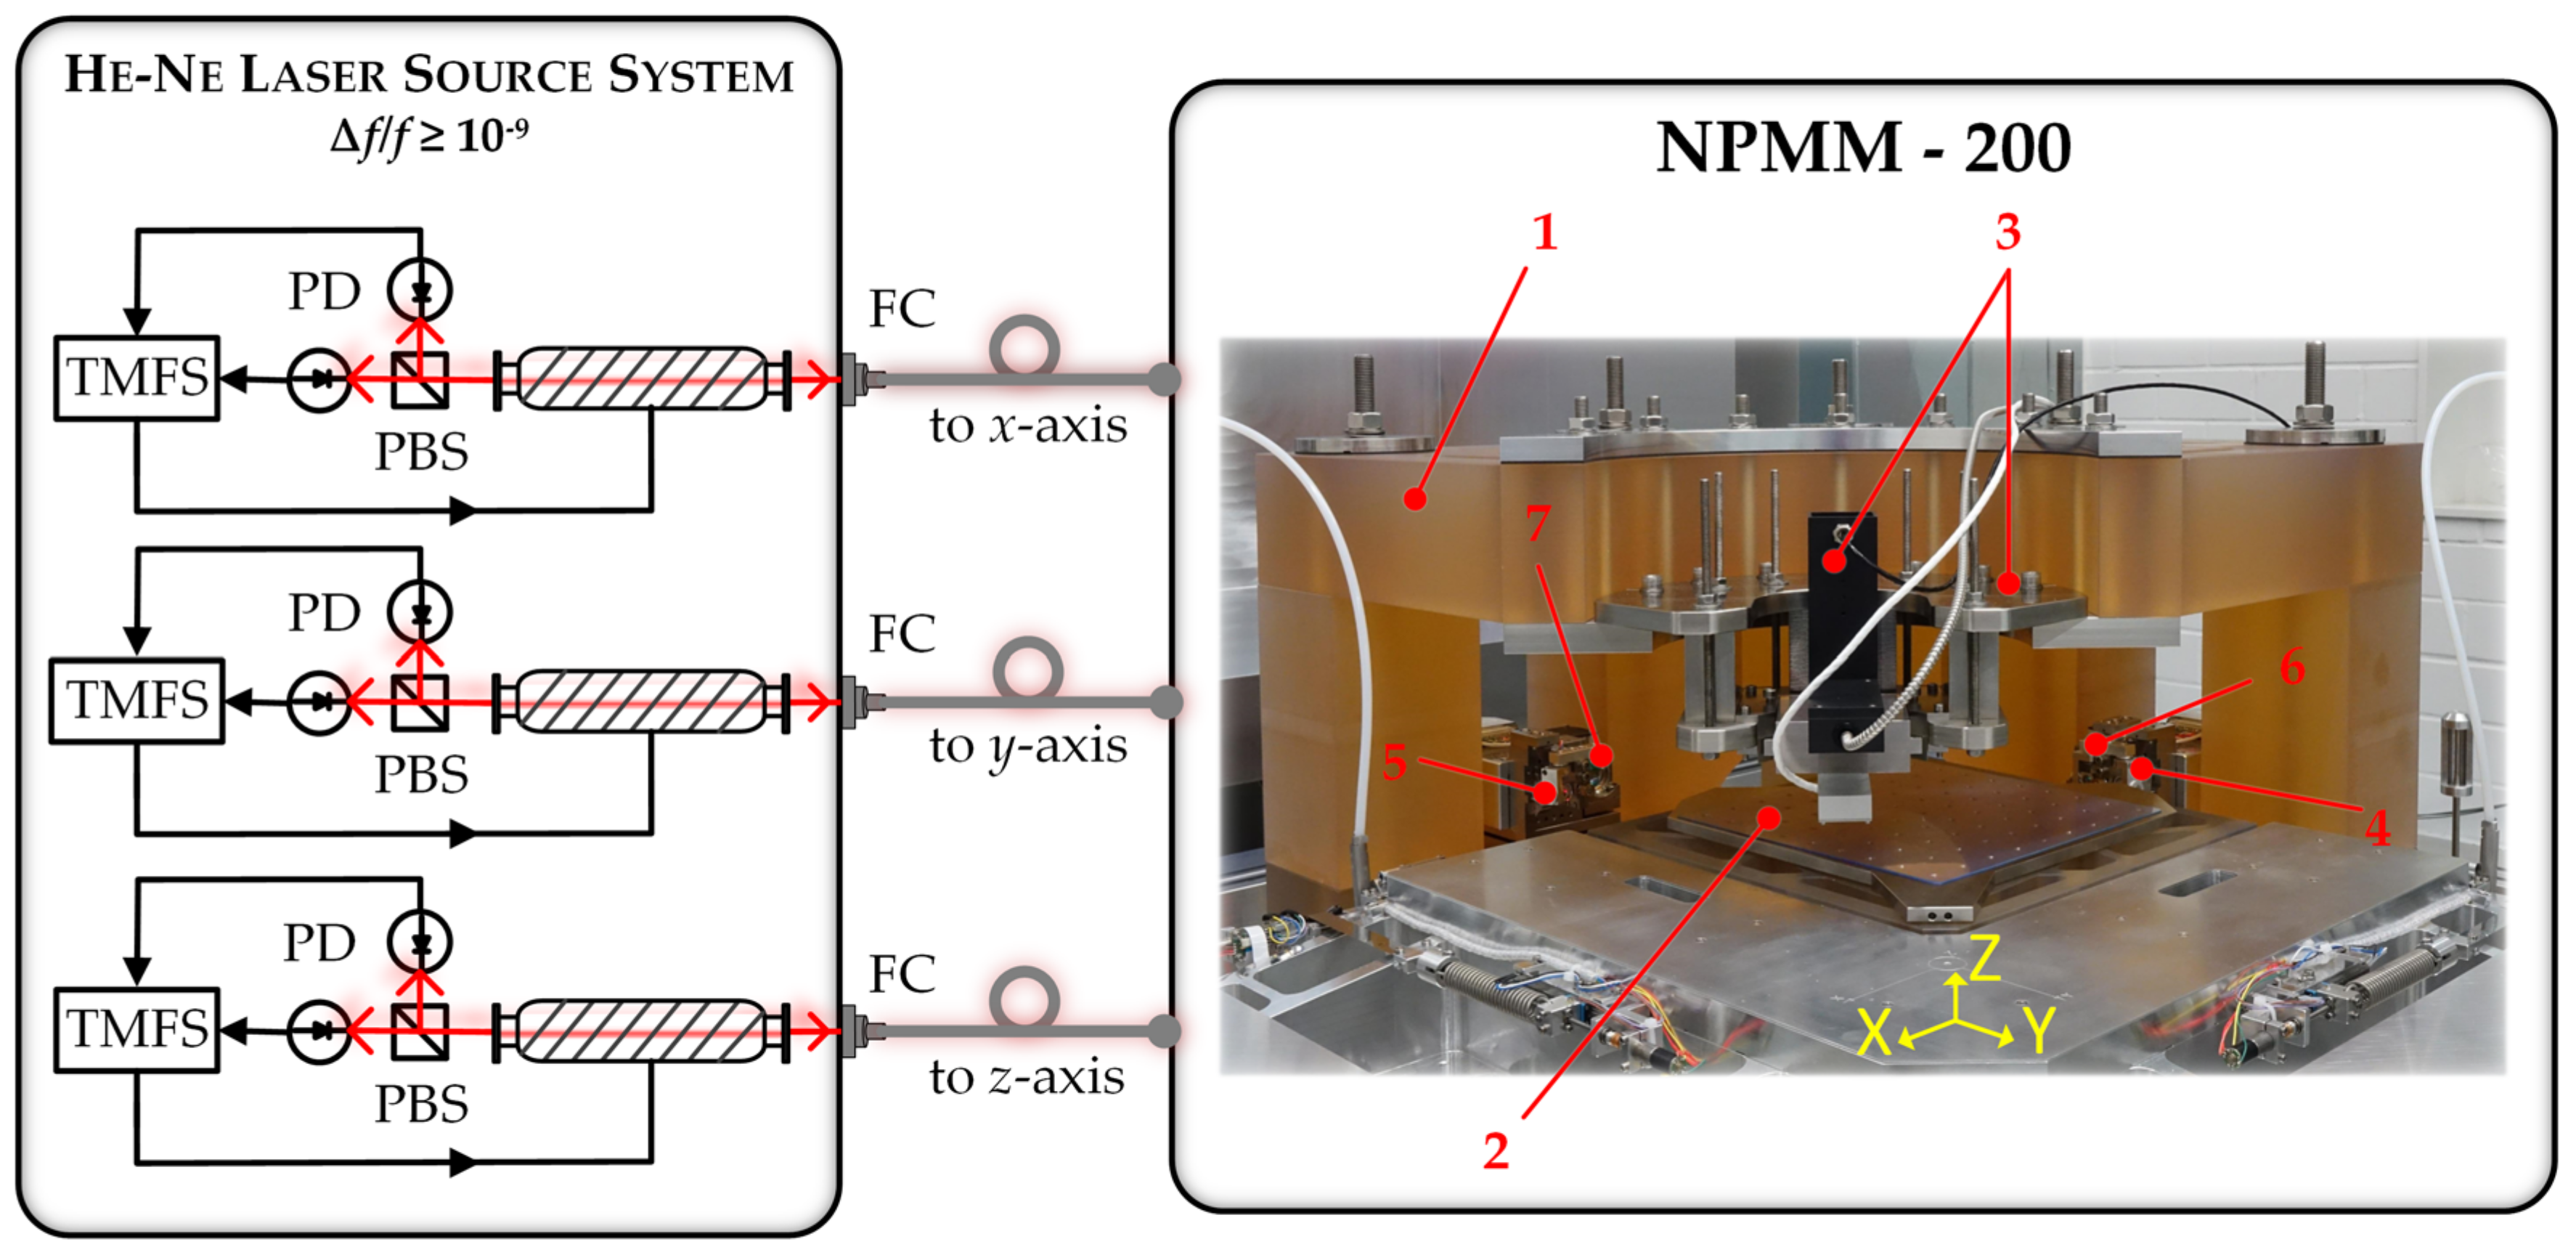
Abstract
:1. Introduction
“… that new femtosecond comb techniques have clear significance for relating the frequency of high-stability optical frequency standards realizing the SI second, that these techniques represent a convenient measurement technique for providing traceability to the International System of Units (SI) and that comb technology also can provide frequency sources as well as a measurement technique.”
2. Experimental Configuration and Methods
2.1. State of the Art Length Measuring System of the NPMM-200
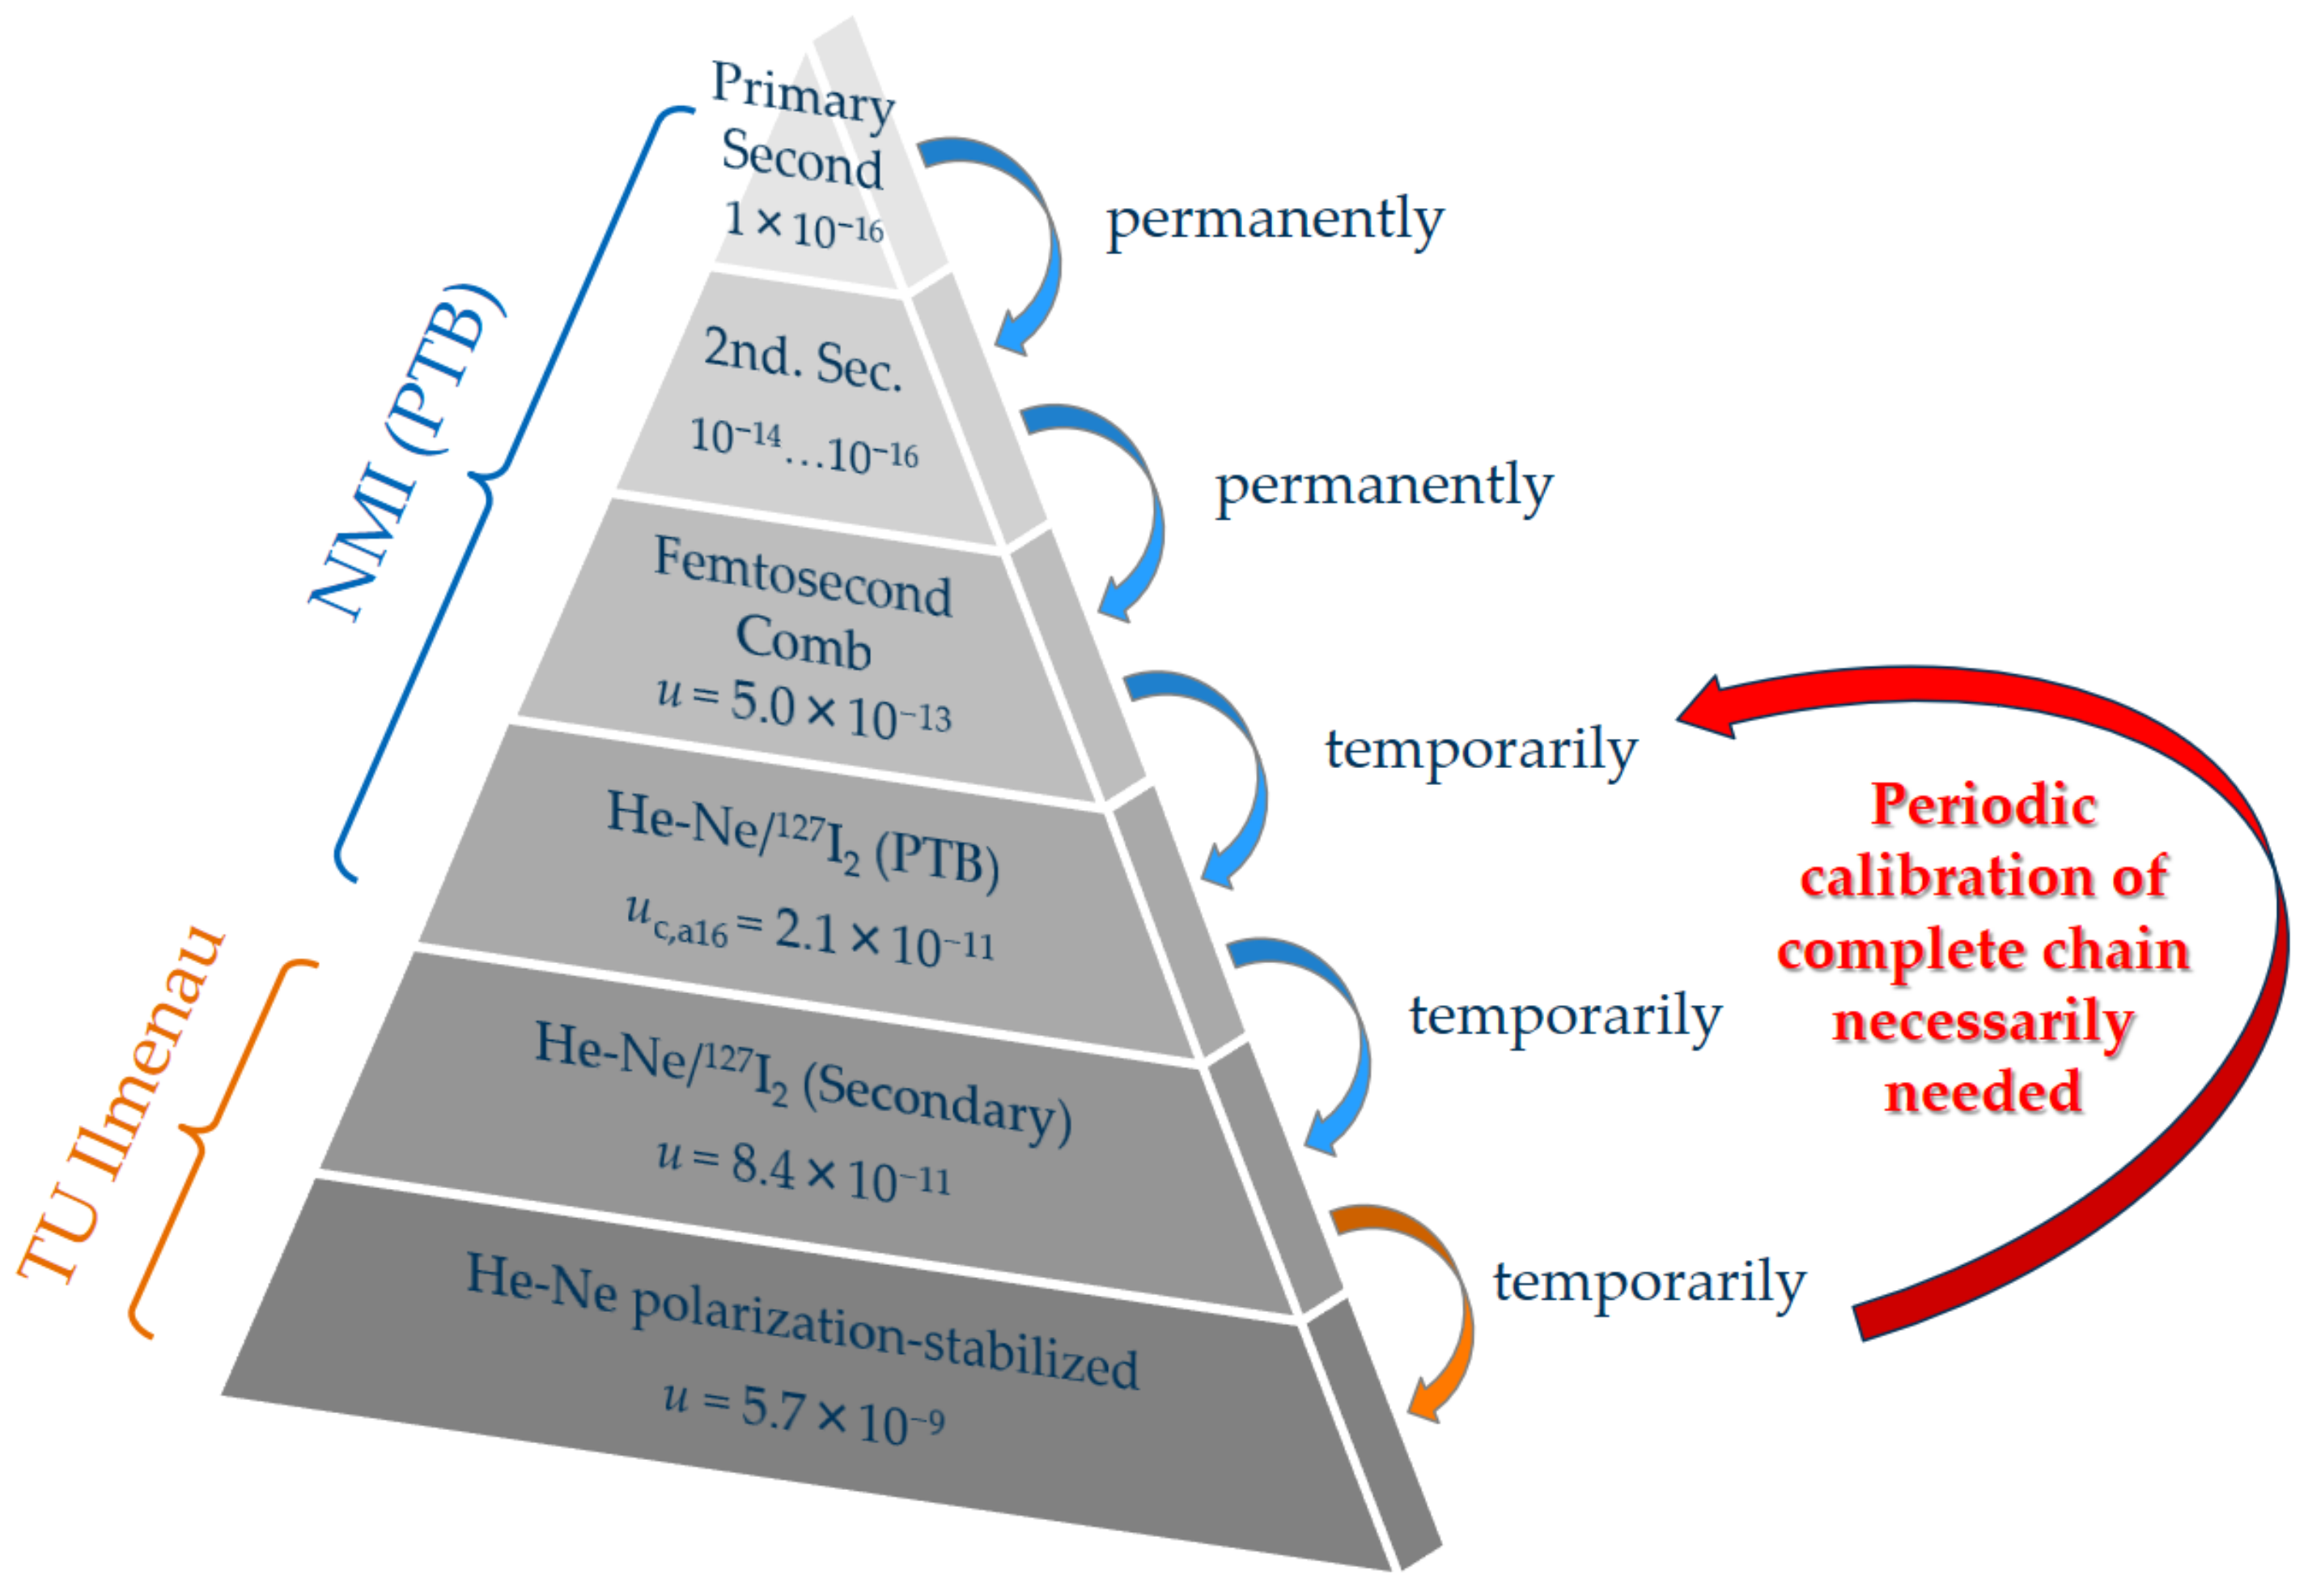
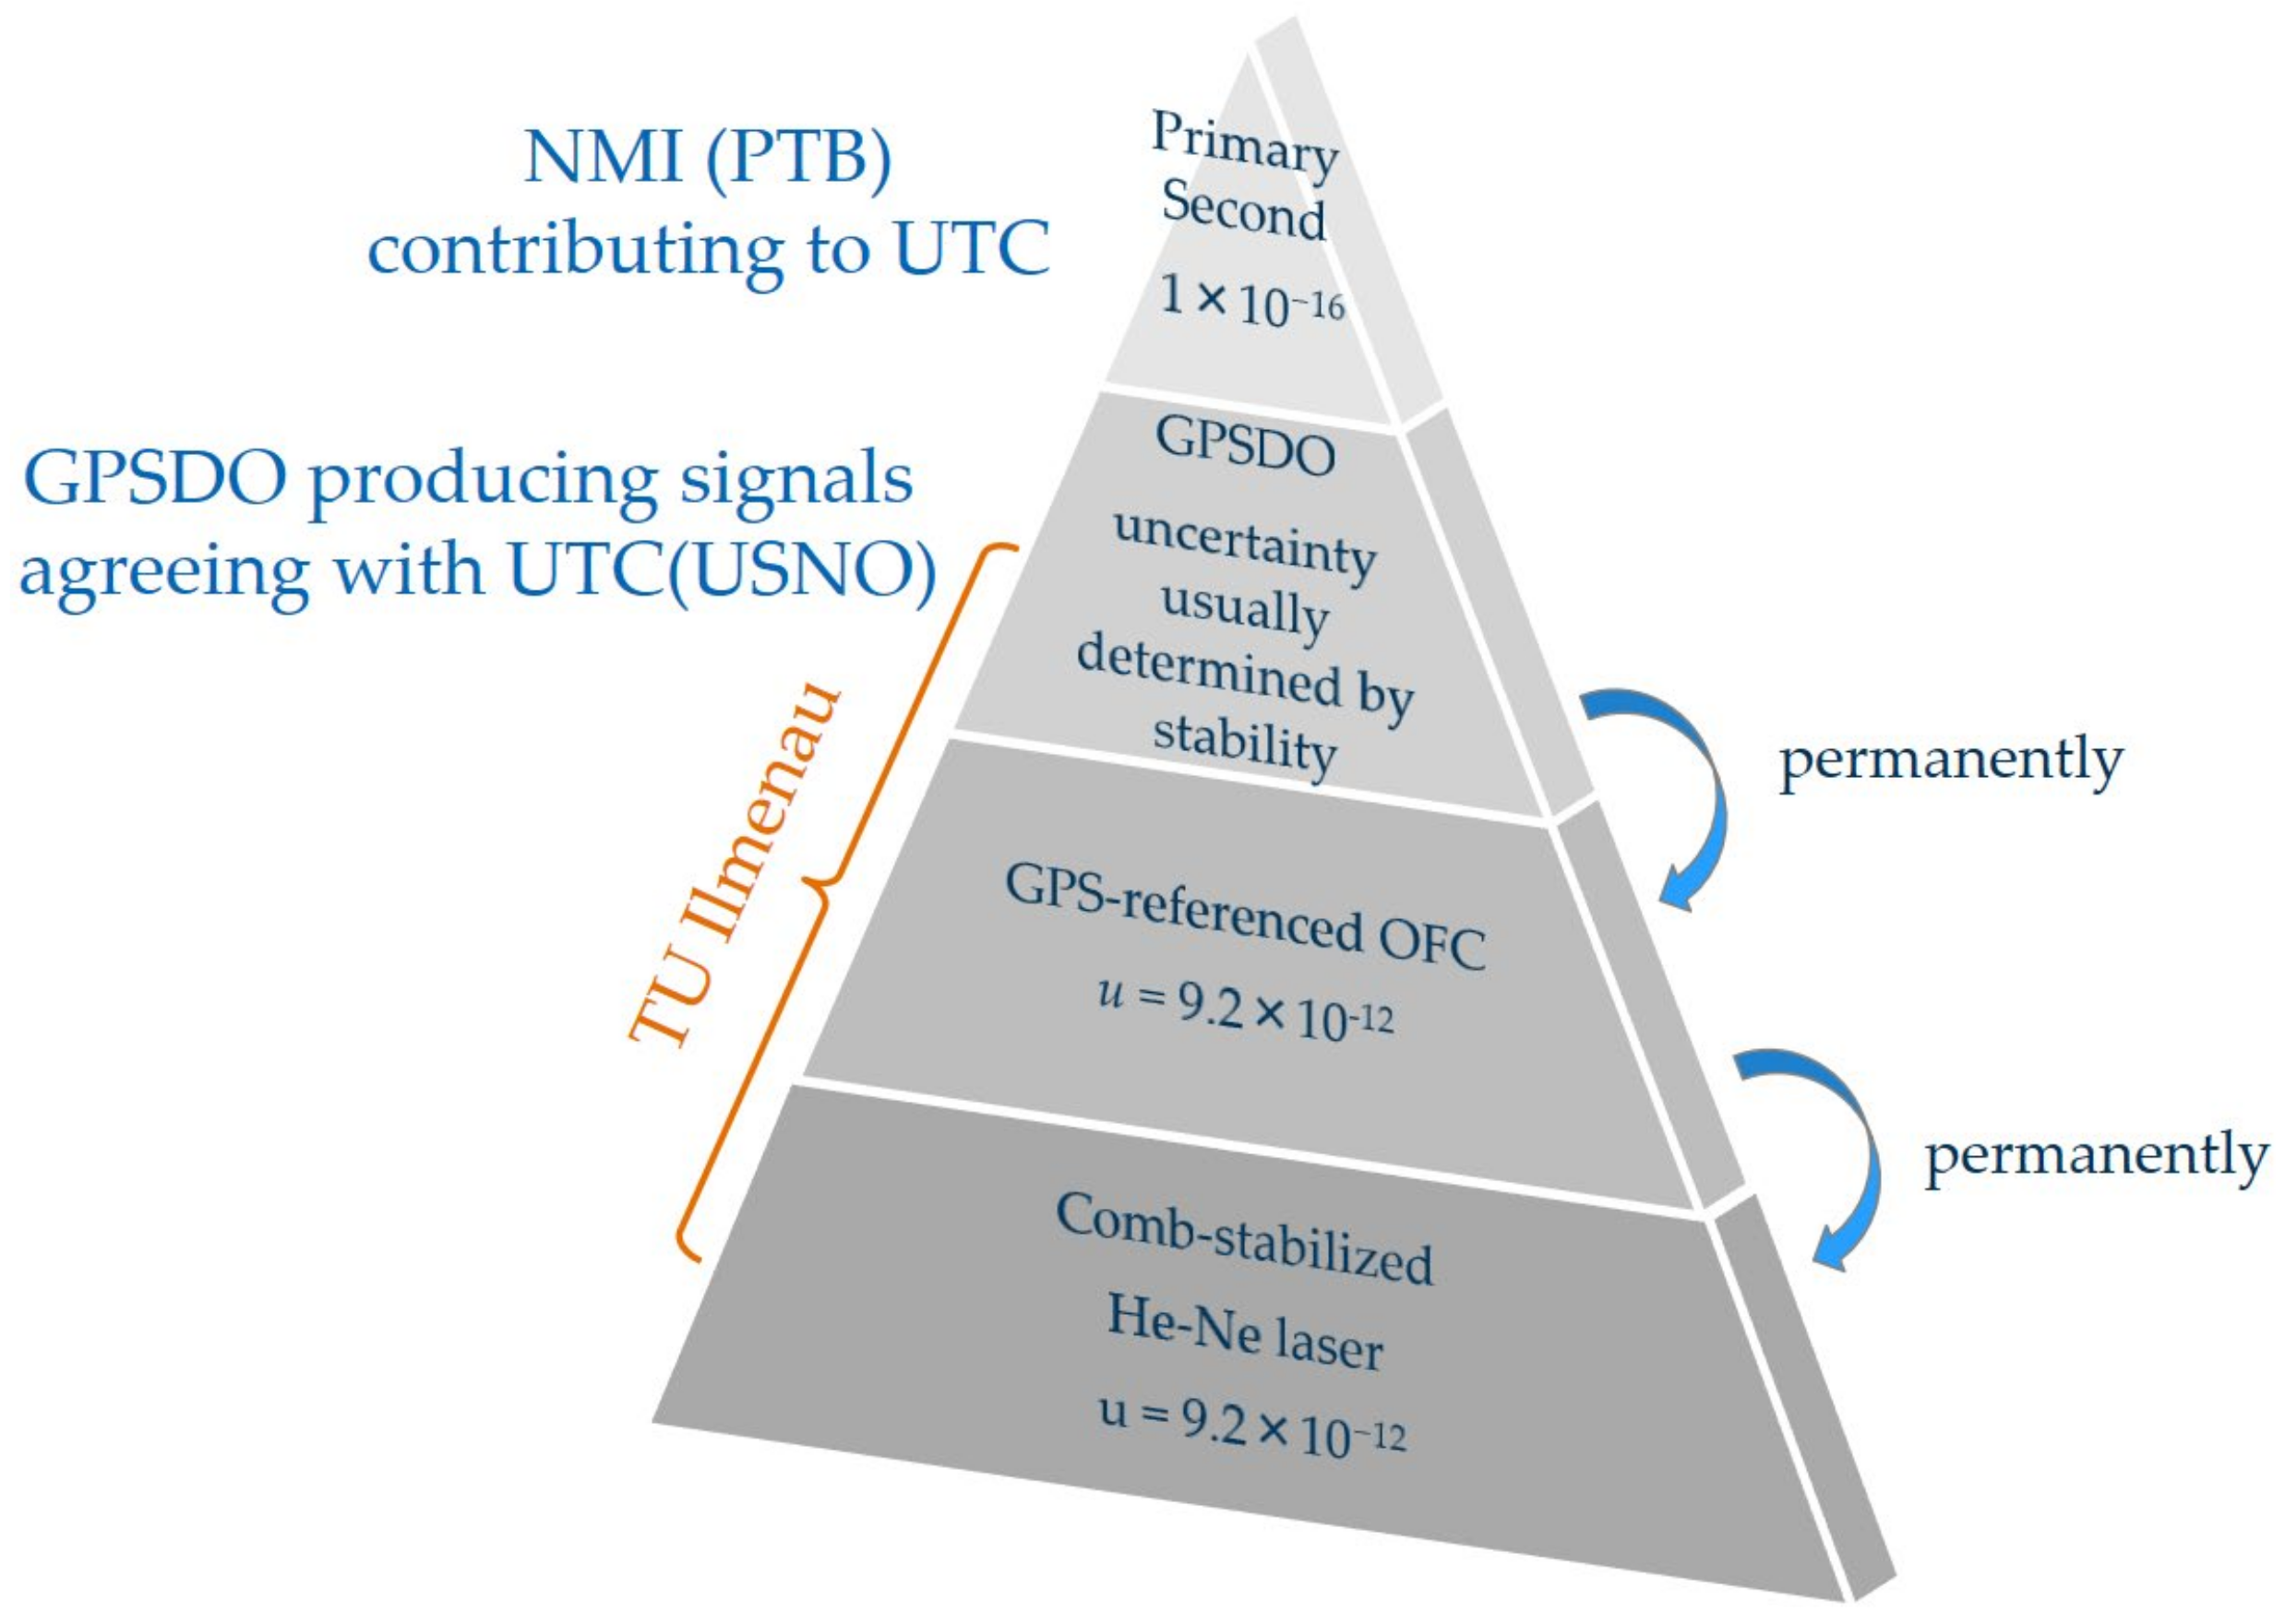
2.2. Metrological Basis for Generation of Ultrastable, Traceable Optical Frequencies at 633 nm
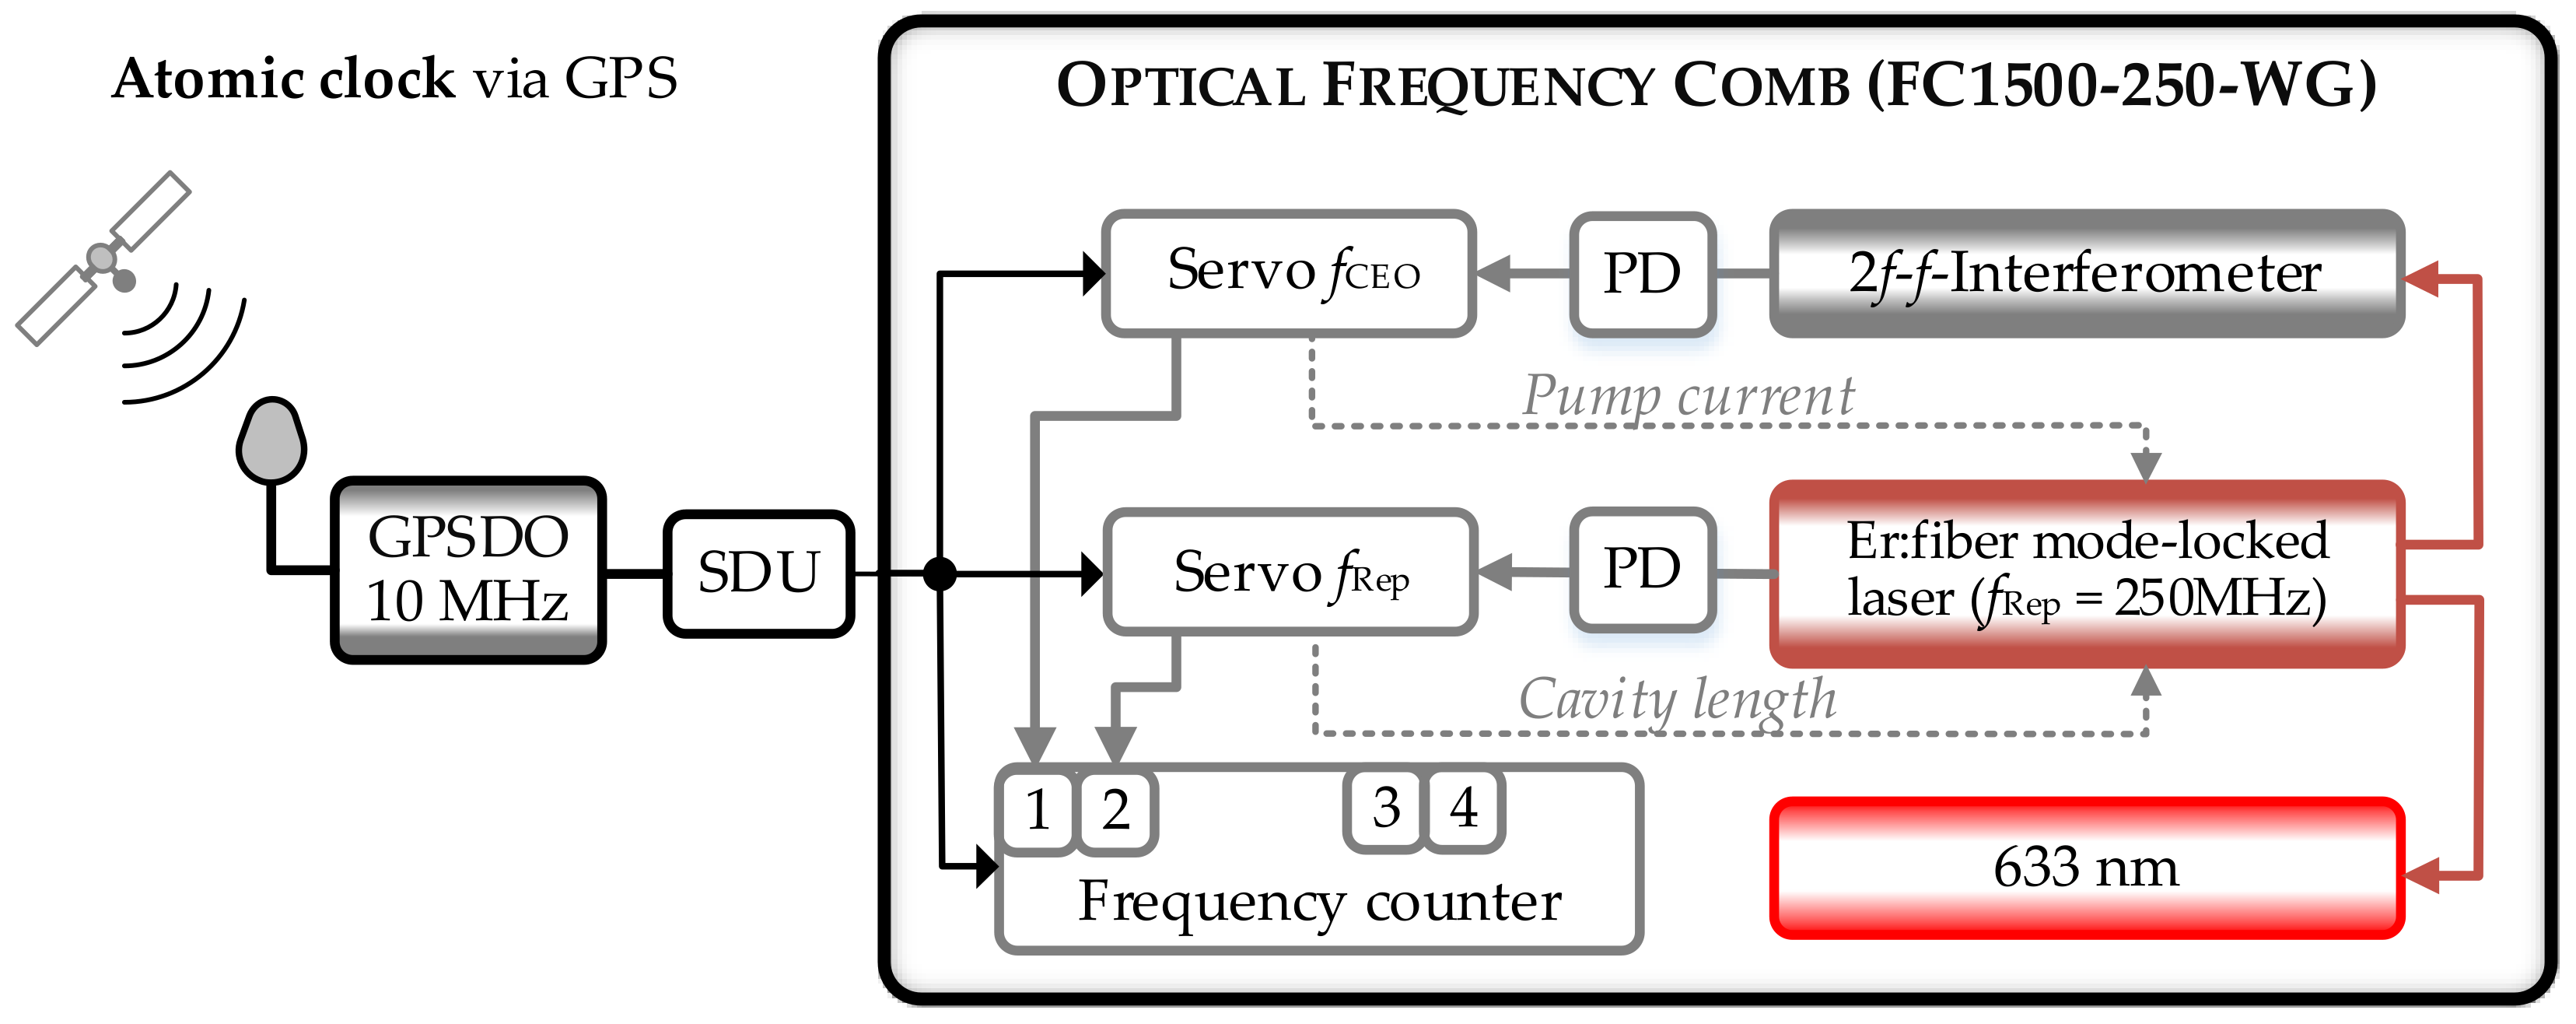
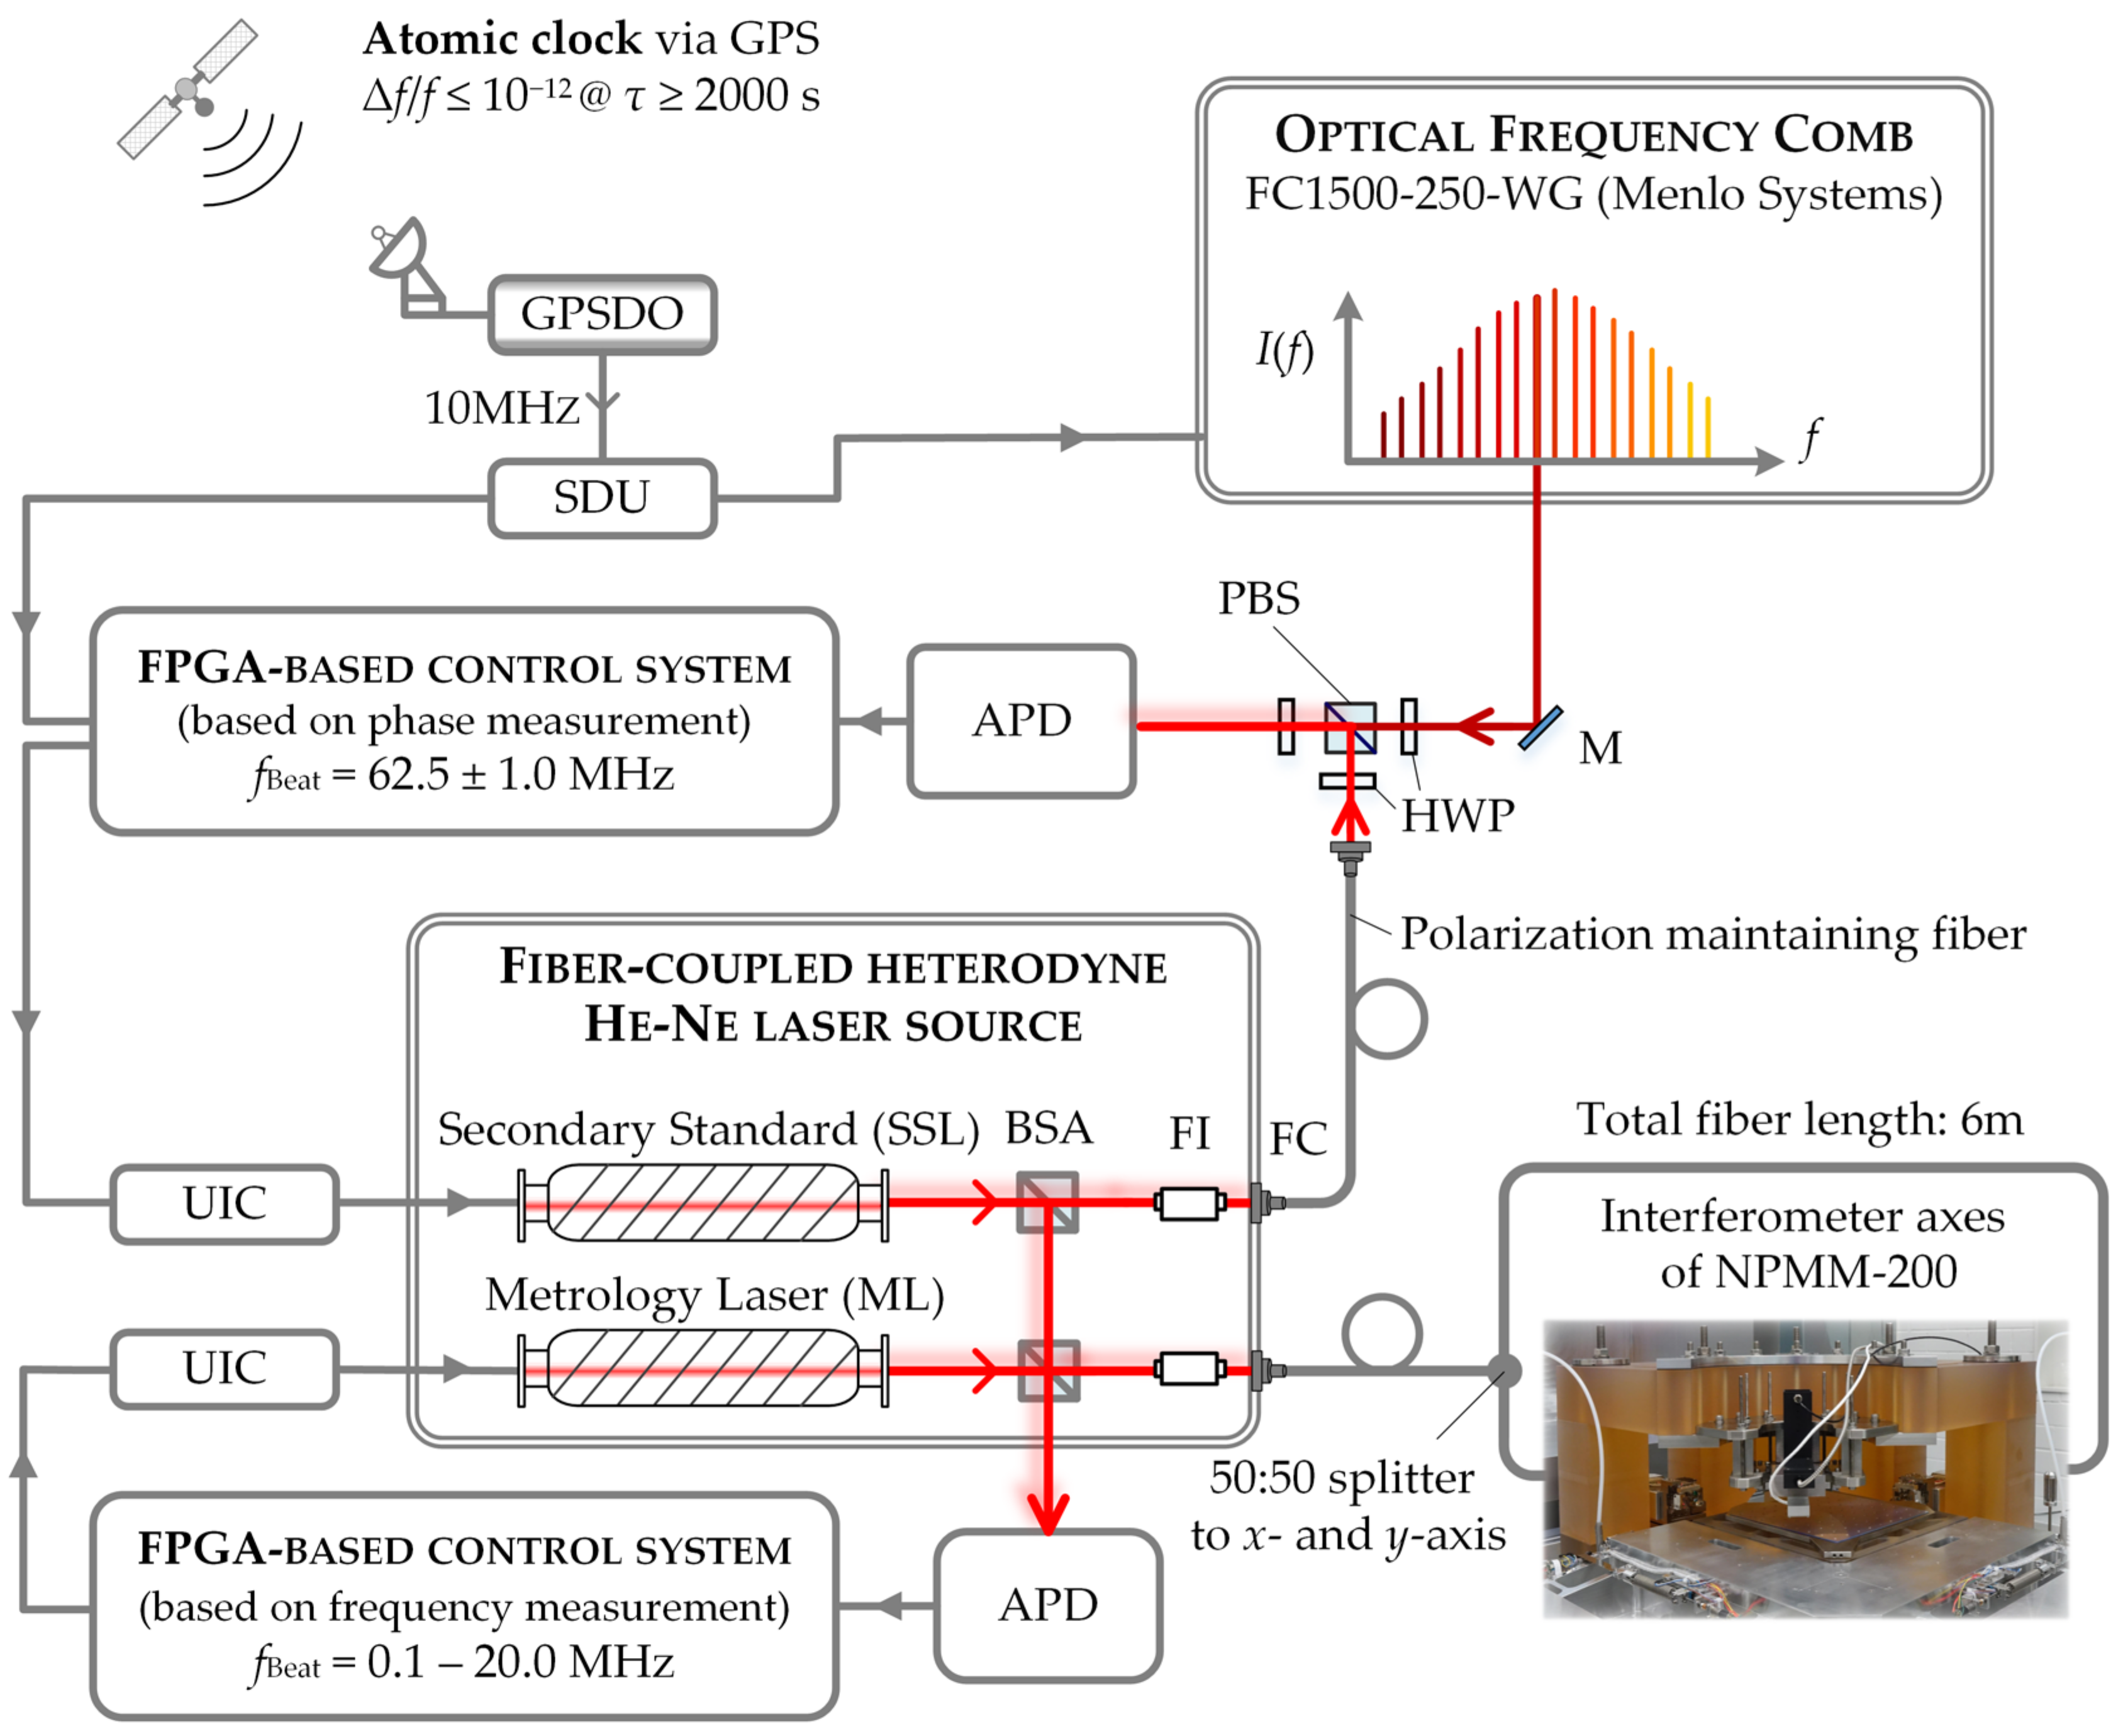
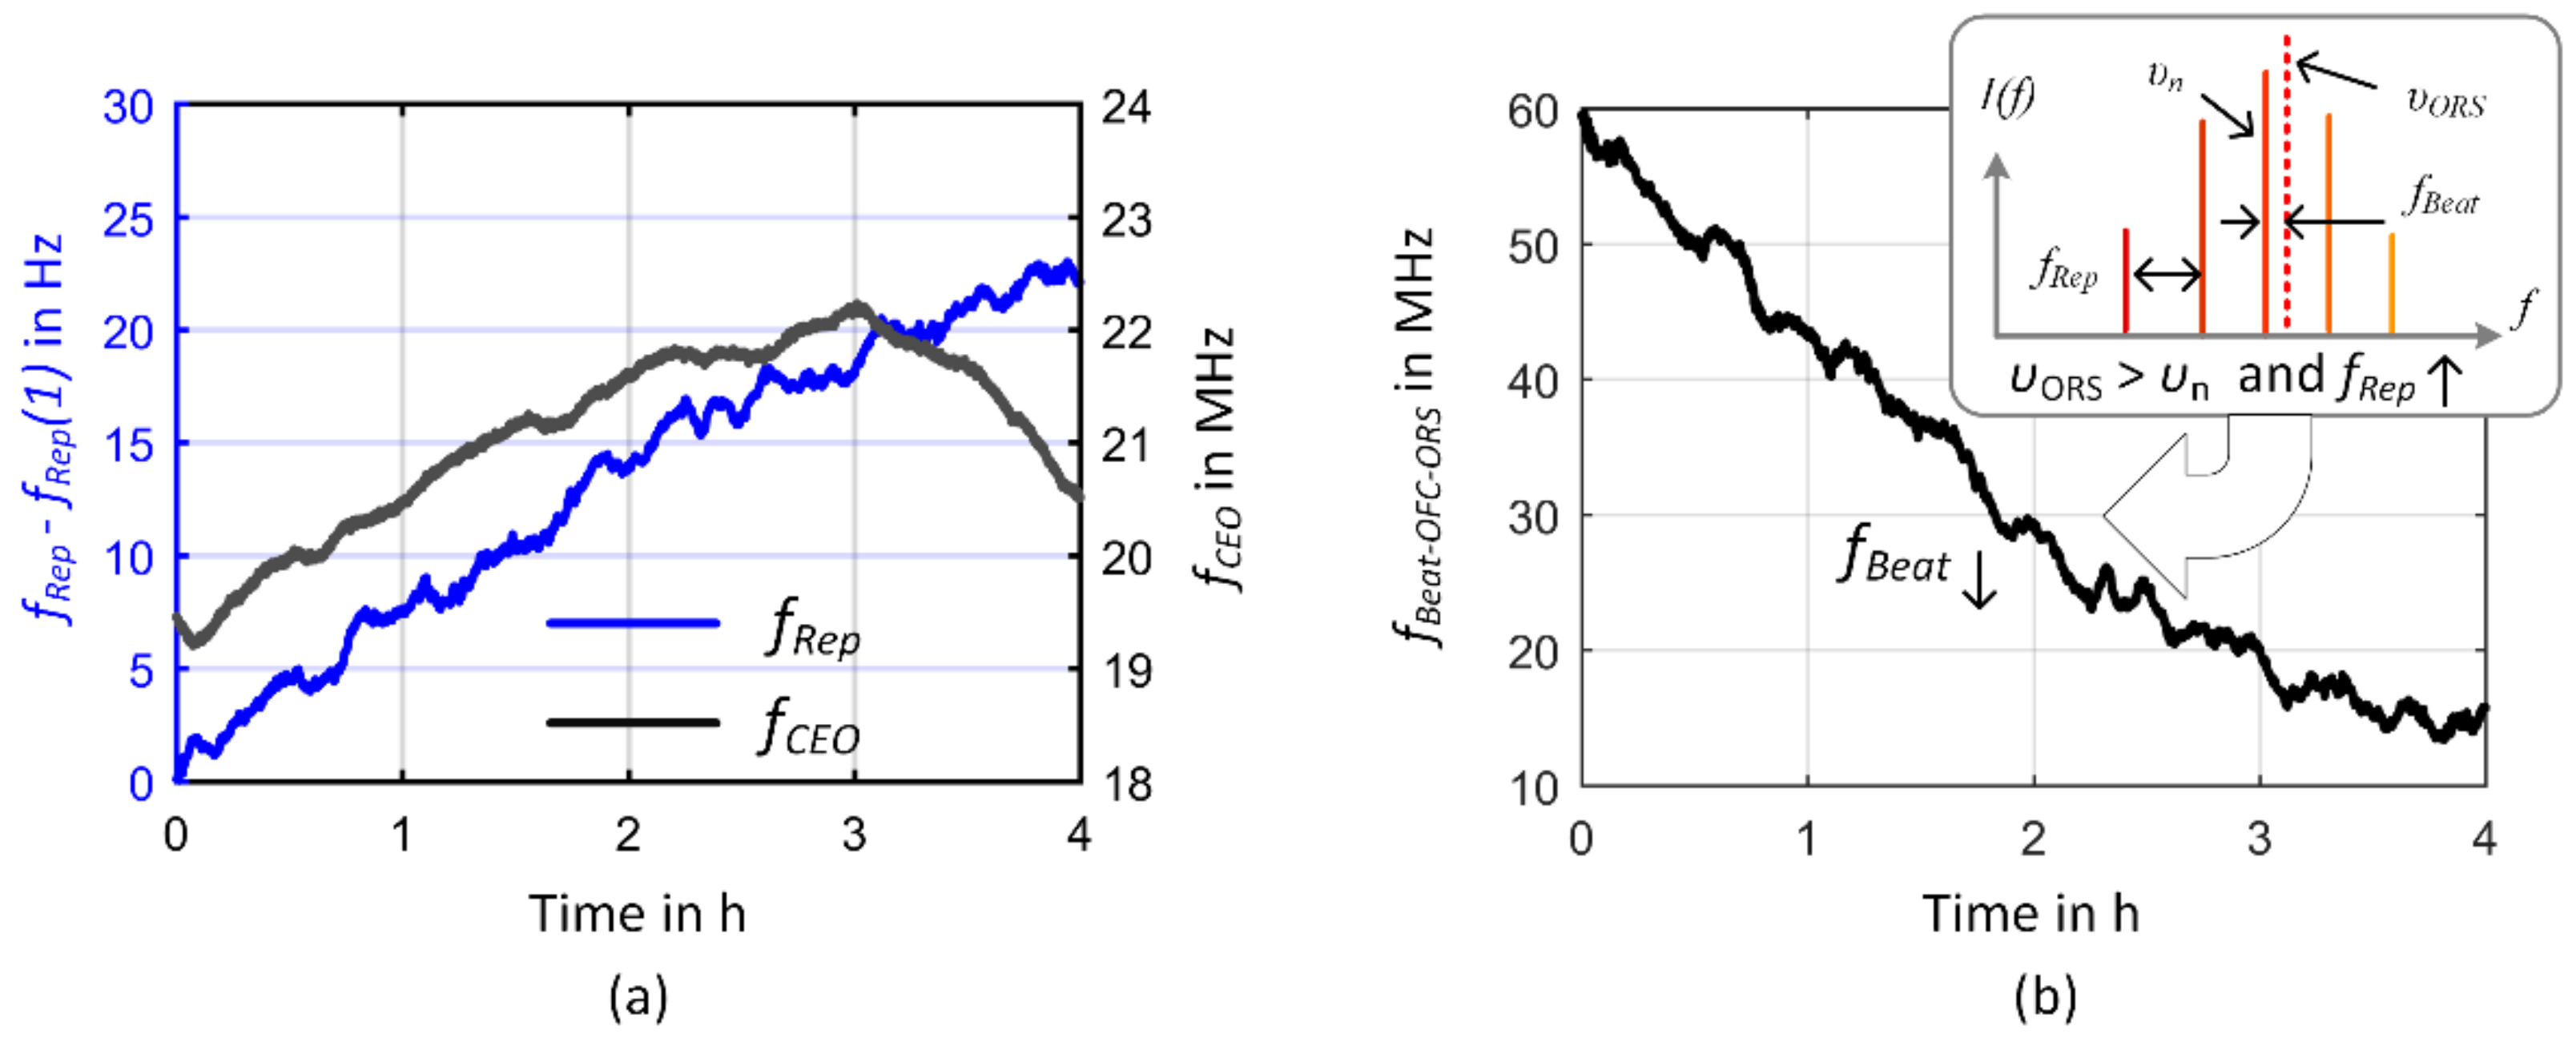
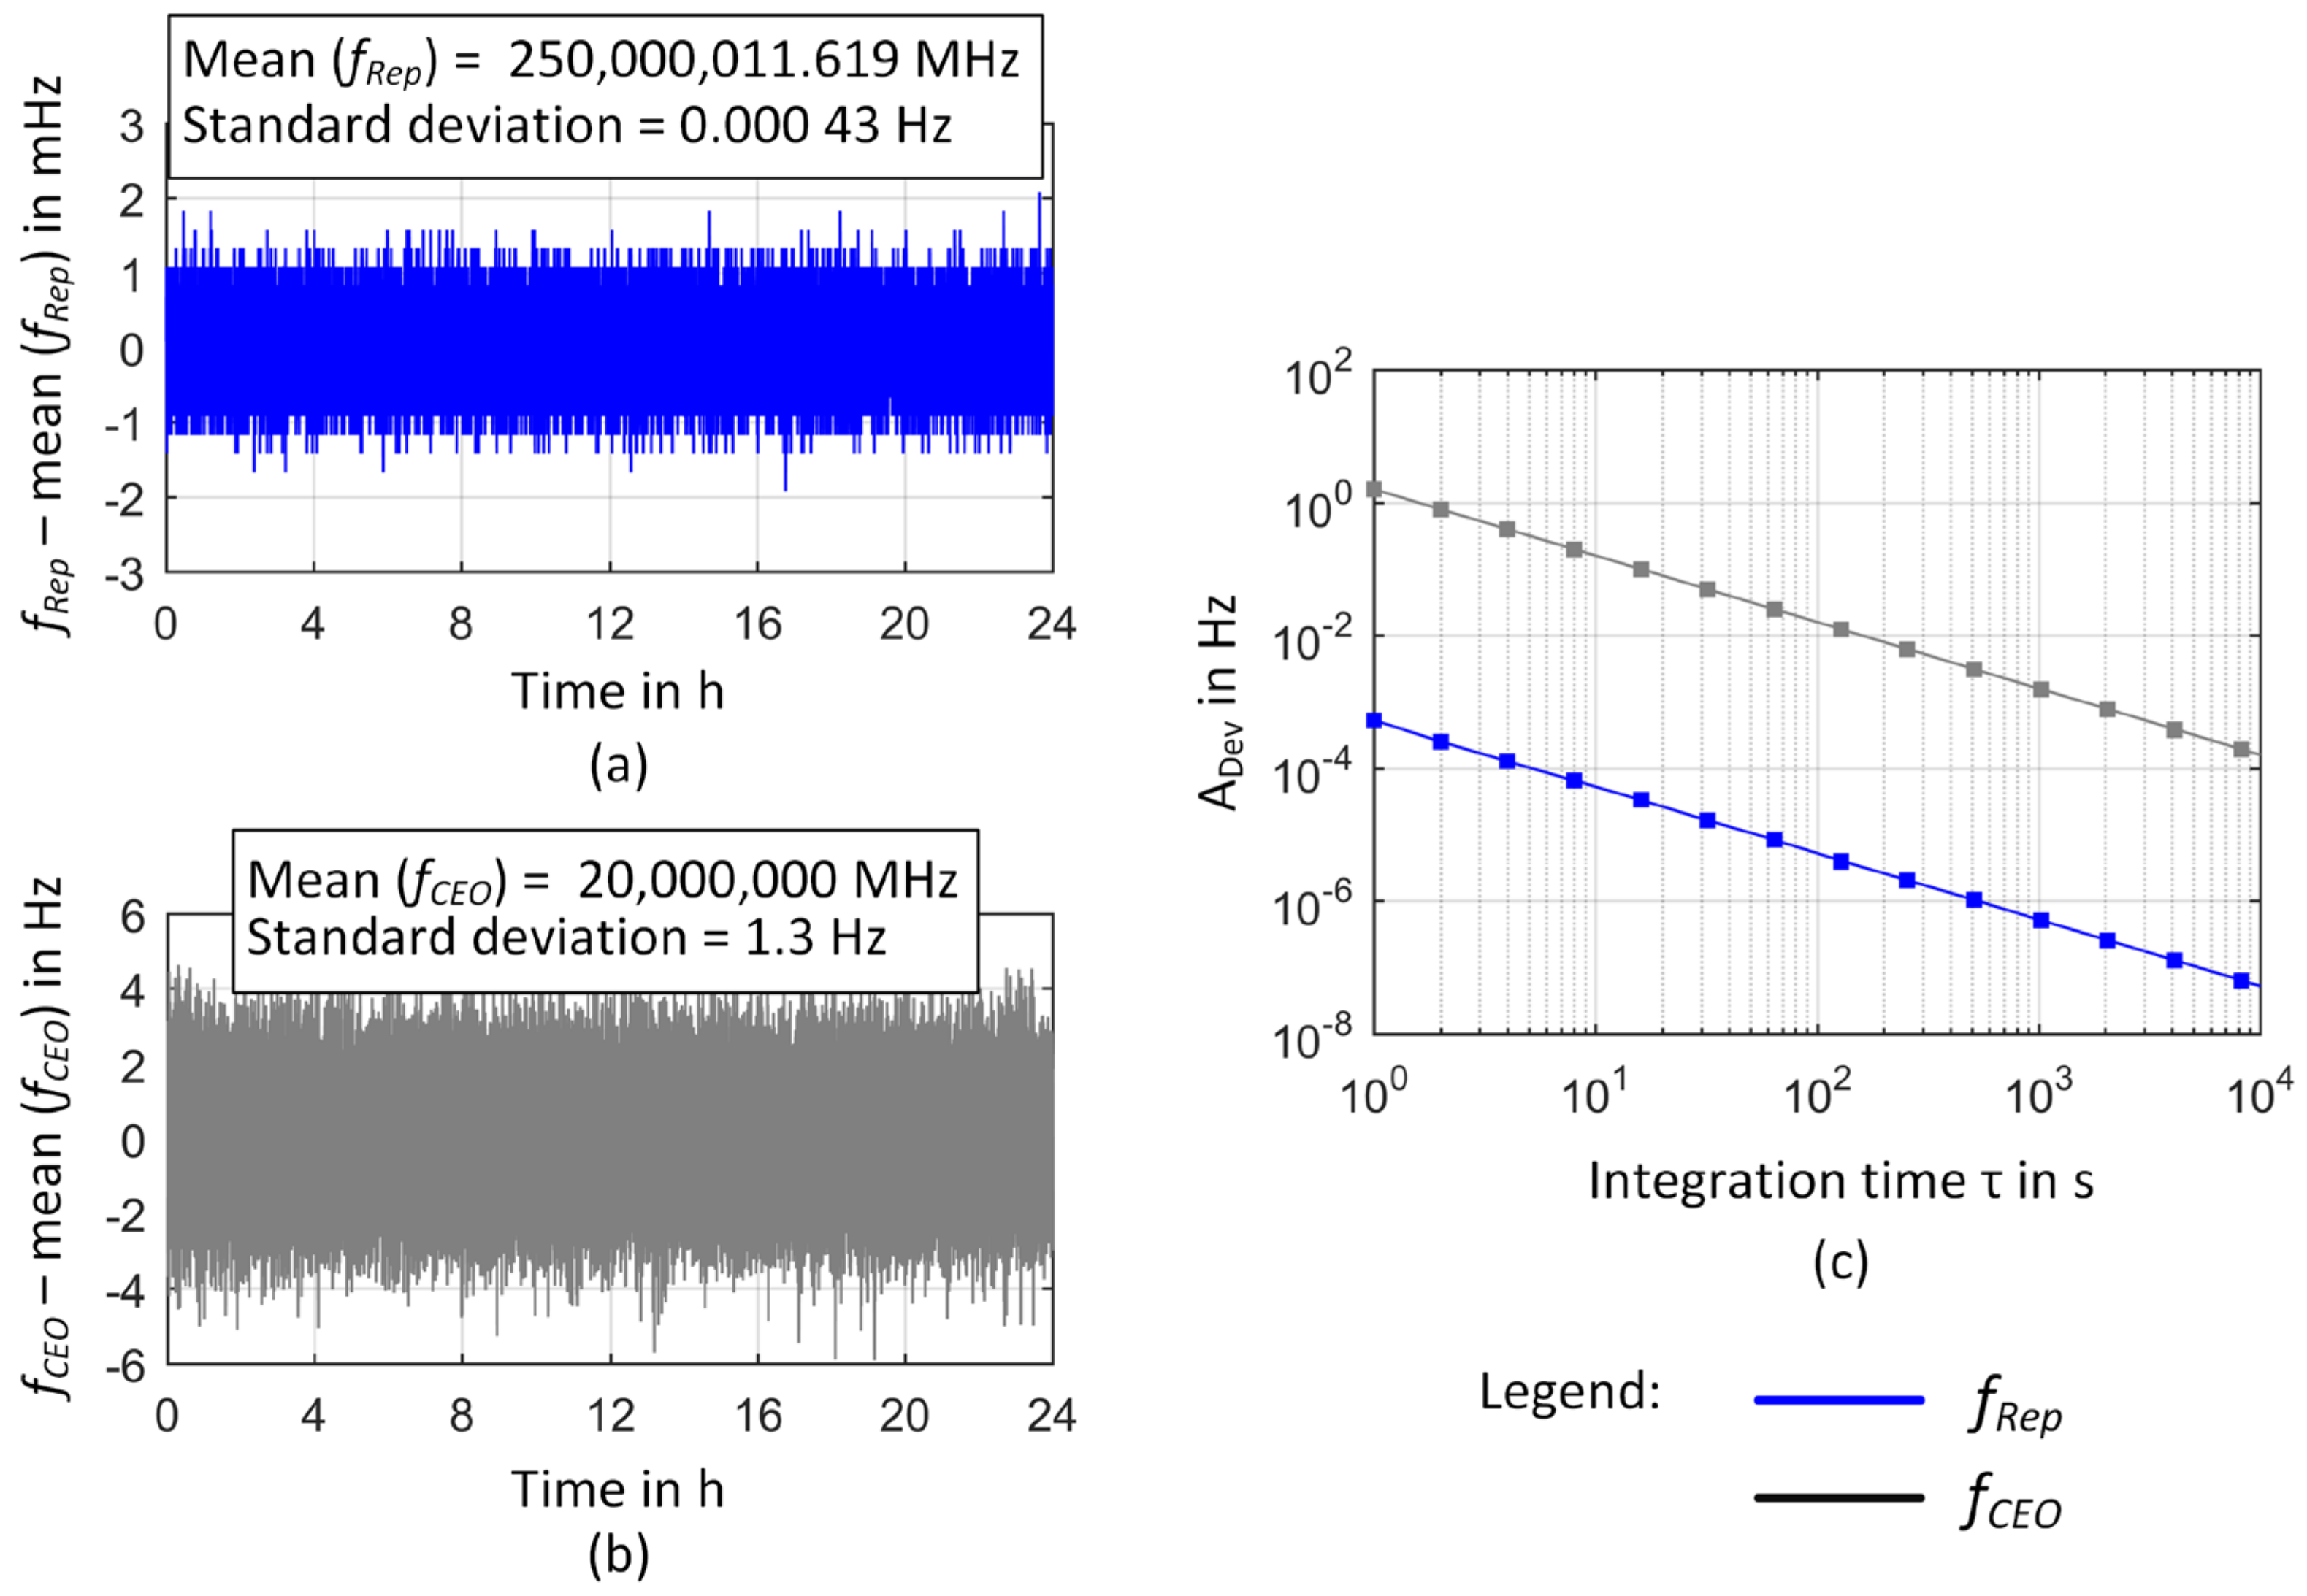
2.2.1. GPS-Referenced Frequency Comb (OFC)
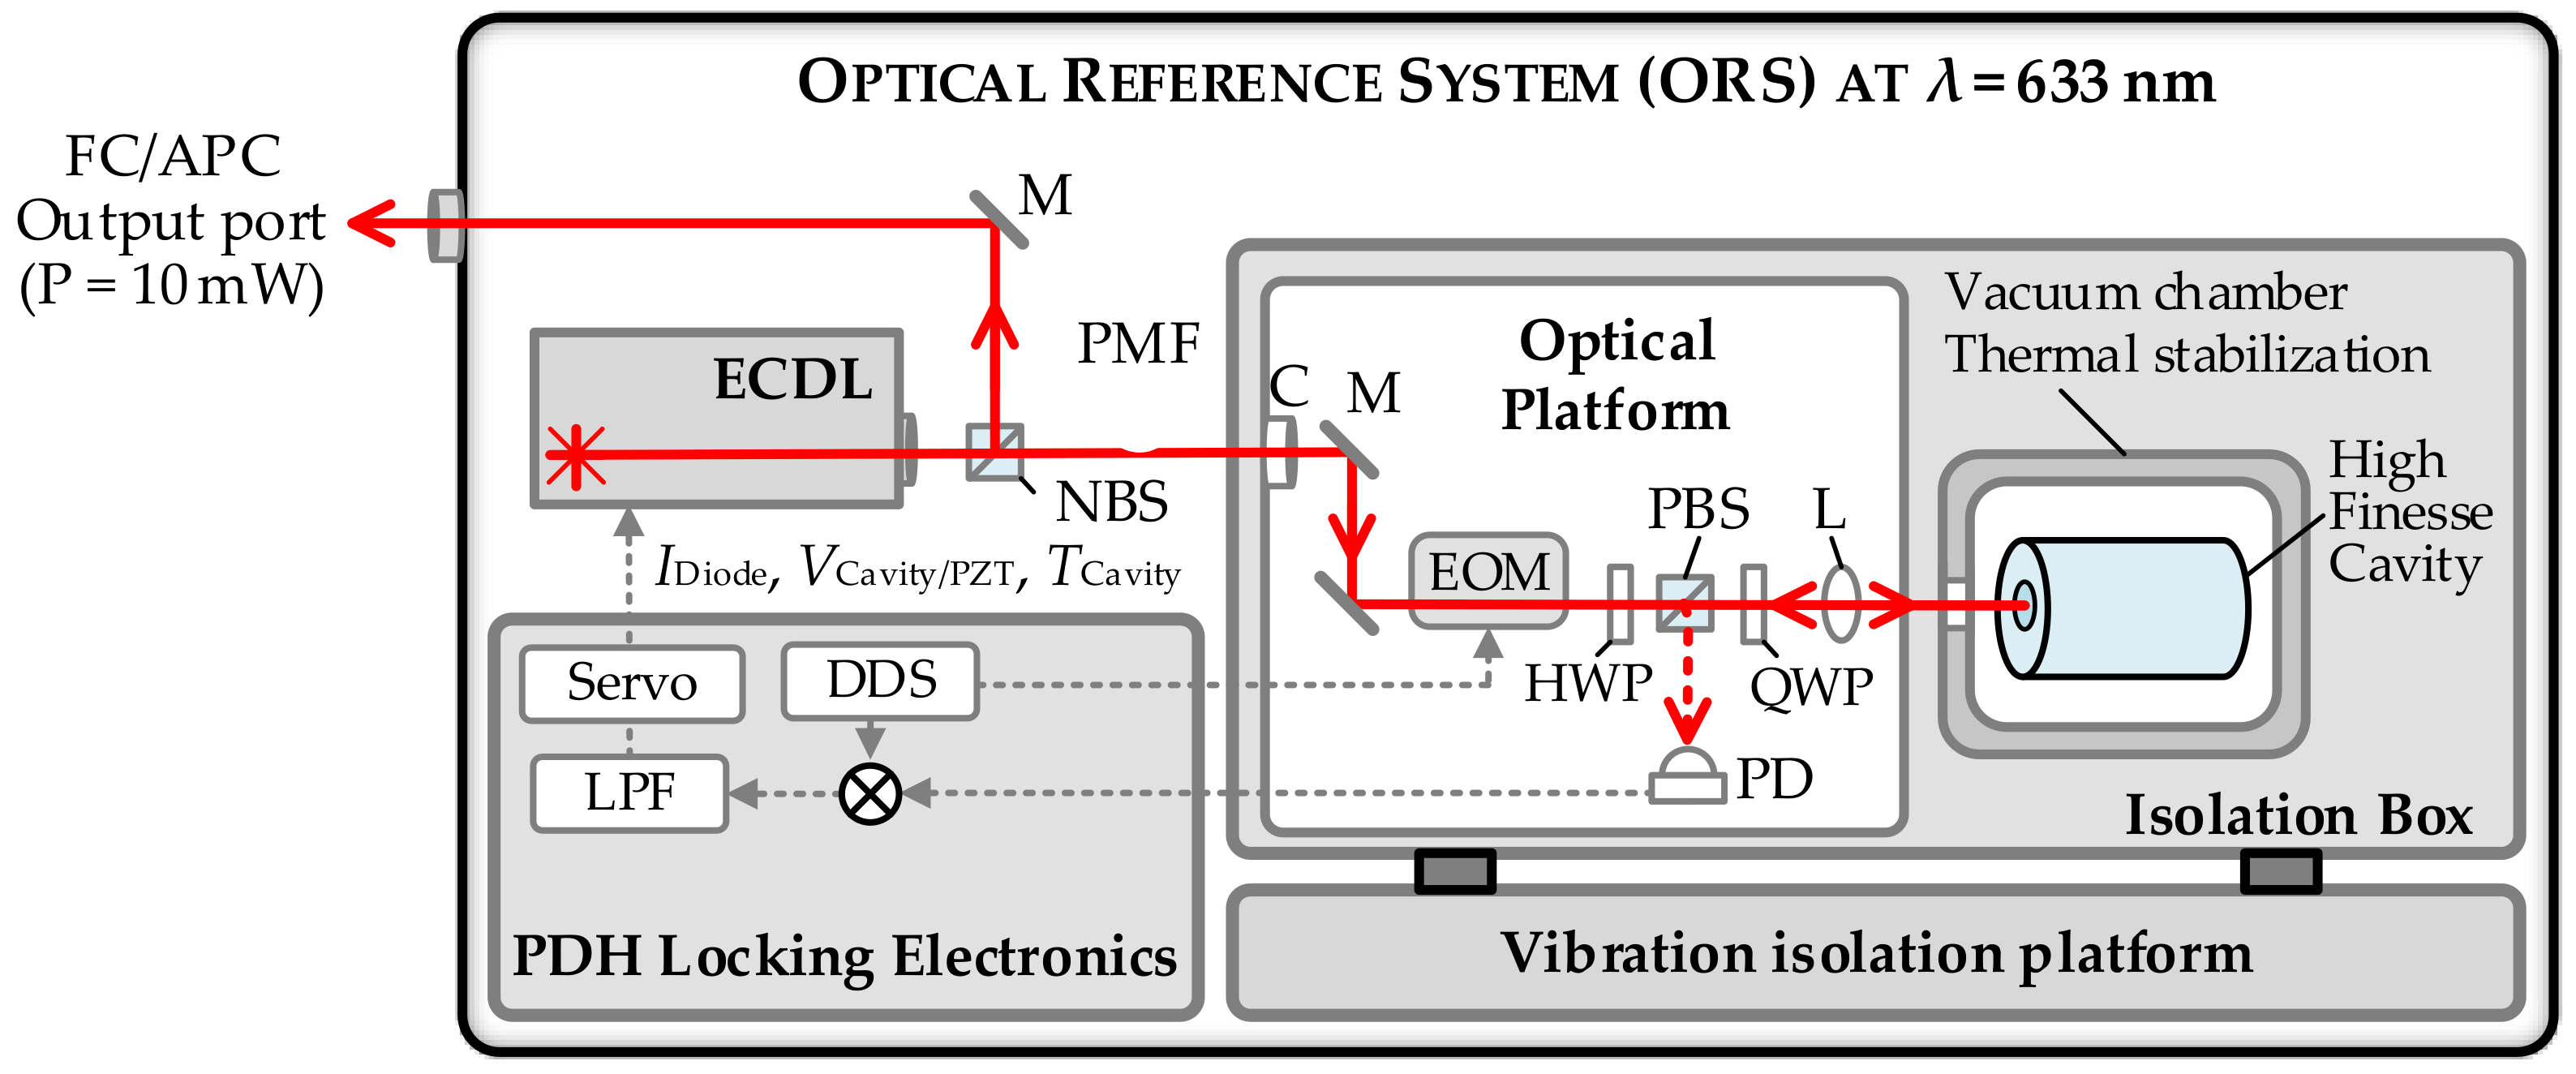
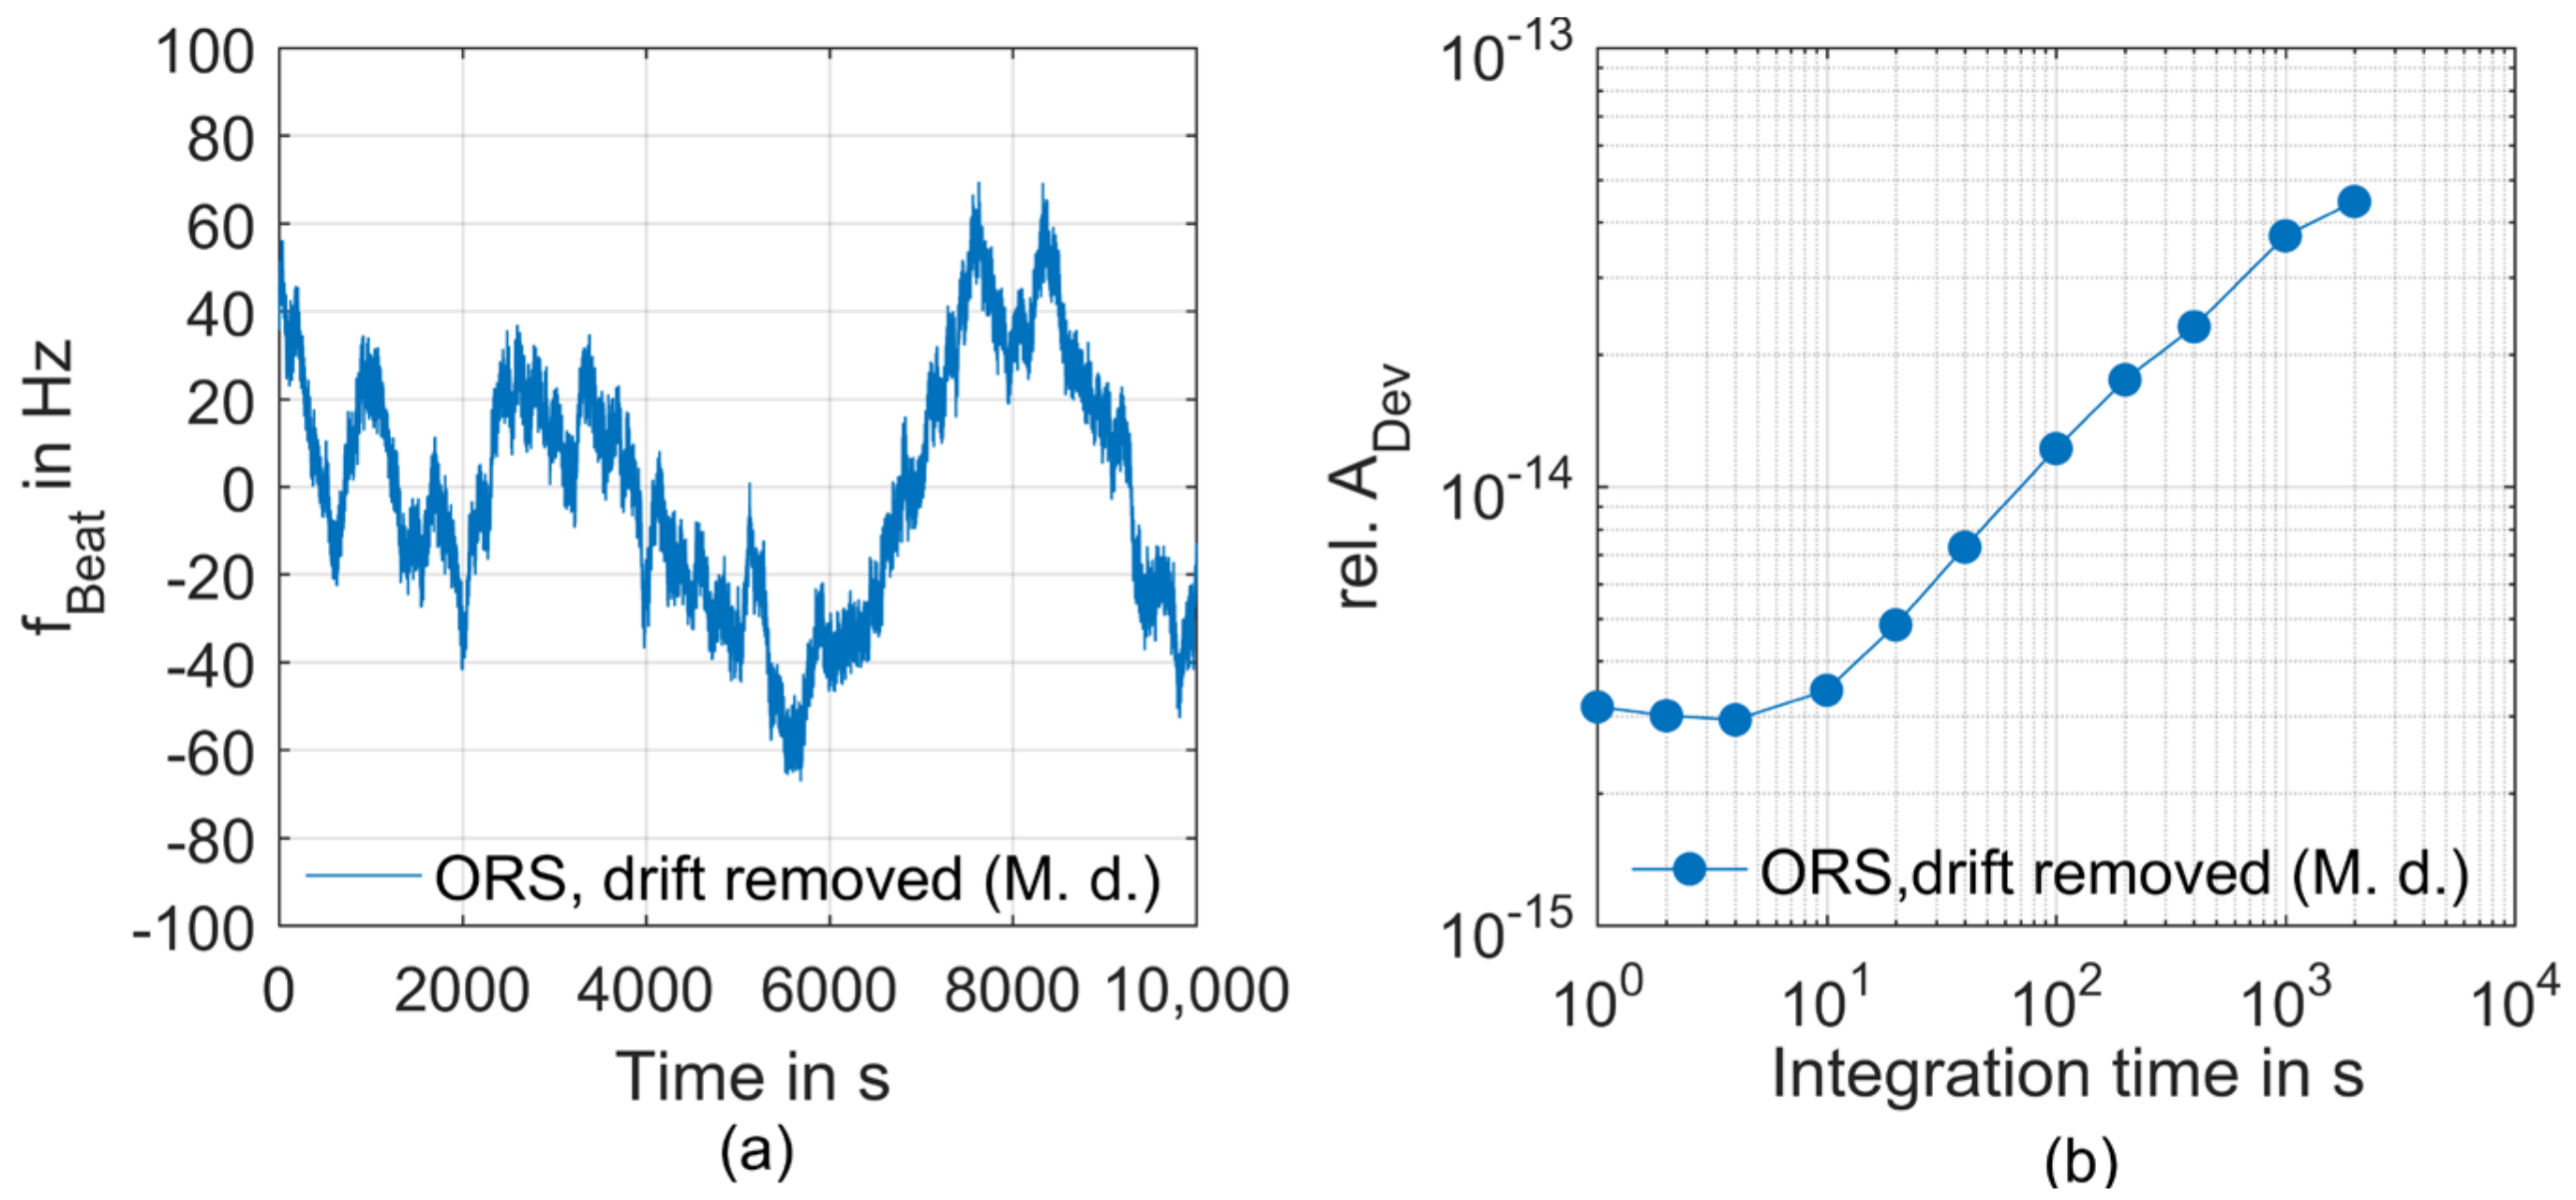
2.2.2. Optical Reference System (ORS)
2.3. Comb-Referenced, Fiber-Coupled He-Ne Laser Source
2.4. Analysis of Frequency Instability
3. Results and Discussion
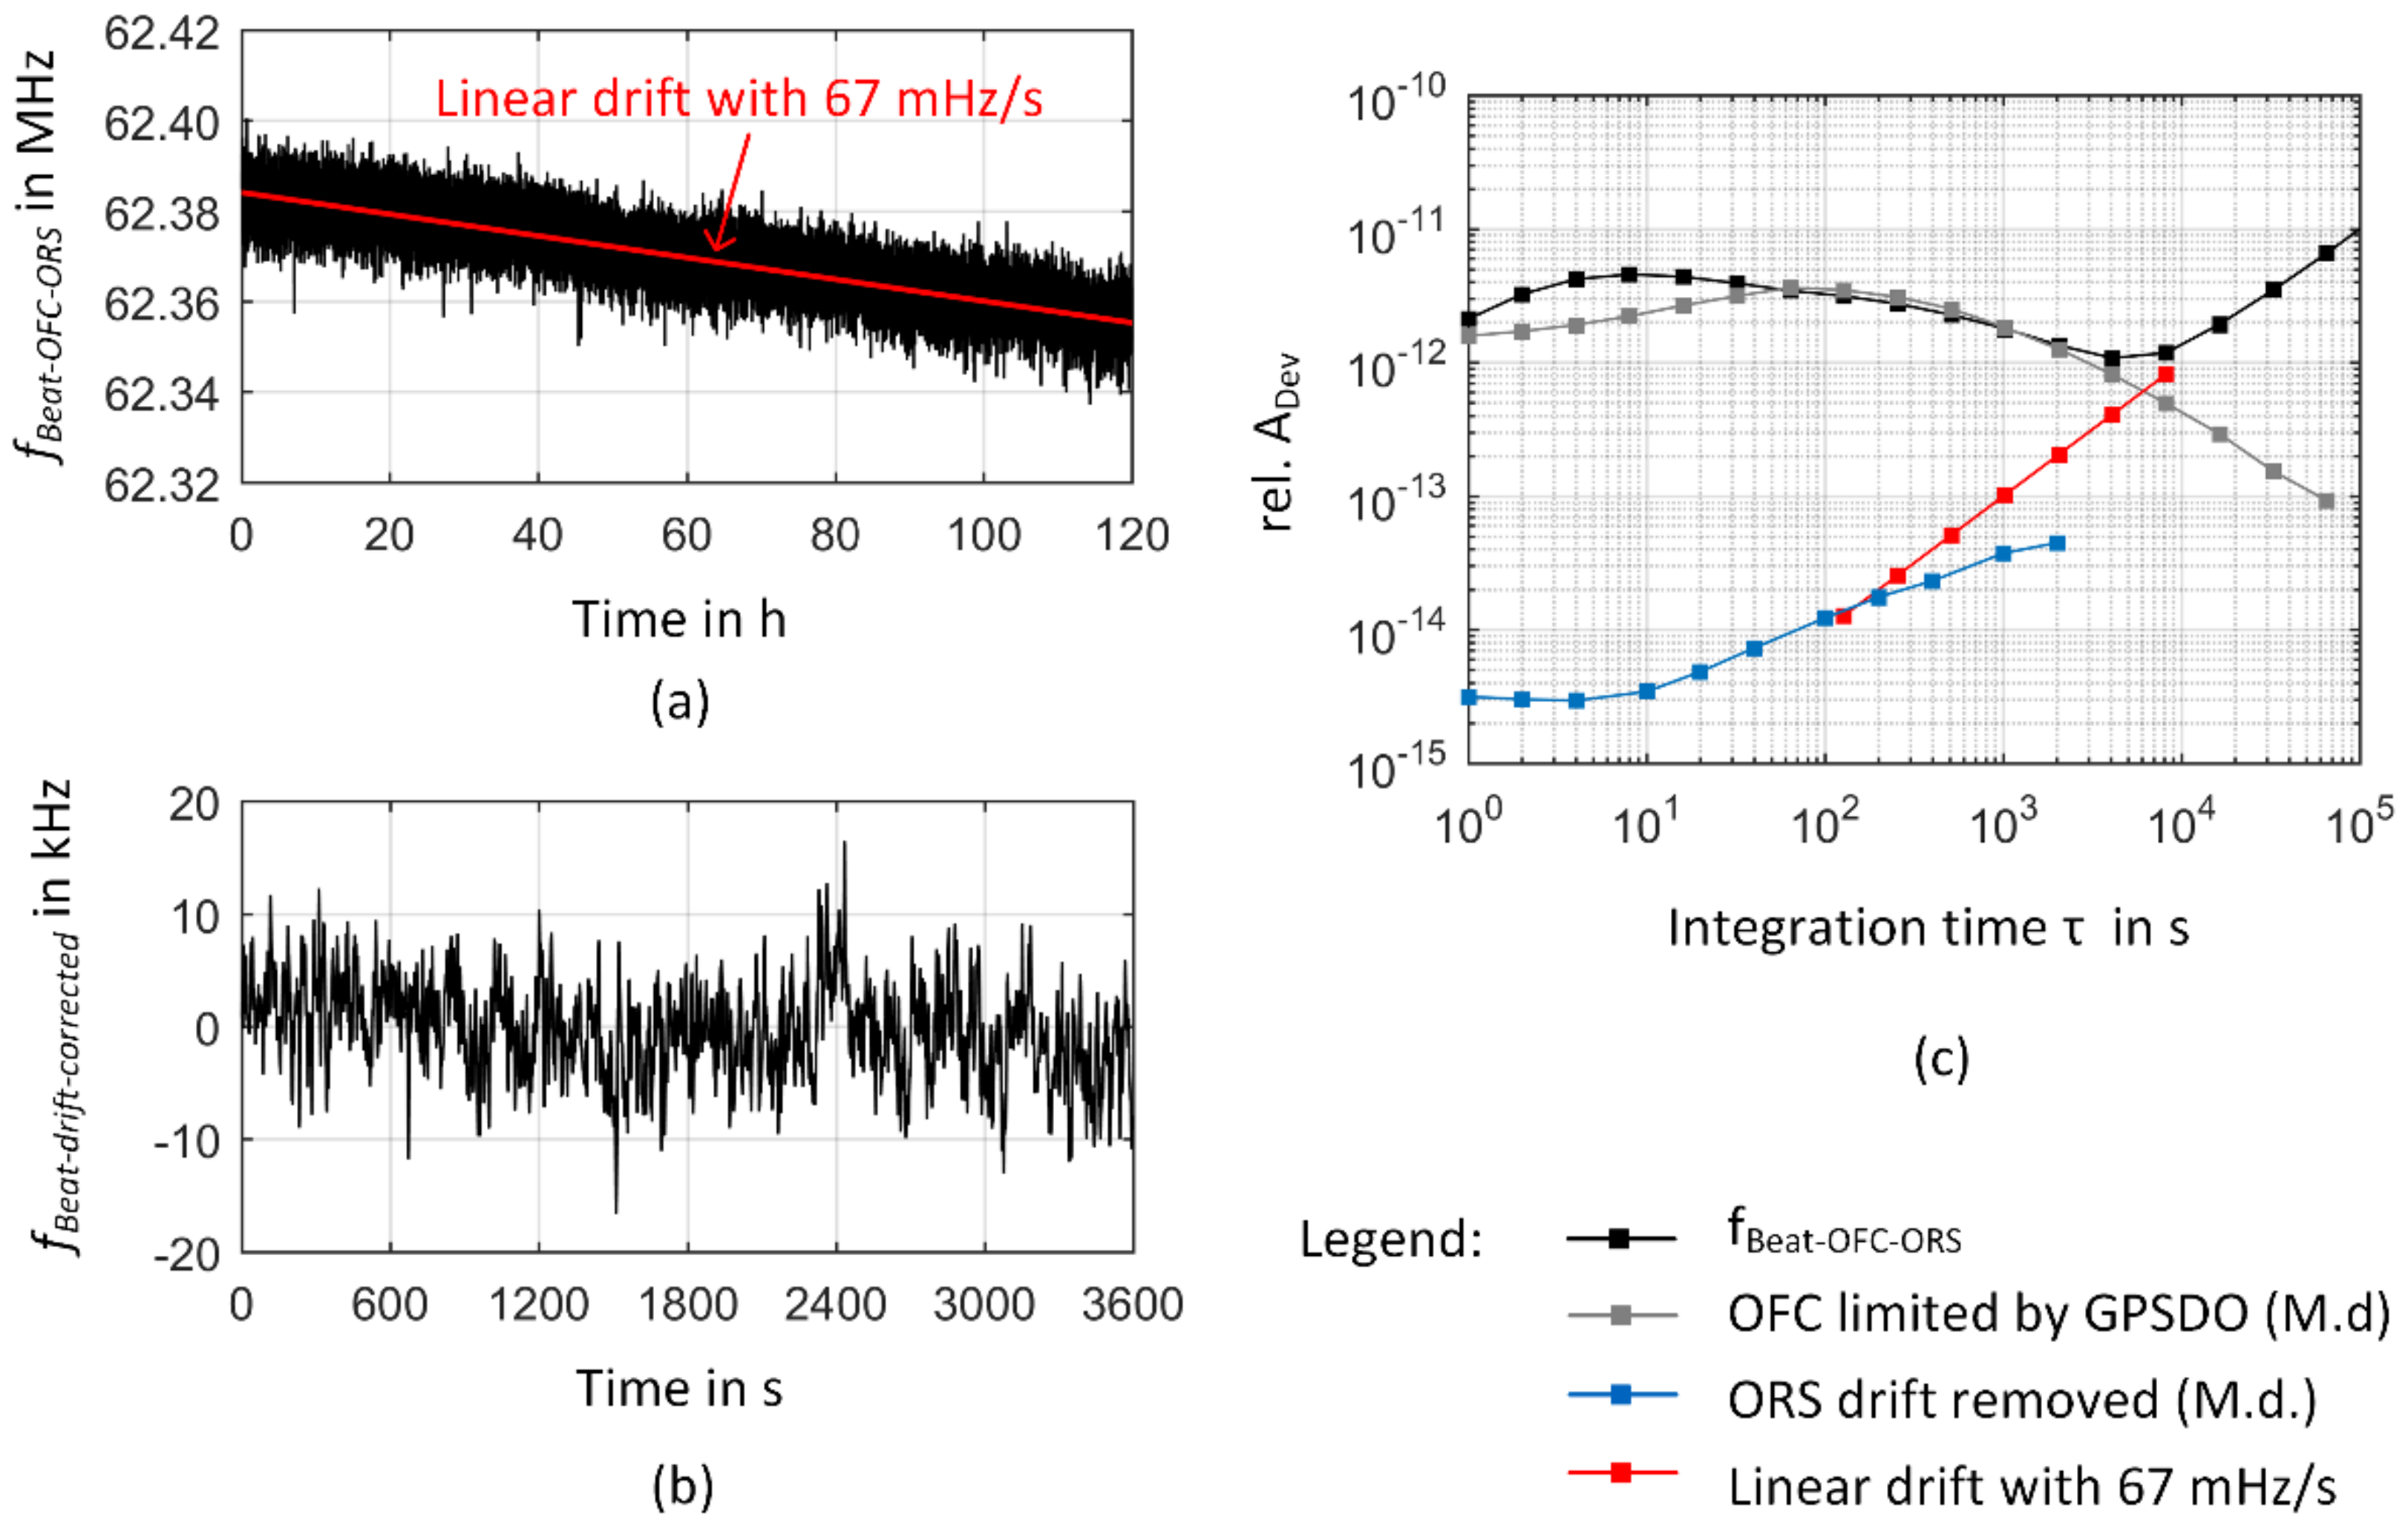
3.1. Frequency Instability of the GPS-Referenced Frequency Comb
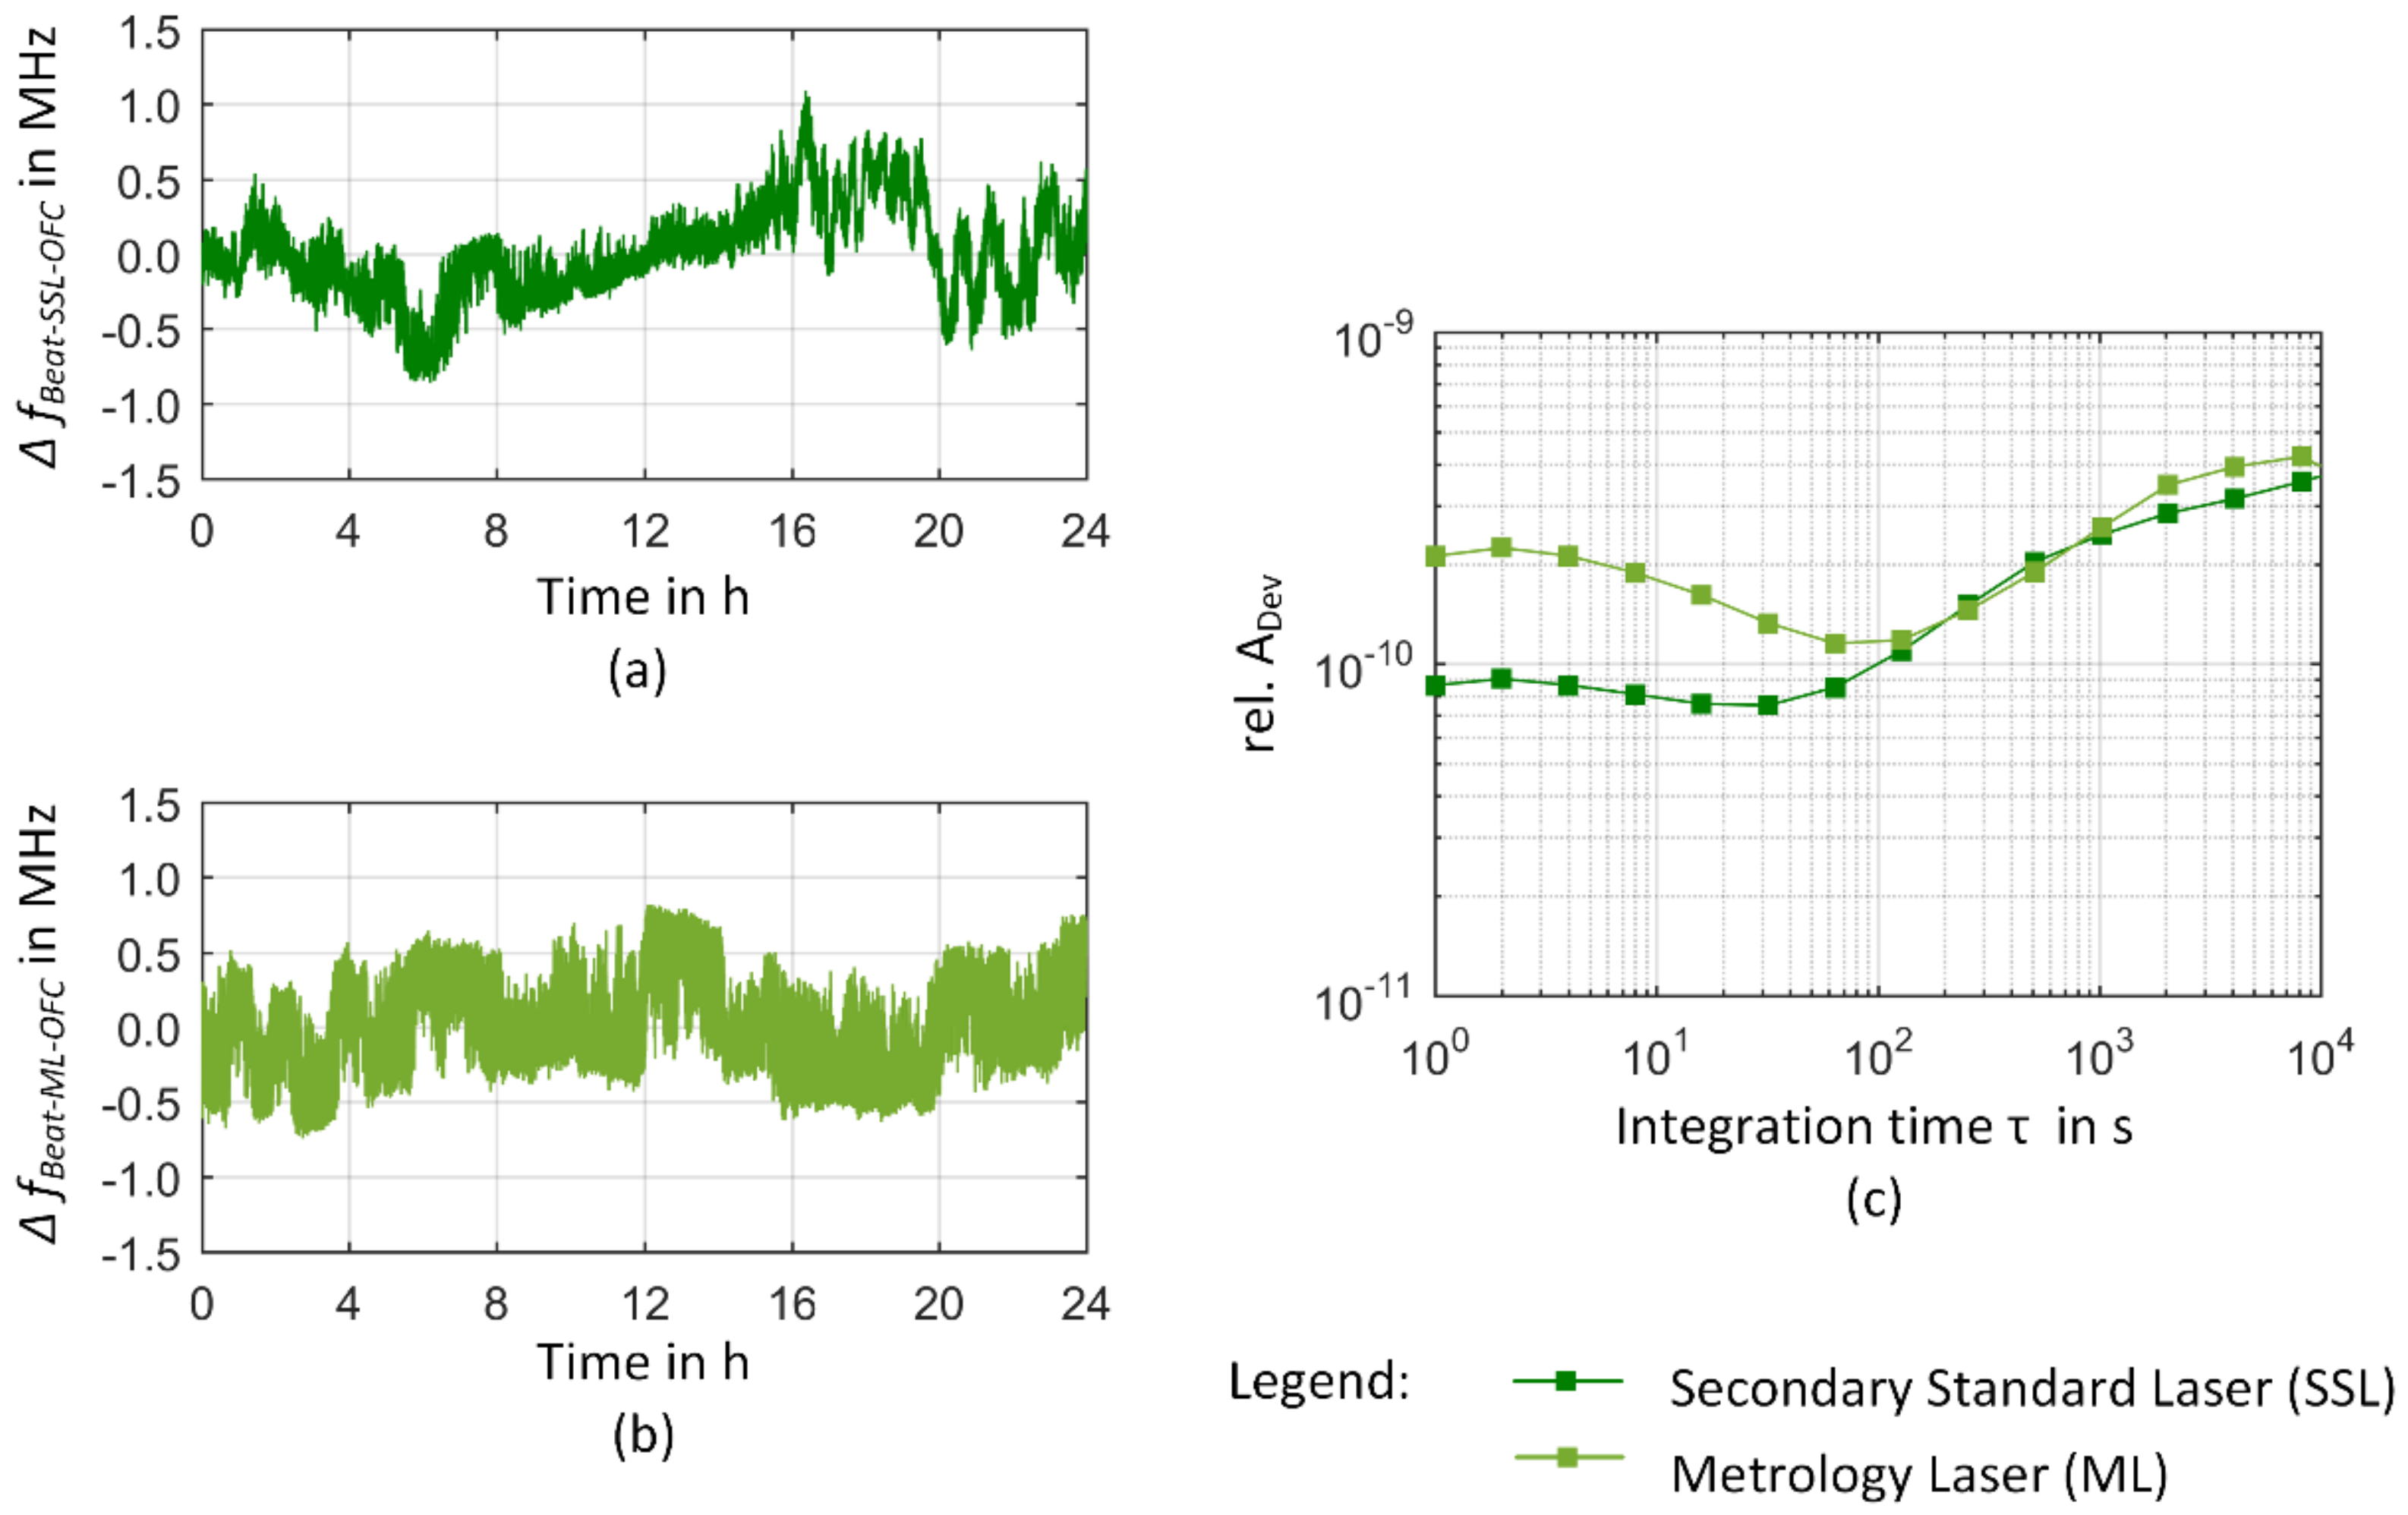
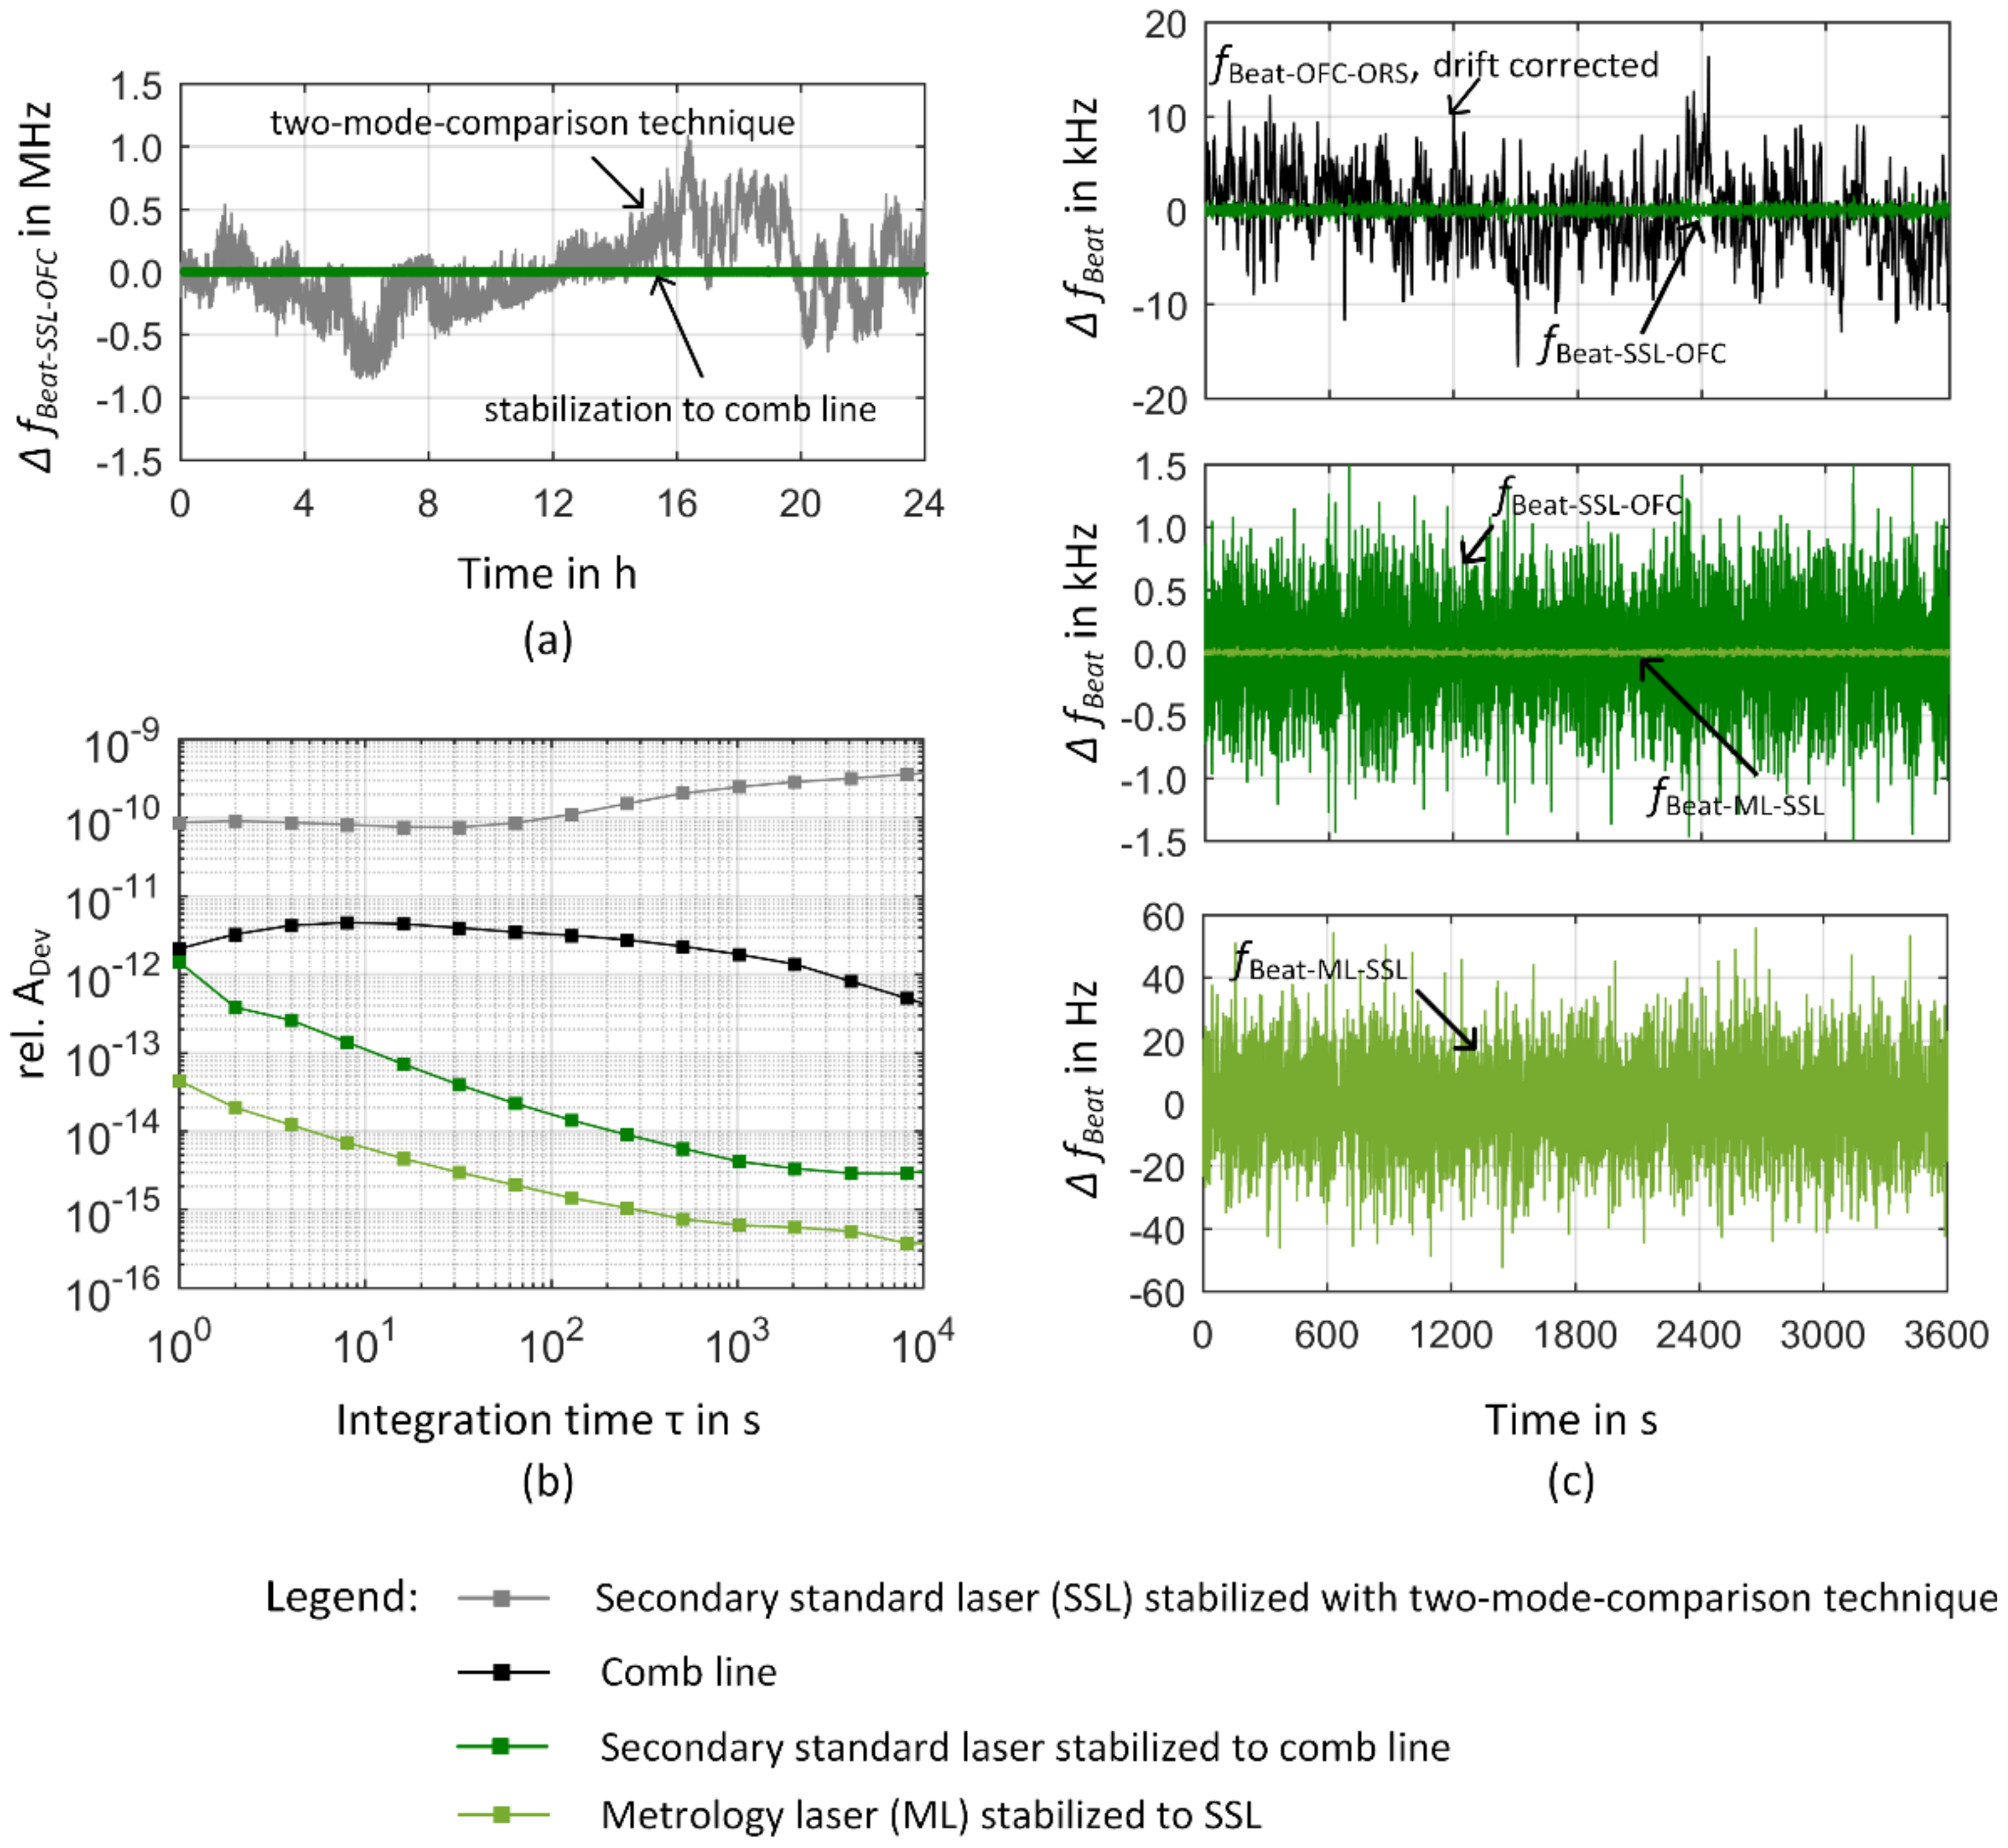
3.2. Frequency Instability of the Comb-Referenced He-Ne Source
4. Summary and Outlook
Author Contributions
Funding
Institutional Review Board Statement
Informed Consent Statement
Data Availability Statement
Acknowledgments
Conflicts of Interest
References
- Hall, J.L. Nobel Lecture: Defining and measuring optical frequencies. Rev. Mod. Phys. 2006, 78, 1279. [Google Scholar] [CrossRef]
- Udem, T.; Holzwarth, R.; Hänsch, T.W. Optical frequency metrology. Nature 2002, 416, 233–237. [Google Scholar] [CrossRef] [PubMed]
- Ye, J.; Cundiff, S.T. Femtosecond Optical Frequency Comb: Principle, Operation and Applications; Springer Science & Business Media: Berlin/Heidelberg, Germany, 2005. [Google Scholar]
- Fortier, T.; Baumann, E. 20 years of developments in optical frequency comb technology and applications. Commun. Phys. 2019, 2, 153. [Google Scholar] [CrossRef]
- Hänsch, T.; Alnis, J.; Fendel, P.; Fischer, M.; Gohle, C.; Herrmann, M.; Holzwarth, R.; Kolachevsky, N.; Udem, T.; Zimmermann, M. Precision spectroscopy of hydrogen and femtosecond laser frequency combs. Philos. Trans. R. Soc. A Math. Phys. Eng. Sci. 2005, 363, 2155–2163. [Google Scholar] [CrossRef]
- Jones, D.J.; Diddams, S.A.; Ranka, J.K.; Stentz, A.; Windeler, R.S.; Hall, J.L.; Cundiff, S.T. Carrier-envelope phase control of femtosecond mode-locked lasers and direct optical frequency synthesis. Science 2000, 288, 635–639. [Google Scholar] [CrossRef]
- Ranke, J.K.; Windeler, R.S.; Stentz, A.J. Visible continuum generation in air–silica microstructure optical fibers with anomalous dispersion at 800 nm. Opt. Lett. 2000, 25, 25–27. [Google Scholar] [CrossRef]
- Reichert, J.; Holzwarth, R.; Udem, T.; Hänsch, T. Measuring the frequency of light with mode-locked lasers. Opt. Commun. 1999, 172, 59–68. [Google Scholar] [CrossRef]
- Bureau International des Poids et Mesures. The International System of Units (S), 9th ed.; Bureau International des Poids et Mesures: Paris, France, 2019; Available online: https://www.bipm.org/en/publications/si-brochure (accessed on 10 November 2022).
- Quinn, T.J. Practical realization of the definition of the metre, including recommended radiations of other optical frequency standards (2001). Metrologia 2003, 40, 103. [Google Scholar] [CrossRef]
- Stone, J.; Lu, L.; Egan, P. Calibrating Laser Vacuum Wavelength with a GPS-based Optical Frequency Comb. NCSL Meas. 2007, 2, 28–38. [Google Scholar] [CrossRef]
- Matus, M.; Haas, S. The optical frequency standards for the realization of the meter. Ann. Phys. 2019, 531, 1800287. [Google Scholar] [CrossRef] [Green Version]
- Lombardi, M.A. The use of GPS disciplined oscillators as primary frequency standards for calibration and metrology laboratories. NCSLI Meas. 2008, 3, 56–65. [Google Scholar] [CrossRef]
- Stone, J.A.; Egan, P. An optical frequency comb tied to GPS for laser frequency/wavelength calibration. J. Res. Natl. Inst. Stand. Technol. 2010, 115, 413. [Google Scholar] [CrossRef]
- Gao, W.; Kim, S.-W.; Bosse, H.; Haitjema, H.; Chen, Y.; Lu, X.; Knapp, W.; Weckenmann, A.; Estler, W.; Kunzmann, H. Measurement technologies for precision positioning. CIRP Ann. 2015, 64, 773–796. [Google Scholar] [CrossRef]
- Available online: http://technology-roadmaps.eu/doku.php?id=micro_and_nano (accessed on 28 January 2022).
- Joo, K.-N.; Kim, S.-W. Absolute distance measurement by dispersive interferometry using a femtosecond pulse laser. Opt. Express 2006, 14, 5954–5960. [Google Scholar] [CrossRef]
- Cui, M.; Zeitouny, M.G.; Bhattacharya, N.; Berg, S.A.V.D.; Urbach, H.P. Long distance measurement with femtosecond pulses using a dispersive interferometer. Opt. Express 2011, 19, 6549–6562. [Google Scholar] [CrossRef]
- Berg, S.A.V.D.; Persijn, S.T.; Kok, G.J.P.; Zeitouny, M.G.; Bhattacharya, N. Many-wavelength interferometry with thousands of lasers for absolute distance measurement. Phys. Rev. Lett. 2012, 108, 183901. [Google Scholar] [CrossRef]
- Van den Berg, S.A.; Van Eldik, S.; Bhattacharya, N. Mode-resolved frequency comb interferometry for high-accuracy long distance measurement. Sci. Rep. 2015, 5, 14661. [Google Scholar] [CrossRef]
- Salvadé, Y.; Schuhler, N.; Lévêque, S.; Le Floch, S. High-accuracy absolute distance measurement using frequency comb referenced multiwavelength source. Appl. Opt. 2008, 47, 2715–2720. [Google Scholar] [CrossRef]
- Hyun, S.; Kim, Y.J.; Kim, Y.; Jin, J.; Kim, S.-W. Absolute length measurement with the frequency comb of a femtosecond laser. Meas. Sci. Technol. 2009, 20, 095302. [Google Scholar] [CrossRef]
- Jang, Y.-S.; Wang, G.; Hyun, S.; Kang, H.J.; Chun, B.J.; Kim, Y.J.; Kim, S.-W. Comb-referenced laser distance interferometer for industrial nanotechnology. Sci. Rep. 2016, 6, 31770. [Google Scholar] [CrossRef] [Green Version]
- Minoshima, K.; Matsumoto, H. High accuracy measurement of 240 m distance in an optical tunnel by use of a compact femtosecond laser. Appl. Opt. 2000, 39, 5512–5517. [Google Scholar] [CrossRef] [PubMed]
- Yang, R.; Pollinger, F.; Meiners-Hagen, K.; Krystek, M.; Tan, J.; Bosse, H. Absolute distance measurement by dual-comb interferometry with multi-channel digital lock-in phase detection. Meas. Sci. Technol. 2015, 26, 084001. [Google Scholar] [CrossRef]
- Manske, E.; Fröhlich, T.; Füßl, R.; Ortlepp, I.; Mastylo, R.; Blumröder, U.; Dontsov, D.; Kuehnel, M.; Köchert, P. Progress of nanopositioning and nanomeasuring machines for cross-scale measurement with sub-nanometre precision. Meas. Sci. Technol. 2020, 31, 085005. [Google Scholar]
- Dai, G.; Neugebauer, M.; Stein, M.; Bütefisch, S.; Neuschaefer-Rube, U. Overview of 3D micro-and nanocoordinate metrology at PTB. Appl. Sci. 2016, 6, 257. [Google Scholar] [CrossRef]
- Jäger, G.; Manske, E.; Hausotte, T.; Büchner, H.-J. The metrological basis and operation of nanopositioning and nanomeasuring machine NMM-1 Metrologische Grundlagen und Wirkungsweise der Nanopositionier-und Messmaschine NMM-1. tm—Tech. Mess. 2009, 76, 227–234. [Google Scholar] [CrossRef]
- Available online: https://sios.de/produkte/nanopositionier-und-nanomessmaschine/ (accessed on 13 December 2022).
- Dai, G.; Pohlenz, F.; Xu, M.; Koenders, L.; Danzebrink, H.-U.; Wilkening, G. Accurate and traceable measurement of nano-and microstructures. Meas. Sci. Technol. 2006, 17, 545. [Google Scholar] [CrossRef]
- Available online: https://www.bipm.org/documents/20126/45452292/APMP.L-S7.pdf/9f10ad91-25dd-3af8-acb5-900cdbc17027 (accessed on 10 November 2022).
- Jäger, G. Nanopositioning and nanomeasuring machine NPMM-200—A new powerful tool for large-range micro- and nanotechnology. Surf. Topogr. Metrol. Prop. 2016, 4, 034004. [Google Scholar] [CrossRef]
- Schober, C.; Pruss, C.; Herkommer, A.; Osten, W. The NPMM-200: Large area high resolution for freeform surface measurement. In Proceedings of the Seventh European Seminar on Precision Optics Manufacturing, Teisnach, Germany, 30 March–1 April 2020; SPIE: Bellingham, WA, USA, 2020; pp. 40–46. [Google Scholar]
- Badami, V.; De Groot, P. Displacement measuring interferometry. In Handbook of Optical Dimensional Metrology; CRC Press: Boca Raton, FL, USA, 2013. [Google Scholar]
- Blumröder, U.; Köchert, P.; Flügge, J.; Füßl, R.; Ortlepp, I.; Manske, E. Comb-referenced metrology laser for interferometric length measurements in nanopositioning and nanomeasuring machines. tm—Tech. Mess. 2022, 89, 687–703. [Google Scholar] [CrossRef]
- Niebauer, T.M.; Faller, J.E.; Godwin, H.M.; Hall, J.; Barger, R.L. Frequency stability measurements on polarization-stabilized He–Ne lasers. Appl. Opt. 1988, 27, 1285–1289. [Google Scholar] [CrossRef]
- Mäkinen, J.; Ståhlberg, B. Long-term frequency stability and temperature response of a polarization-stabilized He–Ne laser. Measurement 1998, 24, 179–185. [Google Scholar] [CrossRef]
- Manske, E.; Jäger, G.; Hausotte, T. A multi-sensor approach for complex and large-area applications in micro and nanometrology. NCSLI Meas. 2012, 7, 44–50. [Google Scholar] [CrossRef]
- Abbe, E. Messapparate für Physiker, [Measuring instruments for physicists. Z. Für Instrum. 1890, 10, 446–448. [Google Scholar]
- Balzer, F. Entwicklung und Untersuchungen zur 3-D-Nanopositioniertechnik in Großen Bewegungsbereichen. Ph.D. Thesis, Universitätsverlag Ilmenau, Ilmenau, Germany, 2015. [Google Scholar]
- Zschäck, S. Mehrgrößenregelung von Nanopositionier- und Nanomessmaschinen mit Großen Bewegungsbereichen. Ph.D. Thesis, TU Ilmenau, Ilmenau, Germany, 2015. [Google Scholar]
- Bönsch, G.; Potulski, E. Measurement of the refractive index of air and comparison with modified Edlén’s formulae. Metrologia 1998, 35, 133–139. [Google Scholar] [CrossRef]
- Hausotte, T. Nanopositionier- und Nanomessmaschinen—Geräte für Hochpräzise Makro- bis Nanoskalige Oberflächen- und Koordinatenmessungen. Ph.D. Thesis, Habilitation TU Ilmenau, Ilmenau, Germany, 2010. [Google Scholar]
- Jang, Y.-S.; Kim, S.-W. Compensation of the refractive index of air in laser interferometer for distance measurement: A review. Int. J. Precis. Eng. Manuf. 2017, 18, 1881–1890. [Google Scholar] [CrossRef]
- Hausotte, T.; Percle, B.; Gerhardt, U.; Dontsov, D.; Manske, E.; Jäger, G. Interference signal demodulation for nanopositioning and nanomeasuring machines. Meas. Sci. Technol. 2012, 23, 074004. [Google Scholar] [CrossRef]
- Balhorn, R.; Kunzmann, H.; Lebowsky, F. Frequency stabilization of internal-mirror helium-neon lasers. Appl. Opt. 1972, 11, 742. [Google Scholar] [CrossRef]
- Lee, W.-K.; Suh, H.S.; Kang, C.-S. Vacuum wavelength calibration of frequency-stabilized He-Ne lasers used in commercial laser interferometers. Opt. Eng. 2011, 50, 054301. [Google Scholar] [CrossRef]
- Riehle, F.; Gill, P.; Arias, F.; Robertsson, L. The CIPM list of recommended frequency standard values: Guidelines and procedures. Metrologia 2018, 188, 188–200. [Google Scholar] [CrossRef]
- Chartier, J.M.; Picard-Fredin, S.; Chartier, A. International comparison of iodine cells. Metrologia 1992, 29, 361. [Google Scholar] [CrossRef]
- Consultative Committee for Time and Frequency. Mise en Pratique for the Definition of the Second in the SI, SI Brochure—9th Edition (2019)—Appendix 2. Available online: https://www.bipm.org/documents/20126/41489667/SI-App2-second.pdf/3c76fec8-04d9-f484-5c3c-a2e280a0f248 (accessed on 9 November 2022).
- Available online: https://www.ptb.de/cms/ptb/fachabteilungen/abt4/fb-44/fragenzurzeit/fragenzurzeit12.html (accessed on 9 November 2022).
- Matus, M.; Balling, P.; Mache, W.; Nießner, A.; Kren, P. Uncertainty estimation for comb based laser calibrations by direct comparison of 3 different combs. MacroScale 2011. [Google Scholar]
- Fox, R.W.; Diddams, S.A.; Bartels, A.; Hollberg, L. Optical frequency measurements with the global positioning system: Tests with an iodine-stabilized He–Ne laser. Appl. Opt. 2005, 44, 113–120. [Google Scholar] [CrossRef] [PubMed]
- Wurmus, J.; SIOS Meßtechnik GmbH, Ilmenau, Germany. Personal communication, 2022.
- Consultative Committee for Length. Mise en Pratique for the Definition of the Metre in the SI, SI Brochure—9th Edition (2019)–Appendix 2. Available online: https://www.bipm.org/en/publications/mises-en-pratique (accessed on 9 November 2022).
- Available online: https://www.menlosystems.com/products/ultrastable-lasers/ (accessed on 4 November 2022).
- Menlo Systems GmbH. GPS-8 10 MHz RF Reference; User Manual; Menlo Systems GmbH: Martinsried, Germany, 2016. [Google Scholar]
- Available online: https://www.axtal.com/cms/docs/doc86232.pdf (accessed on 4 November 2022).
- Available online: https://www.meinberg.de/german/products/sdu.htm (accessed on 4 November 2022).
- Menlo Systems GmbH. FC1500-250-WG; User Manual; Menlo Systems GmbH: Martinsried, Germany, 2016. [Google Scholar]
- Telle, H.; Steinmeyer, G.; Dunlop, A.; Stenger, J.; Sutter, D.; Keller, U. Carrier-envelope offset phase control: A novel concept for absolute optical frequency measurement and ultrashort pulse generation. Appl. Phys. B 1999, 69, 327–332. [Google Scholar] [CrossRef]
- Rubiola, E. On the measurement of frequency and of its sample variance with high-resolution counters. Rev. Sci. Instrum. 2005, 76, 054703. [Google Scholar] [CrossRef] [Green Version]
- Sterr, U.; Legero, T.; Kessler, T.; Schnatz, H.; Grosche, G.; Terra, O.; Riehle, F. Ultrastable lasers: New developments and applications. In Time and Frequency Metrology II; SPIE: San Diego, CA, USA, 2009; Volume 7431, pp. 33–46. [Google Scholar]
- Dubé, P.; Madej, A.A.; Bernard, J.E.; Marmet, L.; Shiner, A.D. A narrow linewidth and frequency-stable probe laser source for the 88Sr+ single ion optical frequency standard. Appl. Phys. B 2009, 95, 43–54. [Google Scholar] [CrossRef]
- Menlo Systems GmbH. Optical Reference System—Manual; Menlo Systems GmbH: Martinsried, Germany, 2019. [Google Scholar]
- Available online: https://www.moglabs.com/products/littrow-lasers/MOGLabs_LDL_manual_rev207.pdf (accessed on 4 November 2022).
- Drever, R.W.P.; Hall, J.L.; Kowalski, F.V.; Hough, J.; Ford, G.M.; Munley, A.J.; Ward, H. Laser phase and frequency stabilization using an optical resonator. Appl. Phys. B 1983, 31, 97–105. [Google Scholar] [CrossRef]
- Black, E.D. An introduction to Pound–Drever–Hall laser frequency stabilization. Am. J. Phys. 2001, 69, 79–87. [Google Scholar] [CrossRef]
- Menlo Systems GmbH. Optical Reference System, General System Description; Menlo Systems GmbH: Martinsried, Germany, 2019. [Google Scholar]
- Schilt, S.; Dolgovskiy, V.; Bucalovic, N.; Schori, C.; Stumpf, M.C.; Di Domenico, G.; Pekarek, S.; Oehler, A.E.H.; Südmeyer, T.; Keller, U.; et al. Noise properties of an optical frequency comb from a SESAM-mode-locked 1.5-μm solid-state laser stabilized to the 10−13 level. Appl. Phys. B 2012, 109, 391–402. [Google Scholar]
- Menlo Systems GmbH. Optical Reference System, Test Report; Menlo Systems GmbH: Martinsried, Germany, 2020. [Google Scholar]
- Lawall, J.; Pedulla, J.M.; Le Coq, Y. Ultrastable laser array at 633 nm for real-time dimensional metrology. Rev. Sci. Instrum. 2001, 72, 2879–2888. [Google Scholar]
- SIOS Meßtechnik GmbH. Stabilisierte He-Ne-Laser Serie SL 02., Technisches Datenblatt. Available online: https://www.sios-precision.com/fileadmin/user_upload/Produkte/Produktdetails/Datenblaetter/datenblatt-stabilisierte-he-ne-laser-SL-02-dt.pdf (accessed on 9 November 2022).
- Sternkopf, C.; Manske, E. Digital frequency offset-locked He–Ne laser system with high beat frequency stability, narrow optical linewidth and optical fibre output. Meas. Sci. Technol. 2018, 29, 064013. [Google Scholar] [CrossRef]
- Köchert, P.; Blumröder, U.; Manske, E. Ultrastable metrology laser at 633 nm using an optical frequency comb. In Optical Micro- and Nanometrology VII; SPIE: Bellingham, WA, USA, 2018; Volume 10678, pp. 160–171. [Google Scholar]
- Menlo Systems GmbH. Syncro Locking Electronics; User Manual; Menlo Systems GmbH: Martinsried, Germany, 2016. [Google Scholar]
- Allan, D.W. Should the classical variance be used as a basic measure in standards metrology? IEEE Trans. Instrum. Meas. 1987, IM-36, 646–654. [Google Scholar] [CrossRef]
- Riley, W.J. NIST Special Publication 1065: Handbook of Frequency Stability Analysis; US Government Printing Office: Washington, DC, USA, 2008. [Google Scholar]
- Available online: http://www.alavar.org/alavar/ (accessed on 2 November 2022).
- Blumröder, U.; Köchert, P.; Fröhlich, T.; Füßl, R.; Ortlepp, I.; Gerhardt, U.; Mastylo, R.; Flügge, J.; Bosse, H.; Manske, E. Ultrastable, traceable optical frequencies for length metrology in long-range nanopositioning and nanomeasuring machines. In Proceedings of the Euspen’s 22nd International Conference & Exhibition, Geneva, Switzerland, 30 May–3 June 2022; Available online: https://www.euspen.eu/knowledge-base/ICE22190.pdf (accessed on 19 January 2023).
- Riley, W.J. An Informal Evaluation of a Leo Bodnar GPS Frequency Reference. Available online: https://www.leobodnar.com/files/Informal%20Evaluation%20of%20a%20Leo%20Bodnar%20GPS%20Frequency%20Reference.pdf (accessed on 7 November 2022).
- Lombardi, M.A. Evaluating the frequency and time uncertainty of GPS disciplined oscillators and clocks. NCSLI Meas. 2016, 11, 30–44. [Google Scholar] [CrossRef]
- Cordara, F.; Pettiti, V. Short-Term Characterization of GPS Disciplined Oscillators and Field Trial for Frequency of Italian Calibration Centres. Available online: https://ieeexplore.ieee.org/stamp/stamp.jsp?arnumber=840792 (accessed on 19 January 2023).
- Lombardi, M.A.; Novick, A.N.; Zhang, V.S. Characterizing the performance of GPS disciplined oscillators with respect to UTC (NIST). In Proceedings of the 37th Annual Precise Time and Time Interval Systems and Applications Meeting, Vancouver, BC, Canada, 29–31 August 2005; pp. 677–684. [Google Scholar]
- Kirkendall, C.K.; Dandrige, A. Overview of high performance fibre-optic sensing. J. Phys. D Appl. Phys. 2004, 37, R197. [Google Scholar] [CrossRef]
- Hocker, G.B. Fiber-optic sensing of pressure and temperature. Appl. Opt. 1979, 18, 1445–1448. [Google Scholar] [CrossRef]
- Jäger, G. Limitations of precision length measurements based on interferometers. Measurement 2010, 43, 652–658. [Google Scholar] [CrossRef] [Green Version]


Disclaimer/Publisher’s Note: The statements, opinions and data contained in all publications are solely those of the individual author(s) and contributor(s) and not of MDPI and/or the editor(s). MDPI and/or the editor(s) disclaim responsibility for any injury to people or property resulting from any ideas, methods, instructions or products referred to in the content. |
© 2023 by the authors. Licensee MDPI, Basel, Switzerland. This article is an open access article distributed under the terms and conditions of the Creative Commons Attribution (CC BY) license (https://creativecommons.org/licenses/by/4.0/).
Share and Cite
Blumröder, U.; Köchert, P.; Fröhlich, T.; Kissinger, T.; Ortlepp, I.; Flügge, J.; Bosse, H.; Manske, E. A GPS-Referenced Wavelength Standard for High-Precision Displacement Interferometry at λ = 633 nm. Sensors 2023, 23, 1734. https://doi.org/10.3390/s23031734
Blumröder U, Köchert P, Fröhlich T, Kissinger T, Ortlepp I, Flügge J, Bosse H, Manske E. A GPS-Referenced Wavelength Standard for High-Precision Displacement Interferometry at λ = 633 nm. Sensors. 2023; 23(3):1734. https://doi.org/10.3390/s23031734
Chicago/Turabian StyleBlumröder, Ulrike, Paul Köchert, Thomas Fröhlich, Thomas Kissinger, Ingo Ortlepp, Jens Flügge, Harald Bosse, and Eberhard Manske. 2023. "A GPS-Referenced Wavelength Standard for High-Precision Displacement Interferometry at λ = 633 nm" Sensors 23, no. 3: 1734. https://doi.org/10.3390/s23031734