
An Experimental Platform for Real-Time Students Engagement Measurements from Video in STEM Classrooms

 ,
,
Abstract
:1. Introduction

Literature Review
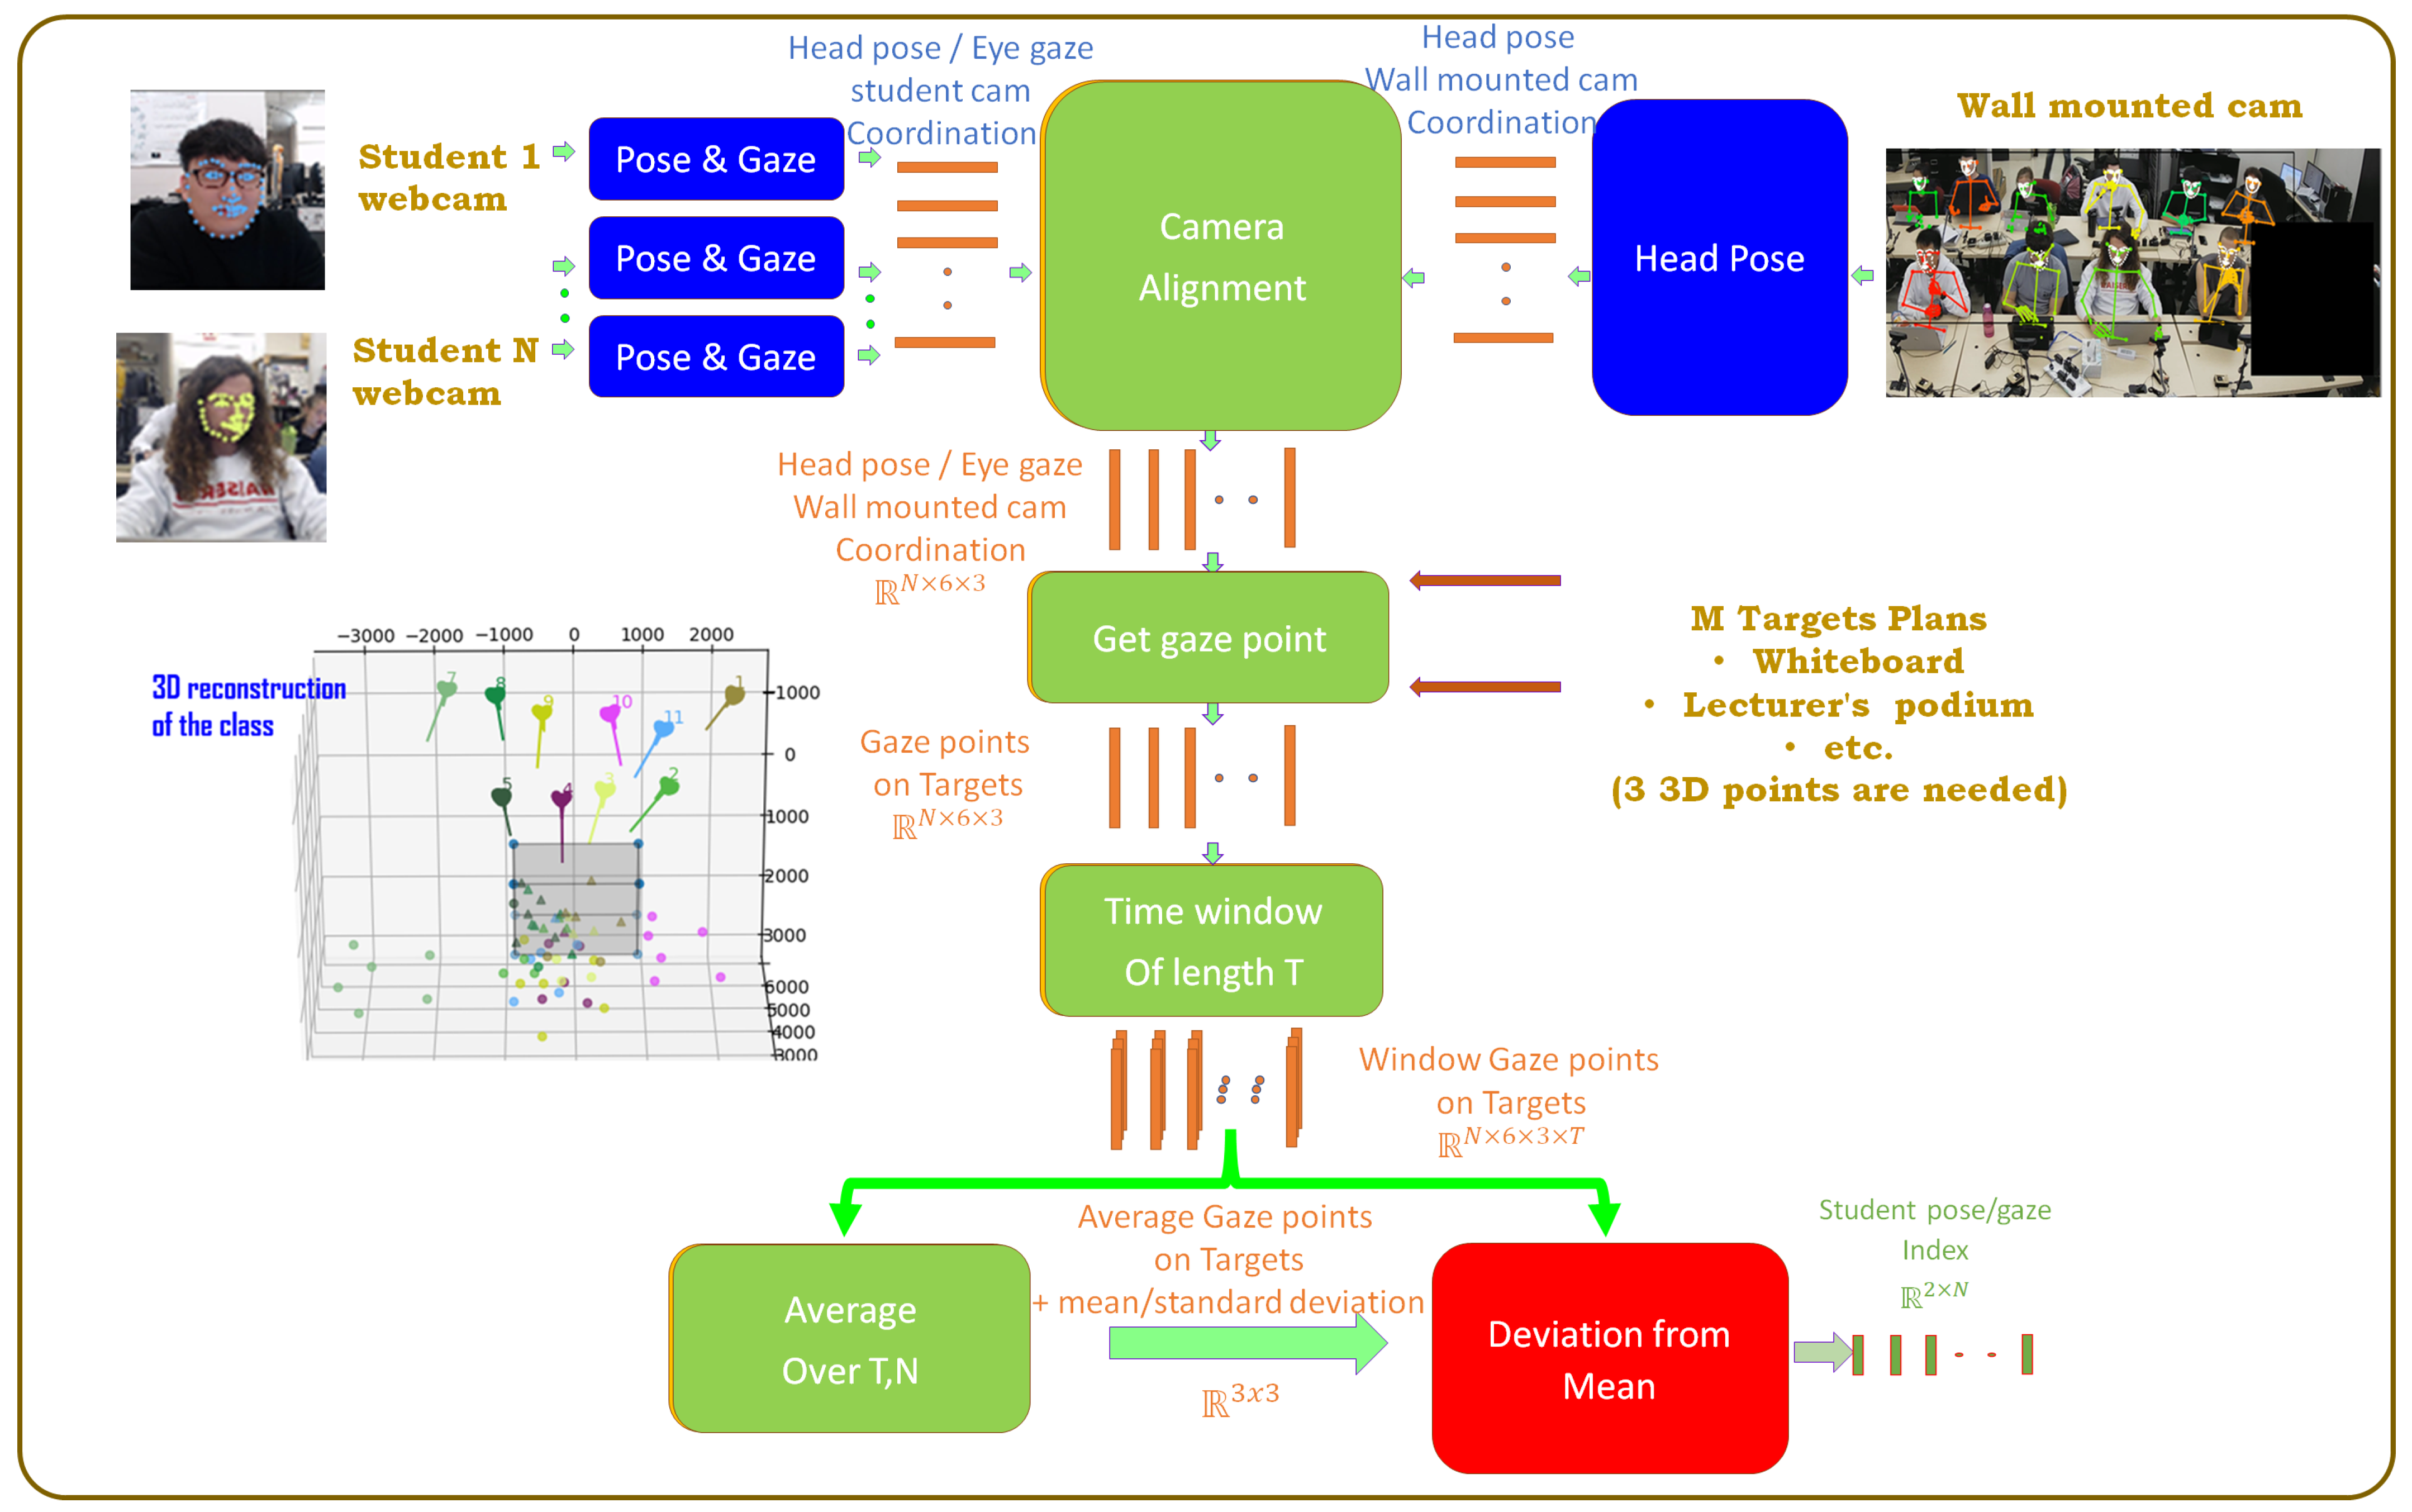
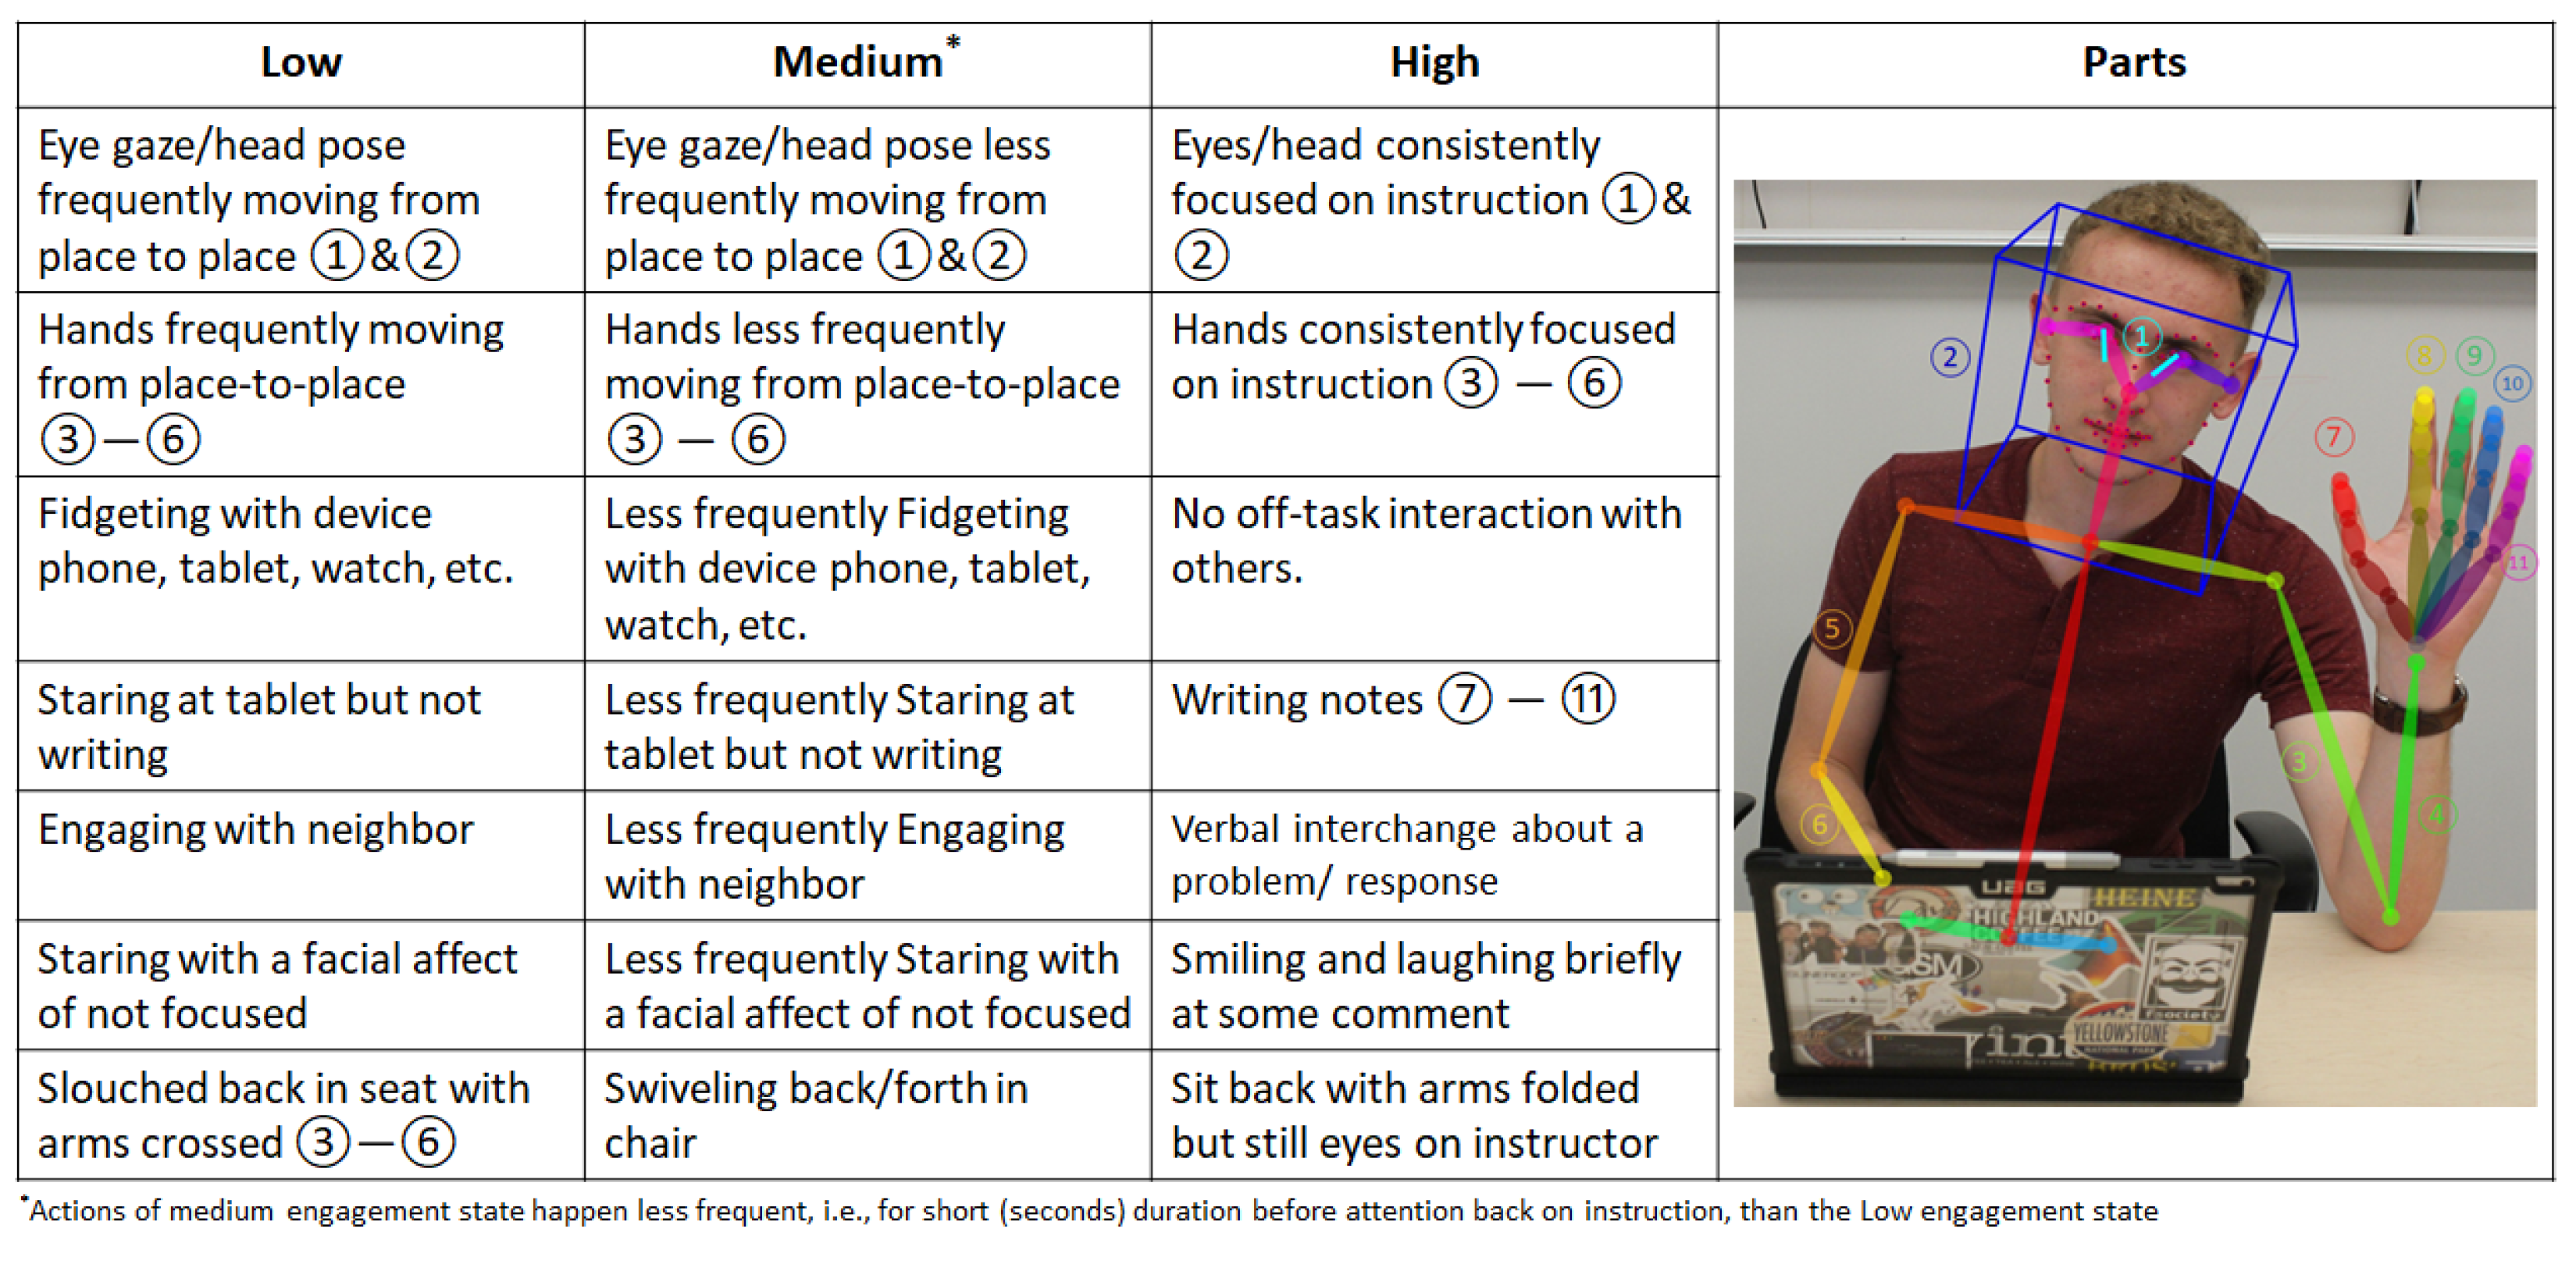
2. Proposed Behavioral Engagement Module
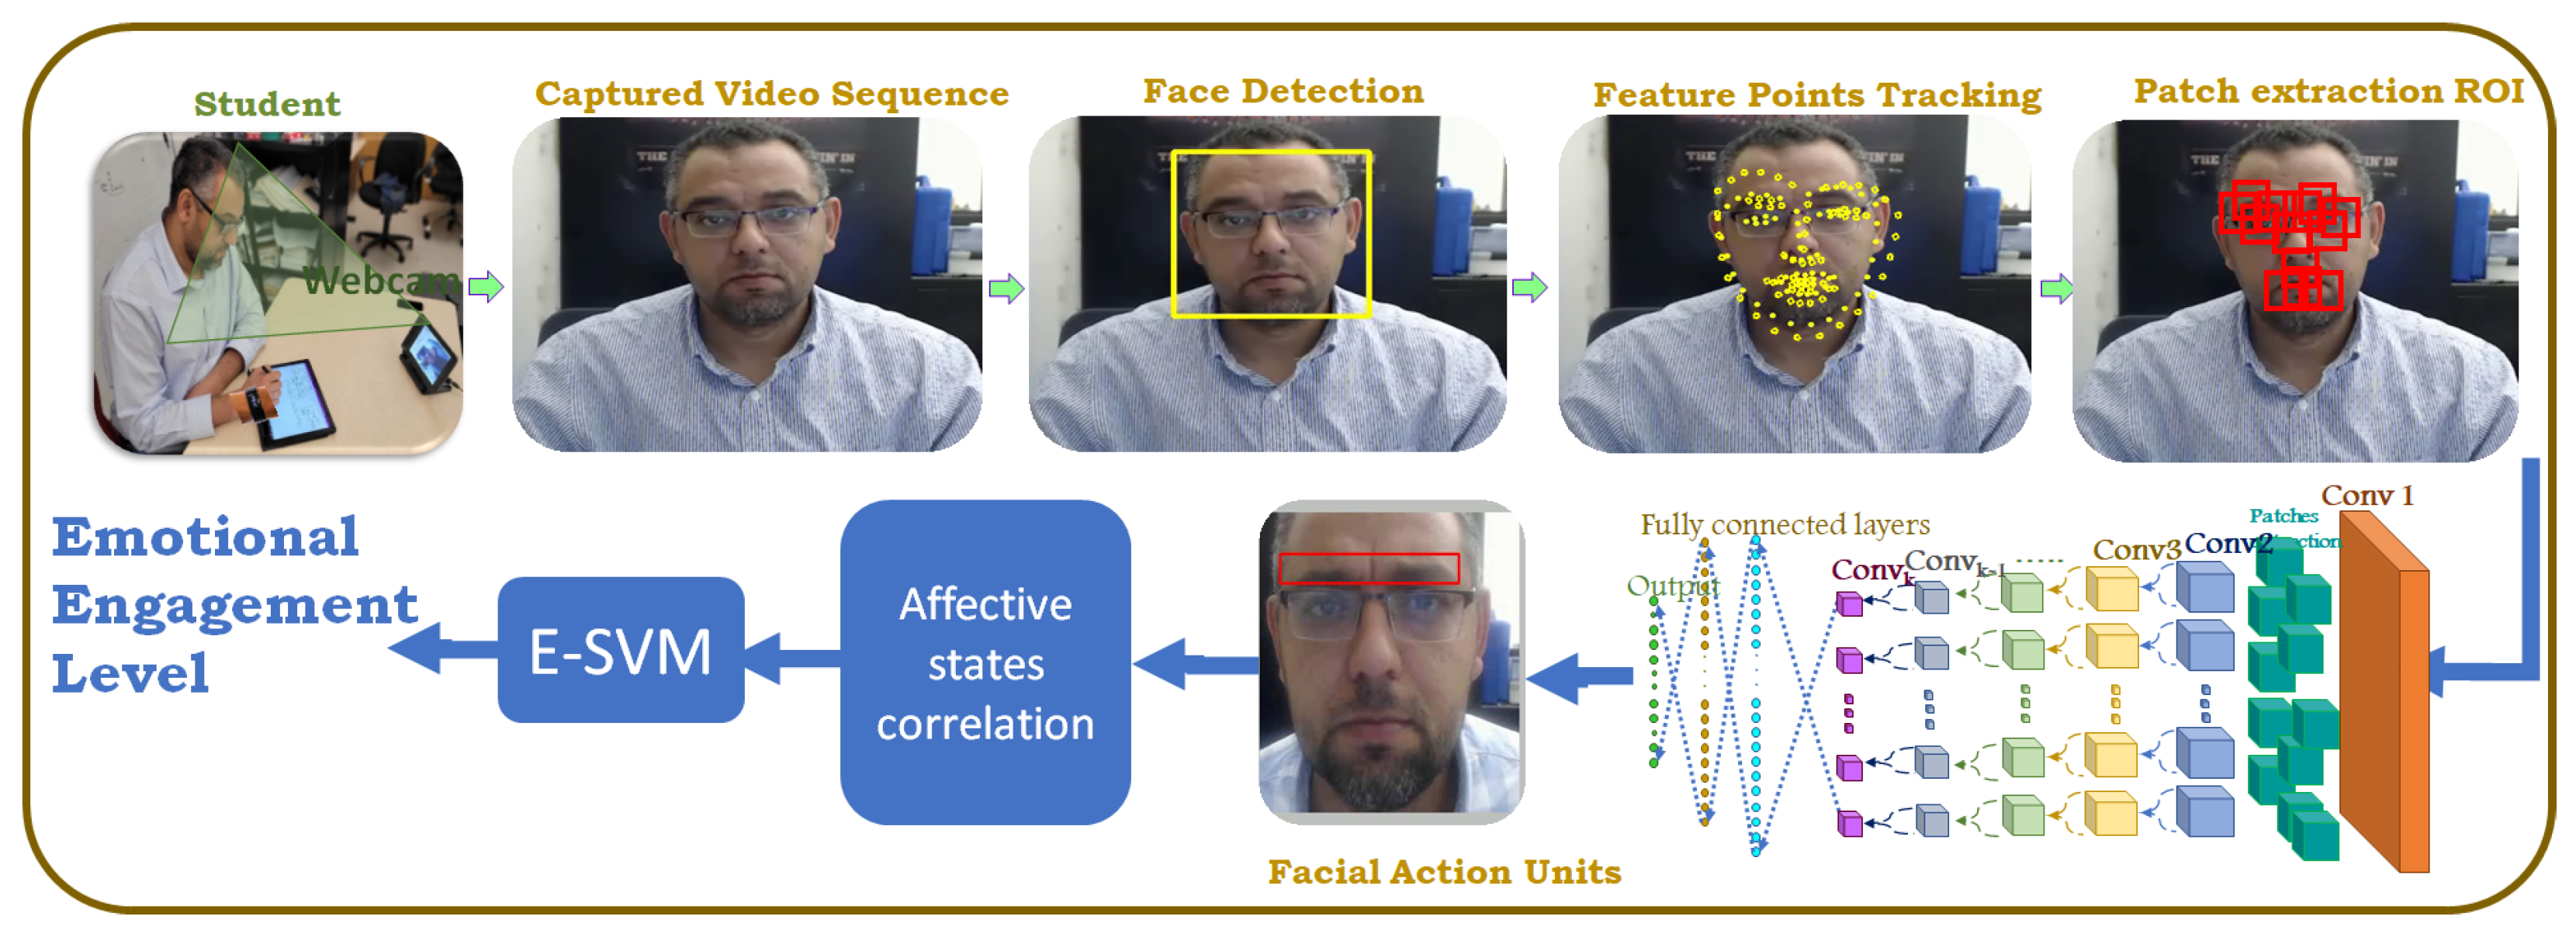
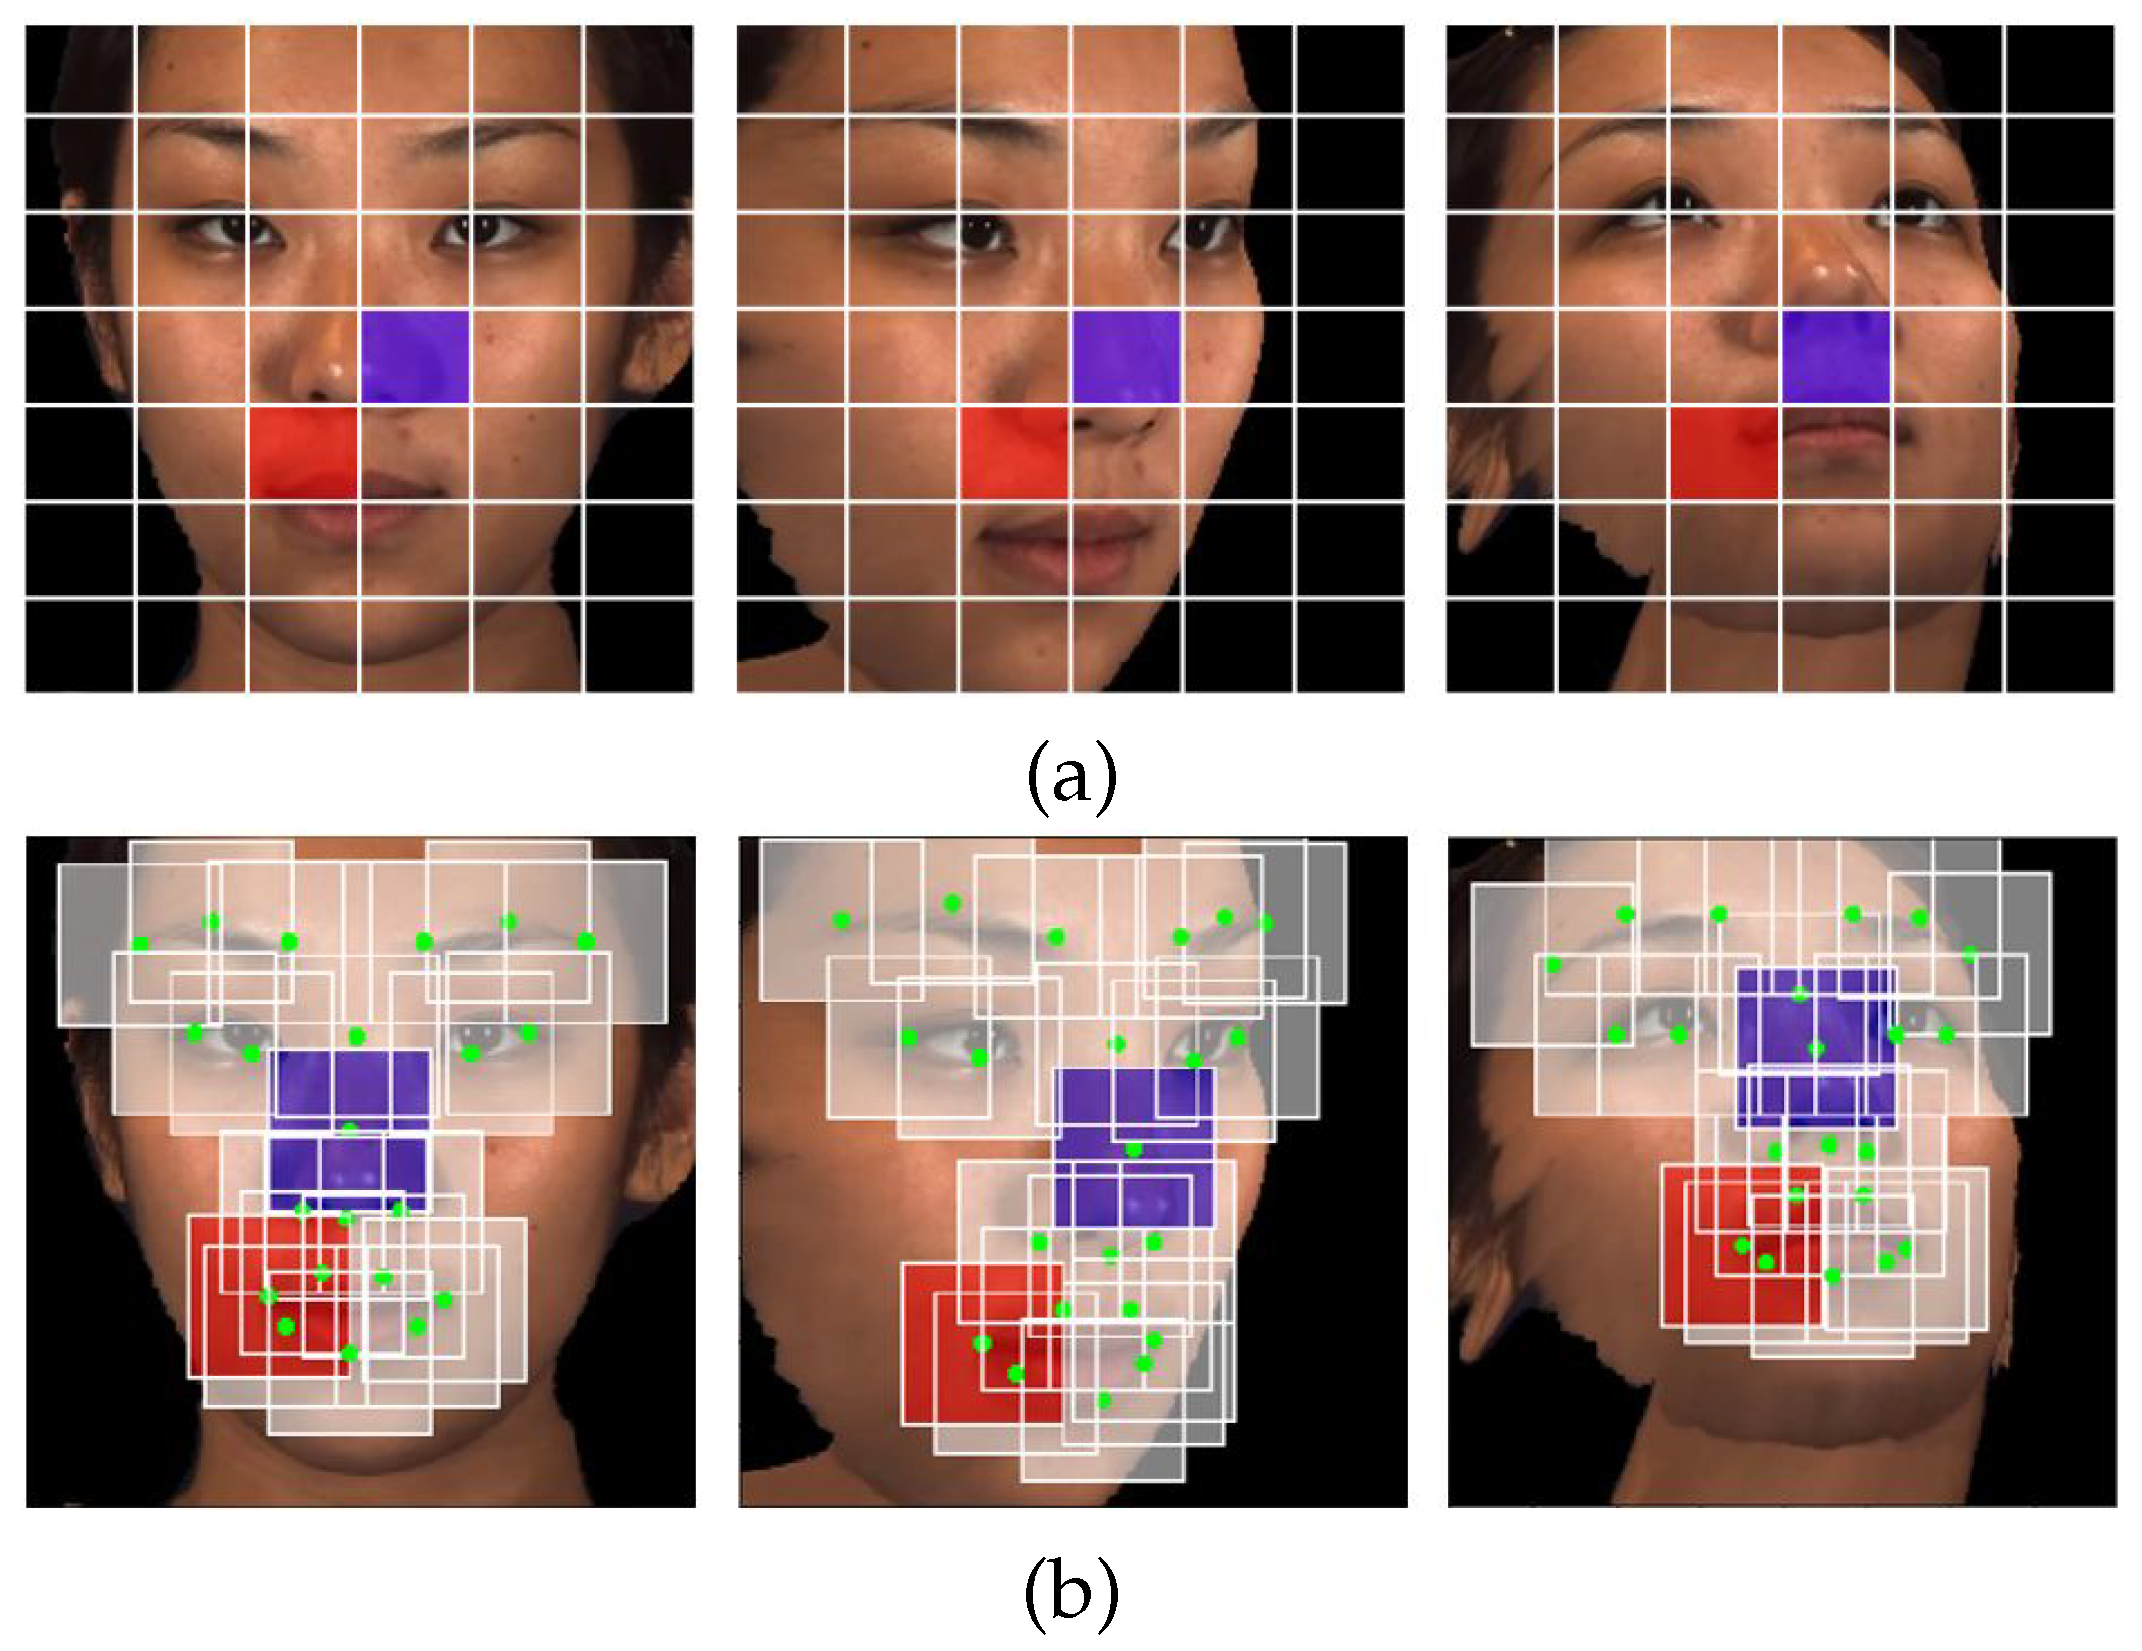
3. Proposed Emotional Engagement Detection Module
4. Experiments
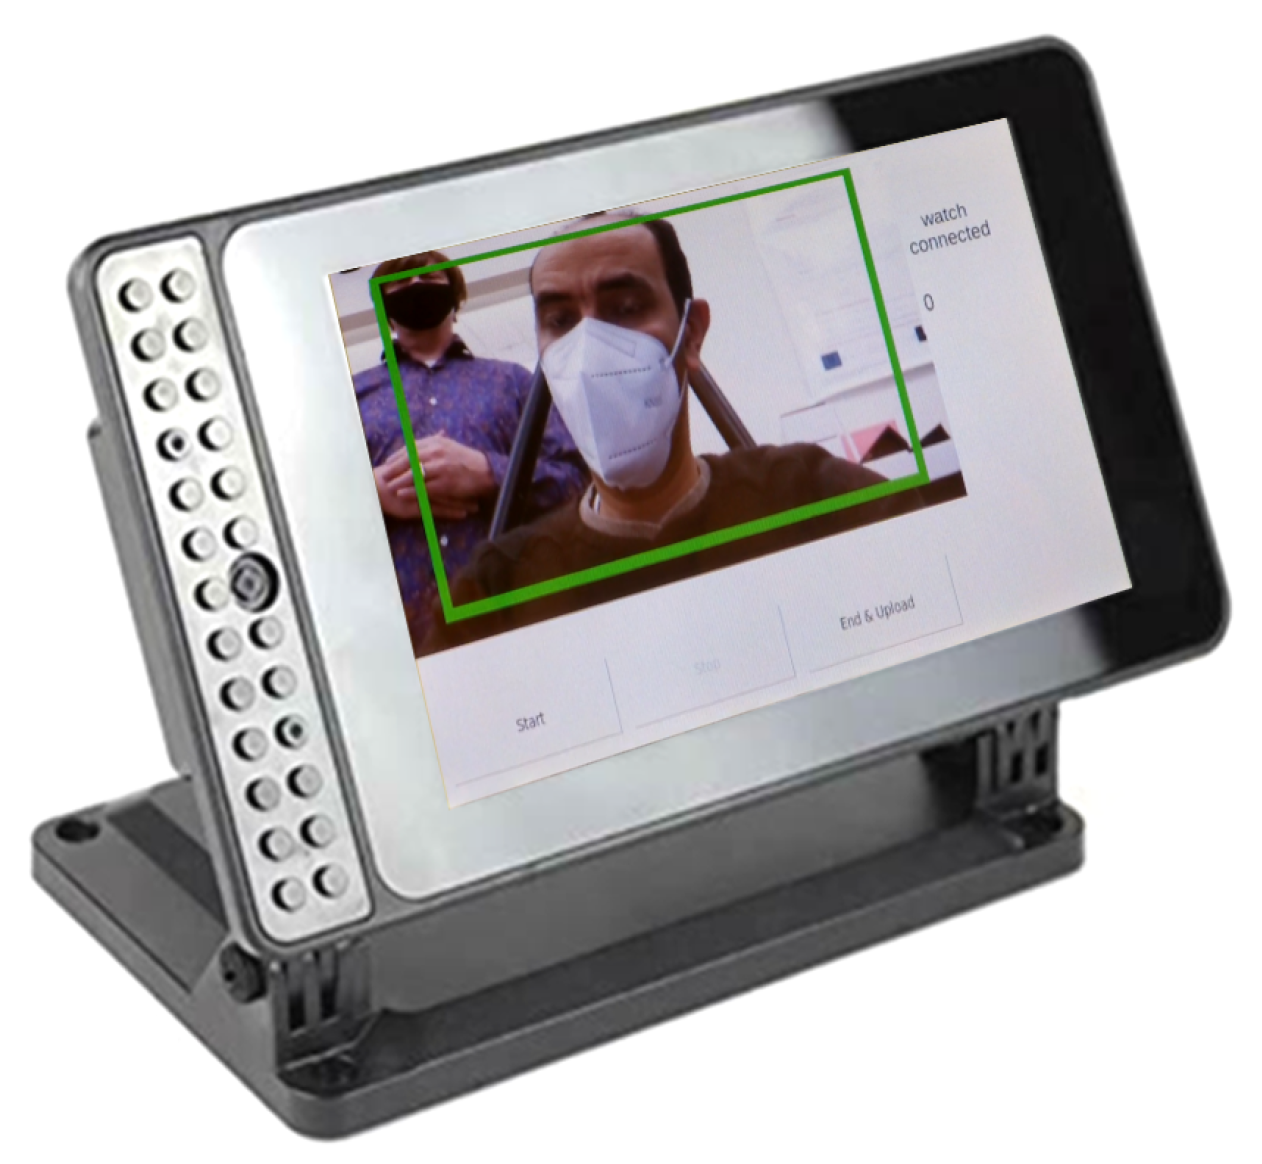
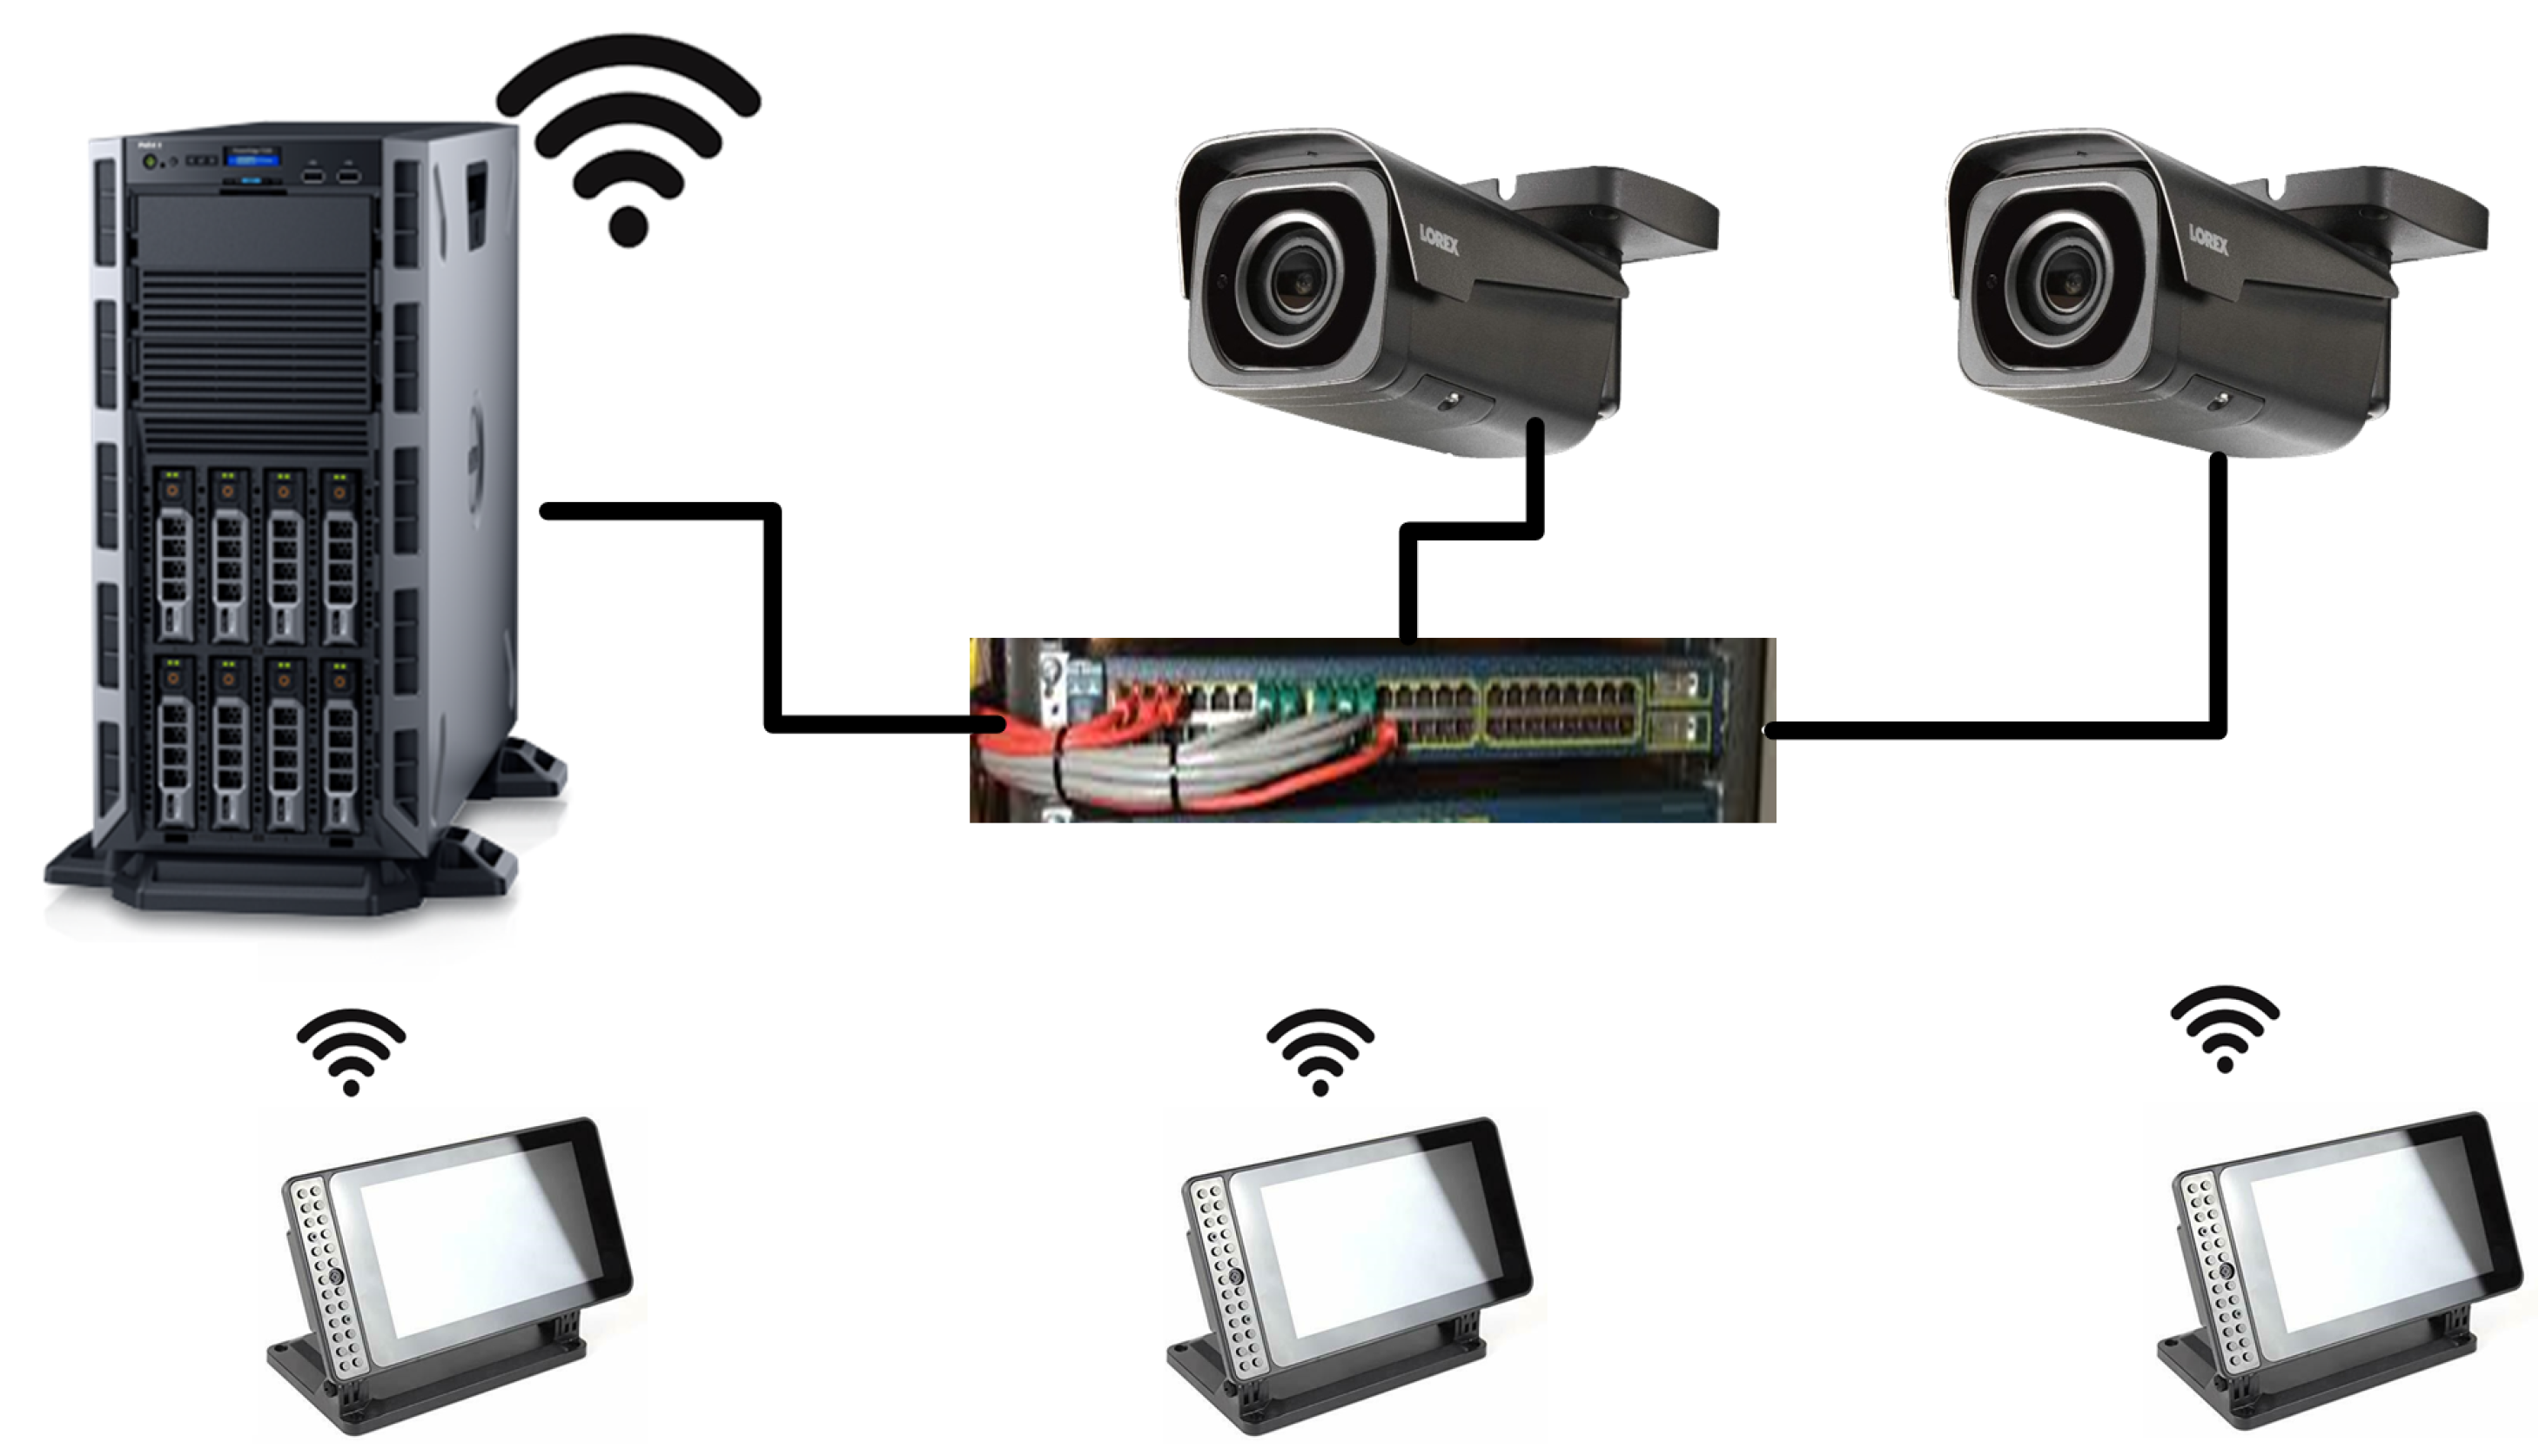
4.1. Hardware Setup
4.2. Data Collection
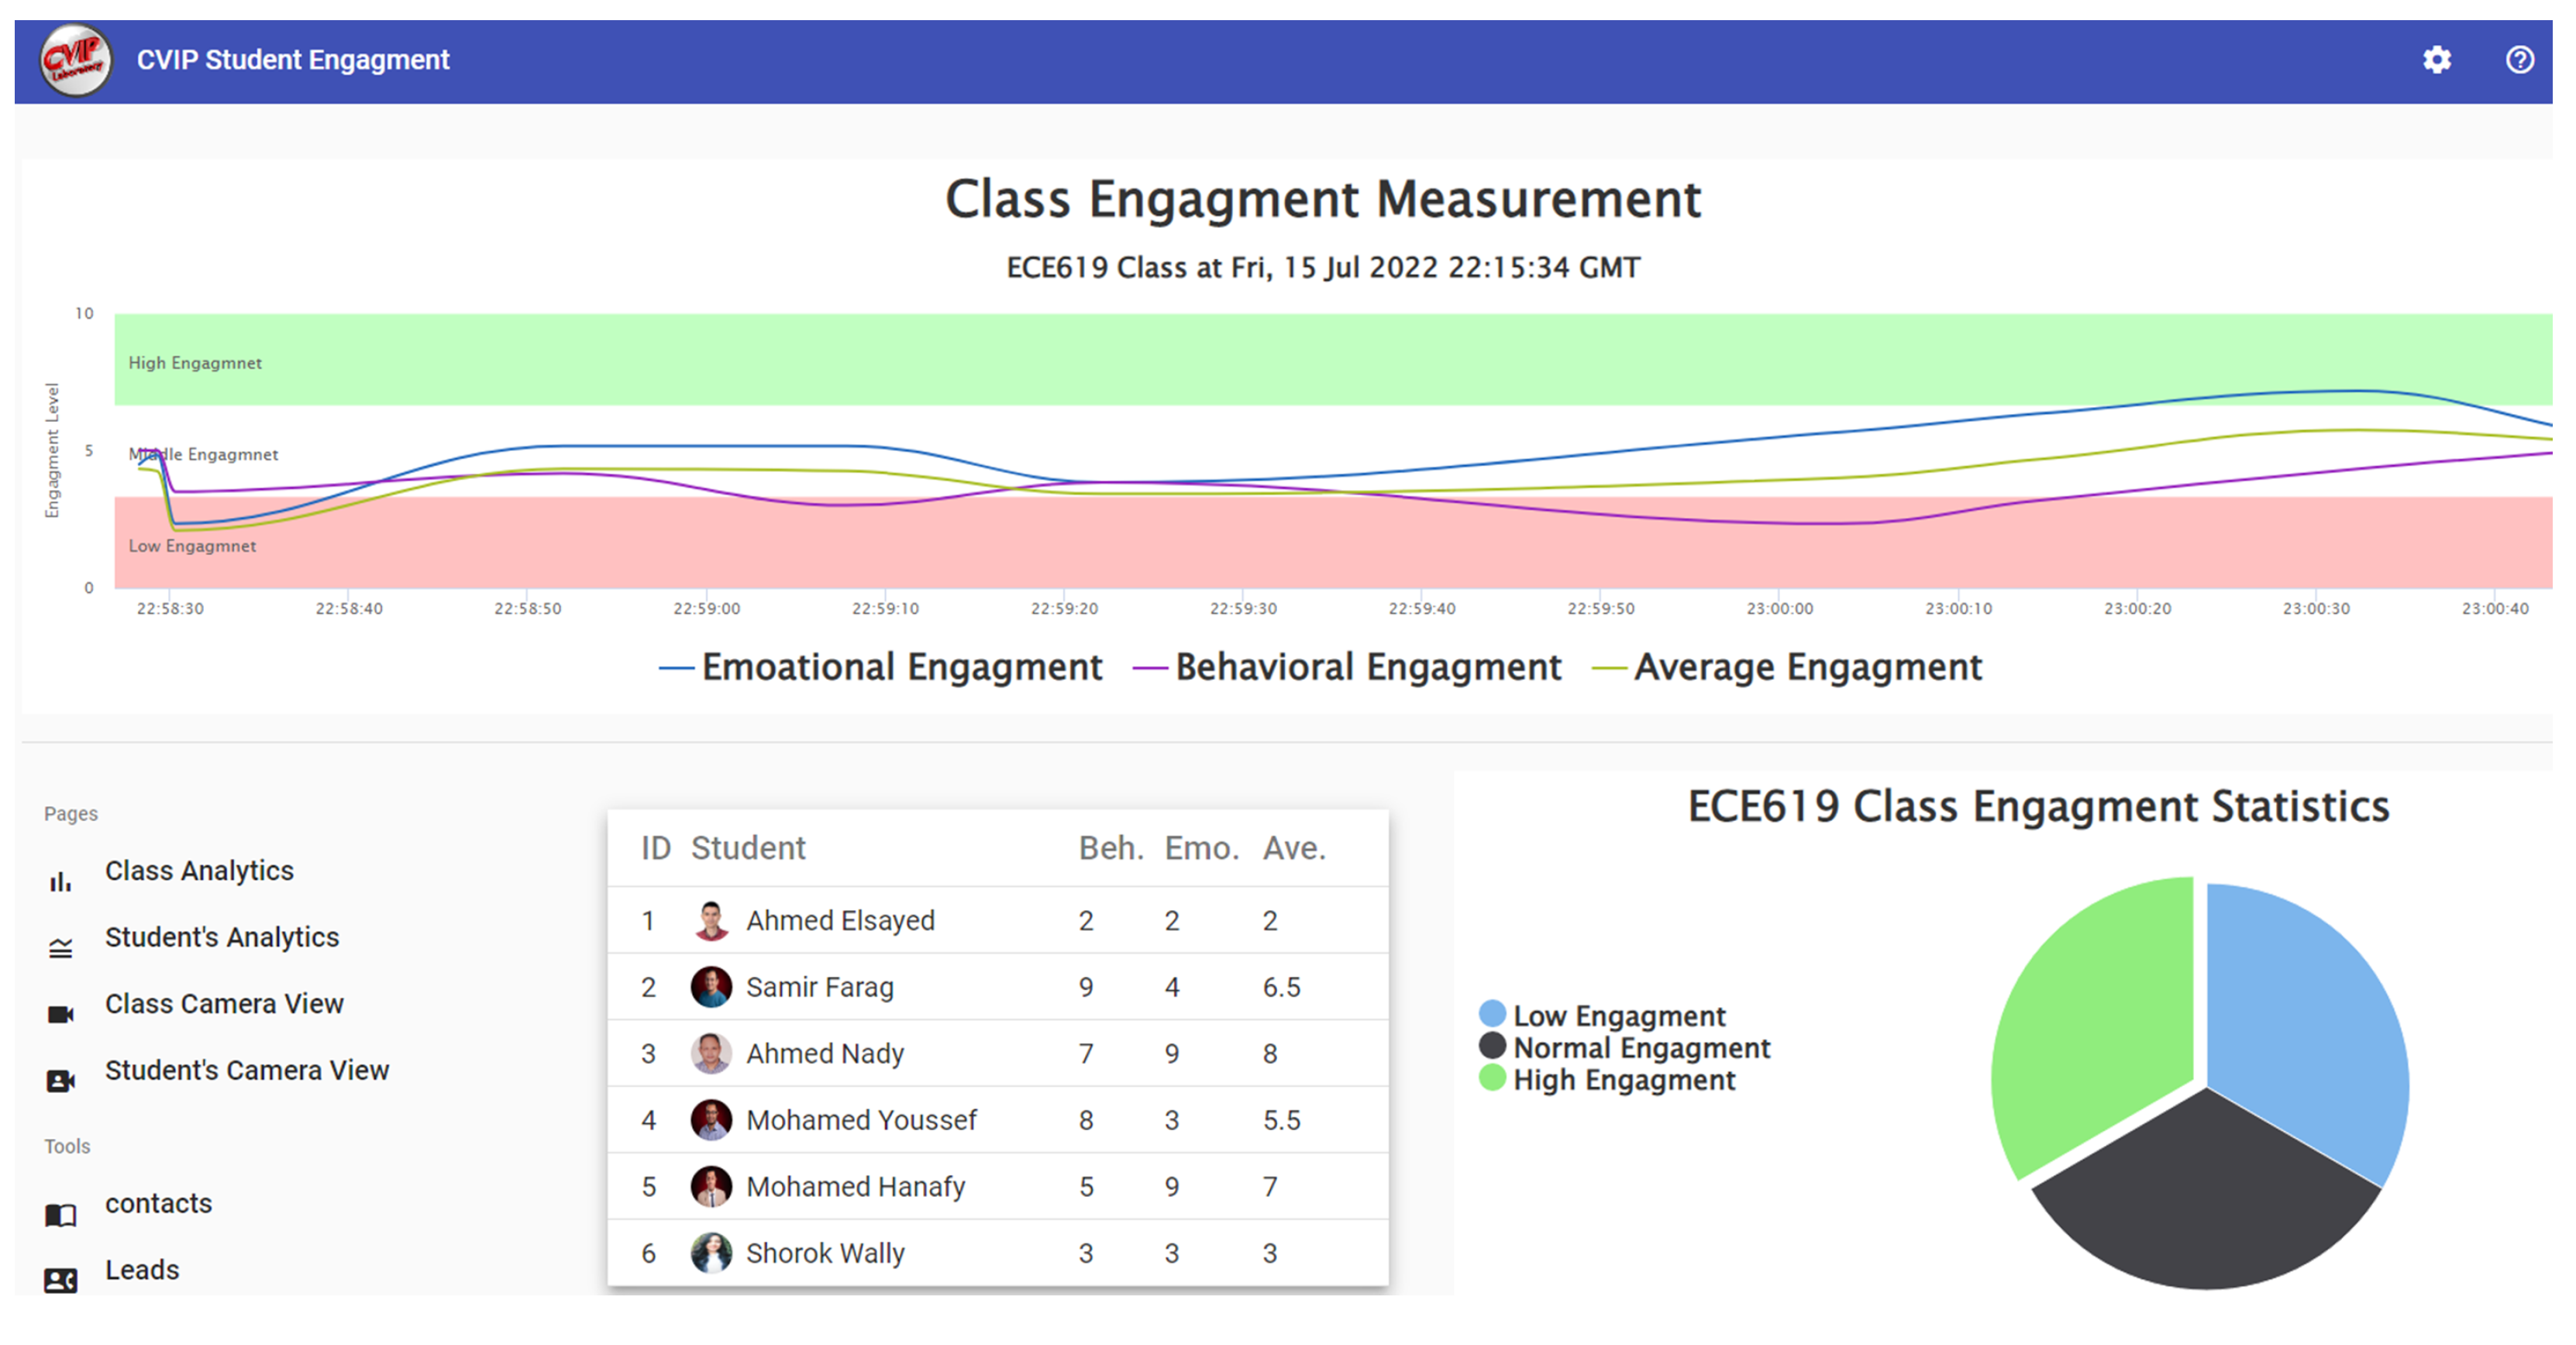
4.3. Evaluation
5. Conclusions and Future Work
Author Contributions
Funding
Institutional Review Board Statement
Informed Consent Statement
Data Availability Statement
Conflicts of Interest
References
- Xu, X.; de Sa, V.R. Exploring multidimensional measurements for pain evaluation using facial action units. In Proceedings of the 2020 15th IEEE International Conference on Automatic Face and Gesture Recognition (FG 2020), Buenos Aires, Argentina, 16–20 November 2020; IEEE: Piscataway, NJ, USA, 2020; pp. 786–792. [Google Scholar]
- Tan, Z.; Zhou, A.; Hei, X.; Gao, Y.; Zhang, C. Towards Automatic Engagement Recognition of Autistic Children in a Machine Learning Approach. In Proceedings of the 2019 IEEE International Conference on Engineering, Technology and Education (TALE), Yogyakarta, Indonesia, 10–13 December 2019; pp. 1–8. [Google Scholar] [CrossRef]
- Manfredonia, J.; Bangerter, A.; Manyakov, N.V.; Ness, S.; Lewin, D.; Skalkin, A.; Boice, M.; Goodwin, M.S.; Dawson, G.; Hendren, R.; et al. Automatic recognition of posed facial expression of emotion in individuals with autism spectrum disorder. J. Autism Dev. Disord. 2019, 49, 279–293. [Google Scholar] [CrossRef]
- Badgujar, P.; Selmokar, P. Driver gaze tracking and eyes off the road detection. Mater. Today Proc. 2022, 72, 1863–1868. [Google Scholar] [CrossRef]
- Alkabbany, I.; Ali, A.; Farag, A.; Bennett, I.; Ghanoum, M.; Farag, A. Measuring Student Engagement Level Using Facial Information. In Proceedings of the 2019 IEEE International Conference on Image Processing (ICIP), Taipei, Taiwan, 22–25 September 2019; IEEE: Piscataway, NJ, USA, 2019; pp. 3337–3341. [Google Scholar]
- Palaniswamy, S. A Robust Pose & Illumination Invariant Emotion Recognition from Facial Images using Deep Learning for Human–Machine Interface. In Proceedings of the 2019 4th International Conference on Computational Systems and Information Technology for Sustainable Solution (CSITSS), Bengaluru, India, 20–21 December 2019; IEEE: Piscataway, NJ, USA, 2019; Volume 4, pp. 1–6. [Google Scholar]
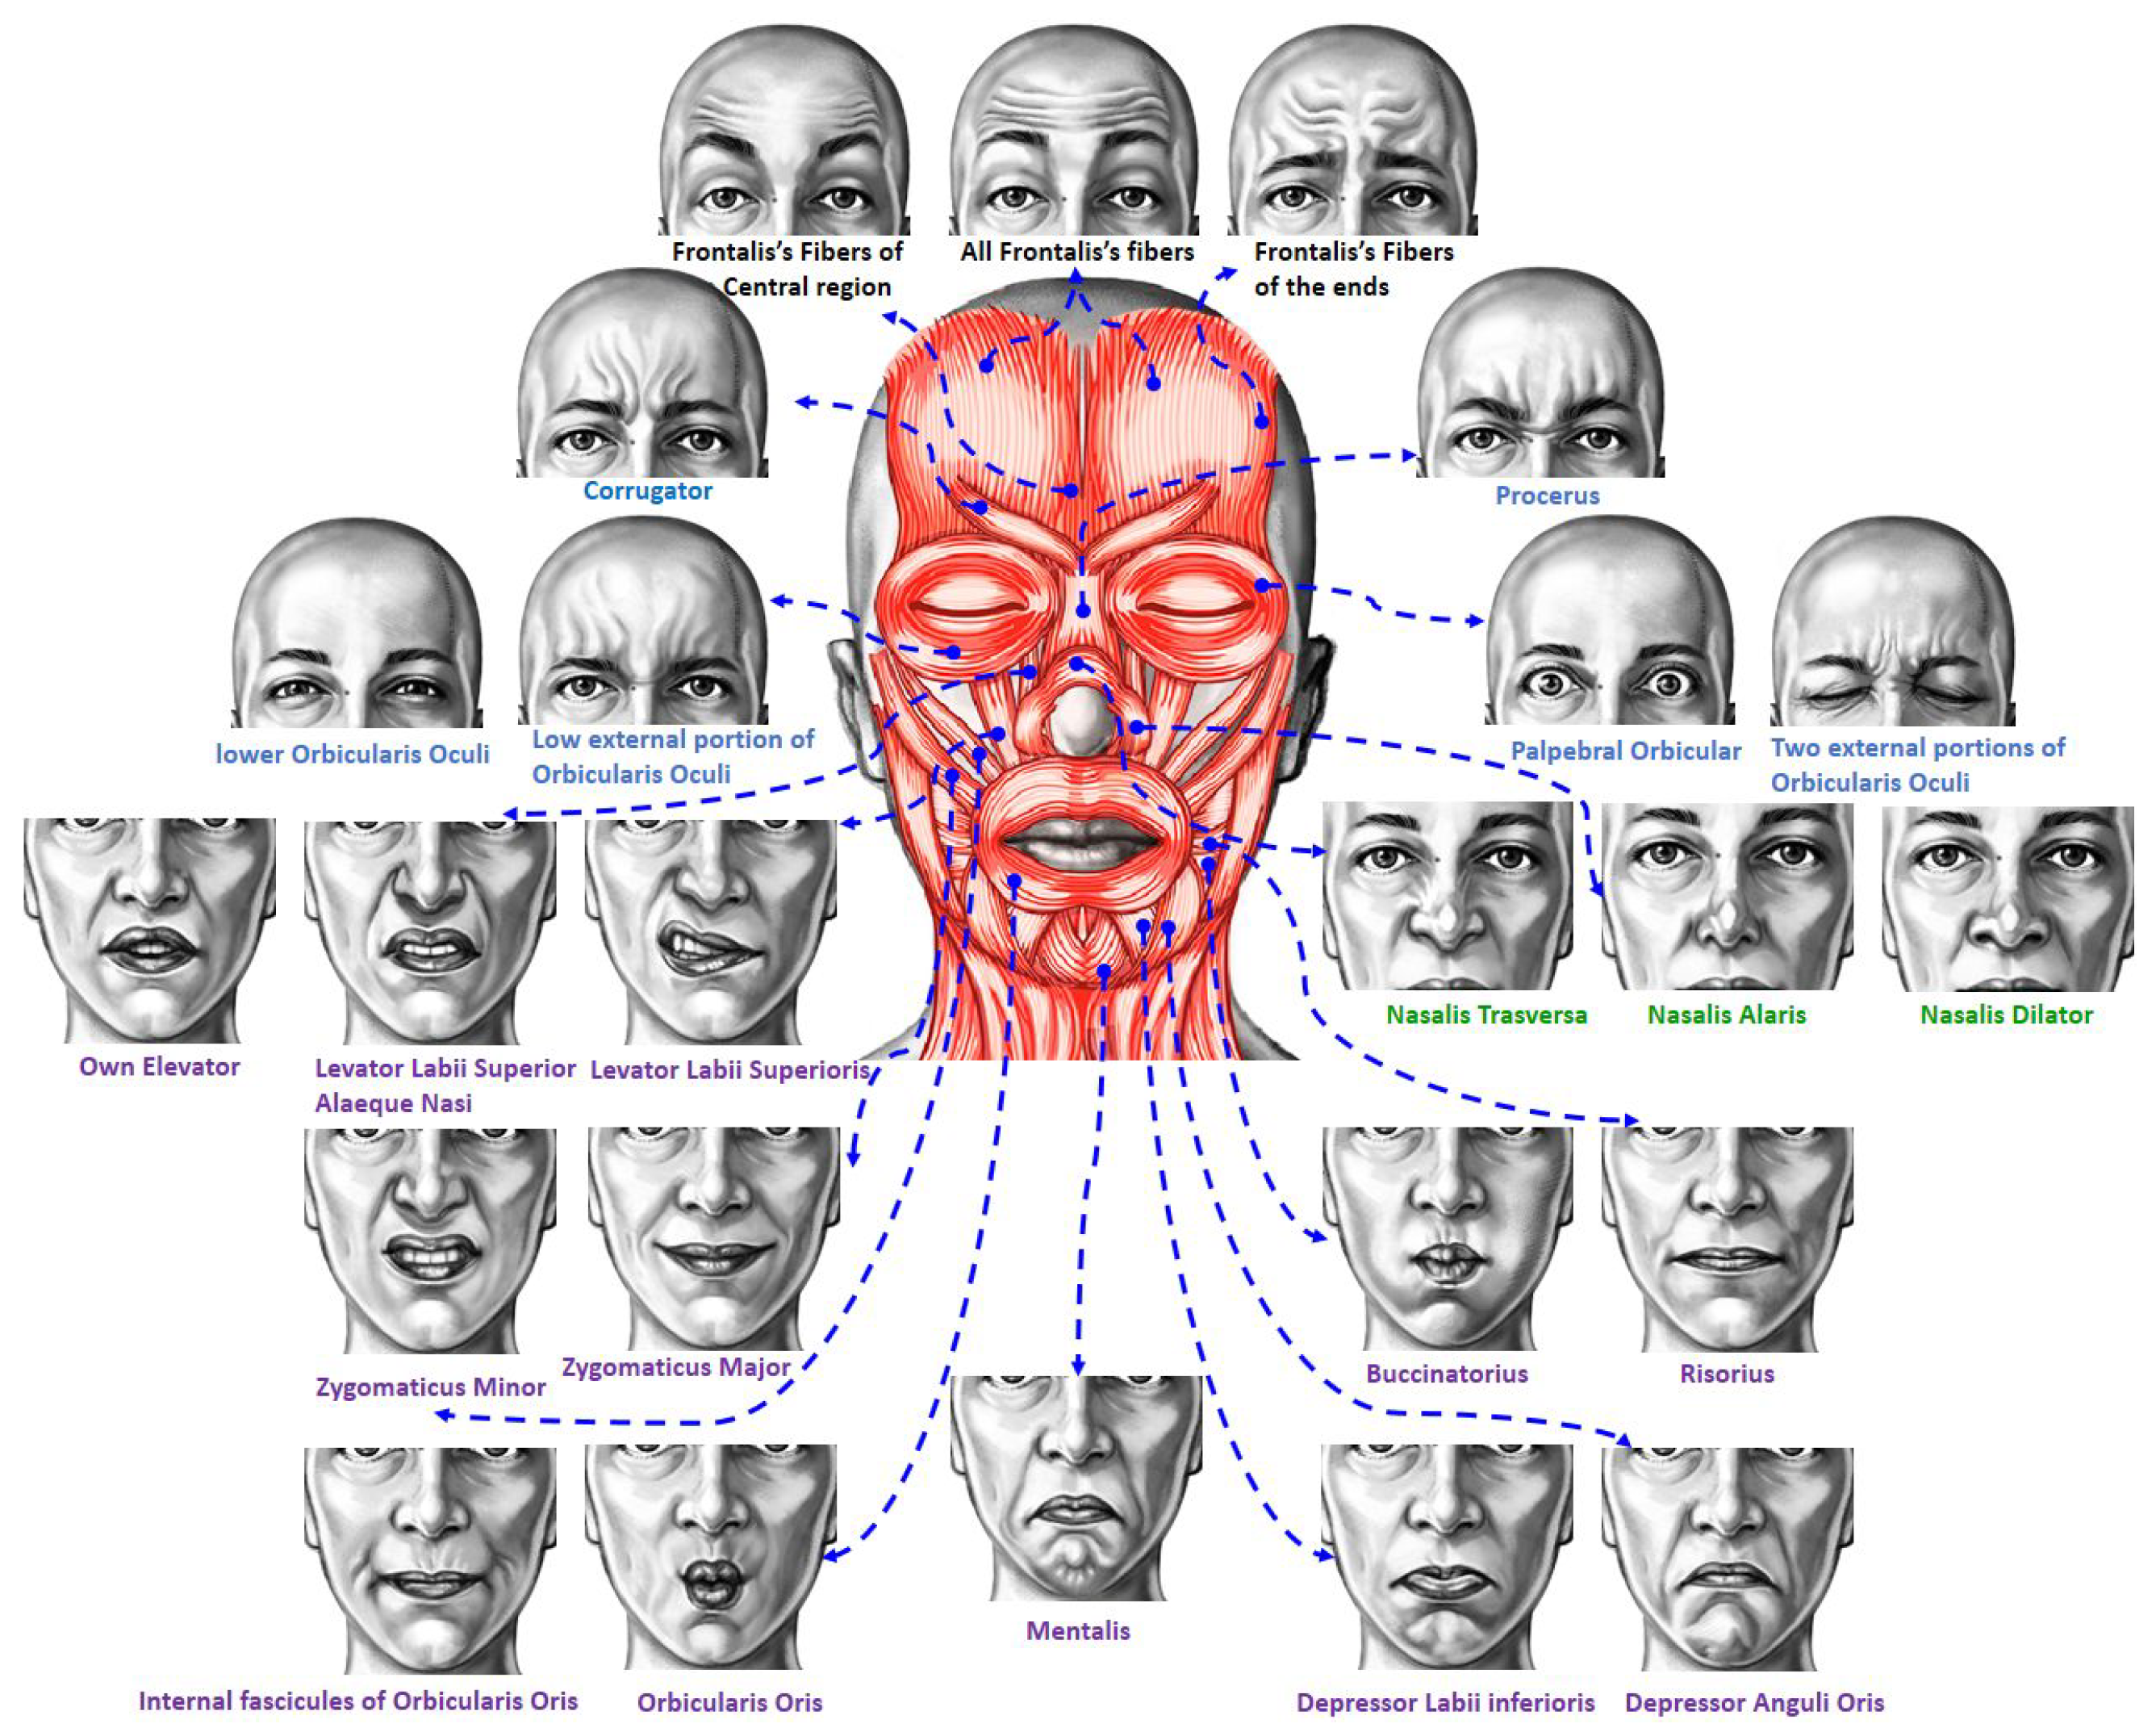
- Duchenne, G.B. Mécanisme de la physionomie humaine ou analyse électro-physiologique de l’expression des passions; Librairie, J.-B., Ed.; Ve Jules Renouard, libraire: Paris, France, 1876. [Google Scholar]
- Geisinger, B.N.; Raman, D.R. Why they leave: Understanding student attrition from engineering majors. Int. J. Eng. Educ. 2013, 29, 914. [Google Scholar]
- Zhang, G.; Anderson, T.J.; Ohland, M.W.; Thorndyke, B.R. Identifying factors influencing engineering student graduation: A longitudinal and cross-institutional study. J. Eng. Educ. 2004, 93, 313–320. [Google Scholar] [CrossRef]
- Patrick, A.D.; Prybutok, A. Predicting persistence in engineering through an engineering identity scale. Int. J. Eng. Educ. 2018, 34, 351–363. [Google Scholar]
- Good, C.; Rattan, A.; Dweck, C.S. Why do women opt out? Sense of belonging and women’s representation in mathematics. J. Personal. Soc. Psychol. 2012, 102, 700. [Google Scholar] [CrossRef]
- Whitcomb, K.M.; Singh, C. Underrepresented minority students receive lower grades and have higher rates of attrition across STEM disciplines: A sign of inequity? Int. J. Sci. Educ. 2021, 43, 1054–1089. [Google Scholar] [CrossRef]
- Hieb, J.L.; Lyle, K.B.; Ralston, P.A.; Chariker, J. Predicting performance in a first engineering calculus course: Implications for interventions. Int. J. Math. Educ. Sci. Technol. 2015, 46, 40–55. [Google Scholar] [CrossRef]
- Bego, C.R.; Barrow, I.Y.; Ralston, P.A. Identifying bottlenecks in undergraduate engineering mathematics: Calculus I through differential equations. In Proceedings of the 2017 ASEE Annual Conference & Exposition, Columbus, OH, USA, 25–28 June 2017. [Google Scholar]
- Kajander, A.; Lovric, M. Transition from secondary to tertiary mathematics: McMaster University experience. Int. J. Math. Educ. Sci. Technol. 2005, 36, 149–160. [Google Scholar] [CrossRef]
- Bellinger, D.B.; DeCaro, M.S.; Ralston, P.A. Mindfulness, anxiety, and high-stakes mathematics performance in the laboratory and classroom. Conscious. Cogn. 2015, 37, 123–132. [Google Scholar] [CrossRef]
- Walton, G.M.; Logel, C.; Peach, J.M.; Spencer, S.J.; Zanna, M.P. Two brief interventions to mitigate a “chilly climate” transform women’s experience, relationships, and achievement in engineering. J. Educ. Psychol. 2015, 107, 468. [Google Scholar] [CrossRef] [Green Version]
- Weaver, J.P.; DeCaro, M.S.; Hieb, J.L.; Ralston, P.A. Social Belonging and First-Year Engineering Mathematics: A Collaborative Learning Intervention. In Proceedings of the 2016 ASEE Annual Conference & Exposition, New Orleans, Louisiana, 26 June 2016. [Google Scholar]
- ARTNATOMYA (Anatomical bases of facial expression learning tool) Copyright 2006–2023 Victoria Contreras Flores. SPAIN. Available online: www.artnatomia.net; www.artnatomy.com (accessed on 2 September 2017).
- Fredricks, J.A.; Blumenfeld, P.C.; Paris, A.H. School engagement: Potential of the concept, state of the evidence. Rev. Educ. Res. 2004, 74, 59–109. [Google Scholar] [CrossRef]
- Greene, B.A. Measuring cognitive engagement with self-report scales: Reflections from over 20 years of research. Educ. Psychol. 2015, 50, 14–30. [Google Scholar] [CrossRef]
- Sinatra, G.M.; Heddy, B.C.; Lombardi, D. The challenges of defining and measuring student engagement in science. Educ. Psychol. 2015, 50, 1–13. [Google Scholar] [CrossRef]
- Sinclair, M.; Christenson, S.; Lehr, C.; Anderson, A. Facilitating Student Engagement: Lessons Learned from Check & Connect Longitudinal Studies. Calif. Sch. Psychol. 2014, 8, 29–41. [Google Scholar] [CrossRef]
- Craik, F.I.; Lockhart, R.S. Levels of processing: A framework for memory research. J. Verbal Learn. Verbal Behav. 1972, 11, 671–684. [Google Scholar] [CrossRef]
- Marton, F.; Säljö, R. On qualitative differences in learning: I—Outcome and process. Br. J. Educ. Psychol. 1976, 46, 4–11. [Google Scholar] [CrossRef]
- Posner, M.I.; Petersen, S.E. The attention system of the human brain. Annu. Rev. Neurosci. 1990, 13, 25–42. [Google Scholar] [CrossRef]
- Watson, D.; Wiese, D.; Vaidya, J.; Tellegen, A. The two general activation systems of affect: Structural findings, evolutionary considerations, and psychobiological evidence. J. Personal. Soc. Psychol. 1999, 76, 820. [Google Scholar] [CrossRef]
- Petersen, S.E.; Posner, M.I. The attention system of the human brain: 20 years after. Annu. Rev. Neurosci. 2012, 35, 73. [Google Scholar] [CrossRef]
- Kapoor, A.; Picard, R.W. Multimodal Affect Recognition in Learning Environments. In Proceedings of the 13th Annual ACM International Conference on Multimedia, Singapore, 6–11 November 2005; pp. 677–682. [Google Scholar]
- McDaniel, B.; D’Mello, S.; King, B.; Chipman, P.; Tapp, K.; Graesser, A. Facial features for affective state detection in learning environments. In Proceedings of the Annual Meeting of the Cognitive Science Society, Nashville, TN, USA, 1–4 August 2007; Volume 29. [Google Scholar]
- D’Mello, S.K.; Graesser, A. Multimodal semi-automated affect detection from conversational cues, gross body language, and facial features. User Model. User-Adapt. Interact. 2010, 20, 147–187. [Google Scholar] [CrossRef]
- Grafsgaard, J.F.; Wiggins, J.B.; Boyer, K.E.; Wiebe, E.N.; Lester, J.C. Automatically Recognizing Facial Indicators of Frustration: A Learning-centric Analysis. In Proceedings of the 2013 Humaine Association Conference on Affective Computing and Intelligent Interaction, Geneva, Switzerland, 2–5 September 2013. [Google Scholar]
- Whitehill, J.; Serpell, Z.; Lin, Y.; Foster, A.; Movellan, J.R. The Faces of Engagement: Automatic Recognition of Student Engagement from Facial Expressions. IEEE Trans. Affect. Comput. 2014, 5, 86–98. [Google Scholar] [CrossRef]
- Ahuja, K.; Kim, D.; Xhakaj, F.; Varga, V.; Xie, A.; Zhang, S.; Townsend, J.E.; Harrison, C.; Ogan, A.; Agarwal, Y. EduSense: Practical Classroom Sensing at Scale. Proc. ACM Interact. Mob. Wearable Ubiquitous Technol. 2019, 3, 1–26. [Google Scholar] [CrossRef]
- Li, Y.Y.; Hung, Y.P. Feature fusion of face and body for engagement intensity detection. In Proceedings of the 2019 IEEE International Conference on Image Processing (ICIP), Taipei, Taiwan, 22–25 September 2019; IEEE: Piscataway, NJ, USA, 2019; pp. 3312–3316. [Google Scholar]
- Dhamija, S.; Boult, T.E. Automated mood-aware engagement prediction. In Proceedings of the 2017 Seventh International Conference on Affective Computing and Intelligent Interaction (ACII), San Antonio, TX, USA, 23–26 October 2017; IEEE: Piscataway, NJ, USA, 2017; pp. 1–8. [Google Scholar]
- Littlewort, G.; Whitehill, J.; Wu, T.; Fasel, I.; Frank, M.; Movellan, J.; Bartlett, M. The computer expression recognition toolbox (CERT). In Proceedings of the 2011 IEEE International Conference on Automatic Face & Gesture Recognition (FG), Santa Barbara, CA, USA, 21–25 March 2011; IEEE: Piscataway, NJ, USA, 2011; pp. 298–305. [Google Scholar]
- Monkaresi, H.; Bosch, N.; Calvo, R.A.; D’Mello, S.K. Automated detection of engagement using video-based estimation of facial expressions and heart rate. IEEE Trans. Affect. Comput. 2016, 8, 15–28. [Google Scholar] [CrossRef]
- Henderson, N.L.; Rowe, J.P.; Mott, B.W.; Lester, J.C. Sensor-based Data Fusion for Multimodal Affect Detection in Game-based Learning Environments. In Proceedings of the EDM (Workshops), Montréal, QC, Canada, 2–5 July 2019; pp. 44–50. [Google Scholar]
- Dhamija, S.; Boult, T.E. Exploring contextual engagement for trauma recovery. In Proceedings of the IEEE Conference on Computer Vision and Pattern Recognition Workshops, Honolulu, HI, USA, 21–26 July 2017; pp. 19–29. [Google Scholar]
- Macea, D.D.; Gajos, K.; Calil, Y.A.D.; Fregni, F. The efficacy of Web-based cognitive behavioral interventions for chronic pain: A systematic review and meta-analysis. J. Pain 2010, 11, 917–929. [Google Scholar] [CrossRef]
- Marks, S.U.; Gersten, R. Engagement and disengagement between special and general educators: An application of Miles and Huberman’s cross-case analysis. Learn. Disabil. Q. 1998, 21, 34–56. [Google Scholar] [CrossRef]
- Booth, B.M.; Ali, A.M.; Narayanan, S.S.; Bennett, I.; Farag, A.A. Toward active and unobtrusive engagement assessment of distance learners. In Proceedings of the 2017 Seventh International Conference on Affective Computing and Intelligent Interaction (ACII), San Antonio, TX, USA, 23–26 October 2017; IEEE: Piscataway, NJ, USA, 2017; pp. 470–476. [Google Scholar]
- Foreman, J.C.; Farag, A.; Ali, A.; Alkabbany, I.; DeCaro, M.S.; Tretter, T. Towards a multi-dimensional biometric approach to real-time measurement of student engagement in the STEM classroom. In Proceedings of the 2020 ASEE Virtual Annual Conference, Virtual conference, 22–26 June 2020. [Google Scholar]
- Farag, A.A.; Ali, A.; Alkabbany, I.; Foreman, J.C.; Tretter, T.; DeCaro, M.S.; Hindy, N.C. Toward a Quantitative Engagement Monitor for STEM Education. In Proceedings of the 2021 ASEE Virtual Annual Conference, Virtual conference, 26– 29 July 2021. [Google Scholar]
- Alkabbany, I.M.A.M.M. Biometric Features Modeling to Measure Students Engagement. Ph.D. Thesis, University of Louisville, Louisville, KY, USA, 2021. [Google Scholar]
- O’Malley, K.J.; Moran, B.J.; Haidet, P.; Seidel, C.L.; Schneider, V.; Morgan, R.O.; Kelly, P.A.; Richards, B. Validation of an observation instrument for measuring student engagement in health professions settings. Eval. Health Prof. 2003, 26, 86–103. [Google Scholar] [CrossRef]
- Lane, E.S.; Harris, S.E. A new tool for measuring student behavioral engagement in large university classes. J. Coll. Sci. Teach. 2015, 44, 83–91. [Google Scholar] [CrossRef]
- Chang, C.; Zhang, C.; Chen, L.; Liu, Y. An ensemble model using face and body tracking for engagement detection. In Proceedings of the 20th ACM International Conference on Multimodal Interaction, Boulder, CO, USA, 16–20 October 2018; pp. 616–622. [Google Scholar]
- Kleinsmith, A.; De Silva, P.R.; Bianchi-Berthouze, N. Cross-cultural differences in recognizing affect from body posture. Interact. Comput. 2006, 18, 1371–1389. [Google Scholar] [CrossRef]
- Meeren, H.K.; van Heijnsbergen, C.C.; de Gelder, B. Rapid perceptual integration of facial expression and emotional body language. Proc. Natl. Acad. Sci. USA 2005, 102, 16518–16523. [Google Scholar] [CrossRef]
- Schindler, K.; Van Gool, L.; De Gelder, B. Recognizing emotions expressed by body pose: A biologically inspired neural model. Neural Netw. 2008, 21, 1238–1246. [Google Scholar] [CrossRef] [PubMed]
- Mota, S.; Picard, R.W. Automated posture analysis for detecting learner’s interest level. In Proceedings of the 2003 Conference on Computer Vision and Pattern Recognition Workshop, Madison, WI, USA, 16–22 June 2022; IEEE: Piscataway, NJ, USA, 2003; Volume 5, p. 49. [Google Scholar]
- Arroyo, I.; Cooper, D.G.; Burleson, W.; Woolf, B.P.; Muldner, K.; Christopherson, R. Emotion sensors go to school. In Proceedings of the 14th International Conference on Artificial Intelligence in Education (AIED), Brighton, UK, 6–10 July 2009; IOS Press: Amsterdam, The Netherlands, 2009; pp. 17–24. [Google Scholar]
- Goldin-Meadow, S. How gesture works to change our minds. Trends Neurosci. Educ. 2014, 3, 4–6. [Google Scholar] [CrossRef] [PubMed]
- Goldin-Meadow, S. Taking a hands-on approach to learning. Policy Insights Behav. Brain Sci. 2018, 5, 163–170. [Google Scholar] [CrossRef]
- Pease, B.; Pease, A. The Definitive Book of Body Language: The Hidden Meaning Behind People’s Gestures and Expressions; Bantam: New York, NY, USA, 2008. [Google Scholar]
- Rocca, K.A. Student participation in the college classroom: An extended multidisciplinary literature review. Commun. Educ. 2010, 59, 185–213. [Google Scholar] [CrossRef]
- Cook, S.W.; Goldin-Meadow, S. The role of gesture in learning: Do children use their hands to change their minds? J. Cogn. Dev. 2006, 7, 211–232. [Google Scholar] [CrossRef]
- Raca, M.; Dillenbourg, P. System for assessing classroom attention. In Proceedings of the Third International Conference on Learning Analytics and Knowledge, Leuven, Belgium, 8–13 April 2013; pp. 265–269. [Google Scholar]
- Stiefelhagen, R. Tracking focus of attention in meetings. In Proceedings of the Fourth IEEE International Conference on Multimodal Interfaces, Pittsburgh, PA, USA, 16 October 2022; IEEE: Piscataway, NJ, USA, 2002; pp. 273–280. [Google Scholar]
- Zaletelj, J.; Košir, A. Predicting students’ attention in the classroom from Kinect facial and body features. EURASIP J. Image Video Process. 2017, 2017, 80. [Google Scholar] [CrossRef]
- Raca, M. Camera-Based Estimation of Student’s Attention in Class; Technical report; École polytechnique fédérale de Lausann: Lausanne, Switzerland, 2015. [Google Scholar]
- Li, B.; Li, H.; Zhang, R. Adaptive random network coding for multicasting hard-deadline-constrained prioritized data. IEEE Trans. Veh. Technol. 2015, 65, 8739–8744. [Google Scholar] [CrossRef]
- Bosch, N.; Chen, Y.; D’Mello, S. It’s written on your face: Detecting affective states from facial expressions while learning computer programming. In Proceedings of the International Conference on Intelligent Tutoring Systems, Honolulu, HI, USA, 5–9 June 2014; Springer: Berlin/Heidelberg, Germany, 2014; pp. 39–44. [Google Scholar]
- Kapoor, A.; Burleson, W.; Picard, R.W. Automatic prediction of frustration. Int. J. Hum.-Comput. Stud. 2007, 65, 724–736. [Google Scholar] [CrossRef]
- Bosch, N.; D’mello, S.K.; Ocumpaugh, J.; Baker, R.S.; Shute, V. Using Video to Automatically Detect Learner Affect in Computer-Enabled Classrooms. ACM Trans. Interact. Intell. Syst. 2016, 6. [Google Scholar] [CrossRef]
- Chi, M. Active-Constructive-Interactive: A Conceptual Framework for Differentiating Learning Activities. Top. Cogn. Sci. 2009, 1, 73–105. [Google Scholar] [CrossRef]
- Saneiro, M.; Santos, O.C.; Salmeron-Majadas, S.; Boticario, J.G. Towards Emotion Detection in Educational Scenarios from Facial Expressions and Body Movements through Multimodal Approaches. Sci. World J. 2014, 2014, 484873. [Google Scholar] [CrossRef] [PubMed] [Green Version]
- Cano, D.R. The Effect of Engagement on at Risk Student Achievement: A Correlational Investigation; Dallas Baptist University: Dallas, TX, USA, 2015. [Google Scholar]
- Ahuja, K.; Shah, D.; Pareddy, S.; Xhakaj, F.; Ogan, A.; Agarwal, Y.; Harrison, C. Classroom Digital Twins with Instrumentation-Free Gaze Tracking. In Proceedings of the 2021 CHI Conference on Human Factors in Computing Systems, Yokohama, Japan, 8–13 May 2021; Association for Computing Machinery: New York, NY, USA, 2021. [Google Scholar] [CrossRef]
- Hao, N.; Xue, H.; Yuan, H.; Wang, Q.; Runco, M. Enhancing creativity: Proper body posture meets proper emotion. Acta Psychol. 2017, 173, 32–40. [Google Scholar] [CrossRef] [PubMed]
- Andolfi, V.; di nuzzo, C.; Antonietti, A. Opening the Mind through the Body: The Effects of Posture on Creative Processes. Think. Ski. Creat. 2017, 24, 20–28. [Google Scholar] [CrossRef]
- Baltrusaitis, T.; Zadeh, A.; Lim, Y.C.; Morency, L.P. Openface 2.0: Facial behavior analysis toolkit. In Proceedings of the 2018 13th IEEE International Conference on Automatic Face & Gesture Recognition (FG 2018), Xi’an, China, 15–19 May 2018; IEEE: Piscataway, NJ, USA, 2018; pp. 59–66. [Google Scholar]
- Wood, E.; Baltrusaitis, T.; Zhang, X.; Sugano, Y.; Robinson, P.; Bulling, A. Rendering of eyes for eye-shape registration and gaze estimation. In Proceedings of the IEEE International Conference on Computer Vision, Santiago, Chile, 7–13 December 2015; pp. 3756–3764. [Google Scholar]
- Skinner, E.; Belmont, M. Motivation in the Classroom: Reciprocal Effects of Teacher Behavior and Student Engagement Across the School Year. J. Educ. Psychol. 1993, 85, 571–581. [Google Scholar] [CrossRef]
- Voelkl, K.E. Identification with school. Am. J. Educ. 1997, 105, 294–318. [Google Scholar] [CrossRef]
- Appleton, J.; Christenson, S.; Kim, D.; Reschly, A. Measuring Cognitive and Psychological Engagement: Validation of the Student Engagement Instrument. J. Sch. Psychol. 2006, 44, 427–445. [Google Scholar] [CrossRef]
- Mostafa, E.; Ali, A.A.; Shalaby, A.; Farag, A. A Facial Features Detector Integrating Holistic Facial Information and Part-Based Model. In Proceedings of the CVPR-Workshops, Boston, MA, USA, 7–12 June 2015. [Google Scholar]
- Sagonas, C.; Antonakos, E.; Tzimiropoulos, G.; Zafeiriou, S.; Pantic, M. 300 Faces In-The-Wild Challenge: Database and results. Image Vis. Comput. 2016, 47, 3–18. [Google Scholar] [CrossRef] [Green Version]
- Ali, A.M.; Alkabbany, I.; Farag, A.; Bennett, I.; Farag, A. Facial Action Units Detection Under Pose Variations Using Deep Regions Learning. In Proceedings of the Seventh International Conference on Affective Computing and Intelligent Interaction (ACII), San Antonio, TX, USA, 23–26 October 2017. [Google Scholar]


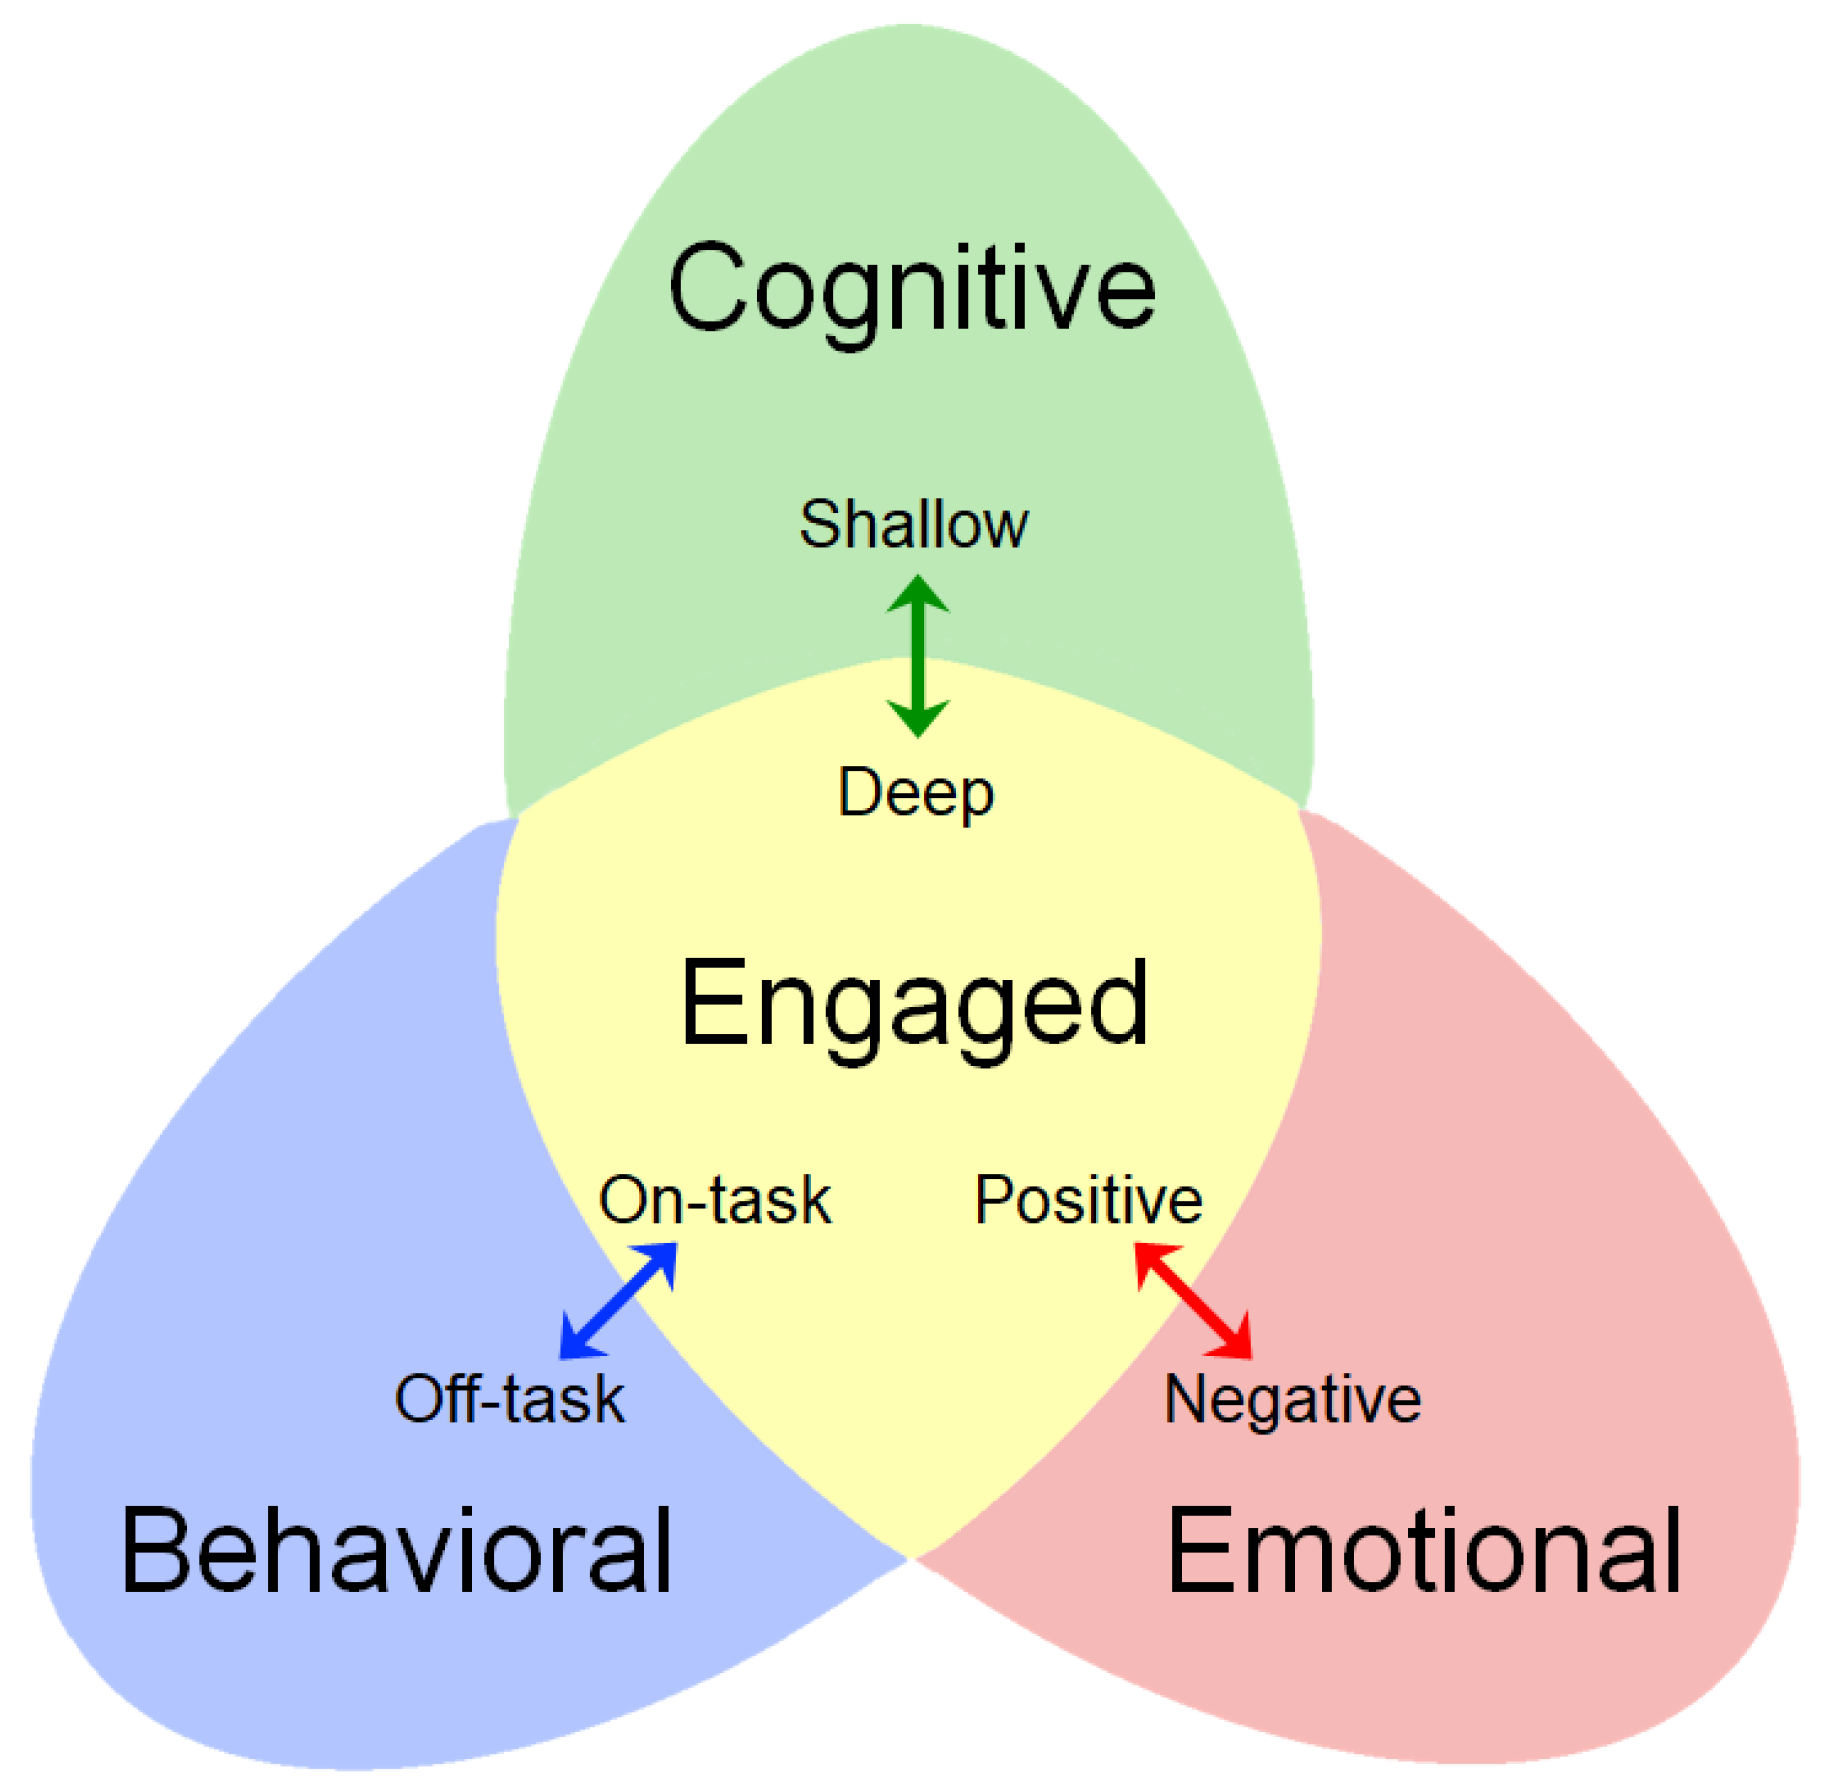
| TYPE OF ENGAGMENT | COGNITIVE (C) | BEHAVIORAL (B) | EMOTIONAL (E) |
|---|---|---|---|
| Psychological Construct | Levels of processing [24,25] | Targets of attention [26,28] | Affective context [27] |
| Engaged State | Deep processing | On-task attention | Positive affect |
| Disengaged State | Shallow processing | Off-task attention | Negative affect |
| External Operationalization | Not directly observable | Eye gaze, head pose, etc | Facial Action Coding System |
| Feature | Engagement Component | Motivation |
|---|---|---|
| Body gestures and postures | Behavioral and Emotion | |
| Hand movement | Behavioral and Emotion | |
| Head movement and eye gaze | Behavioral |
|
| Facial Action Units (FACS) | Emotion | |
| Mood | Emotion |
|
| Heart rate | Emotion | |
| Graded homework and weekly exams | Cognitive |
|
| Research Group | Learning Context | Information Source | Affective States | Annotators | Dataset |
|---|---|---|---|---|---|
| MIT Media Lab, 2005 [29] | A person Solving puzzles on PC | Camera (head-nod and head-shake, Eye blinks, Mouth activities); Chair (Posture features), OS (screen activity) | high, medium and low interest, bored, and “taking a break” | teachers | 8 children |
| U. of Memphis 2007 [30] | An individual using AutoTutor system on PC | Camera (Manual Facial Action Coding) AUs 1, 2, 4, 7, & 14. | boredom, confusion, frustration, delight, and neutral | Self, peer, and 2 judges | 28 undergraduate students |
| U. Massachusetts Amherst, Arizona State Emotion Sensors, 2009 [54] | An Individual using a multimedia adaptive tutoring system for geometry on PC | Camera (facial expression), Chair (Posture features), and mouse (increasing amounts of pressure), Wrist (skin conductance) | Confident, Frustrated, Excited, and Interested | Pretest, posttest, and a survey | 38 HS and 29 female Undergrad students |
| NC State - 2013 [32] | An individual using JavaTutor on PC | Kinect (5 most frequently occurring AUS 1, 2, 4, 7, 14.) | Frustration and Learning game | Two FACS coders | 67 undergraduate students |
| UCSD, MP Lab and Dept. of Psychology vsu, 2014 [23] | An Individual using a cognitive skills training software | Camera (Facial image) | Not engaged, Nominally engaged, Engaged, and Very engaged | 7 Labelers | 34 undergraduate students |
| Artificial Intelligence Department, UNED, Spain, 2014 [69] | An Individual solving Math. problems On PC | Camera (facial image); Kinect (video and processed information); OS (participant’s activities) Sensors (physiological signals) Solutions, questionnaires/observer report. | Excited/Unexcited, Concentrated/Distracted, Worried/Unworried, interested/Uninterested | Self-report, Psychoeducational expert | 75 undergraduate |
| Learning Research Center, Pittsburgh Psychology and Education, 2015 [70] | A Finland high school 9th to 11th grade in regular classroom | Student- and teacher-report survey; students’ perceived value, importance, and level of enjoyment with school; scale students’ levels of stress, etc. | Emotional engagement, School burnout, and Depression symptoms | GPA/teachers report | 362 students |
| Notre Dame, Florida State and Columbia, 2016 [67] | An Individual solving Physics problems On PC | Camera (nineteen AUS, head pose, and gross body movement) | Off-task, on-task, delight, boredom, concentration, confusion, frustration. | Baker-Rodrigo, Observation, Method | 137 8th and 9th grade students |
| CVIP lab, University of Louisville (EITL) [5] | E-learning for undergraduate student | Student webCams (33 AU, Head pose, eye gaze) | No Face, Not engaged, Look engaged, Engaged, and Very engaged | Researchers | 13 students |
| Carnegie Mellon University, (Edusense), 2019 [34] | Undergrads regular classroom setting | 12 tripod mounted cameras, Front (Student), Back (Teacher) | Raw Features: Body pose, head pose, smile, mouth open, hand rise, sit vs. stand, student vs. teacher speech (time ratio) | - | 25 students for training and 687 for evaluation |
| Carnegie Mellon University, (Classroom digital Twins), 2021 [71] | Undergrads regular classroom setting | 2 Wall mounted cameras: Front (Student), Back (Teacher) | Raw Features: Head Pose, Gaze point | Controlled experiment, (marker) | 8 participants |
| CVIP lab, University of Louisville (Our proposed) | Stem classes for undergrads, regular classroom setting | Wall mount Camera(Head pose), Student Processing unit (Head pose, eye gaze and Facial AUs) | Behavioral and Emotional Engagement | Education experts | 10 students |
Disclaimer/Publisher’s Note: The statements, opinions and data contained in all publications are solely those of the individual author(s) and contributor(s) and not of MDPI and/or the editor(s). MDPI and/or the editor(s) disclaim responsibility for any injury to people or property resulting from any ideas, methods, instructions or products referred to in the content. |
© 2023 by the authors. Licensee MDPI, Basel, Switzerland. This article is an open access article distributed under the terms and conditions of the Creative Commons Attribution (CC BY) license (https://creativecommons.org/licenses/by/4.0/).
Share and Cite
Alkabbany, I.; Ali, A.M.; Foreman, C.; Tretter, T.; Hindy, N.; Farag, A. An Experimental Platform for Real-Time Students Engagement Measurements from Video in STEM Classrooms. Sensors 2023, 23, 1614. https://doi.org/10.3390/s23031614
Alkabbany I, Ali AM, Foreman C, Tretter T, Hindy N, Farag A. An Experimental Platform for Real-Time Students Engagement Measurements from Video in STEM Classrooms. Sensors. 2023; 23(3):1614. https://doi.org/10.3390/s23031614
Chicago/Turabian StyleAlkabbany, Islam, Asem M. Ali, Chris Foreman, Thomas Tretter, Nicholas Hindy, and Aly Farag. 2023. "An Experimental Platform for Real-Time Students Engagement Measurements from Video in STEM Classrooms" Sensors 23, no. 3: 1614. https://doi.org/10.3390/s23031614