Article

Automatic Thinning Detection through Image Segmentation Using Equivalent Array-Type Lamp-Based Lock-in Thermography

1
Department of Future Convergence Engineering, Kongju National University, 1223-24 Cheonan-Daero, Seobuk-gu, Cheonan-si 31080, Republic of Korea
2
Eco-Sustainable Energy Research Institute, Kongju National University, 1223-24 Cheonan-Daero, Seobuk-gu, Cheonan-si 31080, Republic of Korea
3
enesG, 8, Techno 10-ro, Yuseong-gu, Daejeon 34026, Republic of Korea
*
Author to whom correspondence should be addressed.
Sensors 2023, 23(3), 1281; https://doi.org/10.3390/s23031281
Submission received: 31 December 2022 / Revised: 19 January 2023 / Accepted: 20 January 2023 / Published: 22 January 2023
(This article belongs to the Special Issue Non-destructive Inspection with Sensors)

Abstract

:
Among the non-destructive testing (NDT) techniques, infrared thermography (IRT) is an attractive and highly reliable technology that can measure the thermal response of a wide area in real-time. In this study, thinning defects in S275 specimens were detected using lock-in thermography (LIT). After acquiring phase and amplitude images using four-point signal processing, the optimal excitation frequency was calculated. After segmentation was performed on each defect area, binarization was performed using the Otsu algorithm. For automated detection, the boundary tracking algorithm was used. The number of pixels was calculated and the detectability using RMSE was evaluated. Clarification of defective objects using image segmentation detectability evaluation technique using RMSE was presented.

1. Introduction

Defects (discontinuity points) in metal structures are caused by various reasons, typically corrosion. For example, in the containment liner plant (CLP), there is a case in which voids are formed inside the concrete due to corrosion [1,2,3]. In addition, if corrosion occurs in structures such as bridges or plants, it may eventually lead to fracture and cause great damage. Therefore, efficient inspection techniques and condition monitoring techniques are required in real-time in order to minimize damage.
The process by which corrosion occurs is as follows. When structures are exposed to extreme environments, corrosion processes occur on their surfaces. When corrosion continues and time passes, local thinning occurs. As a result, it leads to fractures and causes significant damage. Corrosion present on the surface can be checked with the naked eye, so that it can be inspected simply by visual testing (VT) [4]. Areas that cannot be confirmed by VT are difficult, so it is possible to inspect defects that exist inside or on the back side by using non-destructive testing (NDT) techniques.
There are many types of NDT, and representatively, ultrasonic testing (UT) and radiography testing (RT) are used in many fields [5,6]. UT can precisely measure the inside thickness and enables fast local inspection, but the inspection area is small, so the overall inspection takes a long time [7,8]. RT has disadvantages that are harmful to the body [9]. In addition, eddy current testing (ECT), leak testing (LT), and microwave testing (MT) are being utilized.
In this study, the infrared thermography (IRT) technique was applied among NDT techniques that can efficiently inspect a large area in real-time [10,11,12]. IRT is a technique that uses an infrared camera to detect infrared energy naturally emitted by objects, convert it to temperature, and output a temperature distribution image in real-time [13,14,15]. It is possible to inspect a wide area in real-time and acquire or analyze high-level quantitative data [16].
There are many research cases on corrosion detection using the IRT technique. Doshvarpassand analyzed the entire literature on corrosion defect characteristics using an active IRT technique [17]. Kobayashi analyzed corrosion loss of reinforced concrete according to heating time using induction heating (IH) and IRT [18]. Cadelano compared and analyzed the SNR according to the heating and cooling stages using PCA and PPT data processing techniques [19]. R. Shrestha conducted a study to evaluate the size and depth of defects on the rear surface using the LIT technique [20].
A study on the detection of automatic thinning defects in the S275 specimen was conducted using the lock-in thermography (LIT) technique among the IRT method. Phase and amplitude images were acquired using the four-point signal process of LIT, and the optimal frequency was evaluated by calculating the SNR. Binarization of the segmented image was performed using the Otsu algorithm, and pixel noise was removed by performing the morphology operation. Automatic defect detection was performed using the boundary tracking algorithm, and detectability was evaluated using RMSE. In this study, an array-type halogen lamp device was developed to provide a uniform heat source. In addition, a clear object detection and detectability evaluation process technique through image segmentation was presented.

2. Theory

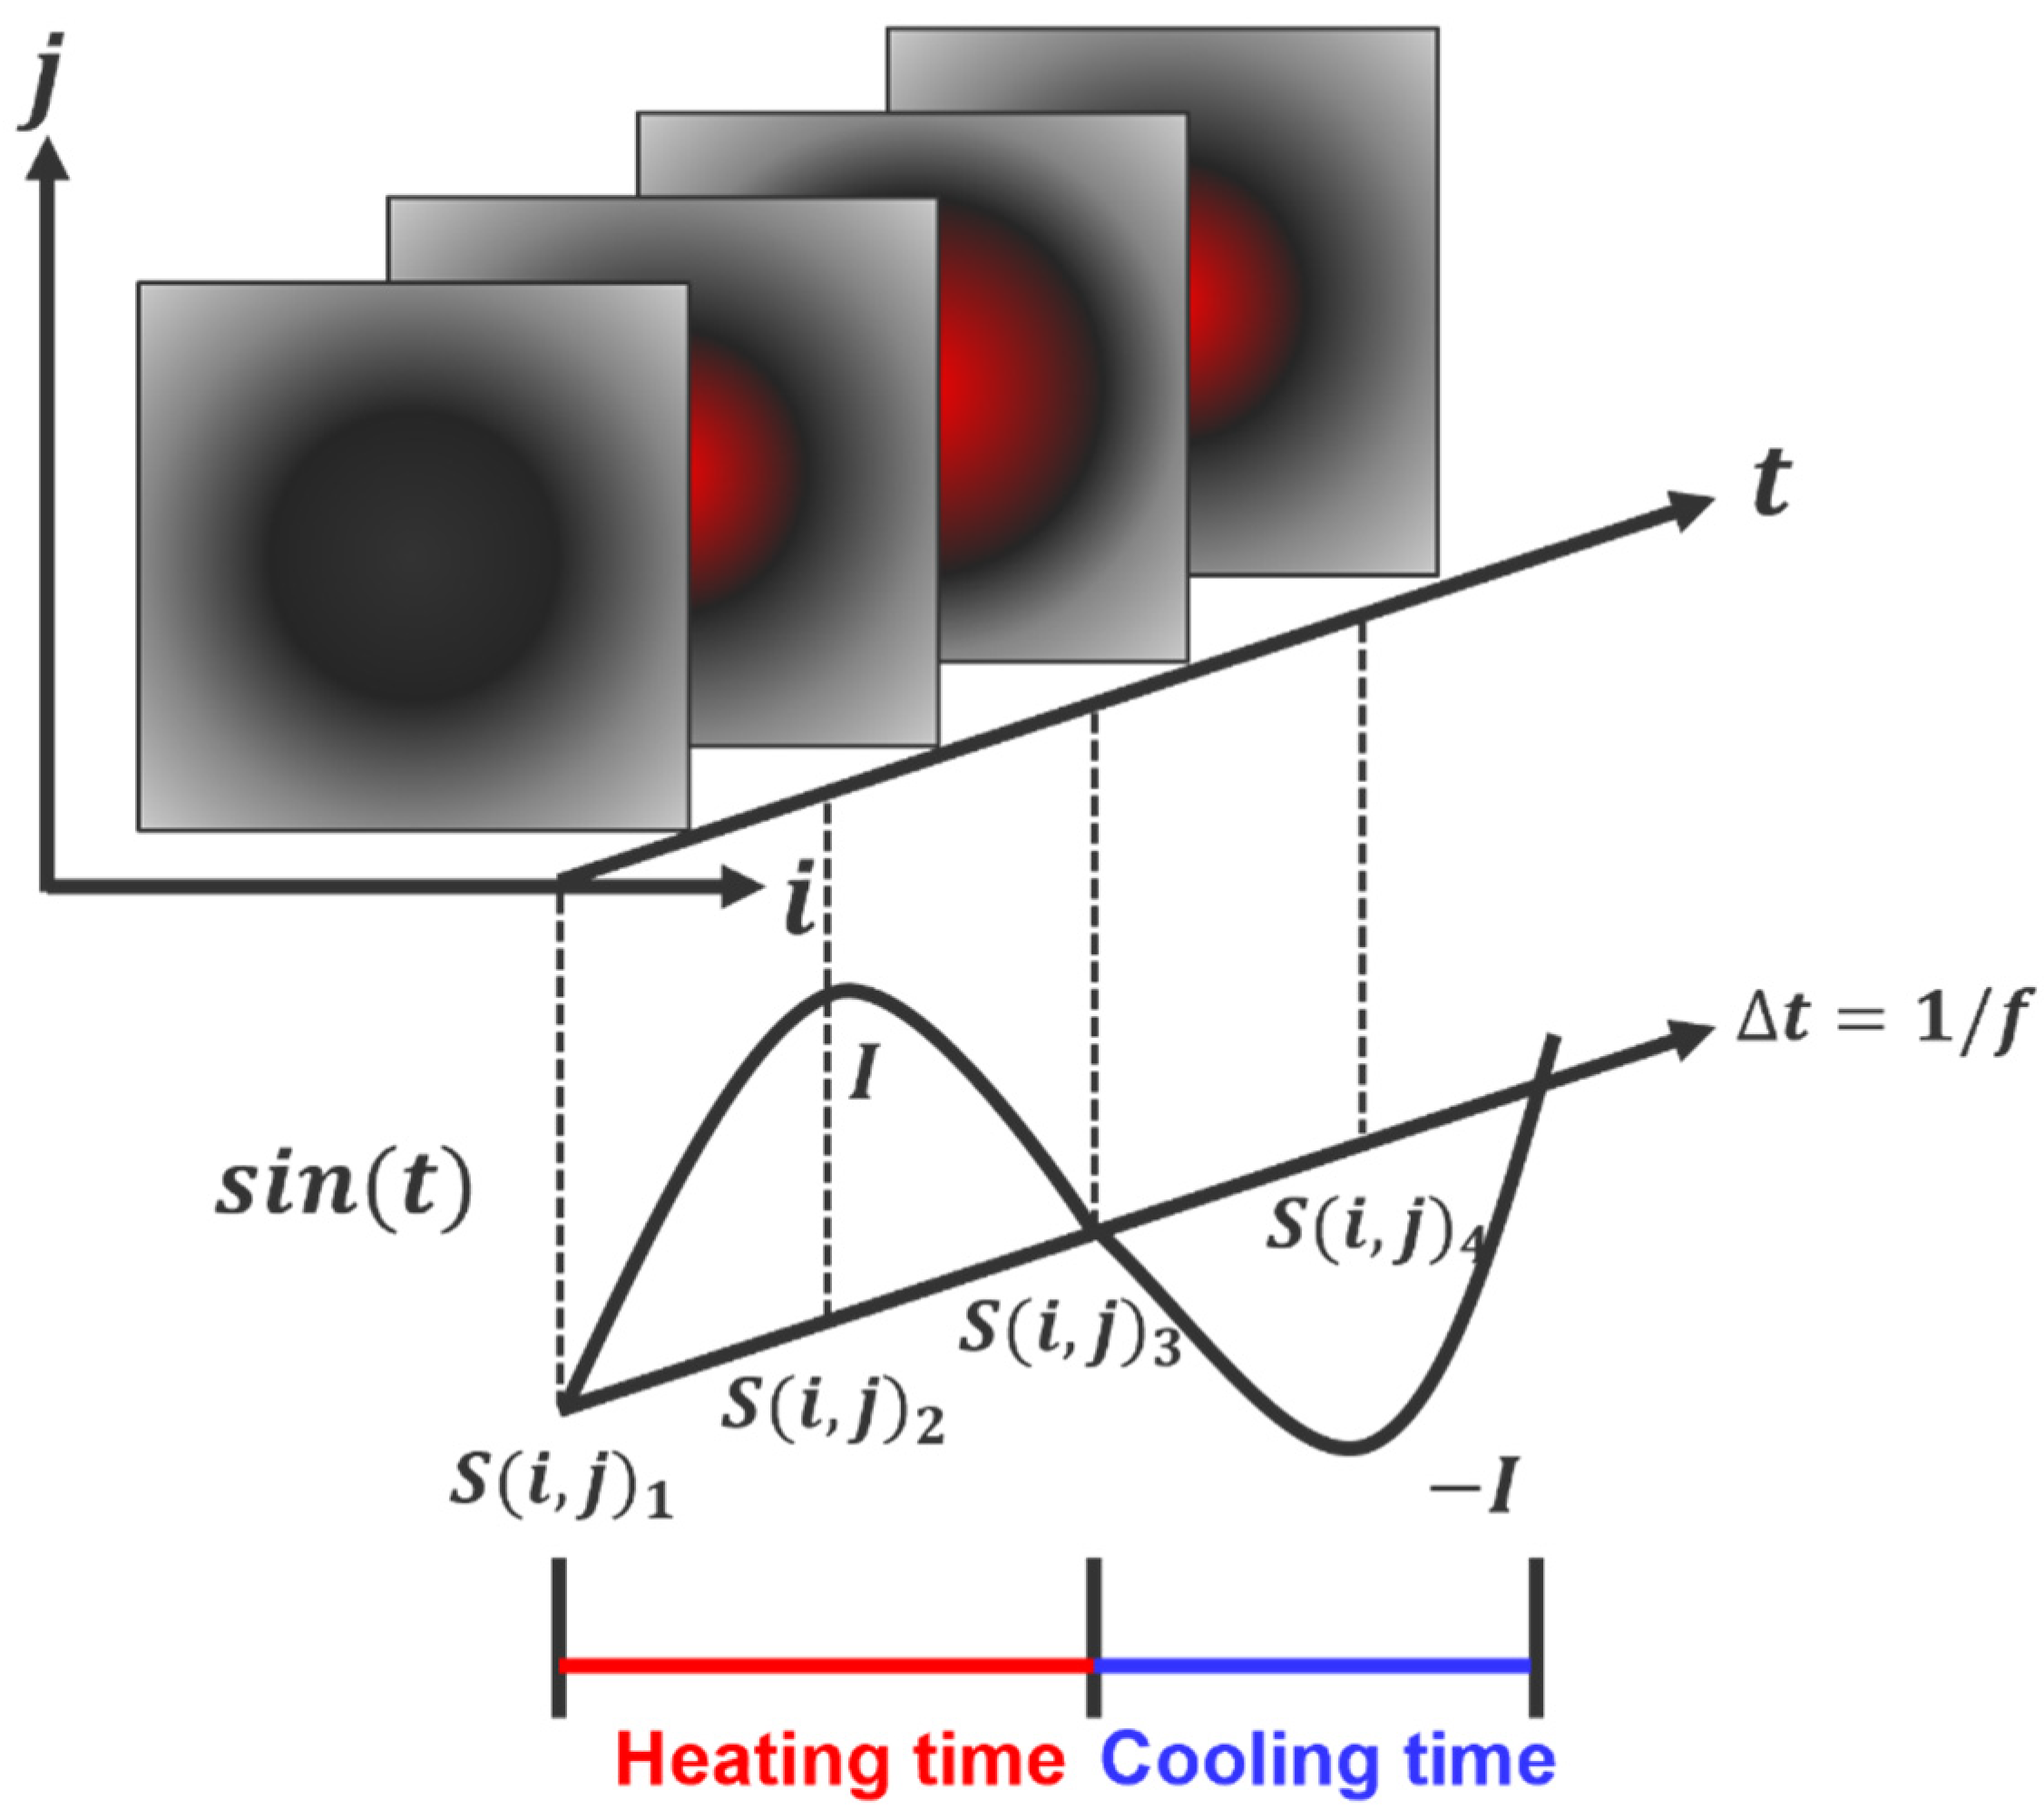
2.1. Theory of Four-Point Signal Process

The LIT is a technique in which a heat source in the form of a harmonic function is incident on an object, and a response signal generated at this time is processed to obtain changes in phase and amplitude [21,22,23]. When the heat source energy reaches the object’s surface, it is absorbed, and the phase shifts. When the energy reaches an area within an object whose thermophysical properties are non-uniform, the incident energy is partially reflected. The reflected energy interferes with the energy incident on the surface of the object, causing an interference pattern of the local surface temperature vibrating at the same frequency as the heat wave. For a planar plate, a 2D temperature field with a heat wave could be expressed as
T t = k ρ c p 2 T x 2
where T is the temperature, t is the time, k is the thermal conductivity coefficient, ρ is the density, c p is the specific heat, and x is the distance in the direction of heat flow. Equation (1) heated by the harmonic function can be expressed as follows.
T ( x , t ) = T 0 e x μ cos ( ω t x μ )
μ = 2 α ω = α π f
α = k ρ c p
where T 0 is the initial temperature generated by the heat source, ω is the modulation excitation frequency, μ is the penetration depth, α is the thermal diffusion coefficient, and f is the frequency.
In the LIT technique, a heat source in the form of an external sine wave is incident on the plate surface, and the response temperature signal uses an infrared system to record 2D image data in real-time. The four-point method is a process used to convert phase and amplitude data. Figure 1 shows the principle of the four-point method processing. When there are four constant distance temperature data S 1 , S 2 , S 3 , and S 4 , the phase ( ) and amplitude ( A ) are as follows [24,25].
= tan 1 ( S 1 S 3 S 2 S 4 )
A = ( S 1 S 3 ) 2 + ( S 2 S 4 ) 2
The reflected heat wave is determined by the phase, amplitude, and modulated frequency. The principle of defect detection is based on the fact that the defective area has a phase delay with respect to the sound area. The phase delay is the result of the different thermal properties of the defective area and the sound area of the material. When the four-point signal processing is performed, the defect is detected more clearly. One of the main reasons the defective area is well defected is that the phase image is less susceptible to non-uniform heating, surface emissivity change, or environmental reflection than the raw thermal image. The excitation frequency of a heat wave has a direct correlation with the phase delay. In order to generate enough visible phase delay, an appropriate excitation frequency must be selected. In other words, using a low frequency with a long wavelength can detect deep defects, and using a high frequency with a short wavelength can detect shallow defects.

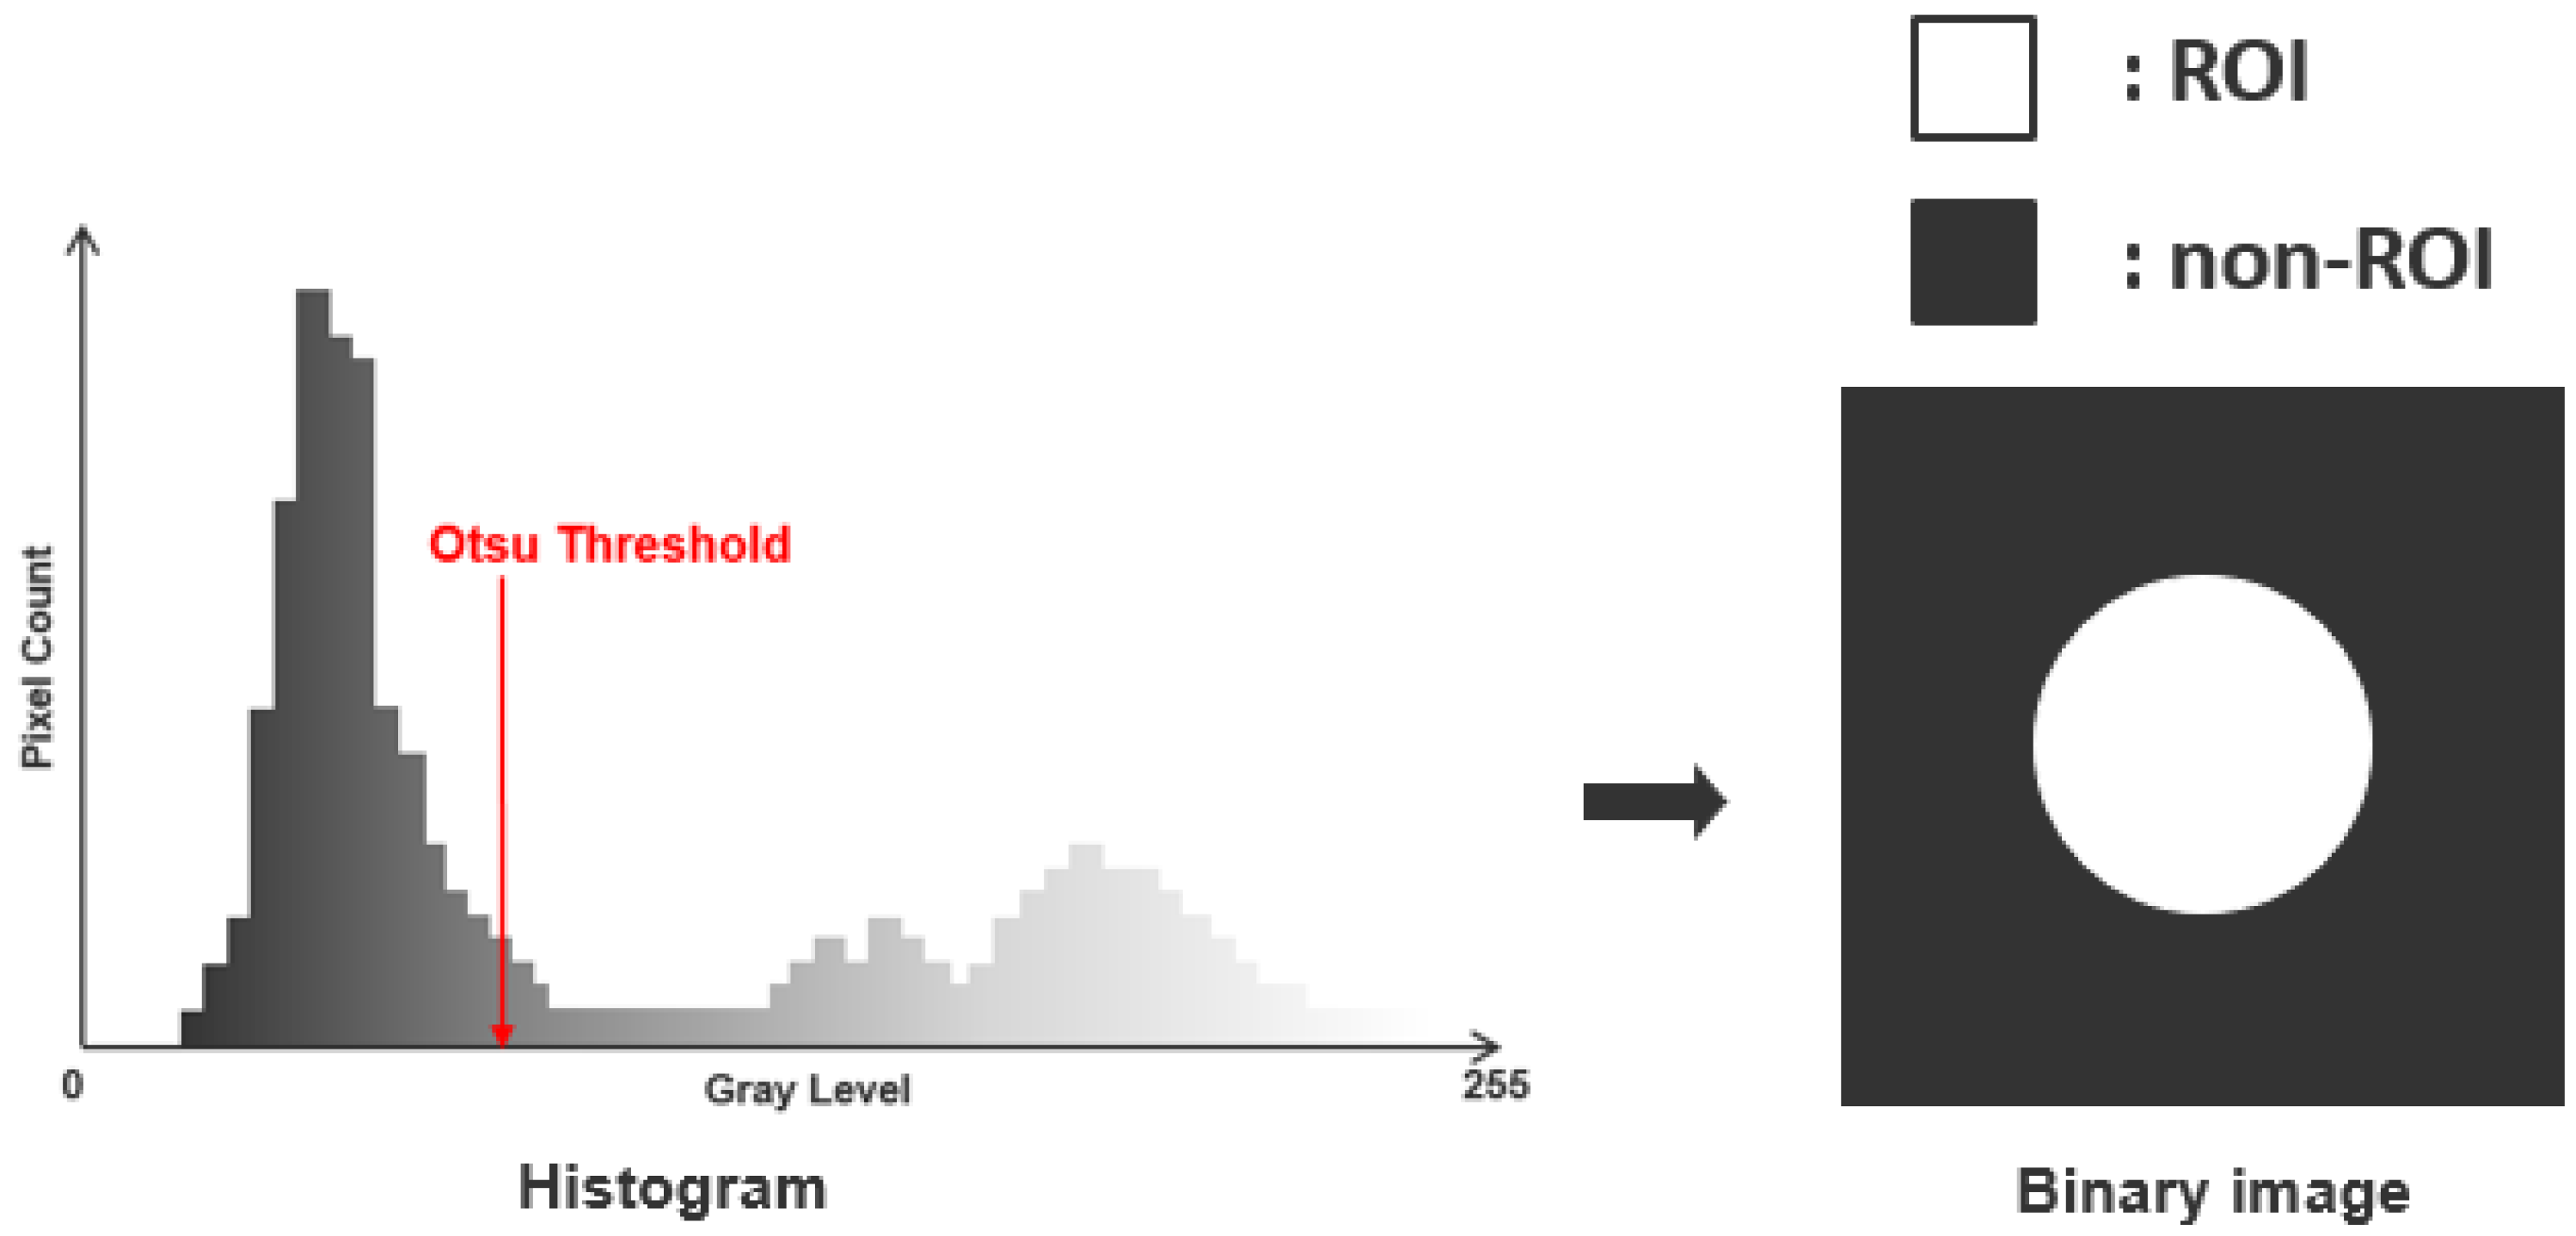
2.2. Binary Process Using Otsu Algorithm

The Otsu algorithm is a technique that uses a histogram of a gray-level scale to calculate the optimal threshold for classifying contrast values as 0 and 1 [26,27,28]. In the gray-scale range (0−L), 0 to k are classified as intensity value 0, and k + 1 to L are classified as intensity value 1. Figure 2 shows the process of acquiring a binary image using the Otsu algorithm. Binarized images have the advantage of being able to clearly recognize defective objects.
In order to classify intensity values, the optimal threshold value must be calculated [29,30]. If it is an M × N image with L intensity levels such as 0, 1, 2, …, L−1, pixels with intensity values within [0, k] are classified as class 1, and intensity values within [k + 1, L + 1] are classified as class 2. The probability that a pixel is classified into class 1 or 2 is as follows.
P 1 ( k ) = i = 0 k p i
P 2 ( k ) = 1 P 1 ( k )
The average intensity values of pixels classified into contrast values 0 and 1 are as follows.
m 1 ( k ) = 1 P 1 ( k ) i = 0 k iP i
m 2 ( k ) = 1 P 2 ( k ) i = k + 1 L 1 iP i
There are mean intensity values up to the k level, which of all images is
m G = P 1 m 1 + P 2 m 2
In order to calculate the optimal threshold value, the Otsu algorithm should find the maximum variance. The equation of between-class variance is as follows.
σ b 2 = { ( m G P 1 m ( k ) } 2 P 1 ( 1 P 1 )
Although there are many types of algorithms or functions capable of performing binarization processing, the Otsu algorithm has the advantage of being able to perform binarization processing in a fast time by calculating a threshold value in real-time.

3. Experimental Setup
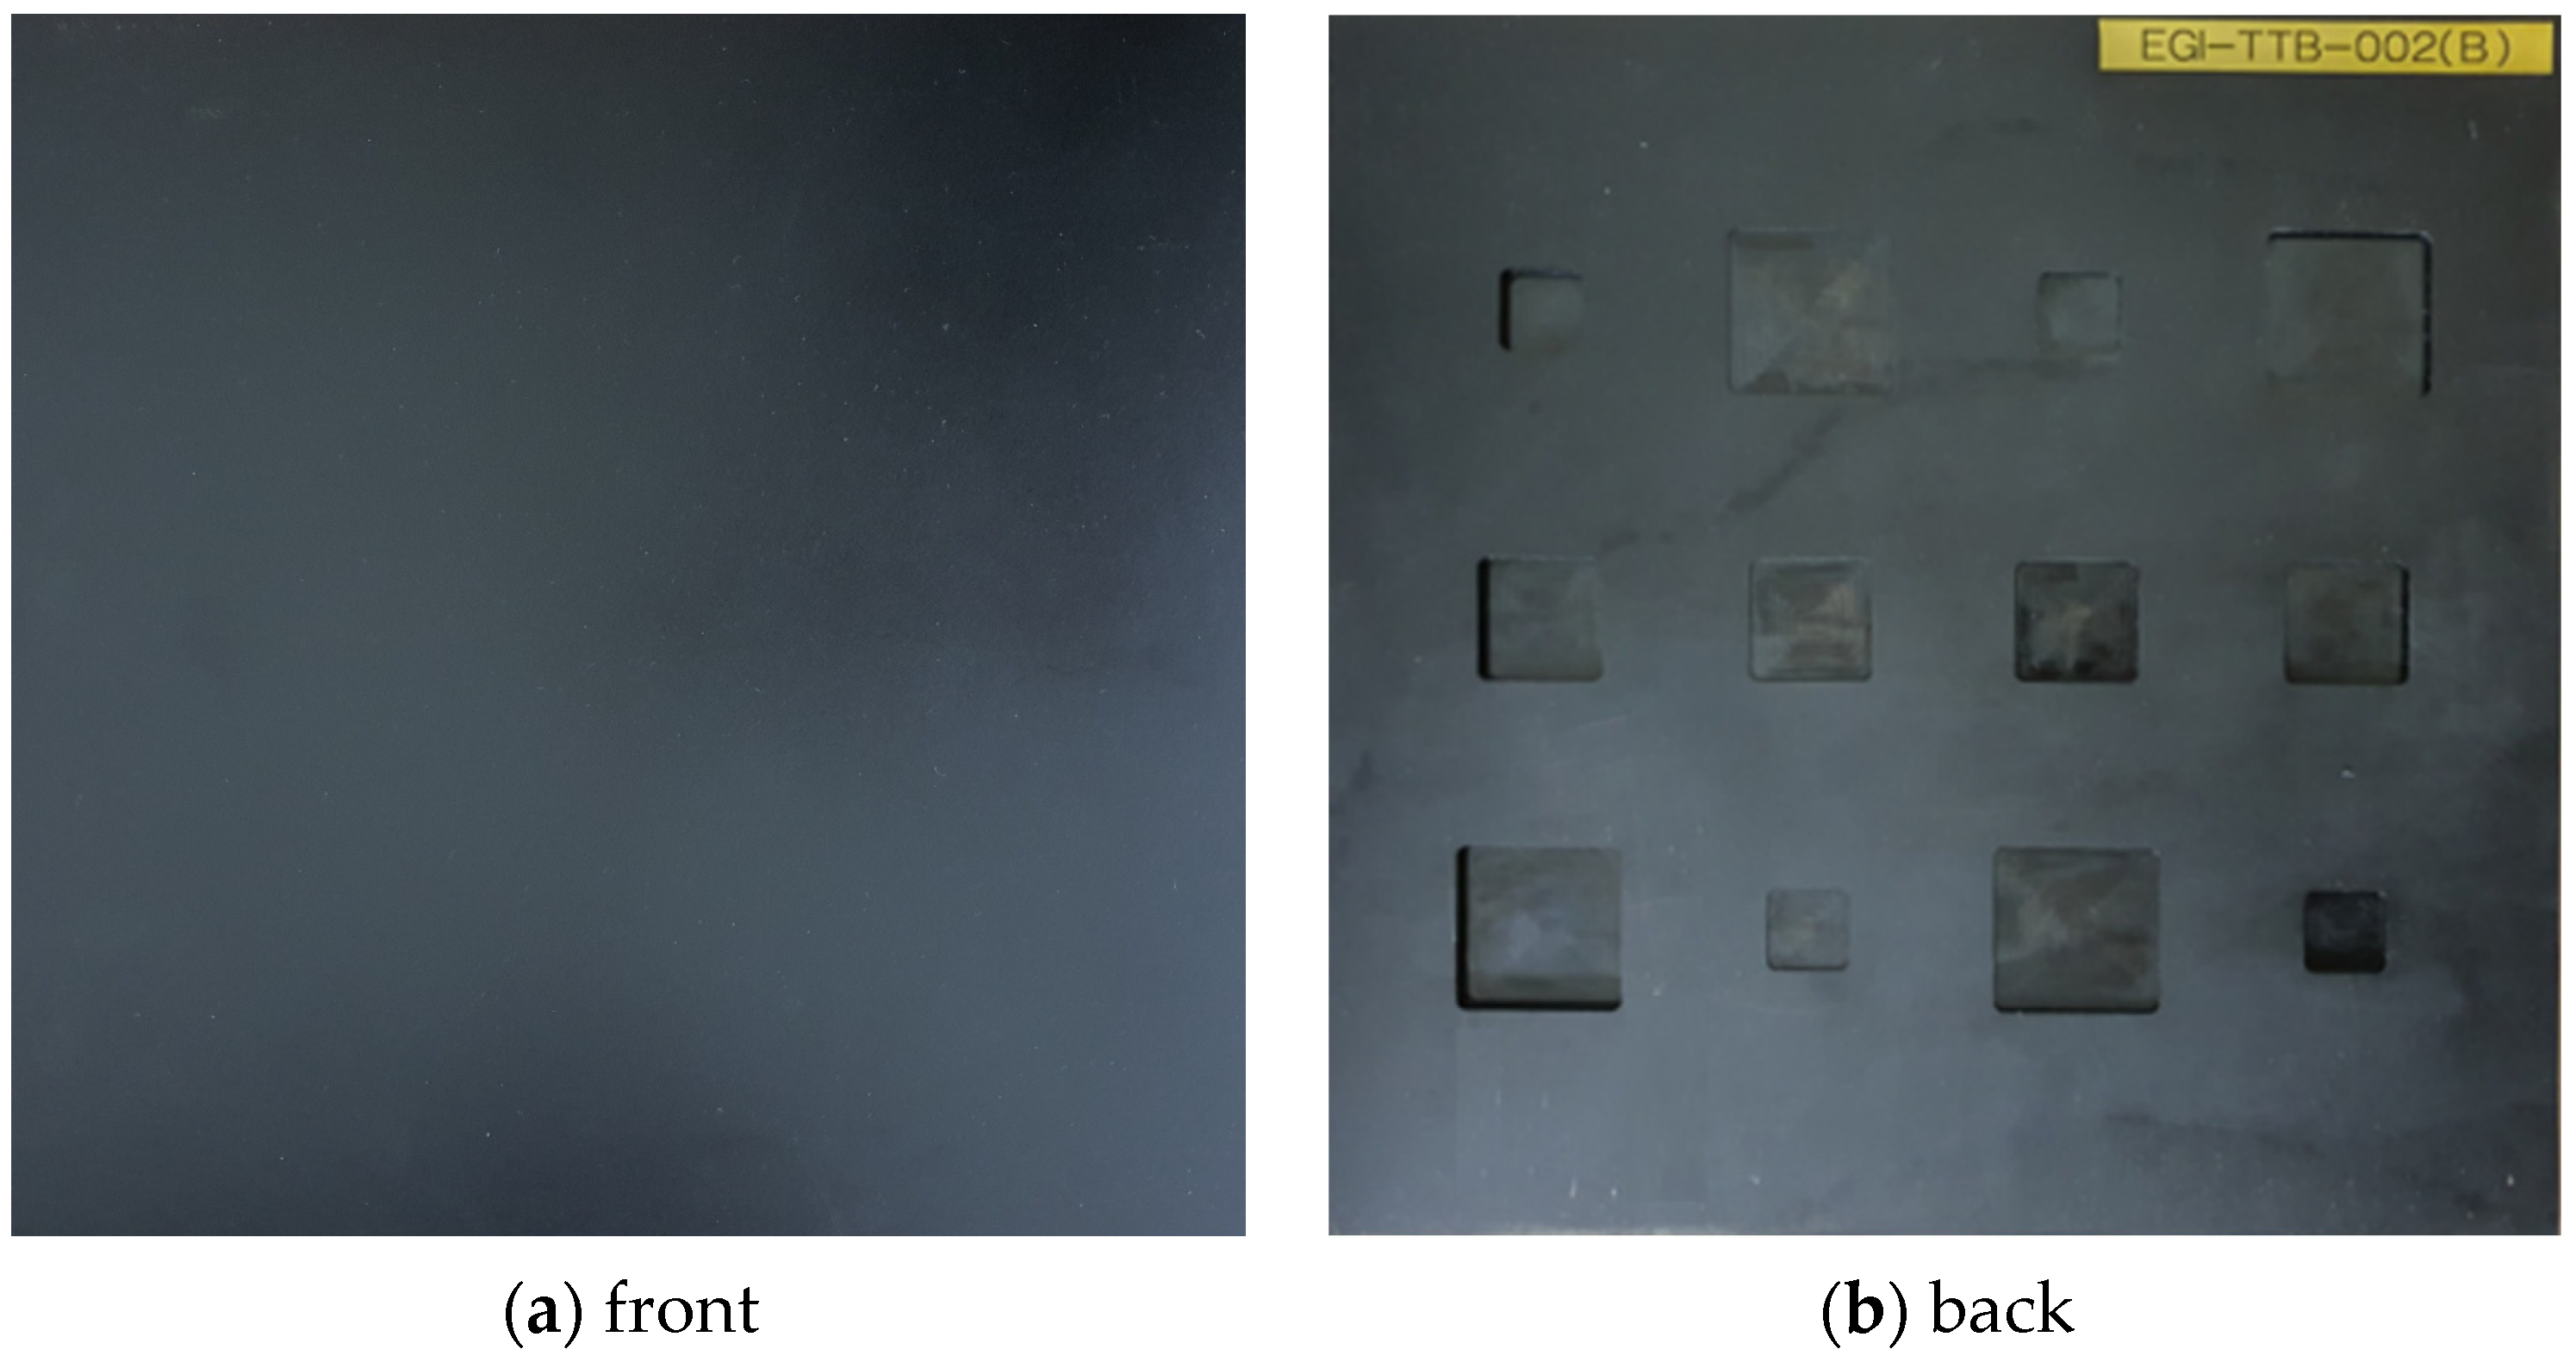
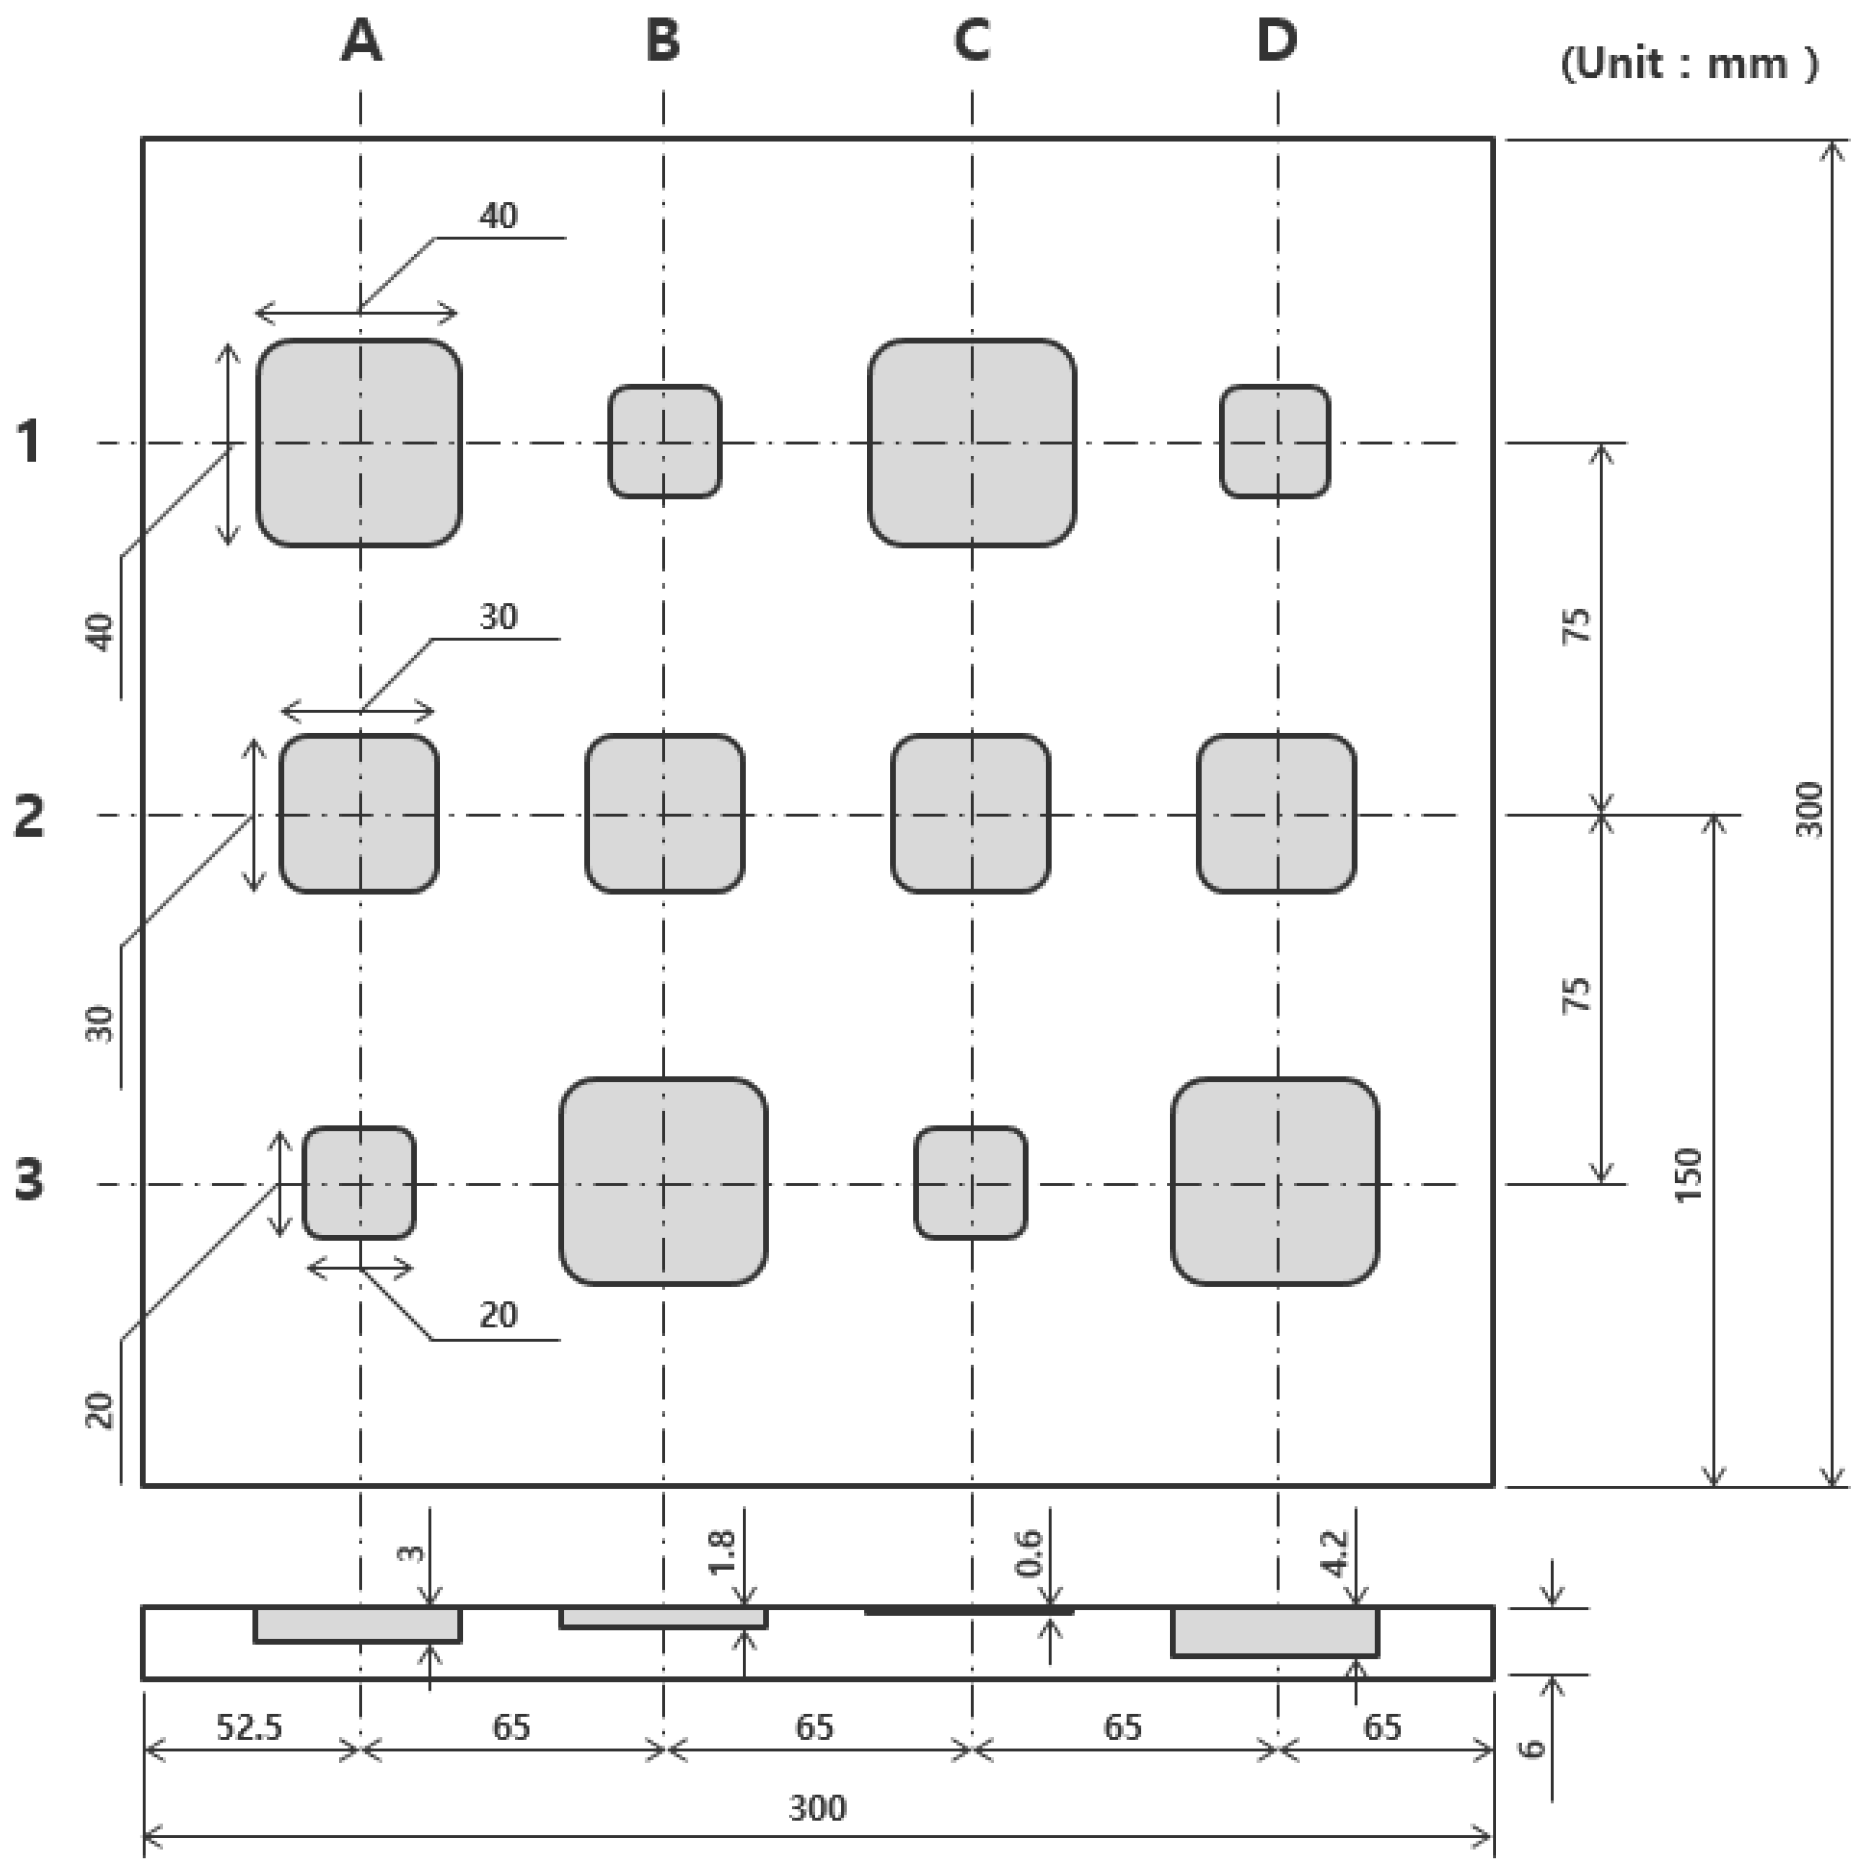
3.1. S275 Specimen

The material of the specimen used in this study is S275, and Figure 3 shows the front and back of the specimen. The front side of the specimen was coated with KRYLON’s black paint to maintain an emissivity of 0.95 or more. Figure 4 shows the dimensions of the S275 specimen. There are a total of 12 artificial thinning defects, and the depth of the column axis is the same. The thinning depth consisted of 10%, 30%, 50%, and 70% of the total thickness. There are a total of 12 thinning defects, and it consists of a regular arrangement. The size of the specimen is 300 × 300 mm, and the thickness is 6 mm. The size of the defect is 40 × 40 mm, 30 × 30 mm, and 20 × 20 mm. Table 1 shows the properties of S275 material.

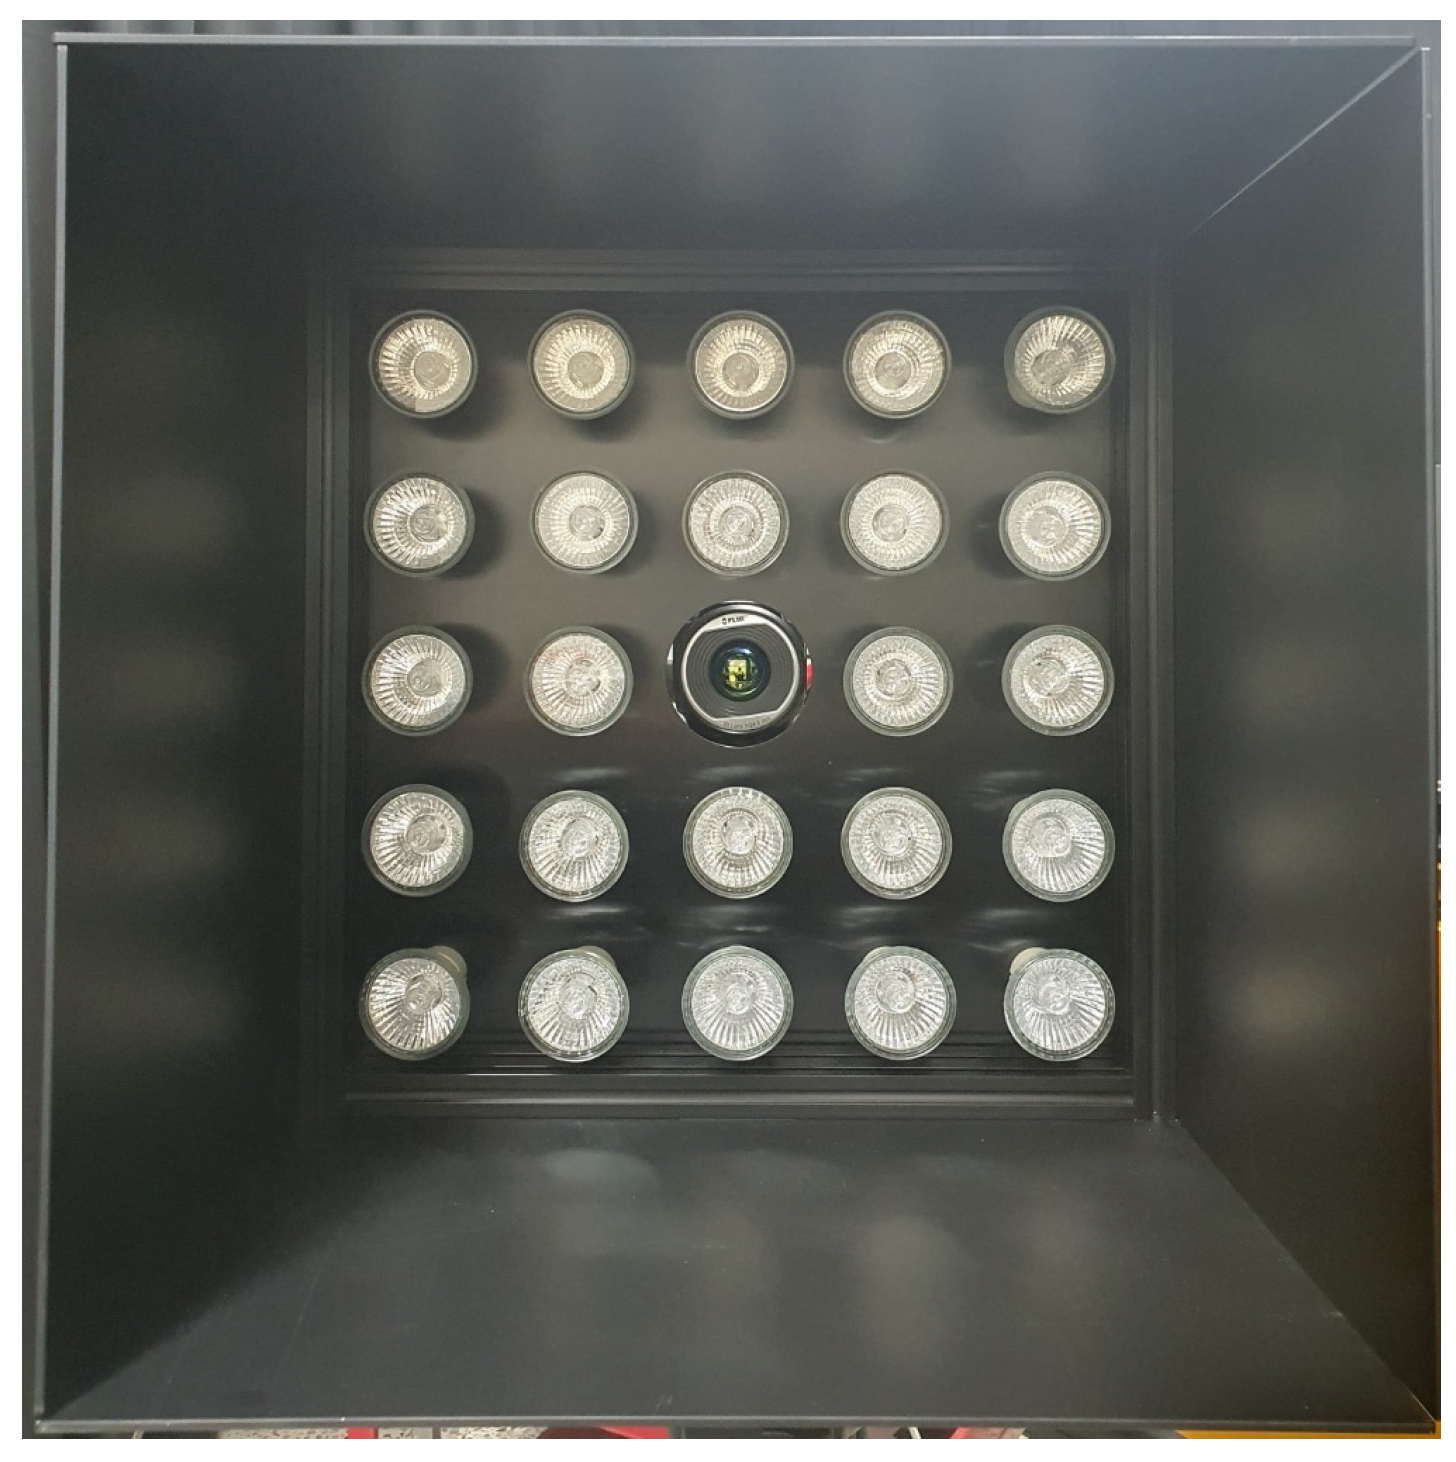
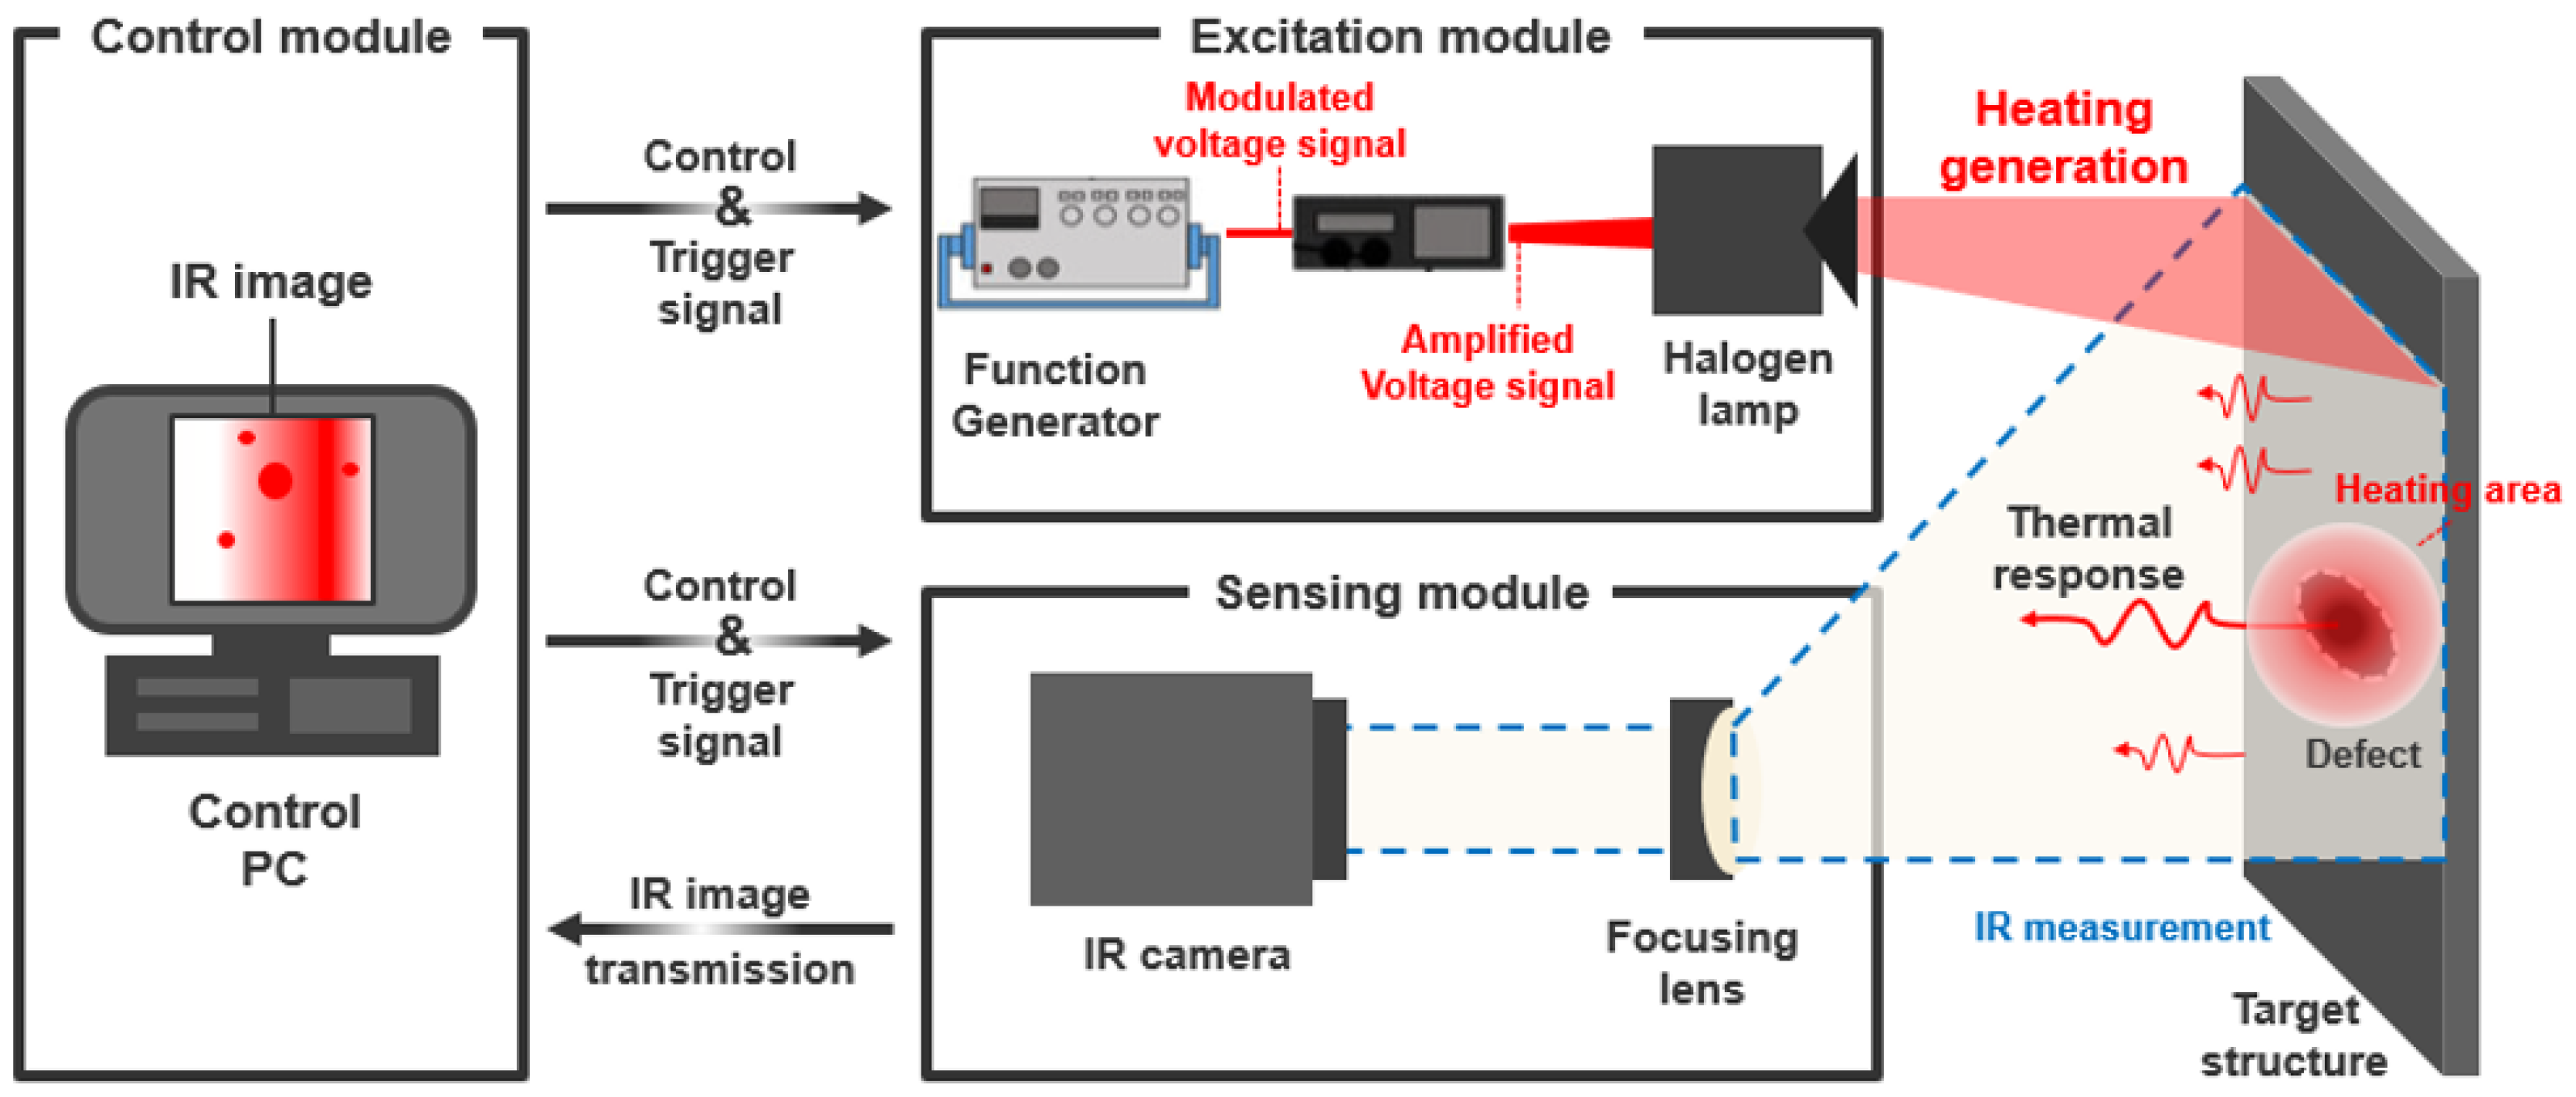
3.2. Experimental Setup of LIT System

In this study, an array-type halogen lamp device was developed to supply a uniform heat source to the specimen. Figure 5 shows an array type halogen lamp. It is composed of lamps in a 5 × 5 arrangement, and a cover plate is additionally installed to minimize the influence of the surrounding environment. An infrared camera is located in the center of the array of lamps. The maximum output was 1.2 kW, and the distance between the specimen and the lamp was placed at 500 mm.
Figure 6 shows the LIT system of this study. The infrared camera is FLIR’s SC645 model (uncooled, 640 × 480 pixels, 7.5~13 μm, 50 Hz) and is used to measure the surface response of the specimen generated by the heat of the halogen lamp. The distance between the specimen and the infrared camera is 500 mm, which is the same as that of the lamp. The function generator (Agilent 33210A, Petaling Jaya, Malaysia) and the power amplifier were utilized to control the halogen lamp. The voltage range of the power amplifier is 0~10 V, and it was set to 10 V in this study. The range of the excitation frequency set in this study is 0.01~0.1 Hz and is increased by 0.01 Hz. The field of view (FOV) of the infrared camera is 25° (H) × 19° (V), and the focal length is 24.6 mm. The thermal response was measured in real-time using the dedicated software FLIR R&D of the infrared camera, and MATLAB software was used to analyze the thermal image.

4. Data Results of LIT

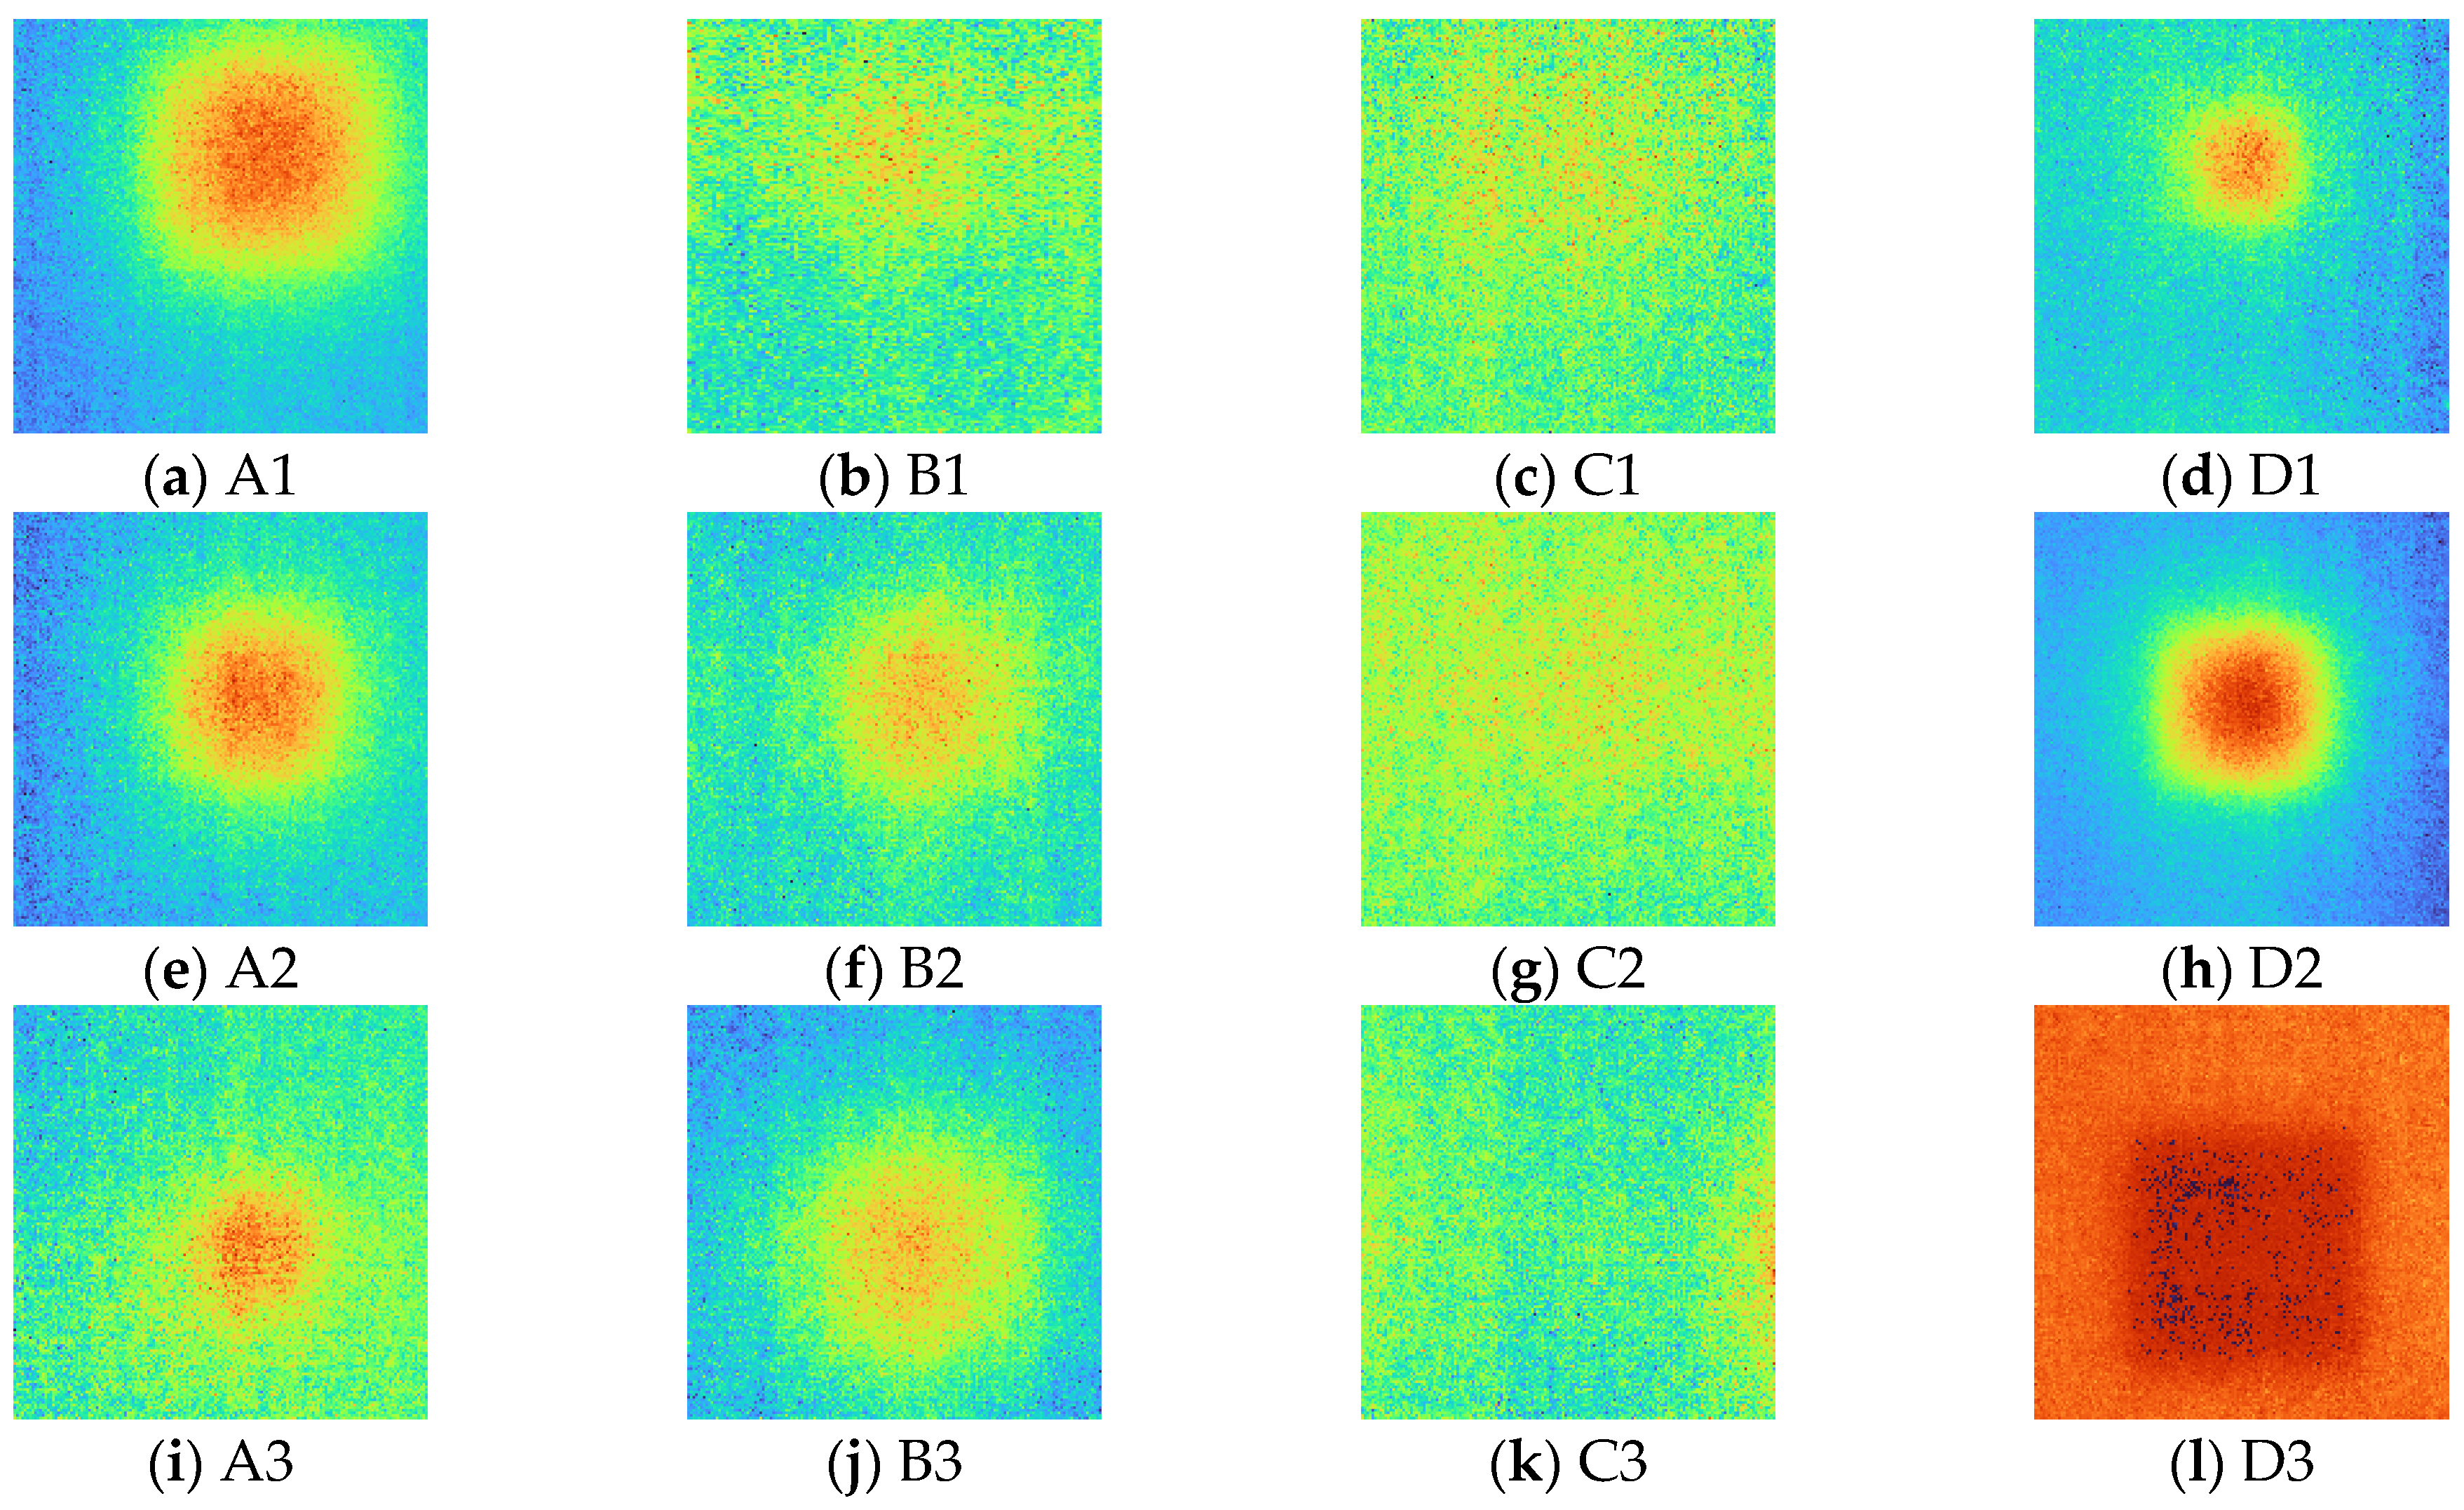
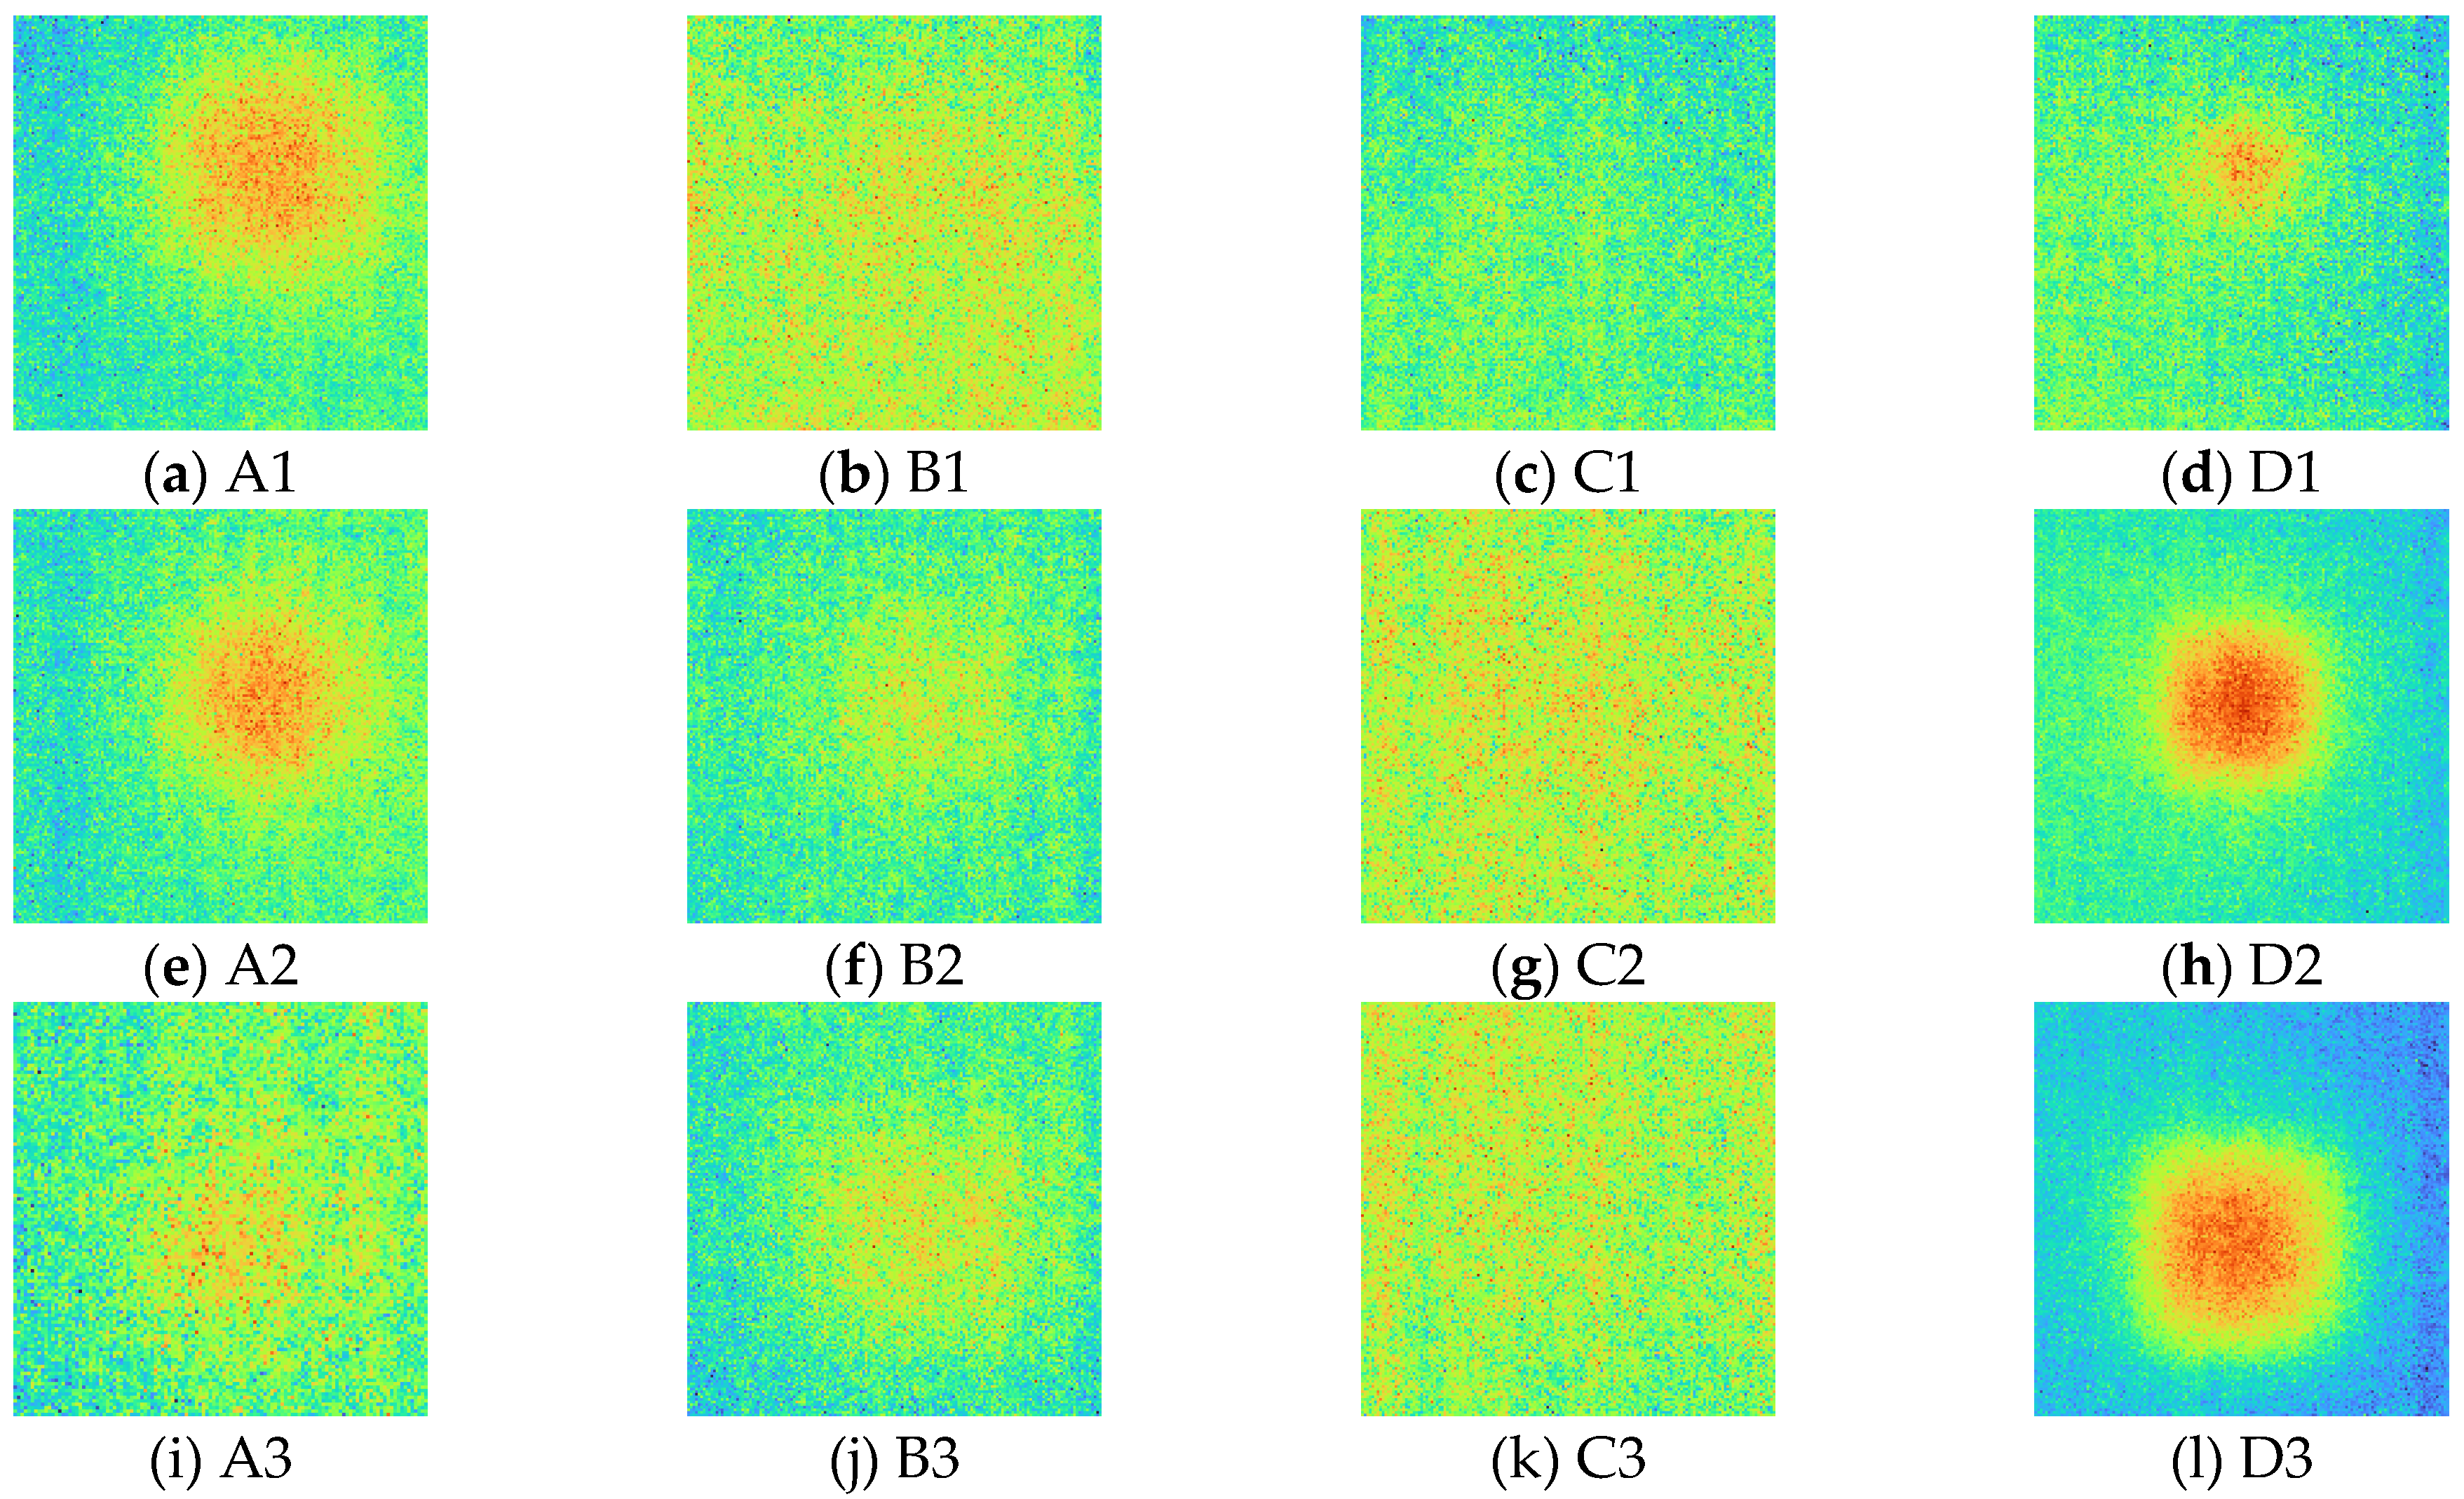
4.1. Images with Four-Point Signal Process

After acquiring 2D thermal images for each excitation frequency range using LIT infrared system equipment, phase and amplitude images were acquired using the four-point signal process. Figure 7 and Figure 8 show phase and amplitude images. In the case of a phase image, more noise can be identified as the frequency increases. In the case of the amplitude image, the lower the frequency, the larger the heat source provided, making it difficult to identify defects.
In order to calculate the optimal frequency in the set excitation frequency range, the SNR of the ROI (5 × 5 pixels) in the D3 defect was calculated, the equation is as follows [31].
SNR = 20 log 10 ( | DROI mean SROI mean | σ )
where DROI mean and SROI mean are the arithmetic mean of all the pixels in the defective area and the sound area, respectively, and σ is the standard deviation of all the pixels in the sound area.
Figure 9 shows the SNR values of phase and amplitude for a range of frequencies. The optimal excitation frequencies for phase and amplitude can be identified as 0.01 Hz and 0.09 Hz, respectively. Referring to Figure 7 and Figure 8, it can be seen that qualitatively, the lower the frequency of the phase and the higher the frequency of the amplitude, the more advantageous it is to identify defects. In addition, it can be confirmed that the phase and amplitude are inversely proportional.

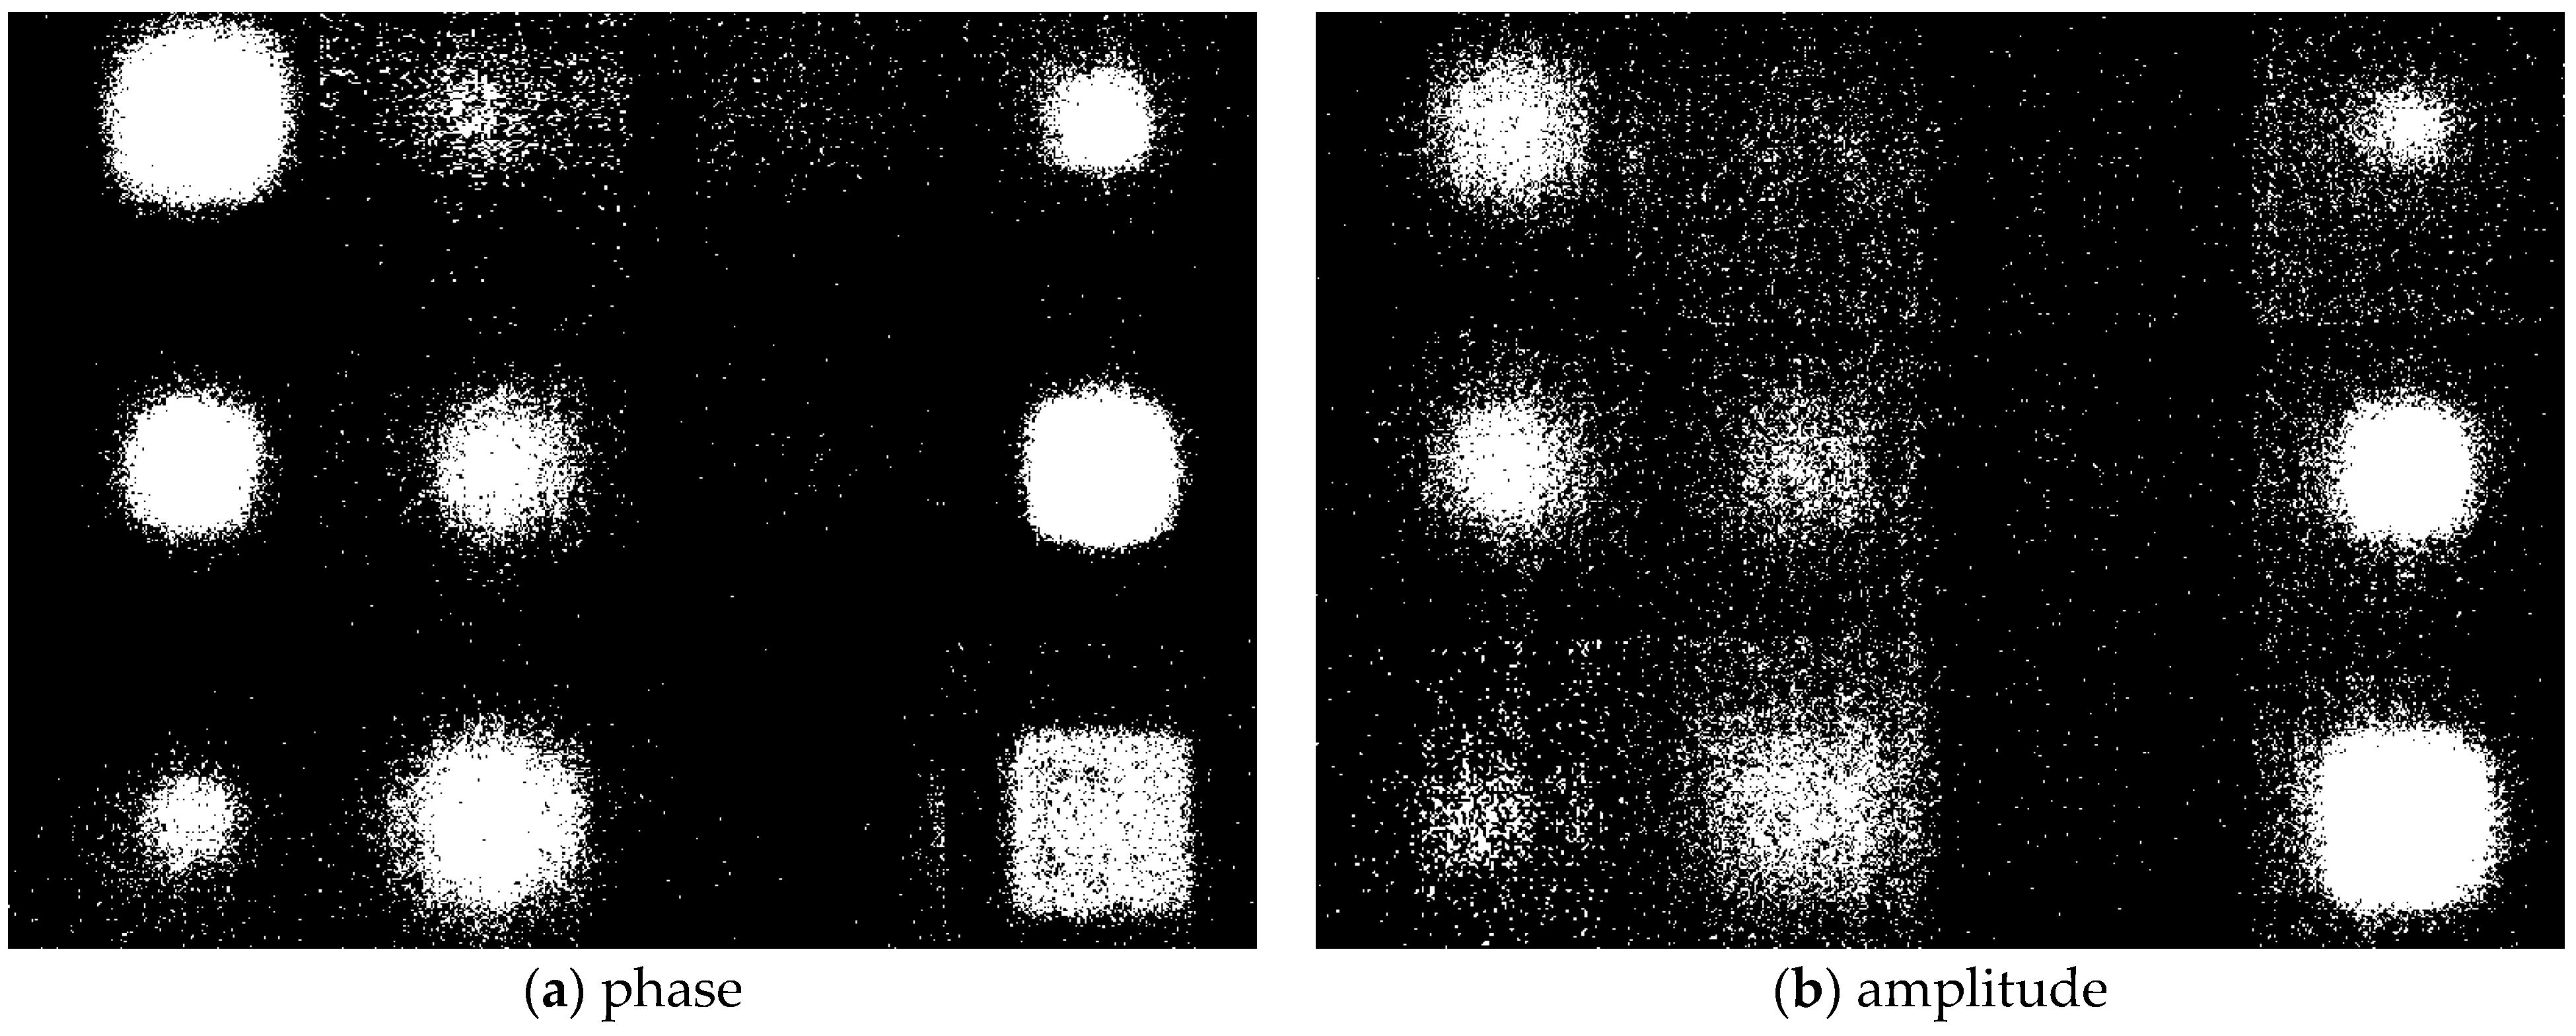
4.2. Data Segmentation for Detection Improvement

In this study, segmentation was performed for all thinning defect before binarization using the Otsu algorithm. Figure 10 and Figure 11 show the segmentation images with phase of 0.01 Hz and amplitude of 0.09 Hz. A total of 12 image segmentations were performed for a total of 12 defect areas. The scale for the segmentation area was set to the same resolution of the infrared camera. In both the phase and amplitude images, defects in column C with a thinning depth of 10% are difficult to visually identify.
The binarization of the segmentation image was performed using the Otsu algorithm, and then they were merged into a single image. Figure 12 shows the merged binary image of phase and amplitude. Binarization was performed after calculating all threshold values for each segmentation image. By converting the RGB scale to the gray-scale, visually clear defect objects can be identified. However, there is still a lot of noise, so it needs to be removed through a post-processing process. Further, like phase and amplitude images, it is difficult to identify defects in the C column, even in the binary image.

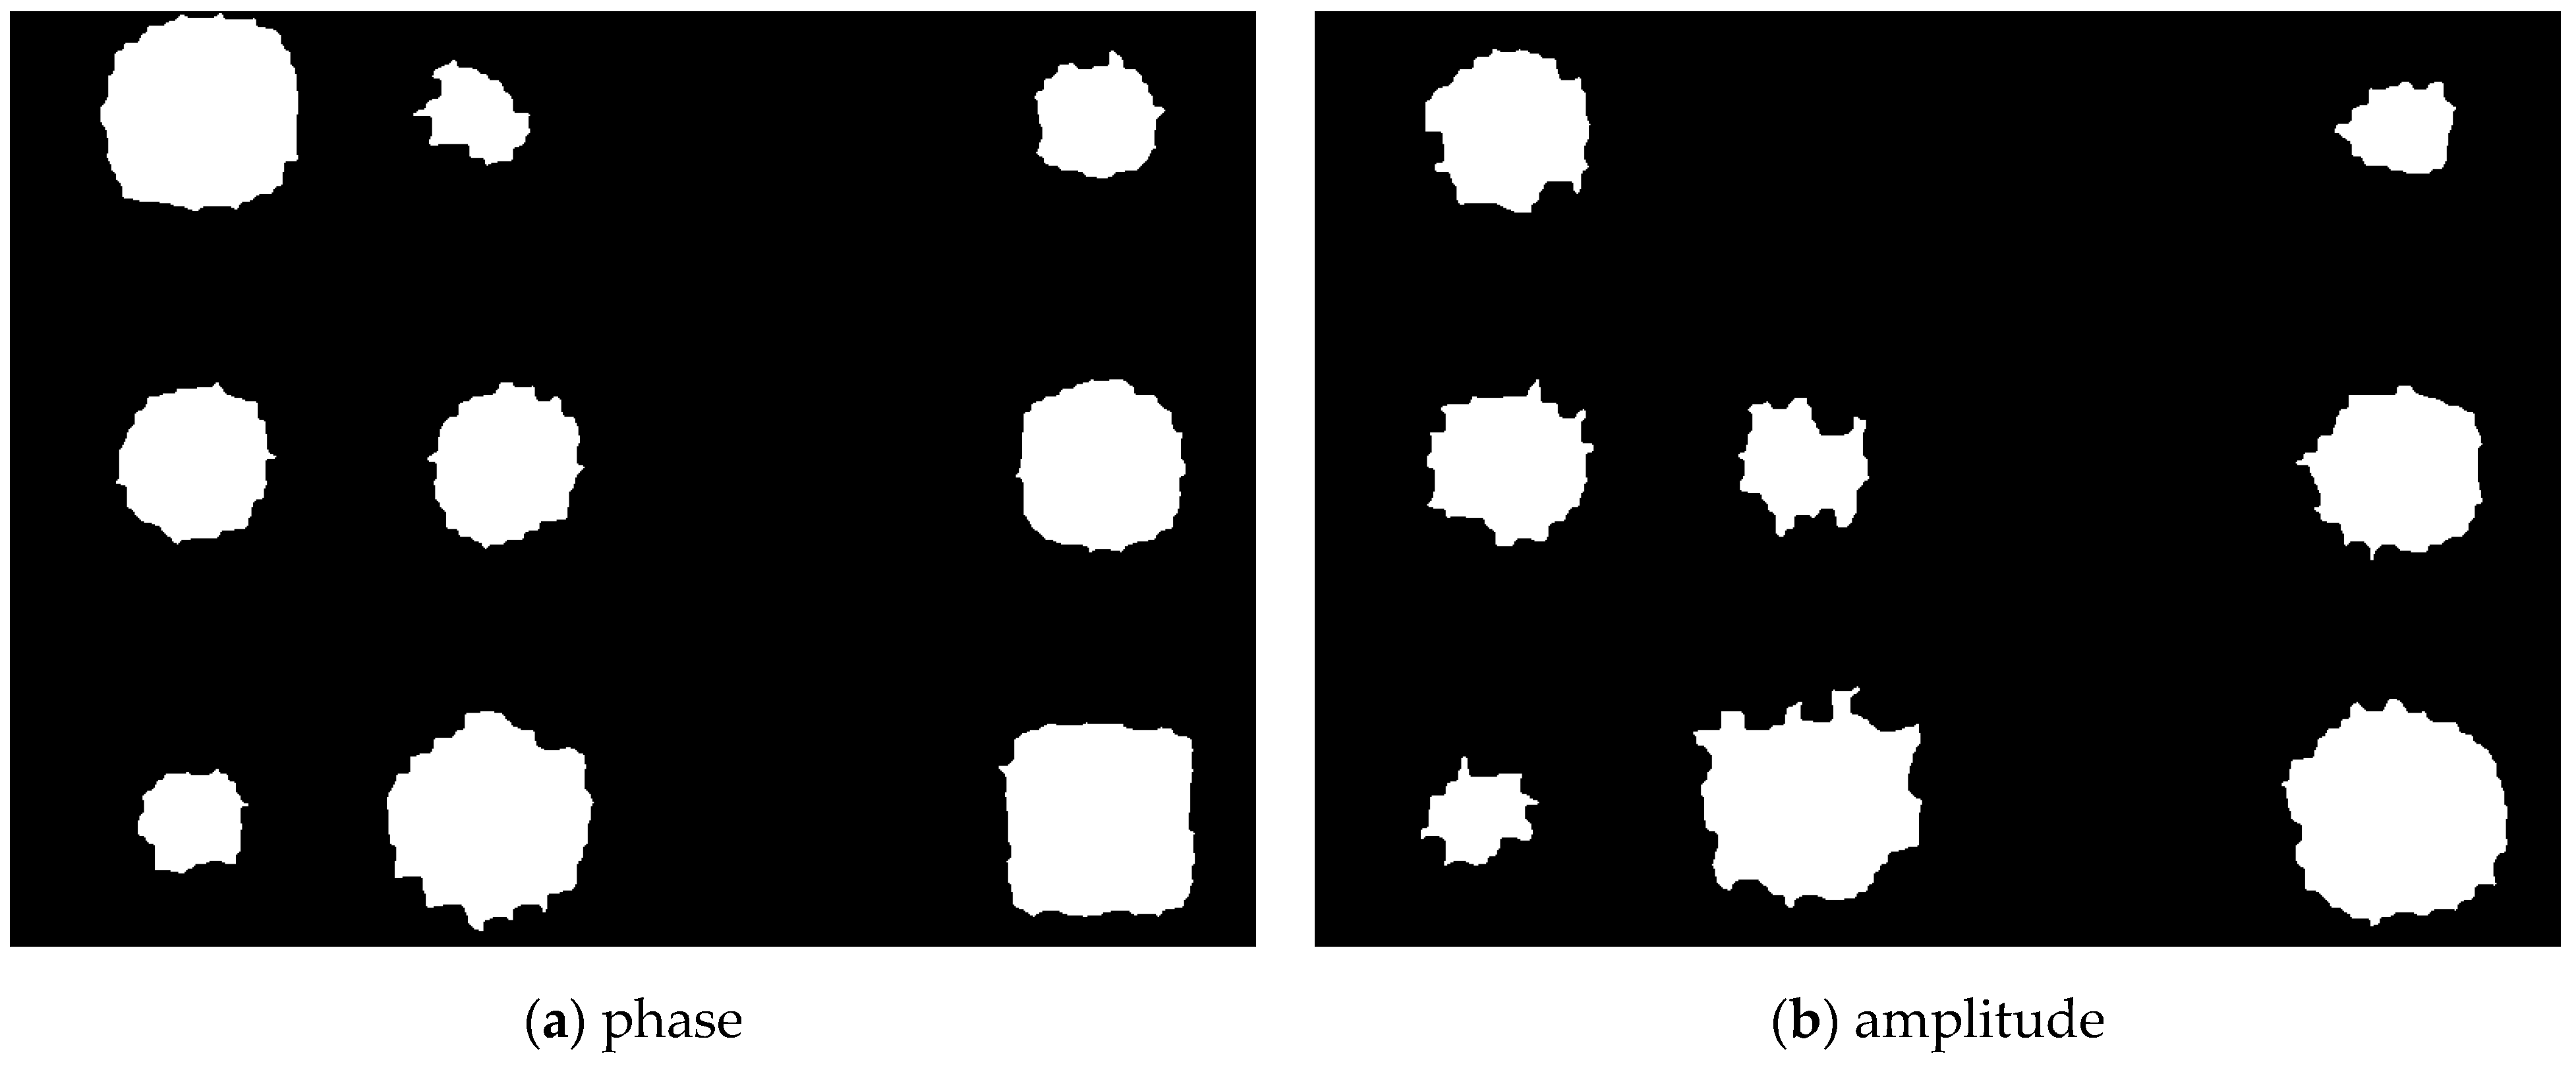
4.3. De-Noising Using Morphology Operation

The morphology operation was performed for de-noising existing in the binary image. Morphology calculation was performed through three steps as follows. First, de-noising was performed using the ‘bwareaopen’ function. Second, the ‘imclose’ function was used to fill the empty space with pixels. Third, the process of determining the contrast values of neighboring pixels was performed using the ‘bwmorph’ function. Figure 13 shows images of phase and amplitude with morphology operation applied. By applying the morphology operation, it is possible to confirm an image in which noise is effectively removed. Comparing the phase and amplitude images, the boundary of the object is relatively more uniform in the object of the phase image.

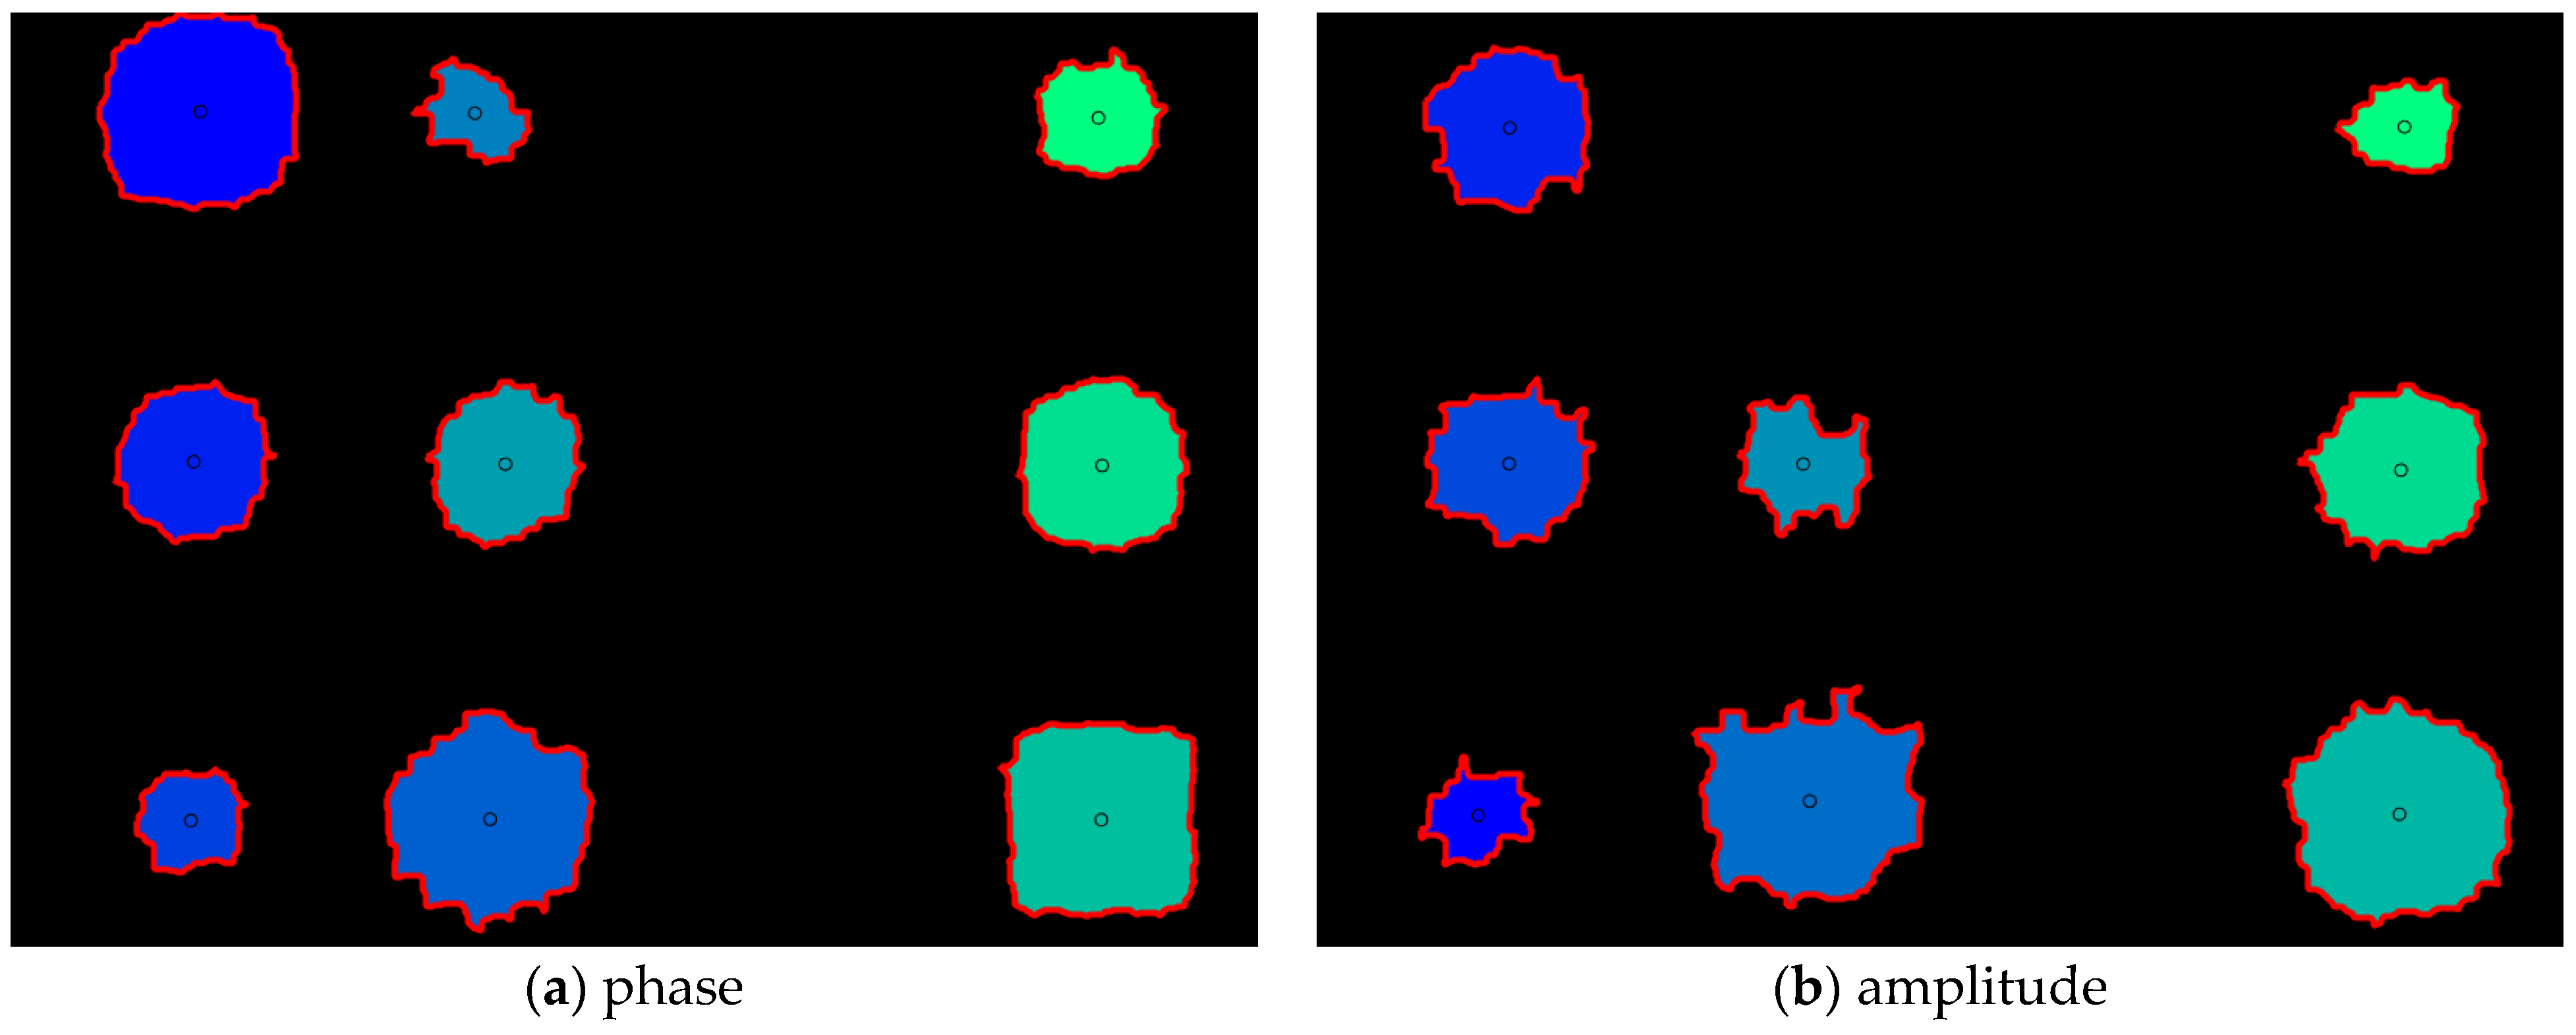
4.4. Automatic Detection of Thinning Defects

The boundary tracking algorithm was utilized for the automatic detection of thinning defects. The boundary tracking algorithm is a technique for tracking the boundary of the object existing in the binary image. Figure 14 shows images of phase and amplitude with applied automatic detection. A total of 9 defects in phase and 8 defects in amplitude were detected. However, all defects in 3 columns failed to be detected. This can be considered as a reason for the low thermal contrast of the defective area and the sound area due to thinning of 10%. It is possible to qualitatively confirm that the boundary of the defect object in the phase image is relatively uniform compared to the amplitude.

4.5. Comparison Evaluation of Detectability

Detectability evaluation was performed using root mean square error (RMSE) on the binary image of phase and amplitude. The difference between the real value and the estimated value for each object was calculated, and the number of pixels with the contrast value of 1 in the binary image was calculated. The equation for RMSE is [17]
RMSE ( θ 1 , θ 2 ) = i = 1 n ( θ 1 , i θ 2 , i ) 2 n
where θ 1 is the real value, θ 2 is the estimated value, and n is the number of defect areas.
Table 2 shows the RMSE results of phase and amplitude. Defects not detected in the binary image were excluded. As confirmed qualitatively in Figure 14, it can be confirmed that the RMSE of the phase is calculated relatively low, and the detectability is high.

5. Conclusions and Future Works

In this study, the automatic detection of thinning defects in the S275 specimen was performed using the LIT technique based on array type halogen lamp. Image segmentation was performed for clear recognition of defective objects. Automatic defect detection using the algorithm and comparative analysis of detectability was performed. The main conclusions are as follows.
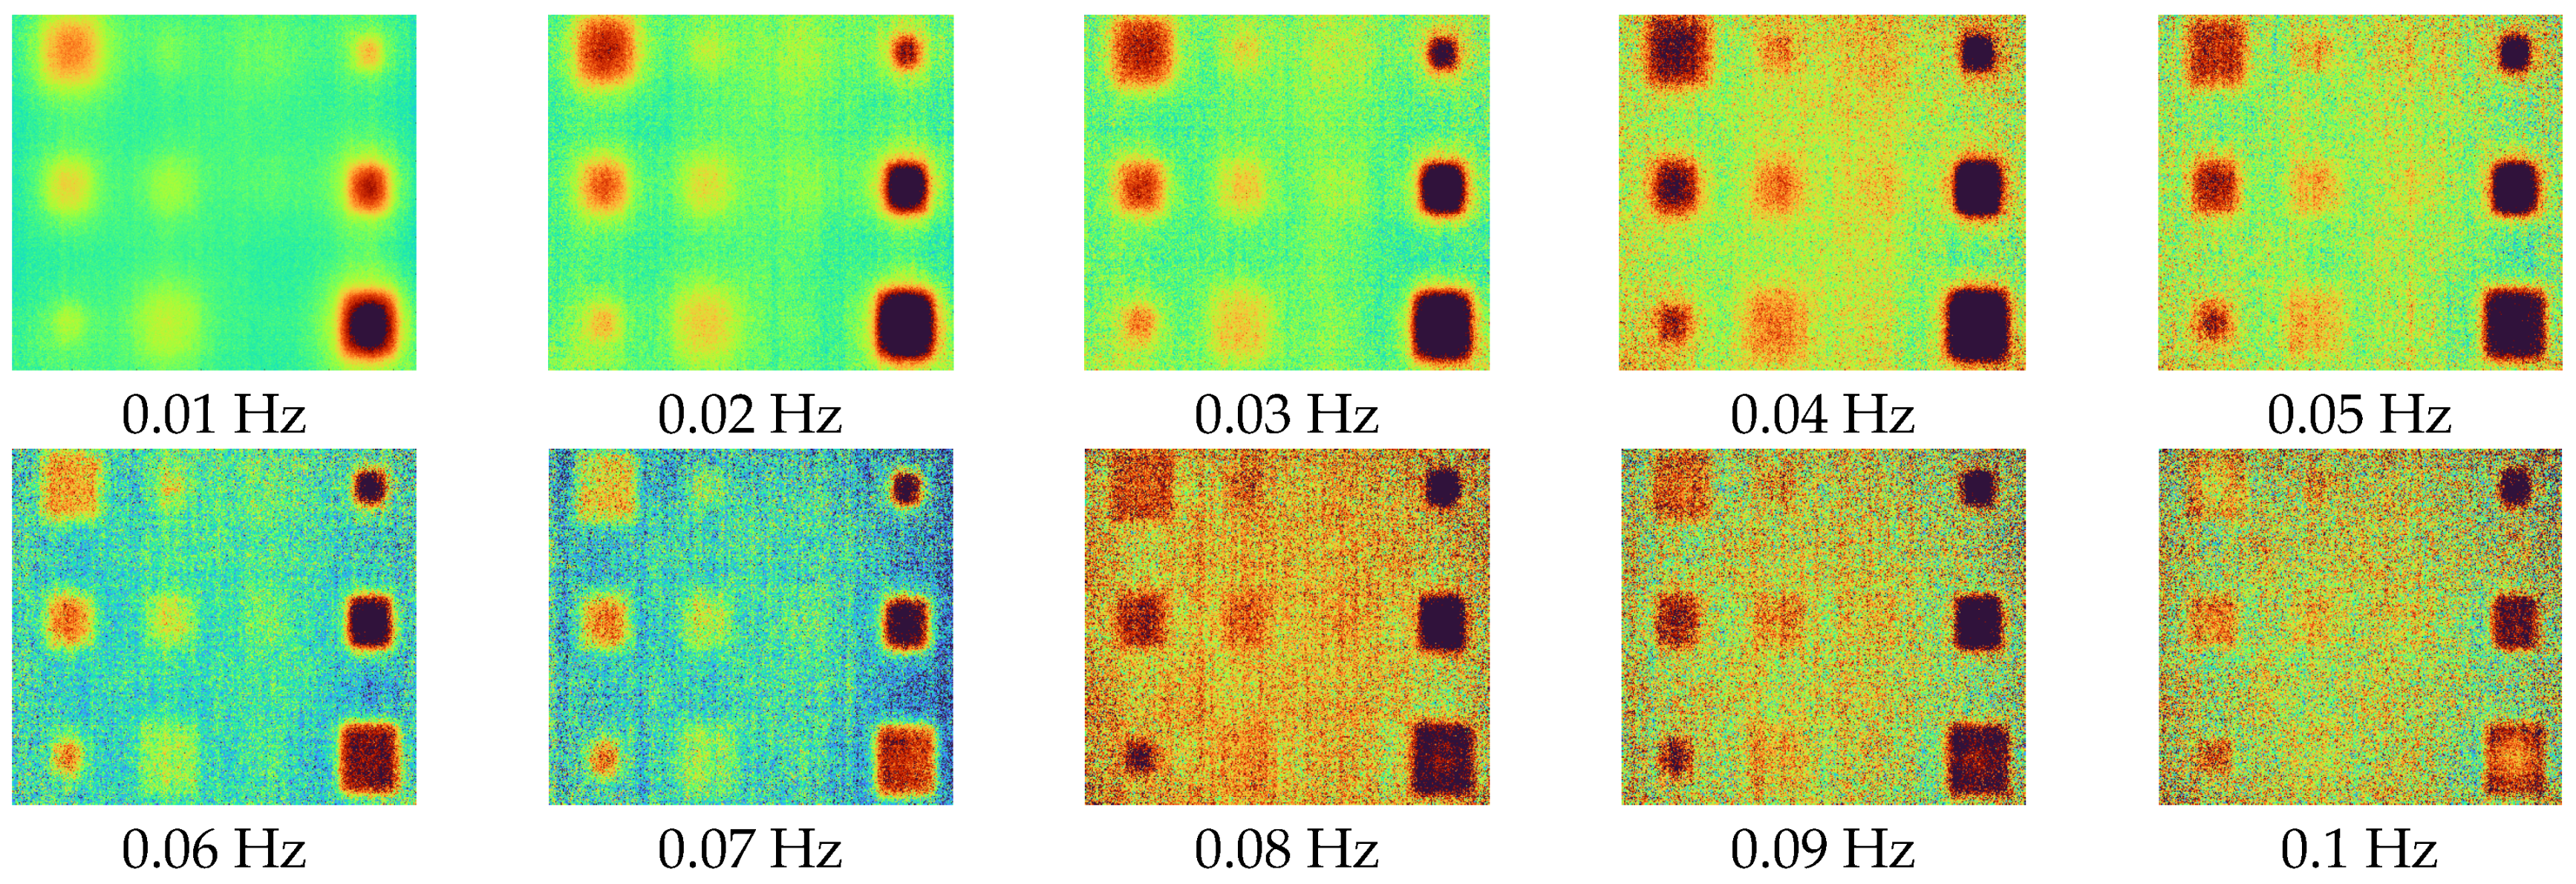
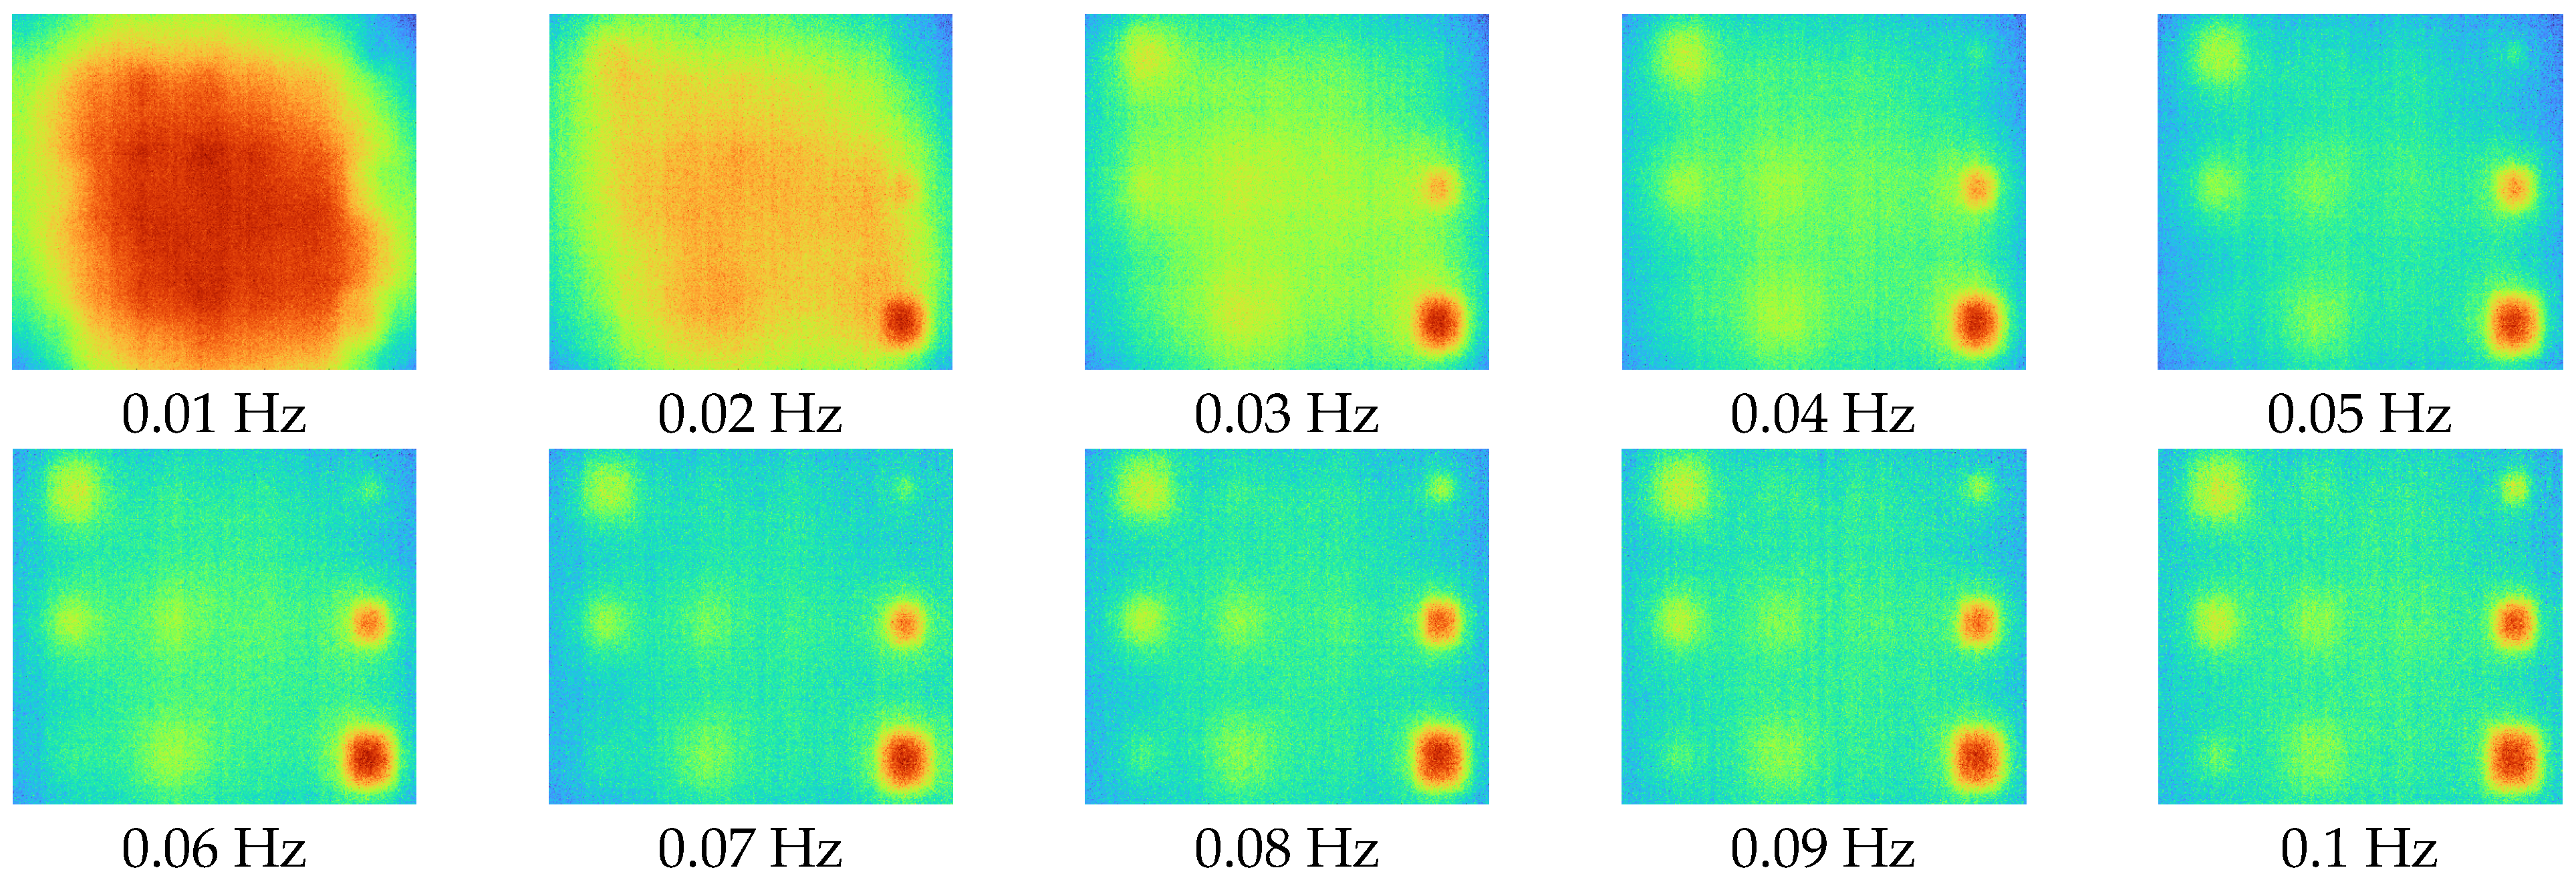
  • Phase and amplitude images were acquired using the four-point signal process of the LIT technique. The optimal excitation frequency was evaluated using SNR, and the phase was derived as 0.01 Hz and the amplitude as 0.09 Hz;
  • After image segmentation, the binary image was acquired using the Otsu algorithm. Pixel noise was removed by performing the three-step morphological calculation;
  • Automatic defect detection of phase and amplitude images was performed using the boundary tracking algorithm. A total of 9 defects in phase and 8 defects in amplitude were detected;
  • The detectability was evaluated by calculating the RMSE based on the number of pixels with the contrast value of 1 in the object area. Better results can be seen in phase than the amplitude.
Future work will be conducted on automatic defect detection of real-time images including full frames.

Author Contributions

Conceptualization, S.L. and W.K.; methodology, S.L. and Y.C.; software, C.K.; validation, S.L., Y.C. and C.K.; formal analysis, S.L.; investigation, W.K.; resources, W.K.; data curation, Y.C.; writing—original draft preparation, S.L.; writing—review and editing, W.K.; visualization, C.K.; supervision, W.K.; project administration, W.K.; funding acquisition, W.K. All authors have read and agreed to the published version of the manuscript.

Funding

This work was supported by the National Research Foundation of Korea (NRF-2022R1A2C1011413) funded by the Korean Government, Ministry of Education, Science and Technology (MEST) and the Technology development Program (S3249835) funded by the Ministry of SMEs and Startups (MSS, Korea).

Institutional Review Board Statement

Not applicable.

Informed Consent Statement

Not applicable.

Data Availability Statement

Not applicable.

Conflicts of Interest

The authors declare no conflict of interests.

References

  1. Choi, Y.W.; Yeom, Y.T.; Kim, H.J.; Song, S.J.; Ryu, S.W.; Kim, H.H.; Park, J.S.; Kwon, S.D. A Study on the Nondestructive Evaluation Method for Detecting Void in Containment Liner Plate. J. Korean Soc. Nondestruct. Test. 2020, 40, 389–396. [Google Scholar] [CrossRef]
  2. Lee, J.S.; Kim, W.B.; Kwak, D.R. Development of inspection technique for filling or unfilling of containment liner plate backside concrete in nuclear power plant. Trans. Korean Soc. Press. Vessel. Pip. 2020, 16, 37–41. [Google Scholar]
  3. Park, J.H.; Hong, J.K. Present status of nuclear containments and ISI in Korea. Prog. Nucl. Energy 2009, 51, 761–768. [Google Scholar] [CrossRef]
  4. Kant, R.; Chauhan, P.S.; Bhatt, G.; Bhattacharya, S. Corrosion monitoring and control in aircraft: A review. Sens. Automot. Aerosp. Appl. 2019, 39–53. [Google Scholar] [CrossRef]
  5. Gupta, M.; Khan, M.A.; Butola, R.; Singari, R.M. Advances in applications of Non-Destructive Testing (NDT): A review. Adv. Mater. Process. Technol. 2021, 1–22. [Google Scholar] [CrossRef]
  6. Dwivedi, S.K.; Vishwakarma, M.; Soni, A. Advances and researches on non destructive testing: A review. Mater. Today Proc. 2018, 5, 3690–3698. [Google Scholar] [CrossRef]
  7. Honarvar, F.; Varvani-Farahani, A. A review of ultrasonic testing applications in additive manufacturing: Defect evaluation, material characterization, and process control. Ultrasonics 2020, 108, 106227. [Google Scholar] [CrossRef] [PubMed]
  8. Felice, M.V.; Fan, Z. Sizing of flaws using ultrasonic bulk wave testing: A review. Ultrasonics 2018, 88, 26–42. [Google Scholar] [CrossRef]
  9. Lopez, A.; Bacelar, R.; Pires, I.; Santos, T.G.; Sousa, J.P.; Quintino, L. Non-destructive testing application of radiography and ultrasound for wire and arc additive manufacturing. Addit. Manuf. 2018, 21, 298–306. [Google Scholar] [CrossRef]
  10. Maldague, X.P. Volume 3. Infrared and Thermal Testing. In Nondestructive Testing Handbook; American Society for Nondestructive Testing: Arlingate Lane, OA, USA, 2001. [Google Scholar]
  11. Usamentiaga, R.; Venegas, P.; Guerediaga, J.; Vega, L.; Molleda, J.; Bulnes, F.G. Infrared thermography for temperature measurement and non-destructive testing. Sensors 2014, 14, 12305–12348. [Google Scholar] [CrossRef] [Green Version]
  12. Zhu, Y.K.; Tian, G.Y.; Lu, R.S.; Zhang, H. A review of optical NDT technologies. Sensors 2011, 11, 7773–7798. [Google Scholar] [CrossRef] [PubMed] [Green Version]
  13. Bagavathiappan, S.; Lahiri, B.; Saravanan, T.; Philip, J.; Jayakumar, T. Infrared thermography for condition monitoring-A review. Infrared Phys. Technol. 2013, 60, 35–55. [Google Scholar] [CrossRef]
  14. Ciampa, F.; Mahmoodi, P.; Pinto, F.; Meo, M. Recent advances in active infrared thermography for non-destructive testing of aerospace components. Sensors 2018, 18, 609. [Google Scholar] [CrossRef] [PubMed] [Green Version]
  15. Swiderski, W.; Hlosta, P. Non-destructive evaluation of impacted CFRP by IR thermography. Materials 2019, 12, 956. [Google Scholar] [CrossRef] [Green Version]
  16. Maldague, X.P. Introduction to NDT by active infrared thermography. Mater. Eval. 2002, 60, 1060–1073. [Google Scholar]
  17. Doshvarpassand, S.; Wu, C.; Wang, X. An overview of corrosion defect characterization using active infrared thermography. Infrared Physcics Technol. 2019, 96, 366–389. [Google Scholar] [CrossRef]
  18. Kobayashi, K.; Banthia, N. Corrosion detection in reinforced concrete using induction heating and infrared thermography. J. Civ. Struct. Health Monit. 2011, 1, 25–35. [Google Scholar] [CrossRef]
  19. Cadelano, G.; Bortolin, A.; Ferrarini, G.; Molinas, B.; Giantin, D.; Zonta, P.; Bison, P. Corrosion detection in pipelines using infrared thermography: Experiments and data processing methods. J. Nondestruct. Eval. 2016, 35, 1–11. [Google Scholar] [CrossRef]
  20. Ranjit, S.; Kang, K.S.; Kim, W.T. Investigation of lock-in infrared thermography for evaluation of subsurface defects size and depth. Int. J. Precis. Eng. Manuf. 2015, 16, 2255–2264. [Google Scholar] [CrossRef]
  21. Lee, S.J.; Chung, Y.J.; Shrestha, R.; Kim, W.T. Automated Defect Detection Using Threshold Value Classification Based on Thermographic Inspection. Appl. Sci. 2021, 11, 7870. [Google Scholar] [CrossRef]
  22. Lee, S.J.; Chung, Y.J.; Kim, C.Y.; Shrestha, R.; Kim, W.T. Thermographic Inspection of CLP Defects on the Subsurface Based on Binary Image. Int. J. Precis. Eng. Manuf. 2022, 23, 269–279. [Google Scholar] [CrossRef]
  23. Shrestha, R.; Choi, M.Y.; Kim, W.T. Quantification of defects depth in glass fiber reinforced plastic plate by infrared lock-in thermography. J. Mech. Sci. Technol. 2016, 30, 1111–1118. [Google Scholar]
  24. Shrestha, R.; Kim, W.T. Evaluation of coating thickness by thermal wave imaging: A comparative study of pulsed and lock-in infrared thermography-Part I: Simulation. Infrared Phys. Technol. 2017, 83, 124–131. [Google Scholar] [CrossRef]
  25. Shrestha, R.; Kim, W.T. Evaluation of coating thickness by thermal wave imaging: A comparative study of pulsed and lock-in infrared-Part II: Experimental investigation. Infrared Phys. Technol. 2018, 92, 24–29. [Google Scholar] [CrossRef]
  26. Manda, M.P.; Kim, H.S. A fast image thresholding algorithm for infrared images based on histogram approximation and circuit theory. Algorithms 2020, 13, 207. [Google Scholar] [CrossRef]
  27. Dong, Y.X. An Improved Otsu Image Segmentation Algorithm. Adv. Mater. Res. 2014, 989, 3751–3754. [Google Scholar] [CrossRef]
  28. Dong, Y.X. Review of otsu segmentation algorithm. Adv. Mater. Res. 2014, 989, 1959–1961. [Google Scholar] [CrossRef]
  29. Chung, Y.J.; Shrestha, R.; Lee, S.J.; Kim, W.T. Binarization Mechanism Evaluation for Water Ingress Detectability in Honeycomb Sandwich Structure Using Lock-in Thermography. Materials 2022, 15, 2333. [Google Scholar] [CrossRef]
  30. Lee, S.J.; Chung, Y.J.; Kim, W.T. Defect Recognition and Morphology Operation in Binary Images Using Line-Scanning-Based Induction Thermography. Appl. Sci. 2022, 12, 6006. [Google Scholar] [CrossRef]
  31. Chung, Y.J.; Shrestha, R.; Lee, S.J.; Kim, W.T. Thermographic Inspection of Internal Defects in Steel Structures: Analysis of Signal Processing Techniques in Pulsed Thermography. Sensors 2020, 20, 6015. [Google Scholar] [CrossRef]
Figure 1. Principle of four-point signal processing to acquire phase and amplitude in LIT technique.
Sensors 23 01281 g001
Figure 2. The principle of acquiring binary image by using gray scale-based histogram in the Otsu algorithm.
Sensors 23 01281 g002
Figure 3. Front and back of S275 specimen with thinning defects.
Sensors 23 01281 g003
Figure 4. Dimensions of S275 specimen with various sizes of thinning defects.
Sensors 23 01281 g004
Figure 5. Halogen lamp device of 5 × 5 array type. Infrared camera placed in the center.
Sensors 23 01281 g005
Figure 6. Schematic diagram of the LIT experimental setup for measuring the thermal response of specimen with thinning defects.
Sensors 23 01281 g006
Figure 7. Phase images for excitation frequencies range from 0.01 to 0.1 Hz.
Sensors 23 01281 g007
Figure 8. Amplitude images for excitation frequencies range from 0.01 to 0.1 Hz.
Sensors 23 01281 g008
Figure 9. SNR values of phase and amplitude for excitation frequencies range from 0.01 to 0.1 Hz for optimal excitation frequency analysis.
Sensors 23 01281 g009
Figure 10. Segmentation image for phase data at 0.01 Hz.
Sensors 23 01281 g010
Figure 11. Segmentation image for amplitude data at 0.09 Hz.
Sensors 23 01281 g011
Figure 12. Binary images of phase and amplitude data using the Otsu algorithm.
Sensors 23 01281 g012
Figure 13. Binary images with de-noising performed using morphology operation.
Sensors 23 01281 g013
Figure 14. Images of phase and amplitude with automatic defect detection using boundary tracking algorithm.
Sensors 23 01281 g014
Table 1. The material properties of S275 specimen.
Thermal Conductivity 50   W / m · K
Specific Heat 470   J / kg · K
Density 7900   kg / m 3
Initial Temperature 25  
Table 2. RMSE values for phase and amplitude images.
DefectReal Pixel ValuesEstimated Pixel Values
AmplitudePhase
A111,778808113,111
A2707876297583
A3363629713470
B13636-2861
B2707847717502
B311,77814,13112,995
C111,778--
C27078--
C33636--
D1363632174769
D2707891659502
D311,77815,23913,788
RMSE65.41861.117
Disclaimer/Publisher’s Note: The statements, opinions and data contained in all publications are solely those of the individual author(s) and contributor(s) and not of MDPI and/or the editor(s). MDPI and/or the editor(s) disclaim responsibility for any injury to people or property resulting from any ideas, methods, instructions or products referred to in the content.

