Article

Model of the Performance Based on Artificial Intelligence–Fuzzy Logic Description of Physical Activity

1
Institute of Physical Education, Kazimierz Wielki University in Bydgoszcz, 85-064 Bydgoszcz, Poland
2
Institute of Computer Science, Kazimierz Wielki University in Bydgoszcz, 85-064 Bydgoszcz, Poland
*
Author to whom correspondence should be addressed.
Sensors 2023, 23(3), 1117; https://doi.org/10.3390/s23031117
Submission received: 15 December 2022 / Revised: 15 January 2023 / Accepted: 16 January 2023 / Published: 18 January 2023
(This article belongs to the Special Issue Wearable Sensors for Physical Activity and Healthcare Monitoring)

Abstract

:

Featured Application

Potential applications of the work are systems for objective artificial-intelligent performance assessment in healthy individuals (including athletes) and patients with various injuries and conditions, including within the eHealth paradigm, including future wearable devices (e.g., e-shoes).

Abstract

The aim of the study was to build a fuzzy model of lower limb peak torque in an isokinetic mode. The study involved 93 male participants (28 male deaf soccer players, 19 hearing soccer players and 46 deaf untraining male). A fuzzy computational model of different levels of physical activity with a focus on the lower limbs was constructed. The proposed fuzzy model assessing lower limb peak torque in an isokinetic mode demonstrated its effectiveness. The novelty of our research lies in the use of hierarchical fuzzy logic to extract computational rules from data provided explicitly and then to determine the corresponding physiological and pathological mechanisms. The contribution of our research lies in complementing the methods for describing physiology, pathology and rehabilitation with fuzzy parameters, including the so-called dynamic norm embedded in the model.

1. Introduction

The monitoring and early diagnosis of motor skills and cognitive performance in both healthy and sick people [1,2], including deaf athletes plays an important role [3,4]. The complexity of the mechanisms and the large number of parameters that need to be taken into account make artificial intelligence(AI) a great potential solution for speeding up and increasing the accuracy of such analyses. Performance analysis based on artificial intelligence is increasingly being used, both to assess motor abilities [5,6,7], and cognitive abilities [8,9] allowing not only faster extraction of mechanisms and relationships between data, but also proving itself in the area of uncertain, incomplete data or data from non-homogeneous groups. Hence the validity and novelty of the present study, providing prototype fuzzy models.
Current research was carefully reviewed, key publications identified, including most controversial and diverging hypotheses [10,11,12,13]. The mechanisms that stabilize posture (stretch reflexes, intermuscular reflexes and intrinsic muscle properties) resist deviation from posture, in which the balance of muscular and external forces is maintained. For each muscle, these mechanisms become functional at a certain threshold (expressed in muscle length, corresponding joint angle). Furthermore, spinal and supraspinal centers can shift the above spatial thresholds for individual muscle groups. The control strategy described in this way allows us to conclude that postural and movement stability is provided by a common mechanism [10].
Damage to the postural control system can cause various context-specific instabilities. Computational modeling of the aforementioned mechanisms supports the understanding of multiple postural controls and supports effective balance rehabilitation to improve mobility and prevent falls [14,15,16].
Fuzzy logic-based approaches to physical activity assessment are not common, although some progress has already been made [17]. To date, fuzzy logic has mainly been used for pattern recognition in medical signals [18], especially with linguistic description, uncertainty and incompleteness of data. A review of the current state of knowledge shows that fuzzy logic has so far been used to diagnose diseases based on symptoms, and historical and clinical data, including among others the fields of celiac disease, diabetes, iris, heart, breast cancer, dental, cholera, brain tumor, liver, asthma, viral, Parkinson’s disease, lung, kidney, Huntington’s disease and chest diseases [19,20,21,22,23,24,25]. The benefits of fuzzy logic are expected primarily in injuries, conditions and deficits that have not found algorithms to detect them early and accurately and need artificial intelligence support to do so [20]. Agent-based modeling and fuzzy logic allow the simulation of the experience of a human expert, are simple to set up and provide high-level functions (connections and decision-making processes) [26]. Ordered Fuzzy Numbers (OFN) can also be used for modeling changes in dynamic processes [27,28].
There is still a lack of simpler models that are easy to apply clinically, not only in sick people, but also in healthy people, including those actively involved in sport.
The aim of study was to build a fuzzy model of lower limb peak torque in an isokinetic mode.

2. Materials and Methods

2.1. Material

The study involved 93 male participants (28 male deaf soccer players, 19 hearing soccer players and 46 deaf untrained males) (Table 1). The method of selection was convenience sampling.

2.2. Methods

Biodex System 4 Pro—a set for neuromuscular assessment and training in an isokinetic mode (eccentric and concentric) was used to assess of peak torque of lower limb the study participants. The isokinetics test is used to check the ability of patients to generate peak torque of the lower limb in an isokinetic mode with different angular velocities (60 deg/s, 180 deg/s, 300 deg/s).
The balance between the left leg and right leg and between quadriceps and hamstring muscles of left and right leg is very important.
The weaker the muscles, the poorer the stability and therefore the greater the risk of injury. The main characteristics of the Biodex System 4 Pro are:
  • Easy and precise alignment of the dynamometer’s axis of motion with that of the joint being tested/exercised;
  • Repeatability of the dynamometer setting;
  • Force torque measurement during acceleration and deceleration phases of movement;
  • Fully adjustable adjustment for assessment and training of different joints and muscle groups;
  • Torque measurement range: concentric operation from 0 to 680 Nm, eccentric operation from 0 to 544 Nm;
  • Range of motion speed measurement: concentric operation up to 500 deg/s, eccentric operation up to 300 deg/s;
  • Minimum movement speed (for passive movement): from 0.25 deg/s;
  • Minimum force torque (for passive movement): 0.68 Nm and above;
  • Minimum force torque value (for isotonic operation): 0.68 Nm and above.
The Biodex System 4 Pro is used in the training and rehabilitation of orthopedic patients. For people who have undergone surgery (especially lower limb surgery) or trauma, it allows a quick and safe return to full physical fitness. It can also be used as a sensomotor training device. Thanks to the use of visualization, it enables biofeedback in real time, allowing faster progress in the exercise. The system also makes it possible to assess whether the subject is at risk of injury (e.g., to the knee joint) and possibly suggest preventive exercises to minimize the risk of injury (e.g., during a ski trip).
Each study subject participated in a lower limb assessment on the Biodex stand (five repetitions away and towards). Defined as:
  • Away (extension)—movement of the lower limb at the knee joint in the sagittal plane between 90 and 0 degrees—as straightening;
  • Toward (flexion)—(movement in the opposite direction to away) as bending after previous straightening.
Three parameters were assessed at three speeds of movement in the isokinetic mode of the limited lower limb: 60 deg/s, 180 deg/s and 300 deg/s angular velocity:
  • PEAKTQ (R, L)—peak torque value (R—lower limb right, L—lower limb left) (Nm);
  • PEAKTQ/BM—the ratio of peak torque to body mass (Nm/kg);
  • H/Q—the ratio of peak torque of hamstring to quadriceps (flexors to extensors of lower limb) (%);

2.3. Statistical Analysis

Data were stored in an MS Excel spreadsheet (Microsoft, Redmond, WA, USA), and Statistica 13 software (StatSoft, Tulsa, OK, USA) was used for statistical analysis. Data distribution was checked using the Shapiro–Wilk test. For data with a near-normal distribution, description using a mean and SD (standard deviation)and parametric tests were used. For data with a distribution different from normal, Min—minimum, Q1—lower quartile, median, Q3—upper quartile, max—maximum values and non-parametric tests were used. Correlations among values from measurements and outcomes from the model were calculated by non-parametric Spearman’s test.
The threshold for statistical significance was set at p ≤ 0.05.

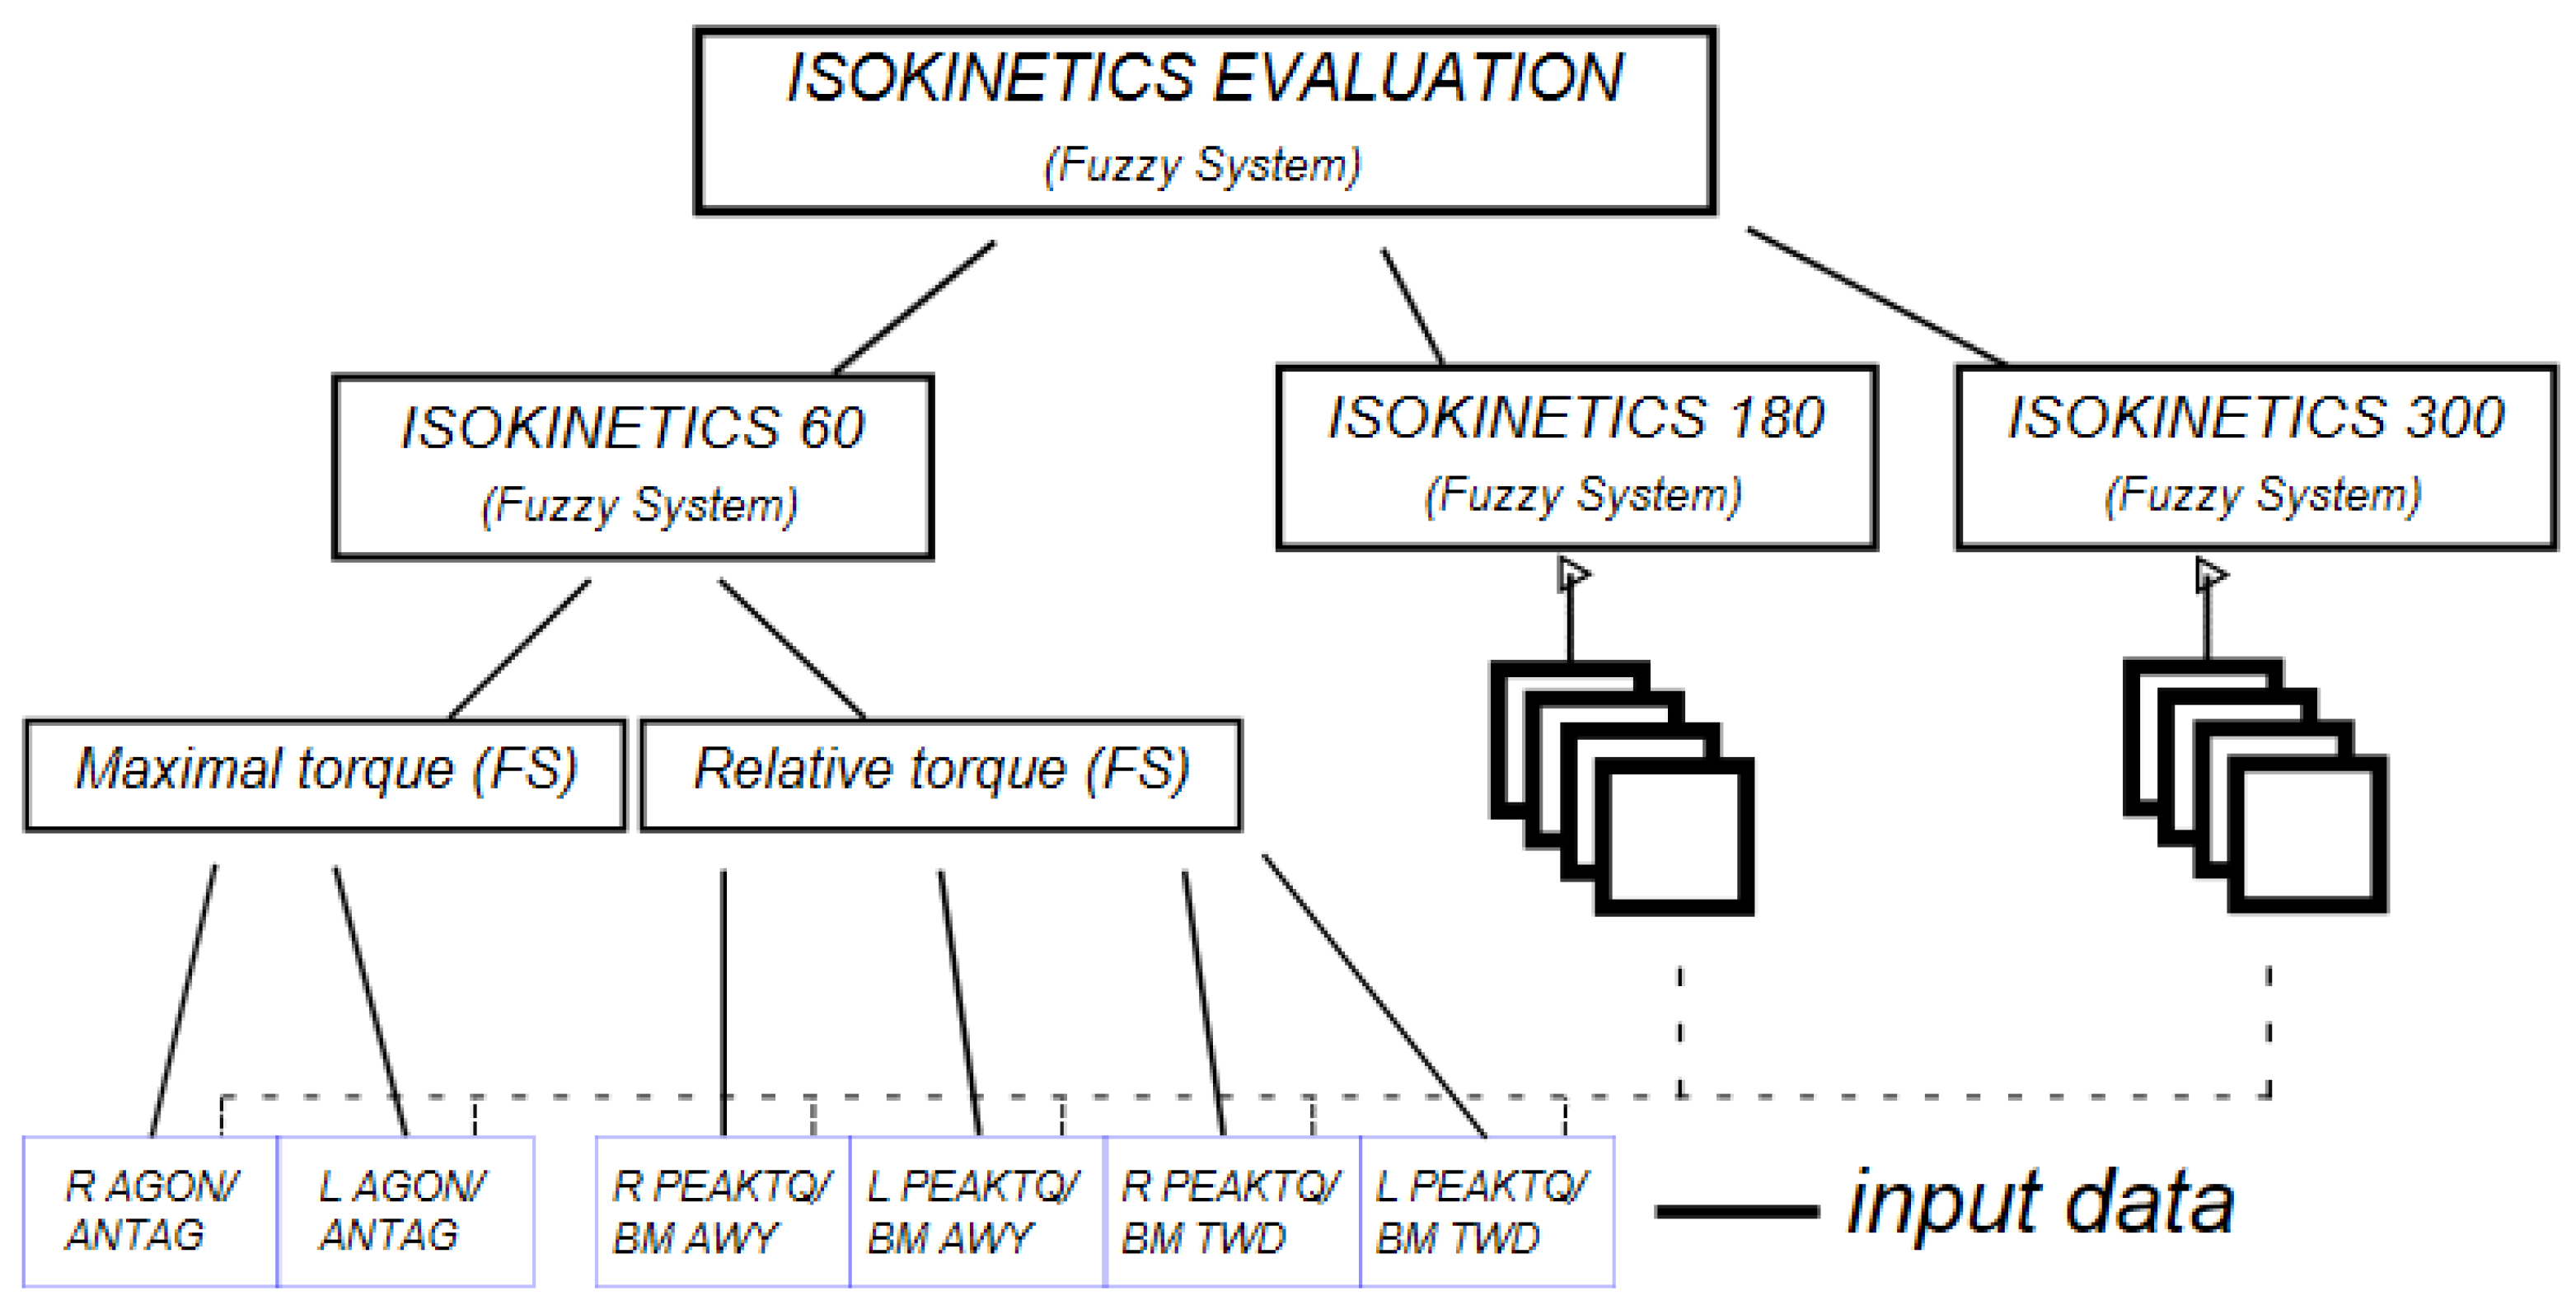
2.4. Computational Analysis

The researcher’s own software for fuzzy systems/ordered fuzzy numbers (including fuzzy logic libraries built by Piotr Prokopowicz)was used to build the computational models.
Based on the gathered data sets, a fuzzy computational model of different levels of physical activity, with a focus on the lower limbs, was constructed. The purpose of a fuzzy system (FS) is to provide rules or to model expected sets of parameter relationships that can be derived from knowledge (expert knowledge of the field), research assumptions (physical/medical formulas/relationships), or from measurements made on a reference group.
In choosing a hierarchical fuzzy model in this case, we considered two alternatives (large systems involving 3–4 levels of hierarchy):
  • Two evaluation systems, including one with detailed data (both legs), and another simpler one where only the data for the leading leg were considered to see if the results were similar;
  • A comparative evaluation between hearing players and deaf players—more than one fuzzy system to indicate a better structure of the algorithm.
In this article, standard trapezoidal fuzzy sets (fuzzy intervals) are mainly used. For their description, a notation similar to the description of LR fuzzy sets is used, but the order of the values is changed.
Following that, a trapezoidal fuzzy set T may be described as:
T = (l, k1, k2, r)
where:
l, r—left (low) and right (maximum) boundaries of the support of T; k1,k2 represents the kernel interval of T.
This description of the fuzzy set is consistent with the standard adopted in many popular scientific tools (Matlab: Fuzzy Logic Toolbox, Octave: fuzzy logic toolkit package, Scilab: sciFLT—Fuzzy Logic Toolbox, etc.).
For the research in this paper, the six data inputs (gathered from Biodex) were separated for each isokinetic mode. The first two consist of the module for the evaluation of maximal peak torque. They are:
  • R AGON/ANTAG (denoted in fuzzy system by XRMT)—the ratio of extensor to flexor muscles for a right leg,
  • L AGON/ANTAG(XLMT)—as per previous, but for a left leg.
The next module—relative torque estimation—is based on four other parameters from the Biodex Balance System. They are:
  • R PEAKTQ/BM AWY(XRAWYRT)—peak torque relative to body mass for a right leg during away move,
  • L PEAKTQ/BM AWY (XLAWYRT)—as per previous, but for a left leg,
  • R PEAKTQ/BM TWD (XRTWDRT)—peak torque relative to body mass for a right leg during toward move,
  • L PEAKTQ/BM TWD (XLTWDRT)—as per previous, but for a left leg.
The intervals of values for each of above parameters were divided for each isokinetic mode, and are presented in Table 2. In that table the basic linguistic interpretation is also provided. This information was used as source for the definition of the fuzzy system boundaries.
In general, the proposed hierarchical system for the evaluation the isokinetics of lower body parts of humans can be divided into three separate parts. Each is related to another isokinetic mode in Biodex. Furthermore, each isokinetic mode is divided into two modules: the module for the evaluation of the maximal peak torque (maximal torque on Figure 1) and the module for the evaluation of torque relative to body mass (relative torque in Figure 1).
The resulting fuzzy system is shown in Figure 1.
The structure of the model is a three-level hierarchical system divided into three modules: Isokinetics 60, Isokinetics 180 and Isokinetics 300. All these parts together make up the whole isokinetics evaluation.
It is important to note that although these isokinetics partial modules have a similar structure, they use different intervals/scopes, which are presented in Table 2.
The input data for each isokinetics mode consist of six components. Here, we present thee description for the Isokinetics 60 mode. The other modes of the fuzzy systems are defined in similar way based on the related data presented in Table 2.
The first—lower—tier comes from two modules, the module of maximal torque XMT on and the relative torque XRT (see Figure 1).
Input data for Isokinetics 60:
XMT = {XRMT, XLMT},
XRT = {XRAWYRT, XLAWYRT, XRTWDRT, XLTWDRT},
where each of them is divided into fuzzy sets as follows (described as fours, in a trapezoid shape):
XRMT: lowXRMT = (0;0;0;45),medXRMT = (0;45,65,100),highXRMT = (65;100;100;100),
XRAWYRT: lowXRAWYRT = (0;0;0.6;3.4), highXRAWYRT = (0.6;3.4;4.5;4.5),
XRTWDRT: lowXRTWDRT = (0;0;0.4;2.2), highXRTWDRT = (0.4;2.2;3;3).
The fuzzy sets boundaries presented above are for the right leg, and are the same as for the left leg.
For the output, we use the following variables:
Maximal torque module:
YMT = {Y1; Y2; Y3}: Y1 = (0; 0; 0; 0.5), Y2 = (0; 0.5; 0.5; 1), Y3 = (0.5; 1; 1; 1).
Relative torque module:
YRT = (Y1;Y2;Y3;Y4;Y5): Y1 = (0;0;0;0.25), Y2 = (0;0.25;0.25;0.5), Y1 = (0.25;0.5;0.5;0.75), Y4 = (0.5;0.75;0.75;1), Y5 = (0.75;1;1;1).
To perform the defuzzification, the centre of gravity (COG) method is used [29]. Therefore, it should be mentioned, that for practical reasons, to avoid extra scaling in the computer processing, we use some extended fuzzy sets. For maximal torque it is Y1 = (−0.5, 0, 0, 0.5) and Y3 = (0.5, 1, 1, 1.5), to make it possible to obtain exactly 0 and exactly 1 as defuzzified boundary values. The same extension is used for the boundaries of the relative torque fuzzy sets. In fact, all variables in presented solution follow that pattern.
In the maximal torque module, we have an interpretation which identifies non-monotonical behavior. Low and high values should have a lower evaluation, but the middle values should have a higher result. For that, we use the rules:
R1: IF XRMT islowXRMTANDXLMT islowXLMTTHENeMT = Y1,
R2: IF XRMT islowXRMT AND XLMT ismedXLMT THEN eMT = Y2,
R3: IF XRMT islowXRMT AND XLMT ishighXLMT THEN eMT = Y1,
R4: IF XRMT ismedXRMT AND XLMT islowXLMT THEN eMT = Y2,
R5: IF XRMT ismedXRMT AND XLMT ismedXLMT THEN eMT = Y3,
R6: IF XRMT ismedXRMT AND XLMT ishighXLMT THEN eMT = Y2,
R7: IF XRMT ishighXRMT AND XLMT islowXLMT THEN eMT = Y1,
R8: IF XRMT ishighXRMT AND XLMT ismedXLMT THEN eMT = Y2,
R9: IF XRMT ishighXRMT AND XLMT ishighXLMT THEN eMT = Y1,
where Y1, Y2, Y3 are output values for YMT and eMT is the exit/final result of the evaluation value of the maximal torque module.
As shown, the highest output (Y3) is defined for both medium values in premises, as intended by the linguistic expectations.
For the relative torque module, we have a typical ‘monotonical’ linguistic suggestion—the higher the better. Therefore, in the rules, the higher values in the premises generate higher output values. The rules follow the pattern:
R1: IF XRAWYRT islowXRAWYRT AND XLAWYRTislowXLAWYRTANDXRTWDRTislowXRTWDRT AND XLTWDRTislowXLTWDRTTHENeRT = Y1,
R2: IF XRAWYRT islowXRAWYRT AND XLAWYRT islowXLAWYRT AND XRTWDRTislowXRTWDRT AND XLTWDRTishighXLTWDRT THEN eRT = Y2,
R3:IF XRAWYRT islowXRAWYRT AND XLAWYRT islowXLAWYRT AND XRTWDRTishighXRTWDRT AND XLTWDRTislowXLTWDRT THEN eRT = Y2,
R4: IF XRAWYRT islowXRAWYRT AND XLAWYRT islowXLAWYRT AND XRTWDRTishighXRTWDRT AND XLTWDRTishighXLTWDRT THEN eRT = Y3,
R5: IF XRAWYRT islowXRAWYRT AND XLAWYRT ishighXLAWYRT AND XRTWDRTislowXRTWDRT AND XLTWDRTislowXLTWDRT THEN eRT = Y2,

R16: IF XRAWYRT ishighXRAWYRT AND XLAWYRT ishighXLAWYRT AND XRTWDRTishighXRTWDRT AND XLTWDRTishighXLTWDRT THEN eRT = Y5,
where Y1, Y2, Y3, Y4, Y5 are output values for YRT and eRT is the exit/final result of the evaluation value of the relative torque module.
The rules define that the lowest value Y1 is proper only for all ‘low’ premises and the highest value Y5 is only for all of the highest premises, as the linguistic description suggests.
The second tier is a two-module concept. As inputs, we have output values from the maximal torque and relative torque modules. Two normalized (to the [0;1] interval) variables with intuition default for the evaluation ‘the higher, the better’.
Inputs are:
XK60 = {EMT,ERT},
EMT: lowEMT= (0;0;0;1),highEMT = (0;1;1;1),
ERT: lowERT = (0;0;0;1),highERT = (0;1;1;1).
Output variable YK60:
YK60 = {Y1K60; Y2K60; Y3K60}: Y1K60 = (0; 0; 0; 0.5), Y2K60 = (0; 0.5; 0.5; 1), Y3K60 = (0.5; 1; 1; 1).
The rules are simply:
R1: IF EMT is lowEMT AND ERT is lowERT THEN eK60 = Y1K60,
R2: IF EMT is lowEMT AND ERT ishighERT THEN eK60 = Y2K60,
R3: IF EMT is highEMT AND ERT is lowERT THEN eK60 = Y2K60,
R4: IF EMT is highEMT AND ERTishighERT THEN eK60 = Y3K60,
where eK60 is the exit/final result of the evaluation value of the Isokinetics 60 module.
The same structure of evaluation is implemented for the other isokinetic modules—for the 180 and 300 angular velocities.
The final tier is a three-module concept, as mentioned earlier. Here, we have normalized input data with the meaning ‘the higher, the better’. This layer aggregates the input data from the different isokinetic module evaluations.
Inputs are two-valued variables:
EISOK = {EK60, EK180, EK300}
EK60: lowEK60= (0;0;0;1),highEK60 = (0;1;1;1),
EK180: lowEK180 = (0;0;0;1),highEK180 = (0;1;1;1),
EK300: lowEK300 = (0;0;0;1),highEK300 = (0;1;1;1).
The final output variable fuzzy sets are determined by simply dividingthe [0;1] interval to represent different possible states of input combinations.
The output variable O= {O1, O2, O3, O4},consists of four fuzzy values:
O1 = (0,0,0,0.333), O2 = (0,0.333,0.333,0.667), O3 = (0.333,0.667,0.667,1),
O4 = (0.667,1,1,1)
The rules aggregating three input data points in the final evaluation are defined as follows:
R1: IFEK60islowEK60ANDEK180islowEK180ANDEK300islowEK300THENo = O1,
R2: IF EK60 is highEK60 AND EK180 is lowEK180 AND EK300 is lowEK300 THEN o = O2,
R3: IF EK60 is lowEK60 AND EK180 is highEK180 AND EK300 is lowEK300 THEN o = O2,
R4: IF EK60 is lowEK60 AND EK180 is lowEK180 AND EK300 is highEK300 THEN o = O2,
R5: IF EK60 is highEK60 AND EK180 is highEK180 AND EK300 is lowEK300 THEN o = O3,
R6: IF EK60 is lowEK60 AND EK180 is highEK180 AND EK300 is highEK300 THEN o = O3,
R7: IF EK60 is highEK60 AND EK180 is lowEK180 AND EK300 is highEK300 THEN o = O3,
R8: IF EK60 is highEK60 AND EK180 is highEK180 AND EK300 is highEK300 THEN o = O4
The final-tier system’s purpose is the aggregation of the results from the data-source modules.

3. Results

The results of the study are presented in Table 3, Table 4 and Table 5.
Table 3, Table 4 and Table 5 show the normalized and aggregated values of the results for each participant in the study presented in a common range of values from 0 to 1. This is carried automatically and allows the results for a specific case to be simply related to the dynamic norm thus derived, both in the area of healthy people and, after adjusting the model, of people with deficits. The proposed model, when extending the measurements to a larger representation of the population, can serve as a tool for setting a norm.
The highest outcome median was observed in Group 3, then in Group 1, and the lowest median was observed in Group 2. This is consistent with expectations.
The calculated correlations among values from measurements and outcomes from the model were moderate to high, achieving the best values for relative torque in all studied groups (Spearman’s correlation coefficient—a non-parametric test used to measure the strength of association between two variables—from 0.576 to 0.749).
The newly developed fuzzy model allows new measurable features of the observed phenomenon to be extracted from the data, reflecting differences between populations and, ultimately, changes occurring in the parameter values. The advantage of our fuzzy-based model is the high accuracy of translating clinical procedures (diagnostic tests) into computational evaluation algorithms, while maintaining the assumptions of the linguistically described data processing model.

4. Discussion

The aim of the study was to build a fuzzy model of lower limb peak torque in an isokinetic mode. The secondary aim was to extract computational rules.
The analyzed values in this study are of high interest when compared with data on power and lower limb work in a vertical jump. To date, the use of artificial intelligence to build a postural stability model based on parameters extracted using the Biodex System 4 Pro has not been observed. The only study of postural control using artificial intelligence that we are aware of is the development and validation of the automatic identification of postural control patterns in children with autism spectrum disorders using a machine learning approach (naive Bayes method) [30]. These are similar to those used in the Parkinson’s disease group, where among the five supervised machine learning algorithms (logistic regression, K-nearest neighbors, naive Bayes, decision trees and random forest), the kNN method showed the best results for predicting impaired postural stability [31]. However, this did not involve athletes, nor did it use fuzzy logic, so it is difficult to compare such distant studies other than to demonstrate the usefulness of machine learning for analyzing postural control in the above-mentioned group of children [30].
The model presented in this article has demonstrated its effectiveness. It is reflected in the literature on the mechanical analysis of peak force moment and absolute force moment for the straightening and bending of the knee joint for the measured angular velocities. Concordance of the results obtained was also observed with the H/Q values [32,33,34,35]. Its proposition is assessing the lower limbs in an isokinetic mode. Additionally, it allows the observation of differences between population changes occurring in the parameter values. The advantage of the model is its accuracy and its intuitiveness in translating the clinical procedures (diagnostic tests) into computational evaluation algorithms.
The novelty of our research lies in the use of hierarchical fuzzy logic to extract computational rules from data not provided explicitly, and then determining the corresponding physiological and pathological mechanisms. The contribution of our research is to complement the ways of describing modern physiology, pathology and rehabilitation, taking into account the uncertainty, incompleteness or inconsistency of the data. Deficits in this area affect both healthy people (including athletes) and sick people: those with orthopedic deficits (after injury), as well as neurological (e.g., after stroke) and neurodegenerative (e.g., Alzheimer’s disease) deficits. Improving the efficiency of diagnosis and rehabilitation will translate into improvements in the effectiveness of maintenance of existing health and the effectiveness of rehabilitation methods and tools.
A separate problem is that both in the area of gait and balance there are no reference standards, moreover, they change over time, so there is a need to separate the so-called dynamic norm from a sample of healthy people. Computational solutions will make it easier and faster for us not only to obtain such a norm from the current population, but moreover, will allow us to compare changes in this area related to both the fashion for practicing sports and changes in the way of eating or lifestyle (transition to sedentary or remote work, i.e., with less necessary mobility during the working day, greater access to city bikes or scooters, etc.).
In the case of the analyzed group of parameters, it is also important to note that the norm is a certain range of parameters, and changes in their values can occur both upwards and downwards, but they are not equally favorable or unfavorable. Hence, there is a need to take into account the direction of changes using ordered fuzzy numbers in computational models in the future. This will allow the assessment, not only of the absolute value of the change, but also its sign, which will translate into better inference and prediction of the development of health status. Such extensive research involves the need to increase the number of patients, although the current one seems to be sufficient for the needs of the basic scope of the study. The norm identified in this study may become the nucleus of the future dynamic norm for the entire population.

Future Research Directions

The main scientific and technical direction of further research will be the development of the described solution to Neuro-Fuzzy i.e., the combination of artificial neural networks (ANNs) and the fuzzy logic system, in which the adaptation of connections between ANN layers gives the basis for learning, and fuzzy logic gives a foothold on the concept of fuzzy sets and rules, and fuzzy reasoning [28].
The main clinical direction for further research is to refine the model to accurately reflect and predict changes, and in some cases, to build a family of models, each of which can be dedicated to a different group of conditions (with a different etiology or set of symptoms). The challenge for computational models is to increase their accuracy while reducing the time required to produce clinically relevant results. Scientists, engineers and clinicians continue to search for more efficient computational methods, techniques and algorithms, including fuzzy computing that is better suited to the specific biomedical data of healthy individuals and patients with various injuries and conditions. This is because data-driven decision-making based on machine learning (ML) can provide earlier detection and better patient care, as well as more efficient allocation of limited resources.
Looking more broadly, computational balance assessment methodology can accelerate the progress of home rehabilitation by adding an efficient and rapid quantitative assessment of balance control skills to current solutions. This will enable remote assessment, rehabilitation and care, with an individualized approach and less time and cost. This opens up a new avenue for the development of intelligent (including robotic) solutions for home rehabilitation [36].Virtual reality (VR) is a well-established technology in medicine but comprehensive studies on the possible applications of VR in posture measurement are scarce. A review of 21 studies [37] confirmed that virtual reality is often used as an additional visual stimulus in the assessment of static and dynamic posturography, with researchers particularly hopeful about VR-based postural assessment in a head-mounted display (HMD VR) [37,38].
Increased body awareness has been investigated as one of the component mechanisms of mindfulness. Two computational models were developed for each of the aforementioned cases (EC, EO) based on the postural signals of 156 healthy subjects during quiet standing under closed-eye (EC) and open-eye (EO) conditions:
  • Regression model, designed to estimate each participant’s mindfulness score based on their postural cues;
  • Classifier, designed to assign each participant to one of the ‘Mindful’ or ‘Non-mindful’ classes [39].
This showed that the two models designed from the EC data were more effective, which may advance further research into mindfulness [39,40].
Furthermore, the proposed algorithm may be adapted toward an application in wearable devices for athletes and elderly people (including e-shoes and e-socks).

5. Conclusions

The fuzzy model proposed in this article that assesses the lower limbs in an isokinetic mode has demonstrated its effectiveness. In its current form, the model provides a good starting point for further research to develop a family of artificially intelligent models for balance and postural control in healthy individuals (including those actively involved in sports) and patients with balance deficits due to disease and injury.
The proposed tool aggregates the results obtained from many measured parameters into one number. This allows for a transparent analysis of a larger number of factors that are part of the mechanisms of the studied phenomenon. Thus, the final assessment will be more accurate and complete.

Author Contributions

Conceptualization, A.S., P.P., K.B. and D.M.; methodology, A.S., P.P., K.B. and D.M.; software, P.P. and D.M.; validation, A.S., P.P., K.B. and D.M.; formal analysis, A.S., P.P., K.B. and D.M.; investigation, A.S., P.P., K.B. and D.M.; resources, A.S., P.P., K.B. and D.M.; data curation, A.S., P.P., K.B. and D.M.; writing—original draft preparation, A.S., P.P., K.B. and D.M.; writing—review and editing, A.S., P.P., K.B. and D.M.; visualization, A.S., P.P., K.B. and D.M.; supervision, A.S., P.P., K.B. and D.M.; project administration, A.S., P.P., K.B. and D.M.; funding acquisition, A.S., P.P., K.B. and D.M. All authors have read and agreed to the published version of the manuscript.

Funding

This research received no external funding.

Institutional Review Board Statement

The study was conducted in accordance with the Declaration of Helsinki, and approved by the Bioethics Committee of Collegium Medicum of the Nicolaus Copernicus University in Toruń, Poland (No. KB 330/2014).

Informed Consent Statement

Informed consent was obtained from all subjects involved in the study.

Data Availability Statement

Not applicable.

Conflicts of Interest

The authors declare no conflict of interest.

References

  1. Niespodziński, B.; Mieszkowski, J.; Sawczyn, S.; Kochanowicz, K.; Szulc, A.; Zasada, M.; Kochanowicz, A. Elbow Joint Position and Force Senses in Young and Adult Untrained People and Gymnasts. Int. J. Environ. Res. Public Health 2022, 19, 7592. [Google Scholar] [CrossRef] [PubMed]
  2. Danek, J.; Wojtasik, W.; Szulc, A. Measurement of maximal isometric torque and muscle fatigue index of the knee muscles in male athletes. Acta Bioeng. Biomech. 2019, 21, 31–37. [Google Scholar] [PubMed]
  3. Szulc, A.; Sandurska, E. Deaf and hearing Basketball National Teams at the 2019 World Championships: Discriminant analysis of game-related statistics between the winning and the defeated. Acta Kinesiol. 2021, 15, 82–91. [Google Scholar] [CrossRef]
  4. Buśko, K.; Kopczyńska, J.; Szulc, A. Physical fitness of deaf females. Biomed. Hum. Kinet. 2020, 12, 101–104. [Google Scholar] [CrossRef]
  5. Mikołajewska, E.; Prokopowicz, P.; Mikołajewski, D. Computational gait analysis using fuzzy logic for everyday clinical purposes—Preliminary findings. Bio-Algorithms Med. Syst. 2017, 13, 37–42. [Google Scholar] [CrossRef]
  6. Prokopowicz, P.; Mikołajewski, D.; Tyburek, K.; Mikołajewska, E. Computational gait analysis for post-stroke rehabilitation purposes using fuzzy numbers, fractal dimension and neural networks. Bull. Pol. Acad. Sci. Tech. Sci. 2020, 68, 191–198. [Google Scholar]
  7. Zhang, J.; Lockhart, T.E.; Soangra, R. Classifying lower extremity muscle fatigue during walking using machine learning and inertial sensors. Ann. Biomed. Eng. 2014, 42, 600–612. [Google Scholar] [CrossRef] [Green Version]
  8. Prokopowicz, P.; Mikołajewski, D. Fuzzy Approach to Computational Classification of Burnout—Preliminary Findings. Appl. Sci. 2022, 12, 3767. [Google Scholar] [CrossRef]
  9. Mikołajewski, D.; Prokopowicz, P. Effect of COVID-19 on Selected Characteristics of Life Satisfaction Reflected in a FuzzyModel. Appl. Sci. 2022, 12, 7376. [Google Scholar] [CrossRef]
  10. Feldman, A.G. The Relationship Between Postural and Movement Stability. Adv. Exp. Med. Biol. 2016, 957, 105–120. [Google Scholar]
  11. Horak, F.B. Postural orientation and equilibrium: What do we need to know about neural control of balance to prevent falls? Age Ageing 2006, 35 (Suppl. 2), ii7–ii11. [Google Scholar] [CrossRef] [PubMed] [Green Version]
  12. Koshio, Y.; Samukawa, M.; Chida, S.; Okada, S.; Tanaka, H.; Watanabe, K.; Chijimatsu, M.; Yamanaka, M.; Tohyama, H. Postural Stability and Muscle Activation Onset during Double-to Single-LegStanceTransitioninFlat-FootedIndividuals. J. Sports Sci. Med. 2020, 19, 662–669. [Google Scholar]
  13. Wojciechowska-Maszkowska, B.; Marcinów, R.; Iskra, J.; Tataruch, R. Postural Stability in Athletes during Special HurdleTests without a Definite Dominant Leg. Int. J. Environ. Res. Public Health 2020, 18, 172. [Google Scholar] [CrossRef]
  14. McIntyre, C.C.; Richardson, S.J.; Frankemolle, A.M.; Varga, G.; Noecker, A.M.; Alberts, J.L. Improving postural stability viacomputational modeling approach to deep brain stimulation programming. Annu. Int. Conf. IEEE Eng. Med. Biol. Soc. 2011, 2011, 675–676. [Google Scholar] [PubMed]
  15. Asgari, M.; Crouch, D.L. Estimating Human Upper Limb Impedance Parameters Froma State-of-the-Art Computational Neuromusculoskeletal Model. Annu. Int. Conf. IEEE Eng. Med. Biol. Soc. 2021, 2021, 4820–4823. [Google Scholar] [PubMed]
  16. Chopp-Hurley, J.N.; Langenderfer, J.E.; Dickerson, C.R. Probabilistic evaluation of predicted force sensitivity to muscle attachment and glenohumeral stability uncertainty. Ann. Biomed. Eng. 2014, 42, 1867–1879. [Google Scholar] [CrossRef]
  17. Mouchnino, L.; Robert, G.; Ruget, H.; Blouin, J.; Simoneau, M. Online control of anticipated postural adjustments in step initiation: Evidence from behavioral and computational approaches. Gait Posture 2012, 35, 616–620. [Google Scholar] [CrossRef]
  18. Vlamou, E.; Papadopoulos, B. Fuzzy logic systems and medical applications. AIMS Neurosci. 2019, 6, 266–272. [Google Scholar]
  19. Arani, L.A.; Sadoughi, F.; Langarizadeh, M. An Expert System to Diagnose Pneumonia Using Fuzzy Logic. Acta Inf. Med. 2019, 27, 103–107. [Google Scholar] [CrossRef]
  20. Thukral, S.; Rana, V. Versatility of fuzzy logic in chronic diseases: A review. Med. Hypotheses. 2019, 122, 150–156. [Google Scholar] [CrossRef]
  21. Farzandipour, M.; Nabovati, E.; Saeedi, S.; Fakharian, E. Fuzzy decision support systems to diagnose musculoskeletal disorders: A systematic literature review. Comput. Methods Programs Biomed. 2018, 163, 101–109. [Google Scholar] [CrossRef] [PubMed]
  22. Murugesan, G.; Ahmed, T.I.; Bhola, J.; Shabaz, M.; Singla, J.; Rakhra, M.; More, S.; Samori, I.A. Fuzzy Logic-Based Systemsfor the Diagnosis of Chronic Kidney Disease. Biomed. Res. Int. 2022, 2022, 2653665. [Google Scholar] [CrossRef]
  23. Ahmadi, H.; Gholamzadeh, M.; Shahmoradi, L.; Nilashi, M.; Rashvand, P. Diseases diagnosis using fuzzy logic methods: A systematic and meta-analysis review. Comput. Methods Programs Biomed. 2018, 161, 145–172. [Google Scholar] [CrossRef] [PubMed]
  24. Iancu, I. Heart disease diagnosis based on mediative fuzzy logic. Artif. Intell. Med. 2018, 89, 51–60. [Google Scholar] [CrossRef]
  25. Ahmedov, S.; Amirjanov, A. Genetic-fuzzy logic model for a non-invasive measurement of a stroke volume. Comput. Methods Programs Biomed. 2021, 203, 106046. [Google Scholar] [CrossRef]
  26. Dumitrescu, C.; Ciotirnae, P.; Vizitiu, C. Fuzzy Logic for Intelligent Control System Using Soft Computing Applications. Sensors 2021, 21, 2617. [Google Scholar] [CrossRef]
  27. Prokopowicz, P. The use of Ordered Fuzzy Numbers for modeling changes in dynamic processes. Inf. Sci. 2019, 470, 1–14. [Google Scholar] [CrossRef]
  28. Prokopowicz, P.; Golsefid, S.M.M. Aggregation Operatorfor Ordered Fuzzy Numbers Concerning the Direction. In ArtificialIntelligence and Soft Computing; ICAISC 2014. Lecture Notes in Computer Science; Rutkowski, L., Korytkowski, M., Scherer, R., Tadeusiewicz, R., Zadeh, L.A., Zurada, J.M., Eds.; Springer: Cham, Switzerland, 2014; Volume 8467. [Google Scholar]
  29. Prokopowicz, P.; Czerniak, J.; Mikołajewski, D.; Apiecionek, Ł.; Ślęzak, D. Theory and Applications of Ordered Fuzzy Numbers; Studies in Fuzziness and Soft Computing Book Series (STUDFUZZ); Springer: Berlin/Heidelberg, Germany, 2017; Volume 356. [Google Scholar]
  30. Li, Y.; Mache, M.A.; Todd, T.A. Automated identification of postural controlforchildrenwithautismspectrumdisorderusingamachinelearningapproach. J. Biomech. 2020, 113, 110073. [Google Scholar] [CrossRef]
  31. Li, Y.; Zhang, S.; Odeh, C. Automated Classification of Postural Control for Individuals with Parkinson’s Disease Usinga Machine Learning Approach: A Preliminary Study. J. Appl. Biomech. 2020, 1–6. [Google Scholar] [CrossRef]
  32. Brown, L.E. Isokinetics in Human Performance; Florida Atlantic University: Boca Raton, FL, USA, 2000. [Google Scholar]
  33. Szulc, A.; Buśko, K.; Sandurska, E.; Kołodziejczyk, M. The biomechanical characteristics of elite deaf and hearing female soccer players: Comparative analysis. Acta Bioeng. Biomech. 2017, 19, 127–133. [Google Scholar]
  34. Cometti, G.; Maffiuletti, N.A.; Pousson, M.; Chatard, J.-C.; Maffuli, N. Isokinetics strength and anaerobic power of elite, subelite and amateur French soccer players. Int. J. Sport. Med. 2001, 22, 45–51. [Google Scholar] [CrossRef] [PubMed]
  35. Fousekis, K.; Tsepis, E.; Vagenas, G. Lower limb strength in professional soccer players: Profile, asymmetry, and training age. J. Sport Sci. Med. 2010, 9, 364–373. [Google Scholar]
  36. Akbas, K.; Mummolo, C. A Computational Framework Towards the Tele-Rehabilitation of Balance Control Skills. Front. Robot AI 2021, 8, 648485. [Google Scholar] [CrossRef] [PubMed]
  37. Rosiak, O.; Puzio, A.; Kaminska, D.; Zwolinski, G.; Jozefowicz-Korczynska, M. Virtual Reality - A Supplement to Posturography or a Novel Balance Assessment Tool? Sensors 2022, 22, 7904. [Google Scholar] [CrossRef] [PubMed]
  38. Błaszczyk, J.W. The use of force-plate posturography in the assessment of postural instability. Gait Posture 2016, 44, 1–6. [Google Scholar] [CrossRef] [PubMed]
  39. Verdonk, C.; Trousselard, M.; Medani, T.; Vialatte, F.; Dreyfus, G. Probing the posture with machine learning provides physiological evidence supporting the enhanced body awareness hypothesis in trait mindfulness. Front. Physiol. 2022, 13, 915134. [Google Scholar] [CrossRef]
  40. Adkin, A.L.; Carpenter, M.G. New insights on emotional contributions to human postural control. Front. Neurol. 2018, 9, 789. [Google Scholar] [CrossRef]
Figure 1. The structure of the hierarchy of fuzzy system.
Sensors 23 01117 g001
Table 1. Characteristics of the patients studied.
ParameterGroup 1
Deaf Soccer Players
(n = 28)
Group 2
Hearing
Soccer Players
(n = 19)
Group 3
Deaf Untrained
(n = 46)
Age [years]
  Mean20.0019.6321.89
  SD3.501.954.40
  Min171717
  Q1181818
  Median191922
  Q3212125
  Max302332
Body height [cm]
  Mean175.36172.96179.63
  SD4.139.436.01
  Min166.80151.30165.00
  Q1172.60167.10175.60
  Median174.80173.50179.40
  Q3178.50180.10184.20
  Max184.60191.70190.00
Shin length [cm]
  Mean38.5538.4539.56
  SD1.802.182.62
  Min33.5035.5034.80
  Q137.5036.5038.00
  Median38.0037.8039.60
  Q340.0040.0041.50
  Max42.0043.1044.50
Body mass [kg]
  Mean70.1966.7173.67
  SD9.6317.138.38
  Min57.7041.6060.10
  Q164.4055.8067.90
  Median68.2062.9074.30
  Q375.4075.4078.80
  Max92.90103.3094.50
Dominant leg
  L4 (14.29%)3 (15.79%)7 (15.22%)
  R24 (85.71%)16 (84.21%)39 (84.78%)
Legend: SD—Standard Deviation, Min—Minimum, Q1—Lower Quartile, Median, Q3—Upper Quartile, Max—Maximum, L—Left, R—Right.
Table 2. The configuration of data intervals—base for the fuzzy system definition.
ParameterLow ValuesMedium ValuesHigh ValuesLinguistic Interpretation
Isokinetic mode 60 deg/s
R AGON/ANTAG0–5045–6560–100the medium values are good, but low and high are bad
L AGON/ANTAG0–5045–6560–100the medium values are good, but low and high are bad
R PEAKTQ/BM AWY0–1.21.0–2.42.3–4.5the more, the better
L PEAKTQ/BM AWY0–1.21.0–2.42.3–4.5the more, the better
R PEAKTQ/BM TWD0–0.80.7–1.51.4–3.0the more, the better
L PEAKTQ/BM TWD0–0.80.7–1.51.4–3.0the more, the better
Isokinetic mode 180 deg/s
R AGON/ANTAG0–5045–6560–100the medium values are good, but low and high are bad
L AGON/ANTAG0–5045–6560–100the medium vales are good, but low and high are bad
R PEAKTQ/BM AWY0–0.900.8–1.71.6–3.0the more, the better
L PEAKTQ/BM AWY0–0.900.8–1.71.6–3.0the more, the better
R PEAKTQ/BM TWD0–0.70.6–1.31.2–3.0the more, the better
L PEAKTQ/BM TWD0–0.70.6–1.31.2–3.0the more, the better
Isokinetic mode 300 deg/s
R AGON/ANTAG0–6055–9085–150the medium values are good, but low and high are bad
L AGON/ANTAG0–6055–9085–150the medium values are good, but low and high are bad
R PEAKTQ/BM AWY0–0.70.60–1.301.20–2.8the more, the better
L PEAKTQ/BM AWY0–0.70.60–1.301.20–2.8the more, the better
R PEAKTQ/BM TWD0–0.70.60–1.301.20–2.8the more, the better
L PEAKTQ/BM TWD0–0.70.60–1.301.20–2.8the more, the better
Table 3. Fuzzy model outcomes for studied Group 1.
No. of Participant/ParameterValue
10.76734109
20.65589328
30.64234552
40.69709596
50.73758406
60.68142442
70.60856813
80.60663099
90.53337415
100.65551133
110.60379564
120.67940767
130.6983585
140.75756501
150.74477273
160.74373664
170.69312008
180.64302757
190.64844364
200.71791784
210.6558216
220.62666147
230.6727858
240.70166569
250.73768627
260.65344389
270.61765752
280.74812219
Mean0.67606281
SD (Standard Deviation)0.0565327
Min0.53337415
Q1 (Lower quartile)0.64285706
Median0.67609673
Q3 (Upper quartile)0.7228344
Max0.76734109
Table 4. Fuzzy model outcomes for studied Group 2.
No. of Participant/ParameterValue
10.56585384
20.64469192
30.54099616
40.61011369
50.56910691
60.58987825
70.56994588
80.5731141
90.56502047
100.61102068
110.54596697
120.61948461
130.62375196
140.66939015
150.575458
160.58376321
170.59714431
180.59057348
190.58581099
Mean0.59110977
SD (Standard Deviation)0.03258833
Min0.54099616
Q1 (Lower quartile)0.5695264
Median0.58581099
Q3 (Upper quartile)0.61056719
Max0.66939015
Table 5. Fuzzy model outcomes for studied Group 3.
No. of Participant/ParameterValue
10.80400957
20.76927435
30.62282284
40.74328593
50.74373664
60.70207034
70.64074447
80.73227387
90.70003183
100.72986779
110.70734059
120.69860786
130.65737016
140.66614456
150.69351383
160.67523309
170.68521024
180.66333946
190.71704625
200.67574448
210.70851757
220.74564416
230.68427606
240.64150353
250.71149862
260.6788365
270.68999421
280.72515522
290.61814783
300.7283098
310.70268278
320.60633094
330.61681826
340.64672526
350.67162273
360.73704441
370.69031519
380.6860709
390.77480748
400.73948592
410.82803729
420.75687176
430.65334806
440.65969457
450.69795882
460.77084335
Mean0.69996107
SD (Standard Deviation)0.0490296
Min0.60633094
Q1 (Lower quartile)0.6675141
Median0.69828334
Q3 (Upper quartile)0.73167235
Max0.82803729
Disclaimer/Publisher’s Note: The statements, opinions and data contained in all publications are solely those of the individual author(s) and contributor(s) and not of MDPI and/or the editor(s). MDPI and/or the editor(s) disclaim responsibility for any injury to people or property resulting from any ideas, methods, instructions or products referred to in the content.

