

In Situ Water Quality Monitoring Using an Optical Multiparameter Sensor Probe

Abstract
:1. Introduction

| Parameter | Wavelength | Proxy For | Calibrant | Ref. |
|---|---|---|---|---|
| Fluorescence Spectroscopy | ||||
| Tryptophan-like fluorescence (TLF) | λex = 280 nm λem = 365 nm | biological activity, microbial contamination with | L-Tryptophan | [21] |
| Humic-like fluorescence (HLF) | λex = 280 nm λem = 450 nm | autochthonous (within stream algal and microbial activity) and allochthonous (soil-derived organic matter) generation of small colloidal and dissolved organic matter | Quinine sulfate | [22] |
| Fluorescent DOM (FDOM) | λex = 325 nm λem = 470 nm | total DOC concentration | Quinine sulfate | [23] |
| Chlorophyll a (f-Chl a) | λex = 430 (470) nm λem = 675–750 nm | biomass of algae | Dyes, pure or extracted Chlorophyll a | [24] |
| Phycocyanin (f-PC) | λex = 590 nm λem = 640–690 nm | biomass of cyanobacteria | Phycocyanin | [25] |
| Fluorescence index (FI) | λex = 370 nm λem = 470 and 520 nm | microbial (high FI~1.8) or terrestrial (low FI~1.2) source of DOM | [26] | |
| Scattered light measurement | ||||
| Turbidity | portion of light scattered at angle 90° from the incident beam (λ > 800 nm) | loss of clarity in water | Formazin turbidity standard | [27] |
| UV/Vis spectroscopy | ||||
| Nitrate | A217–240 nm | eutrophication of freshwater ecosystems | NO3-N | [7] |
| Spectral absorption coefficient (SAC254) | A254 nm | organic loads of water | [9,28] | |
| Colored dissolved organic matter (CDOM) | A254 nm or A370 nm | colored and photoactive fraction of DOM | [29,30] | |
| Chemical oxygen demand (COD) | A225–260 nm | pollution of water by reducing substances’ | [31] | |
| Phycocyanin (PC) | A615 nm and A652 nm | cyanobacterial components | [32] | |
| Turbidity | A>800 nm | loss of clarity in water | Formazin turbidity standard | [27] |
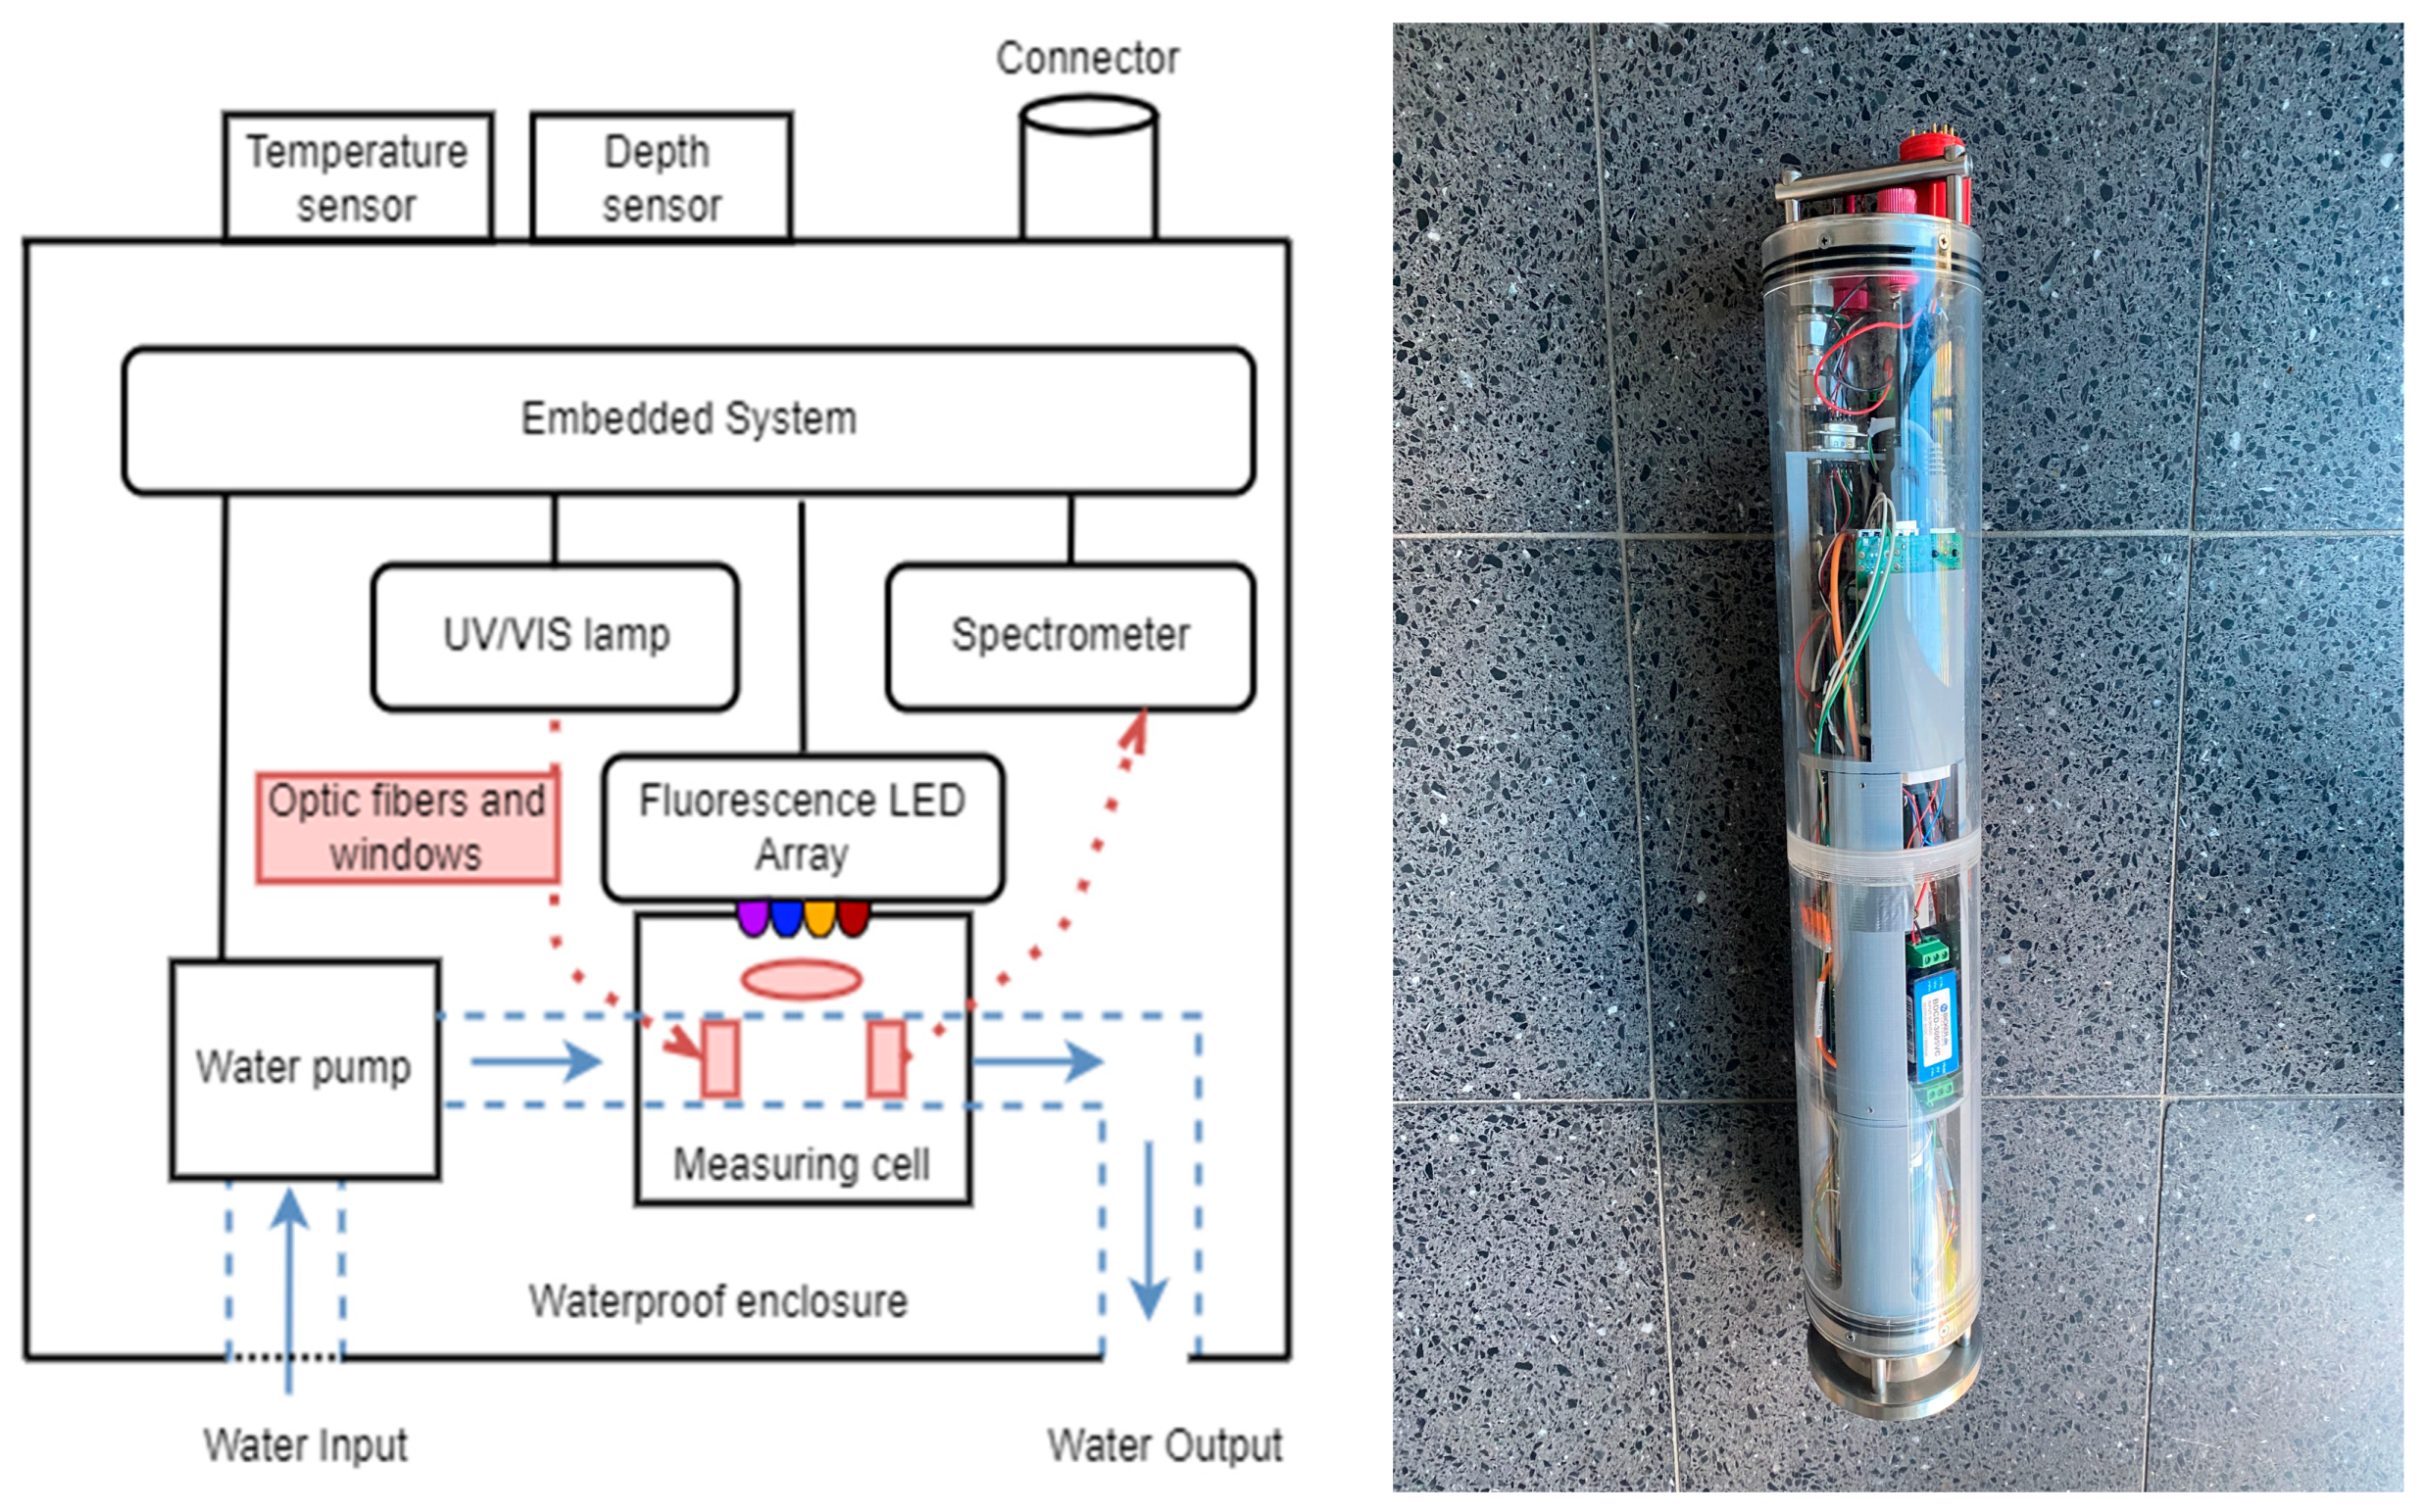
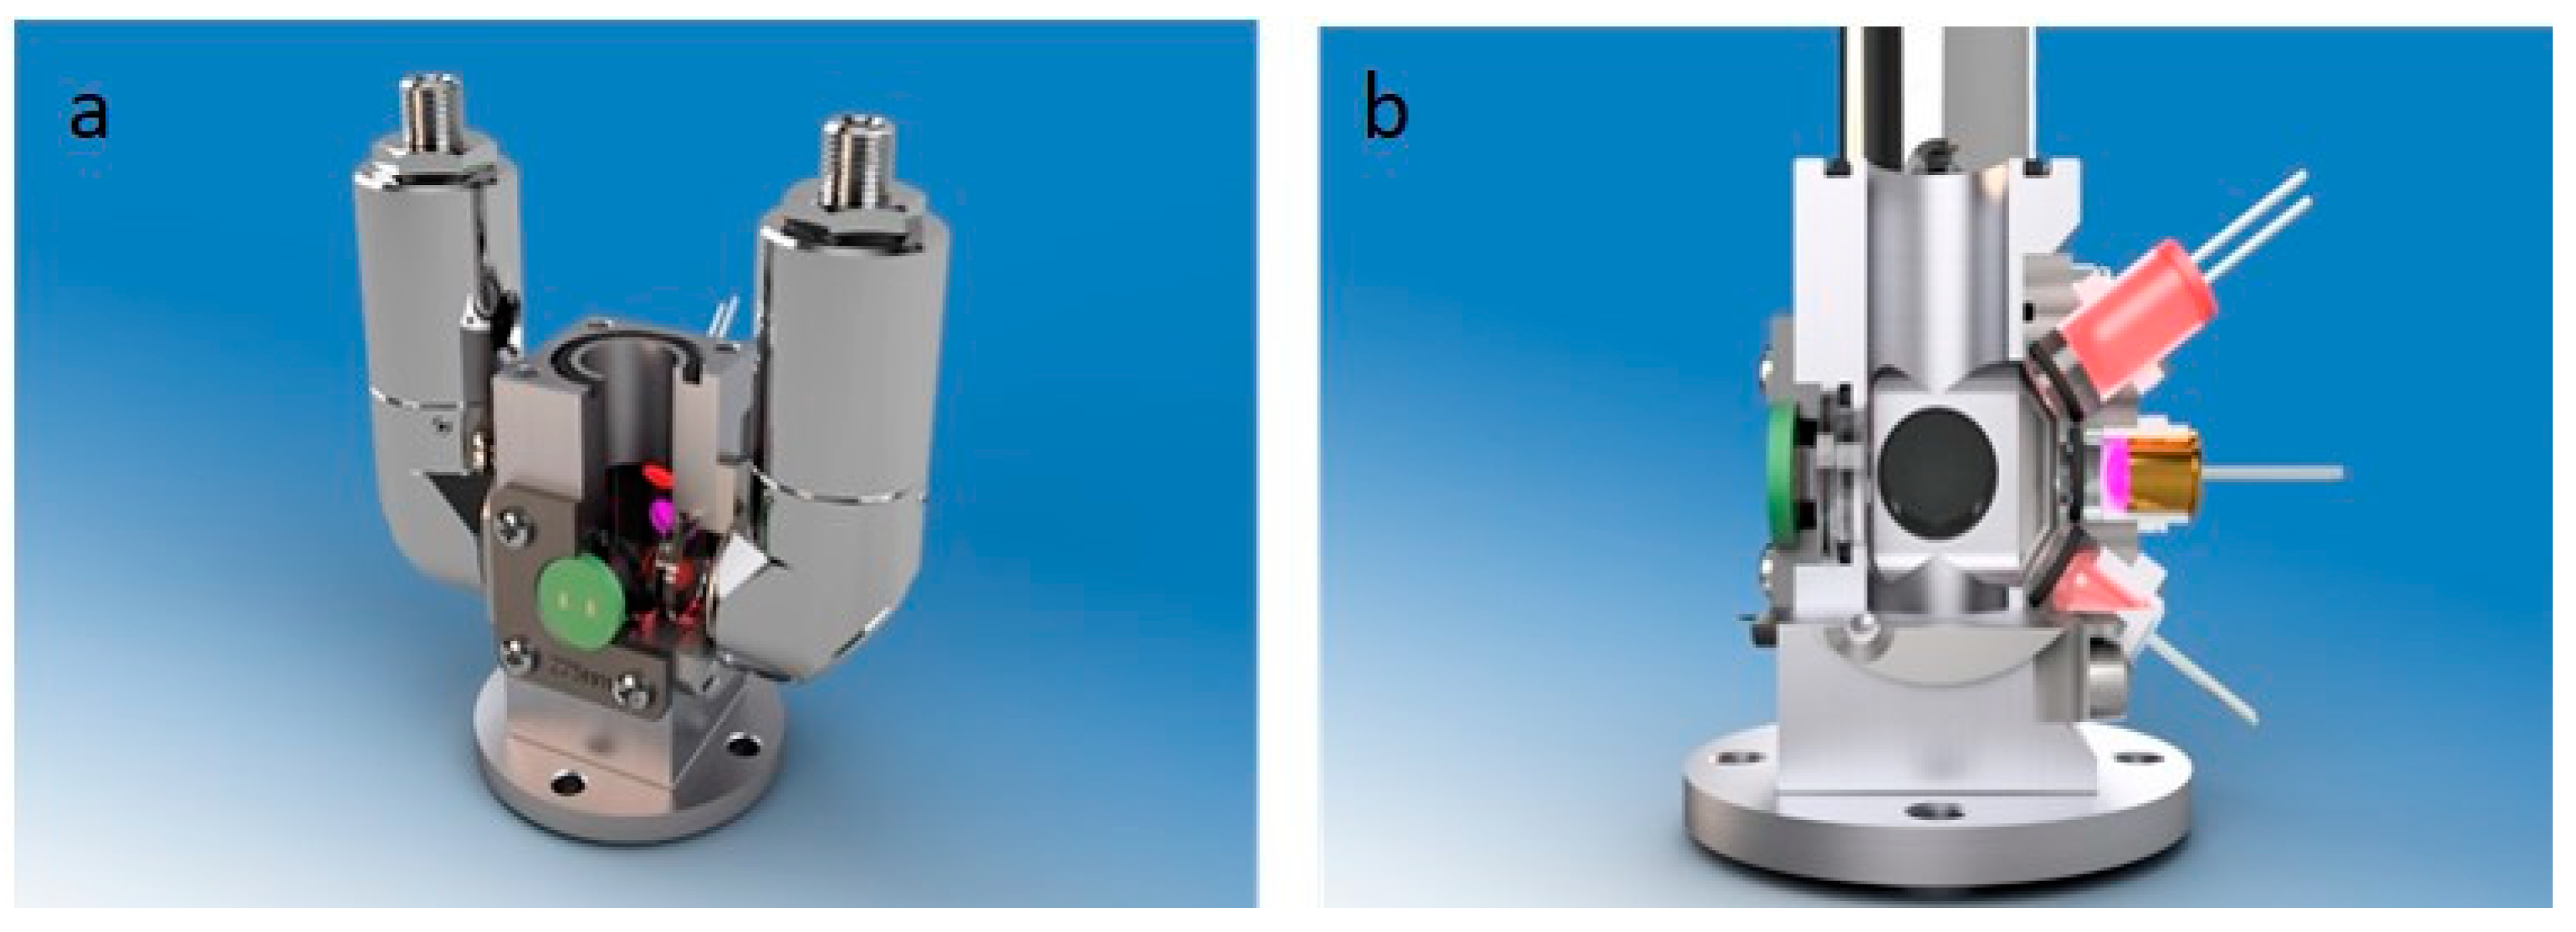
- Synchronous data acquisition: UV/Vis and fluorescence measurements can be an-alyzed in one step. The absorbance measurement is made in a 180° configuration while fluorescence emission is measured in 90° geometry. The path length of the measurement cell is 10 mm. The water sample is pumped through the measuring cell. Due to its position inside the sensor probe, external interfering influences were minimized. The spectrometer permits detection over the entire wavelength range.
- Adaptable hardware configuration: To adapt the sensor probe to different aquatic conditions, the sensor configuration can be easily changed. This includes the replacement of light sources and the adjustment of their intensities. The operational conditions of the spectrometer and the integration parameters can also be easily changed.
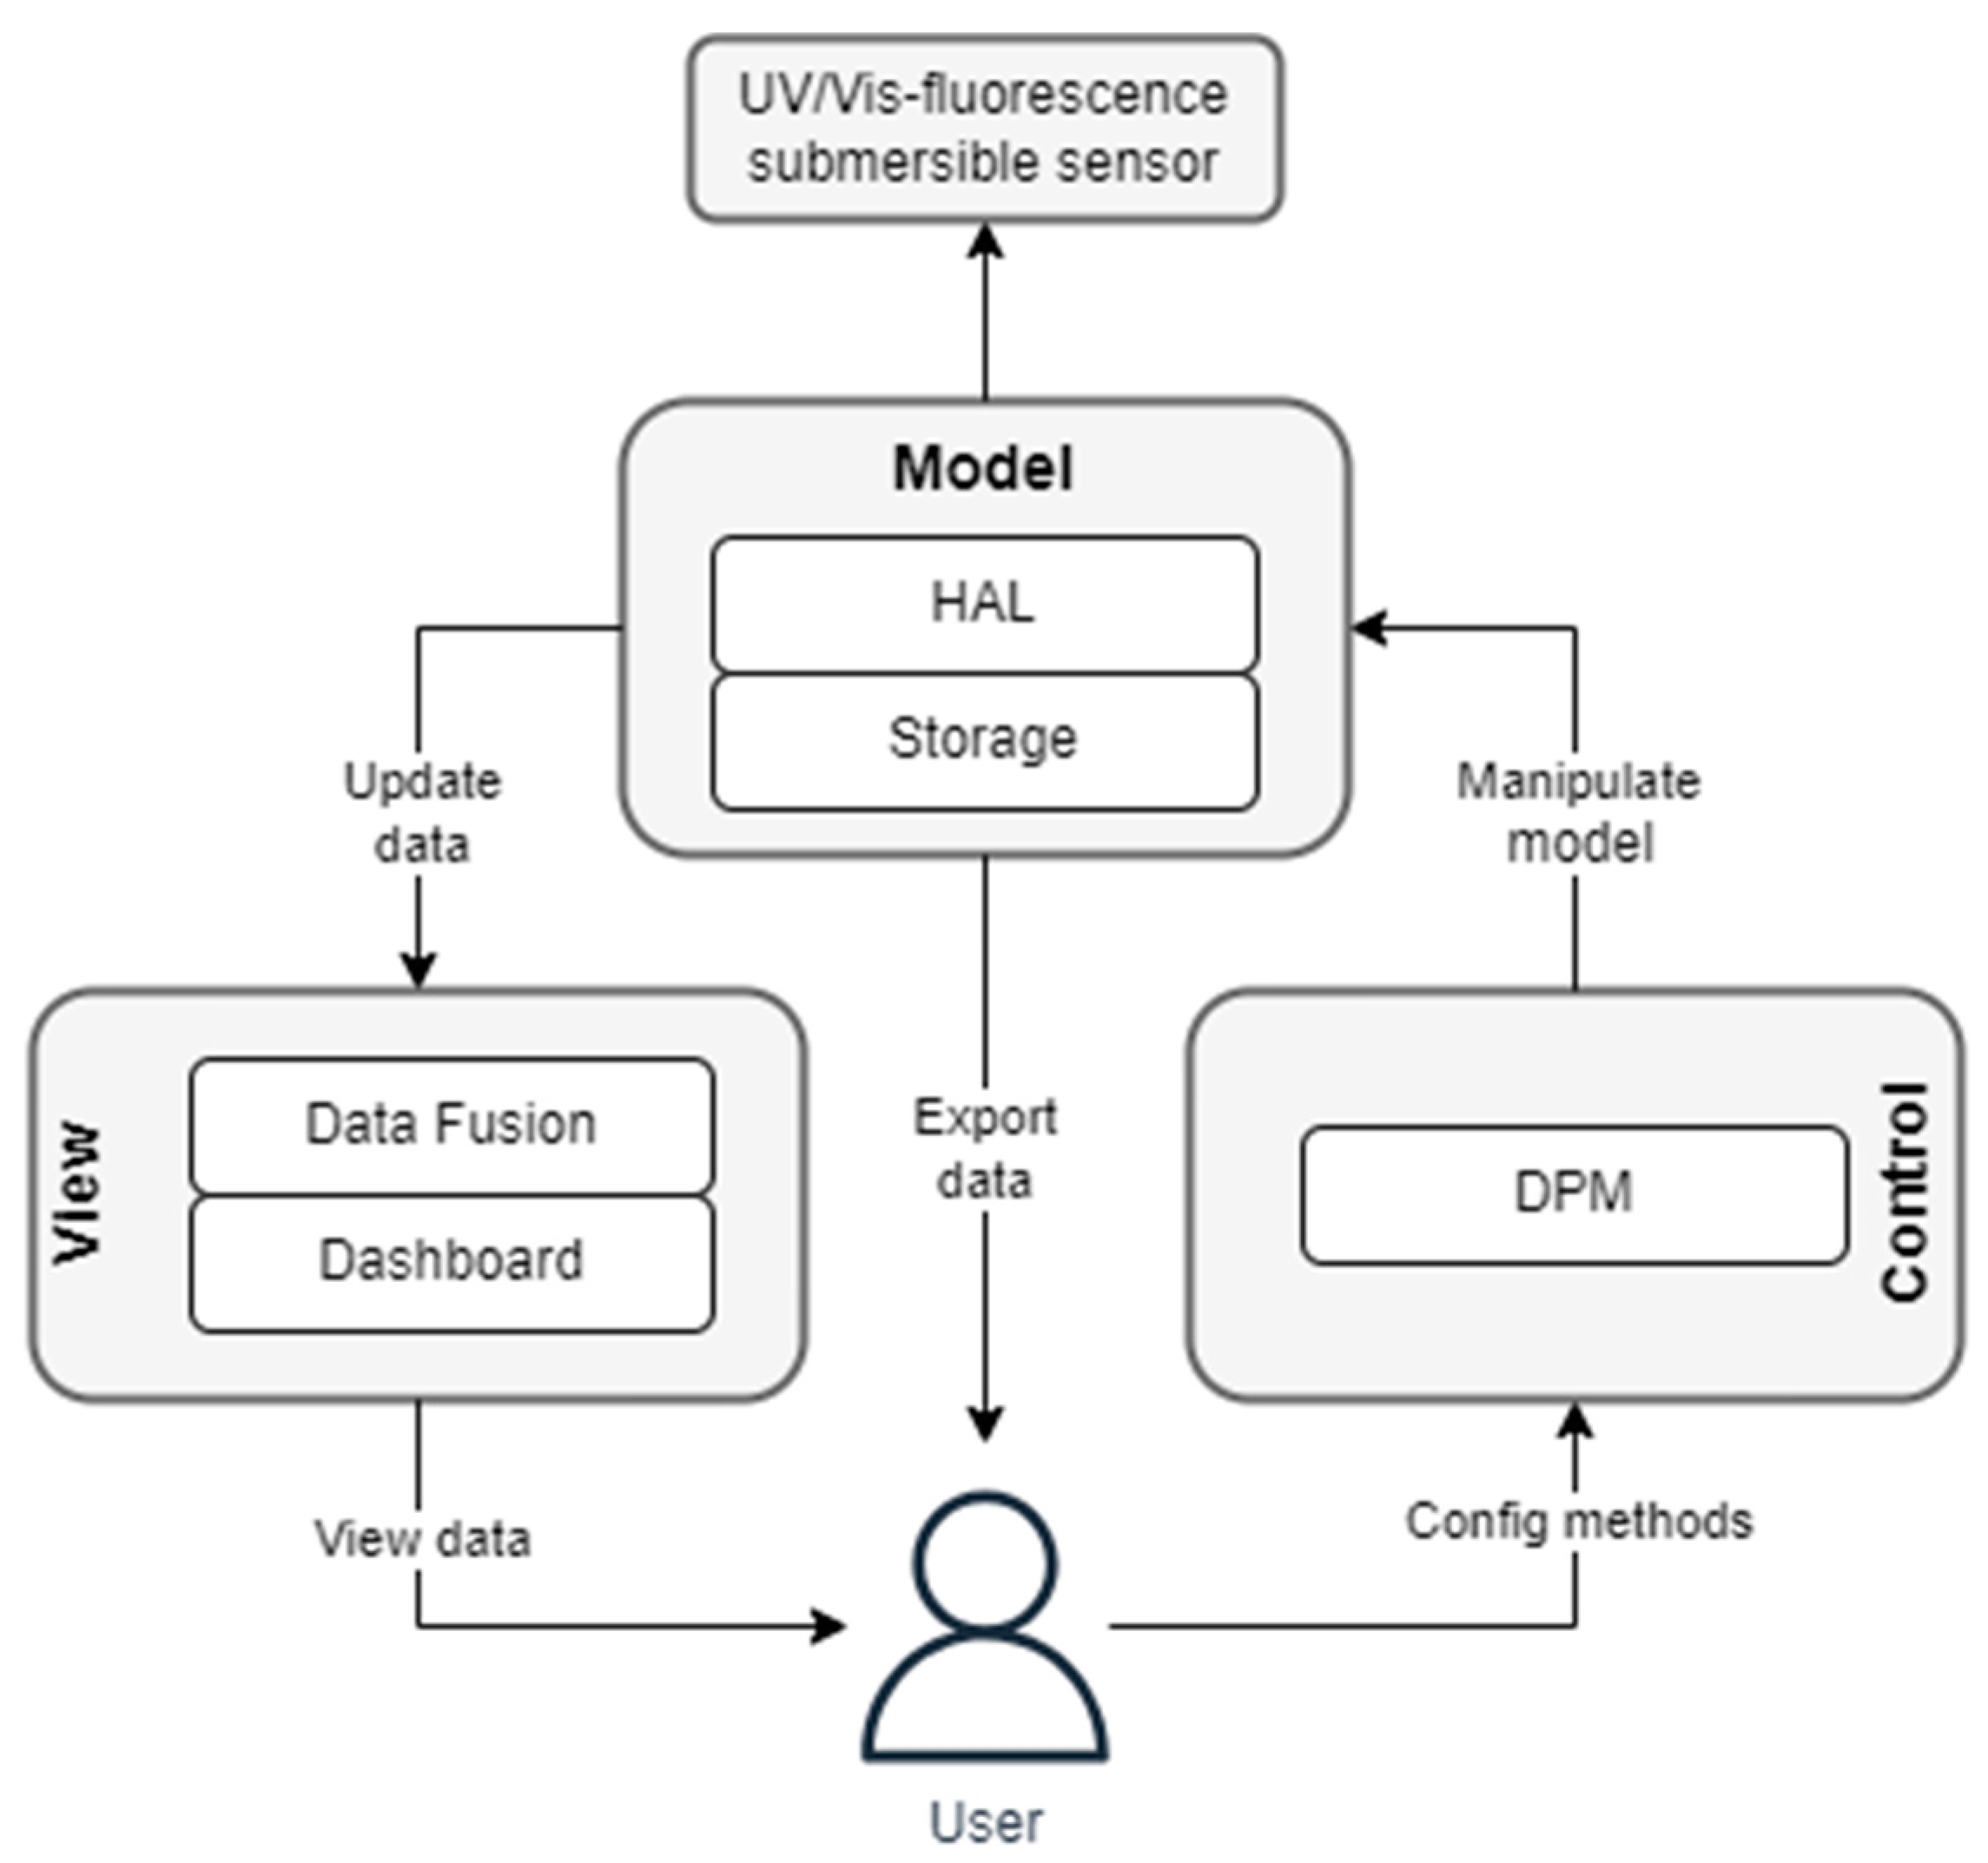
- Open data processing platform: The integrated processing platform facilitates the further handling and fusion of the spectral data (quantification, turbidity compensation, qualitative and quantitative assessment of water quality information). All data are available and adjustable for users at each level of processing.
- Open Data Model: Processed data, measurement methods and metainformation are stored in a holistic structure. All these data can be transferred by the user.
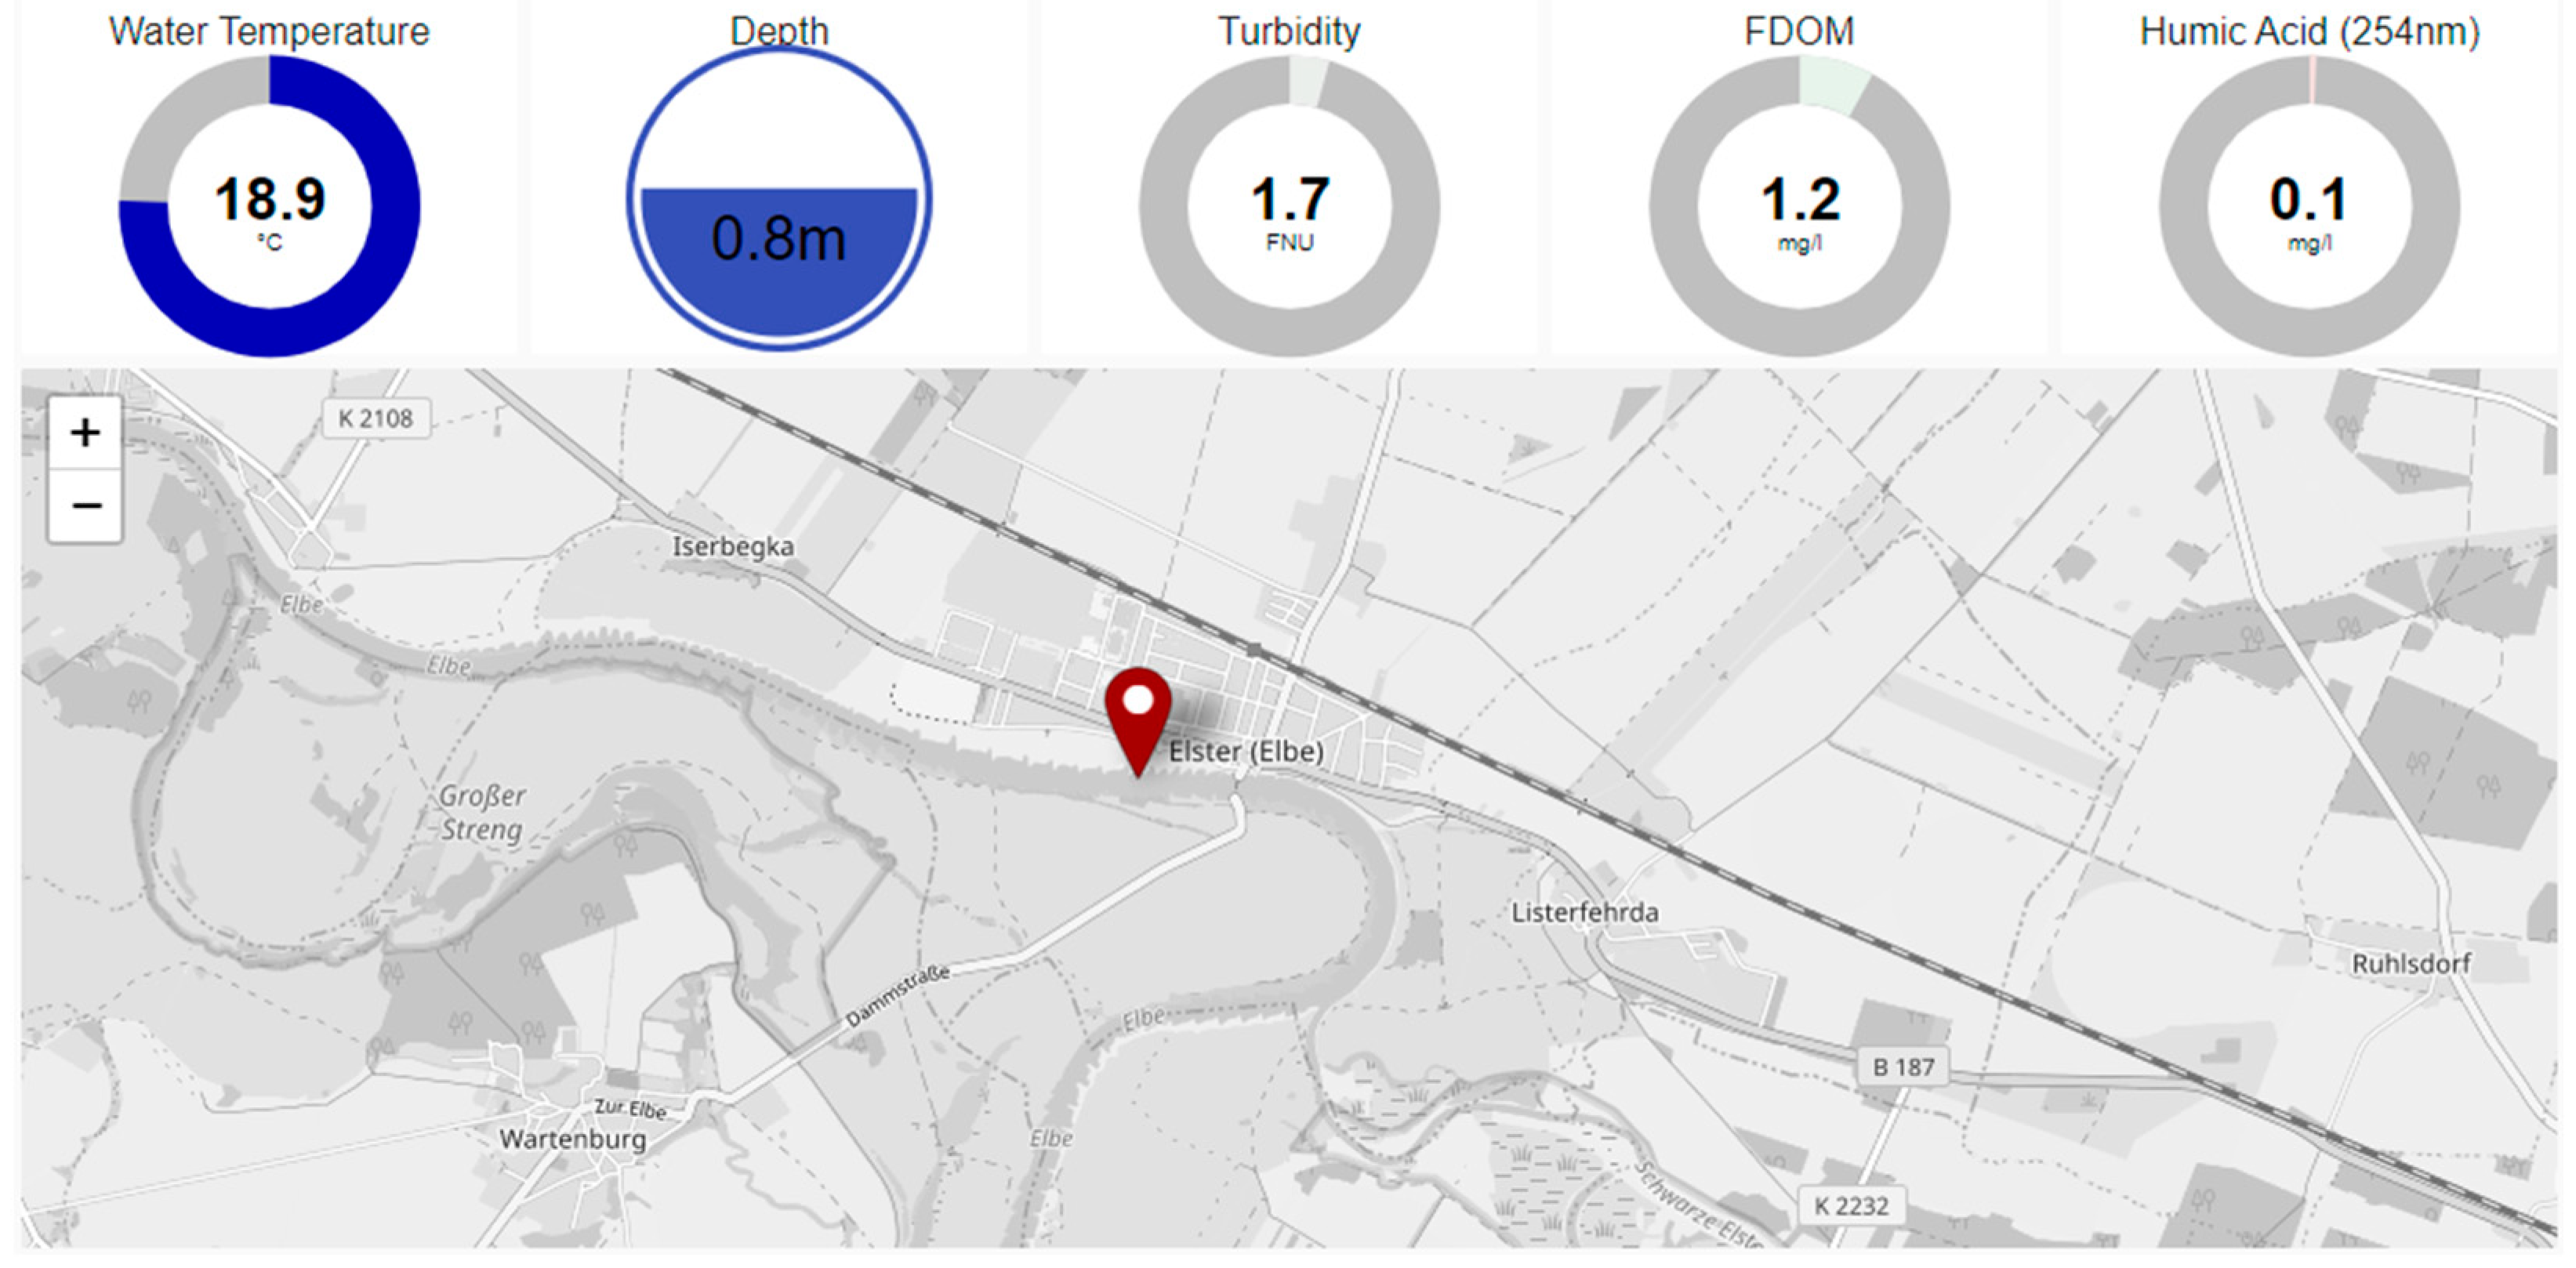
- Data visualization: The data are displayed in real time on a dashboard for analysis and pattern identification.
- Remote control: A specially programmed app enables access to the sensor probe. It allows the monitoring of operating status, the definition of measurement intervals and times, as well as the execution of functional tests on the light sources. Furthermore, the app shows quantitative results of predefined analytes.
2. Materials and Methods
2.1. Design and Development of the UV/Vis–Fluorescence Submersible Sensor Probe
2.1.1. Hardware Development
2.1.2. Software Development
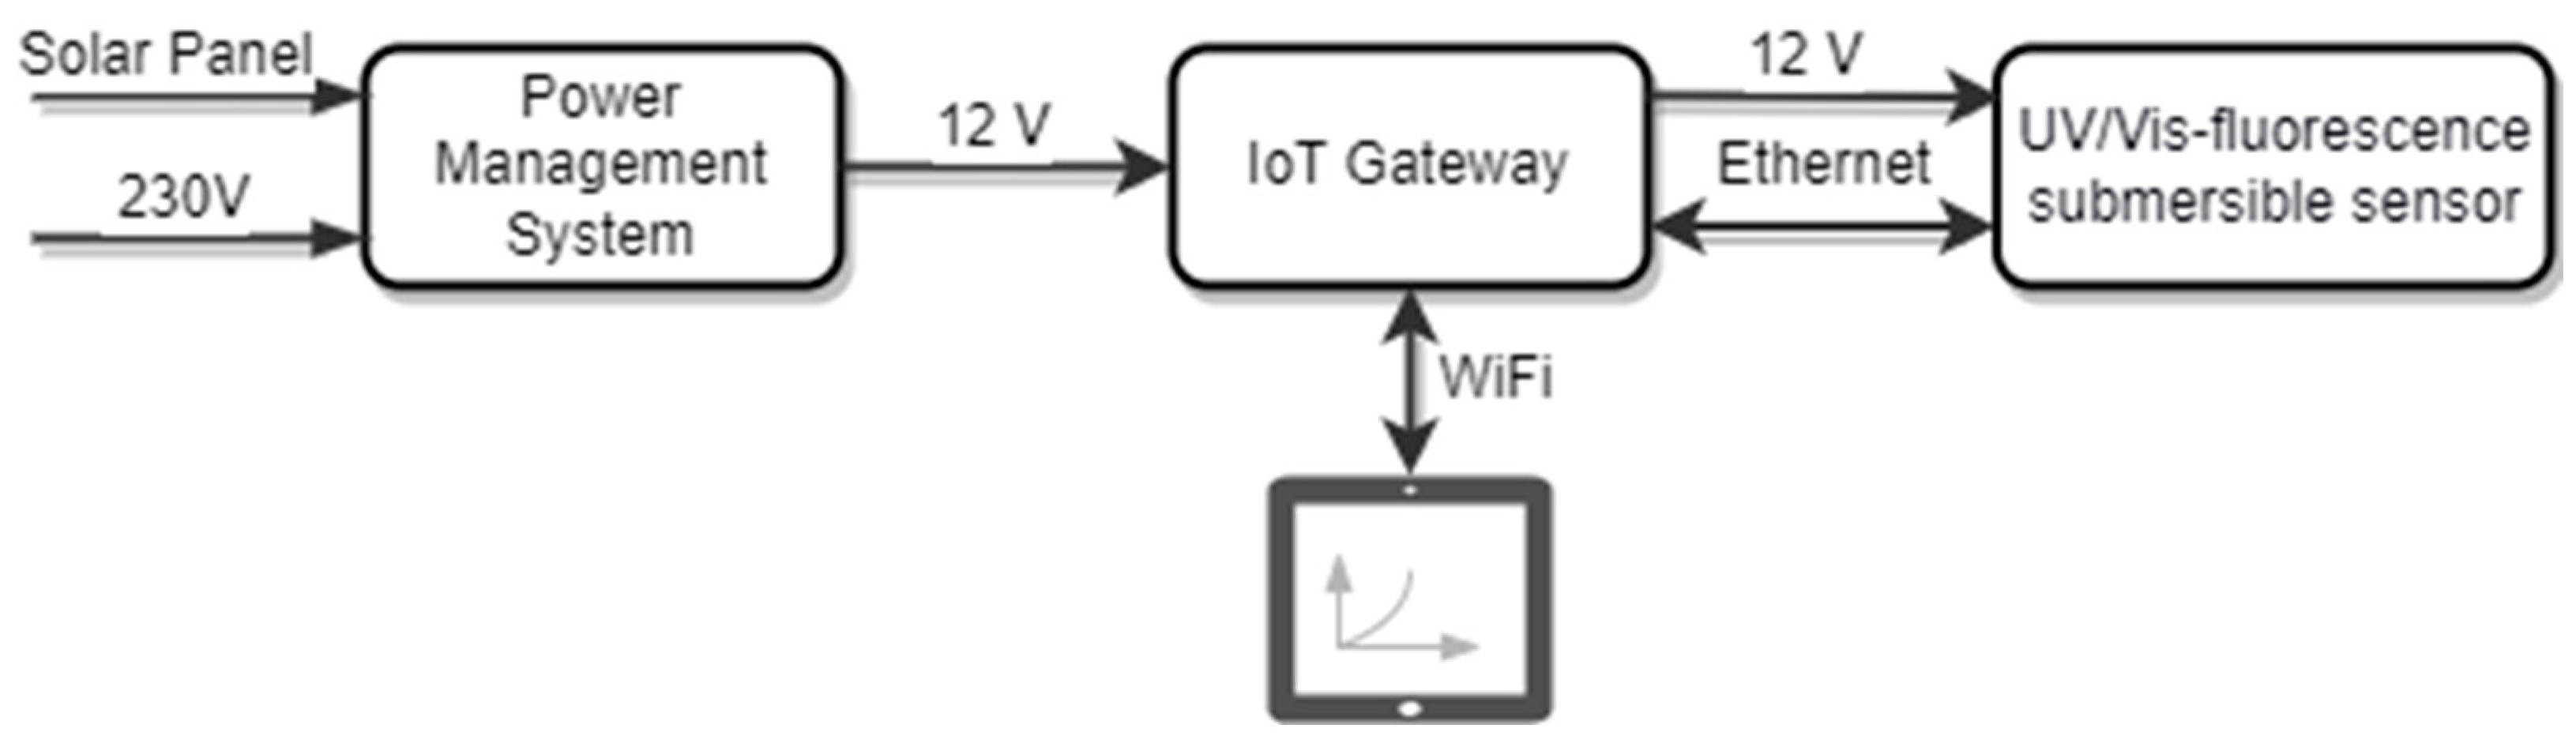
2.1.3. Field Application Setup
2.2. Lab Validation
2.2.1. Preparation of Water Samples
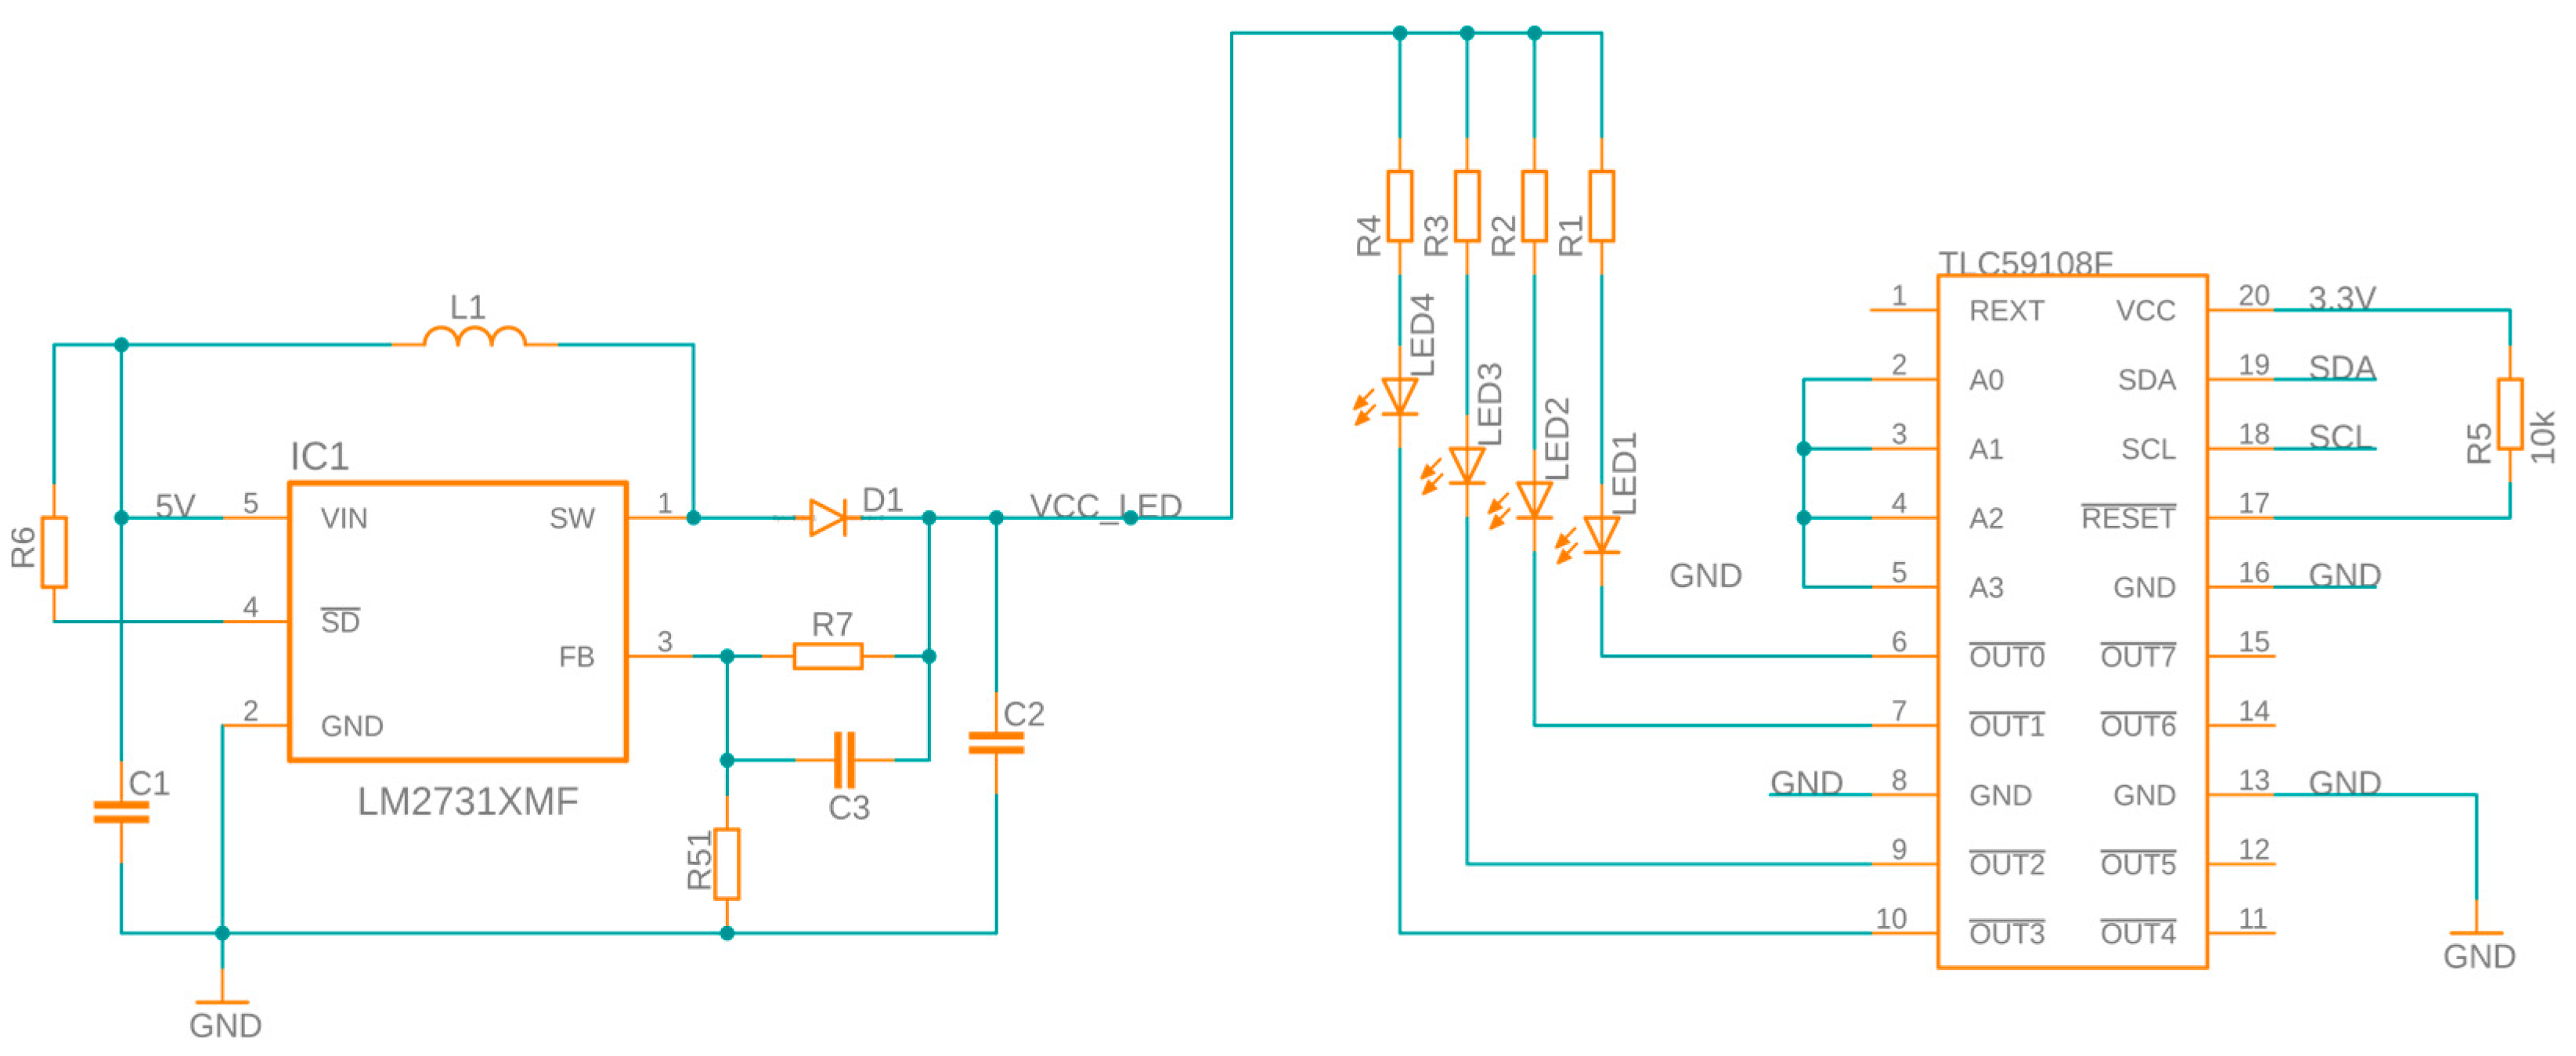
2.2.2. LED Array Configuration
2.2.3. Data Collection and Data Processing
3. Results
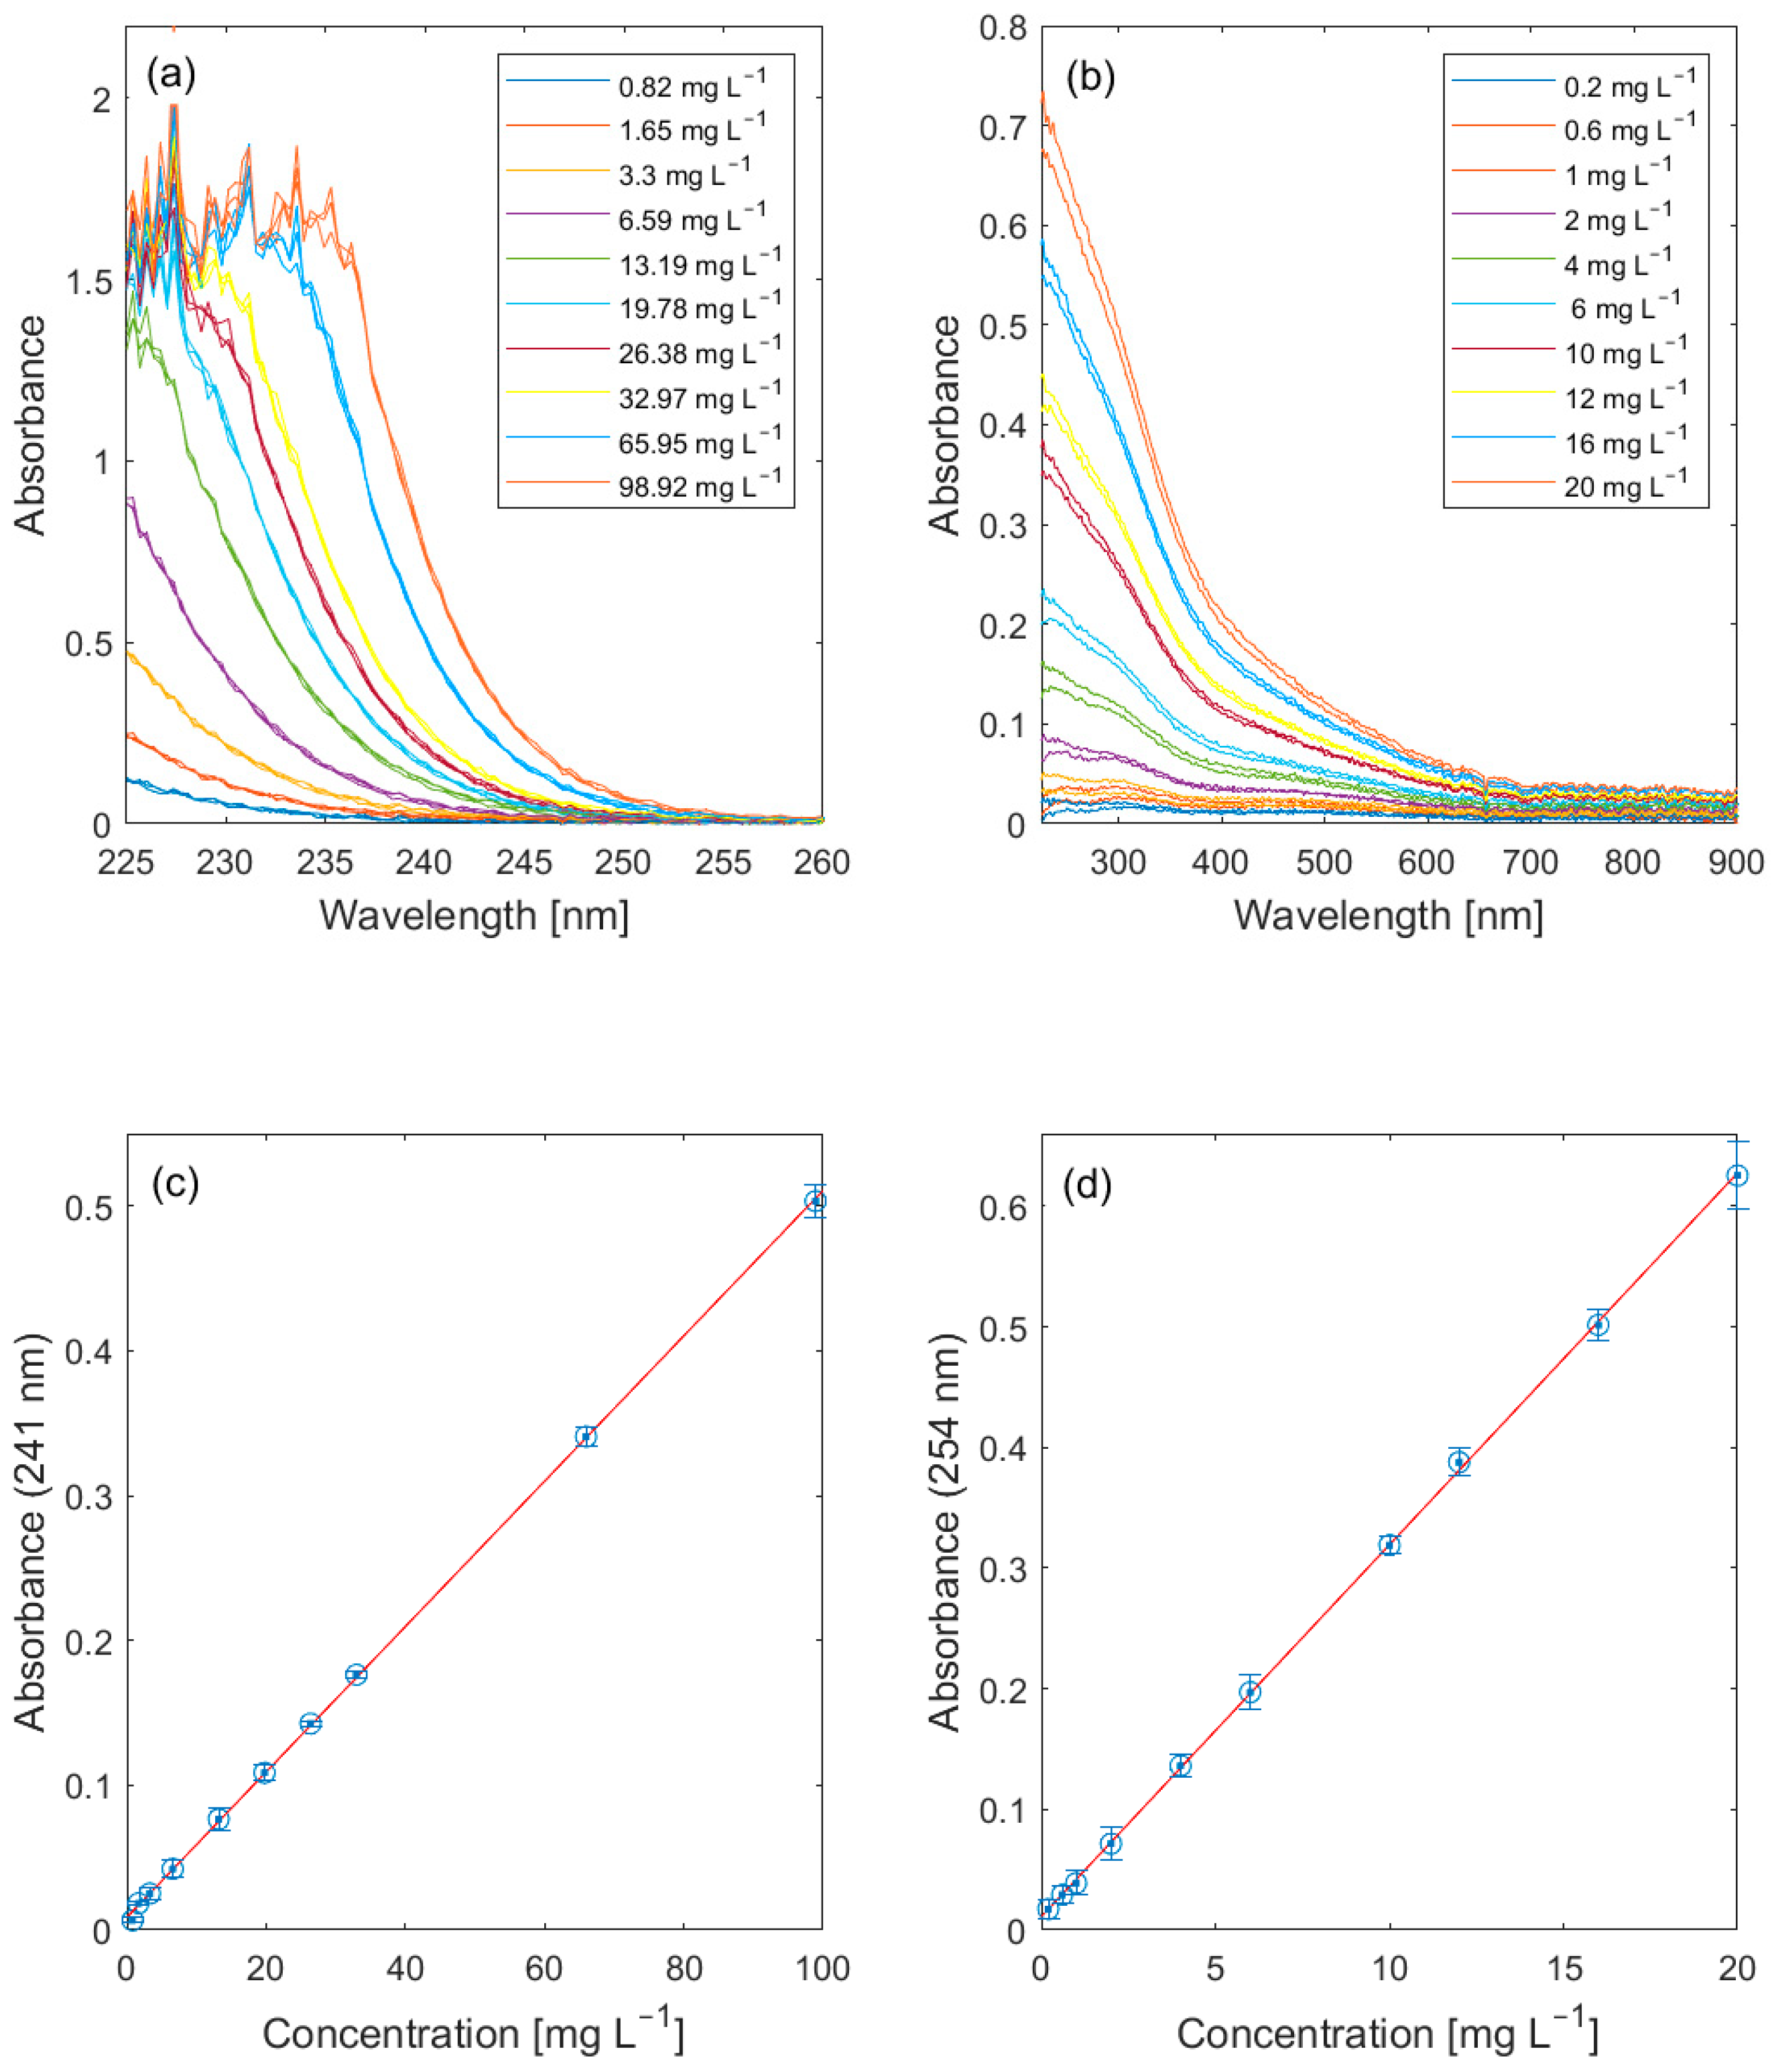
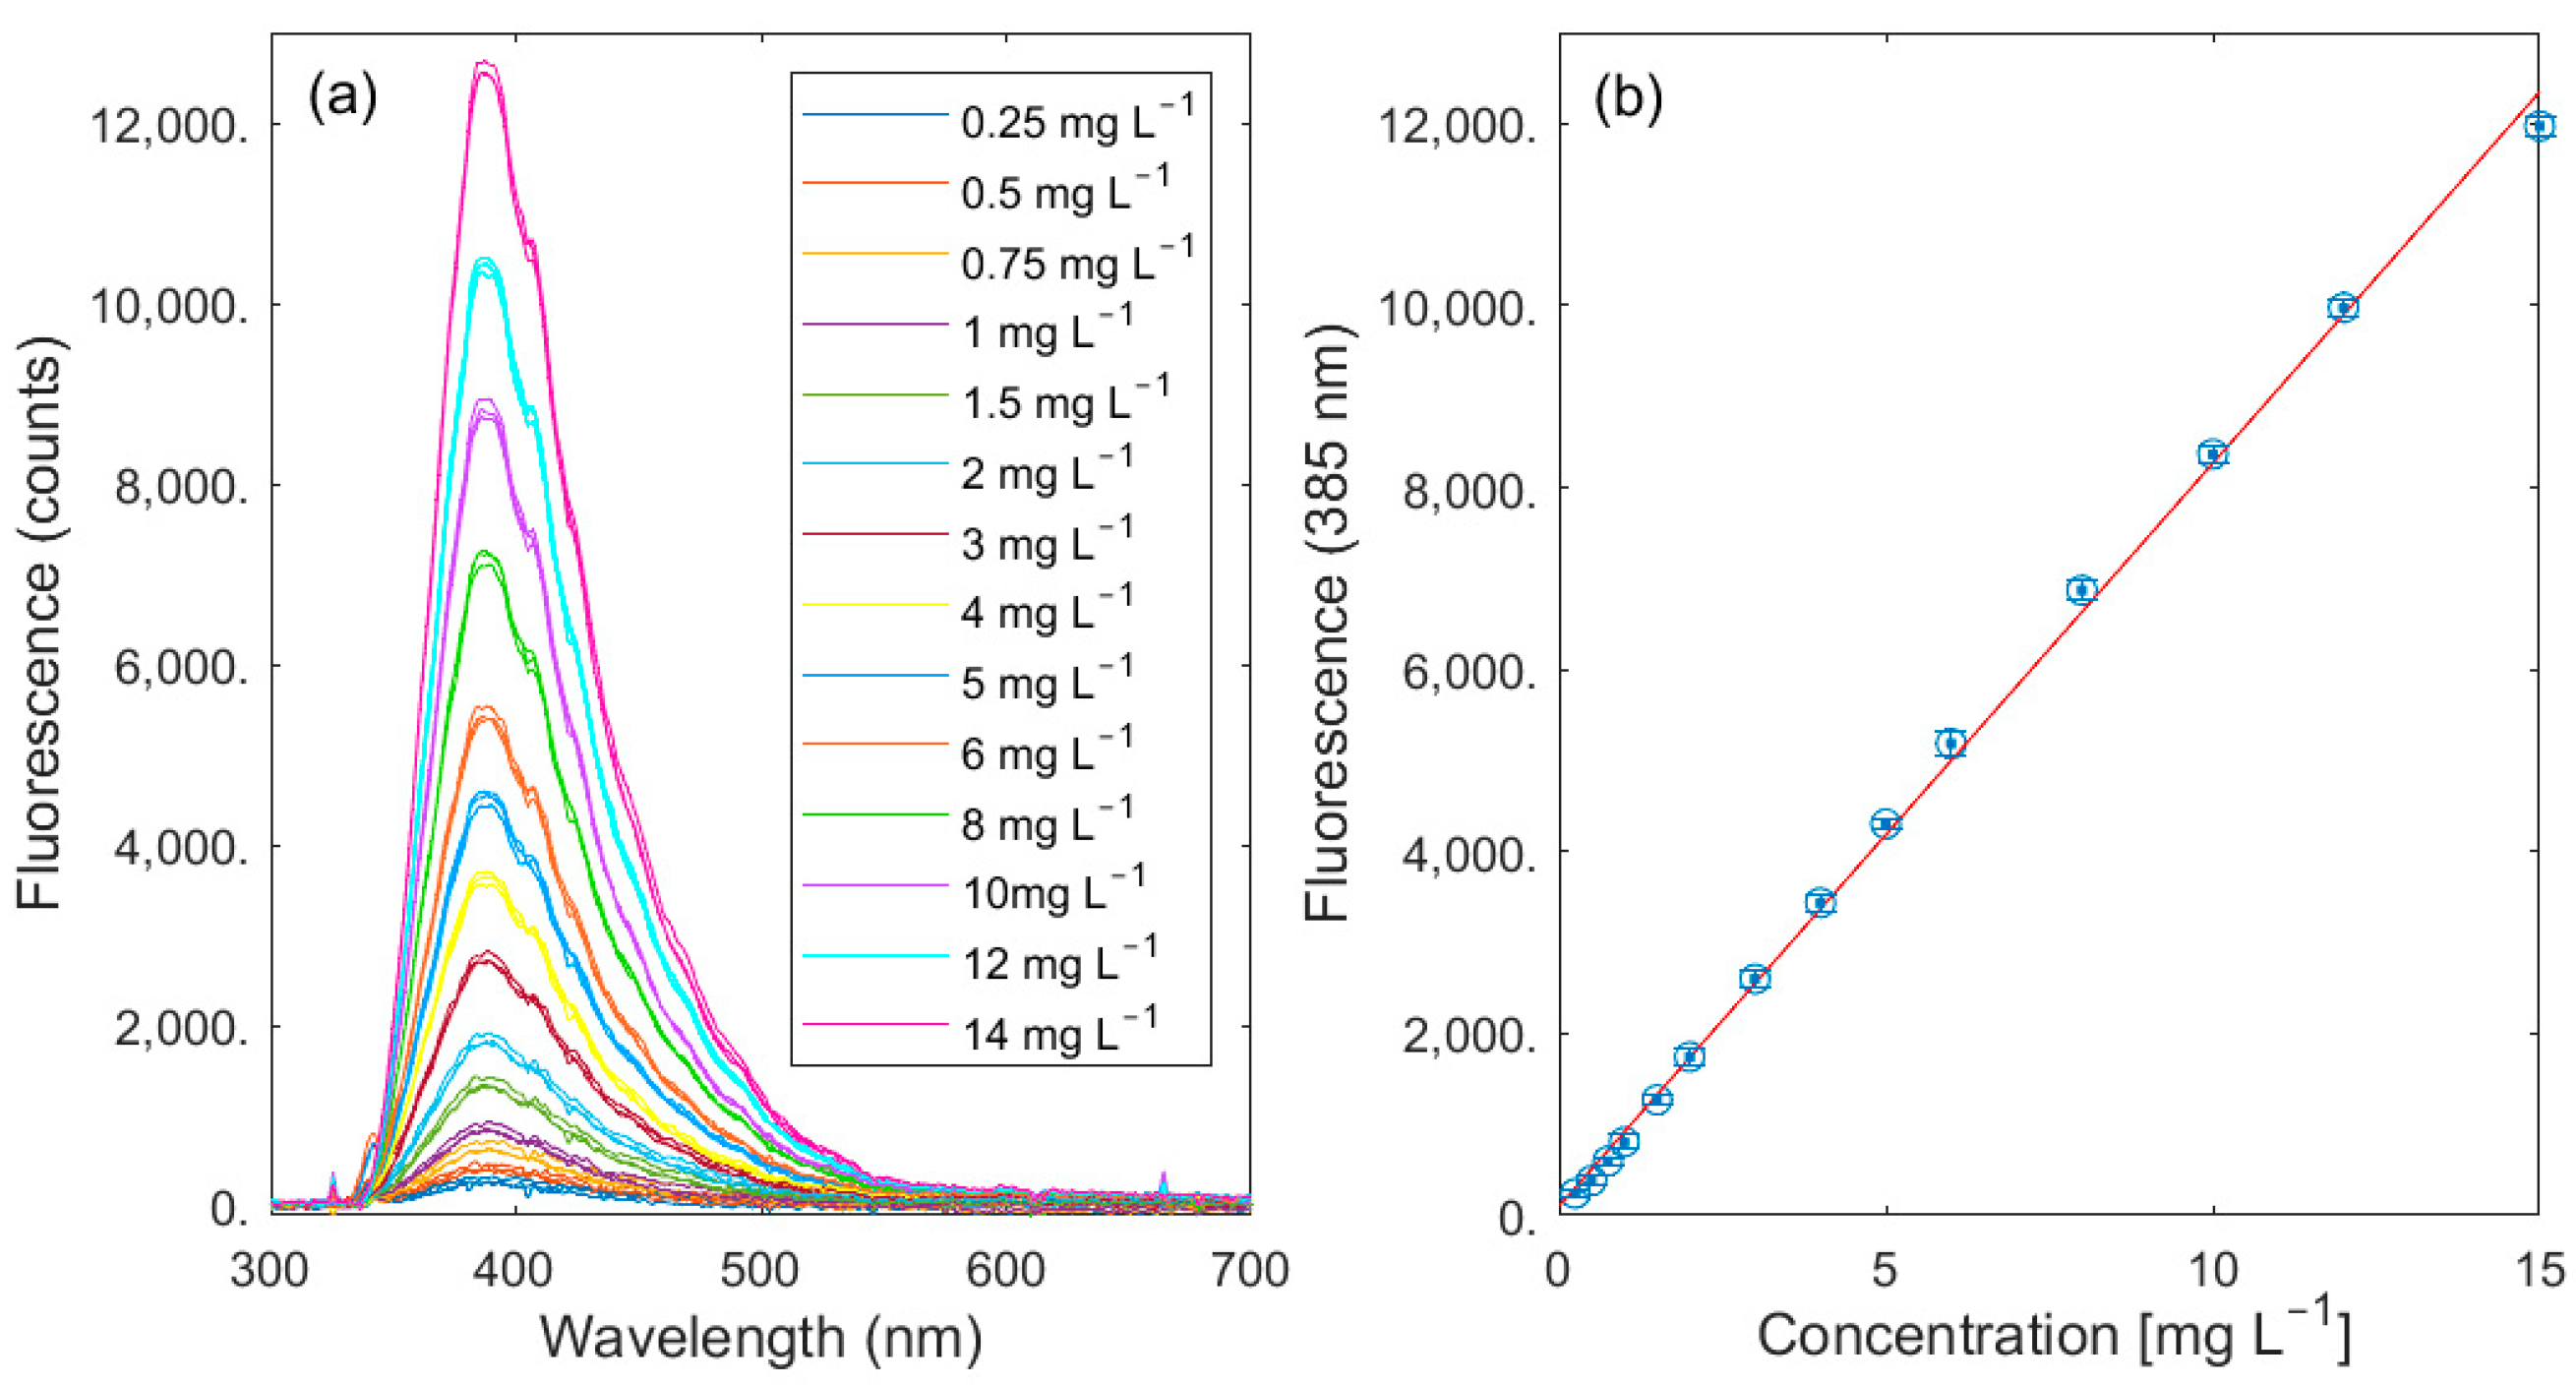
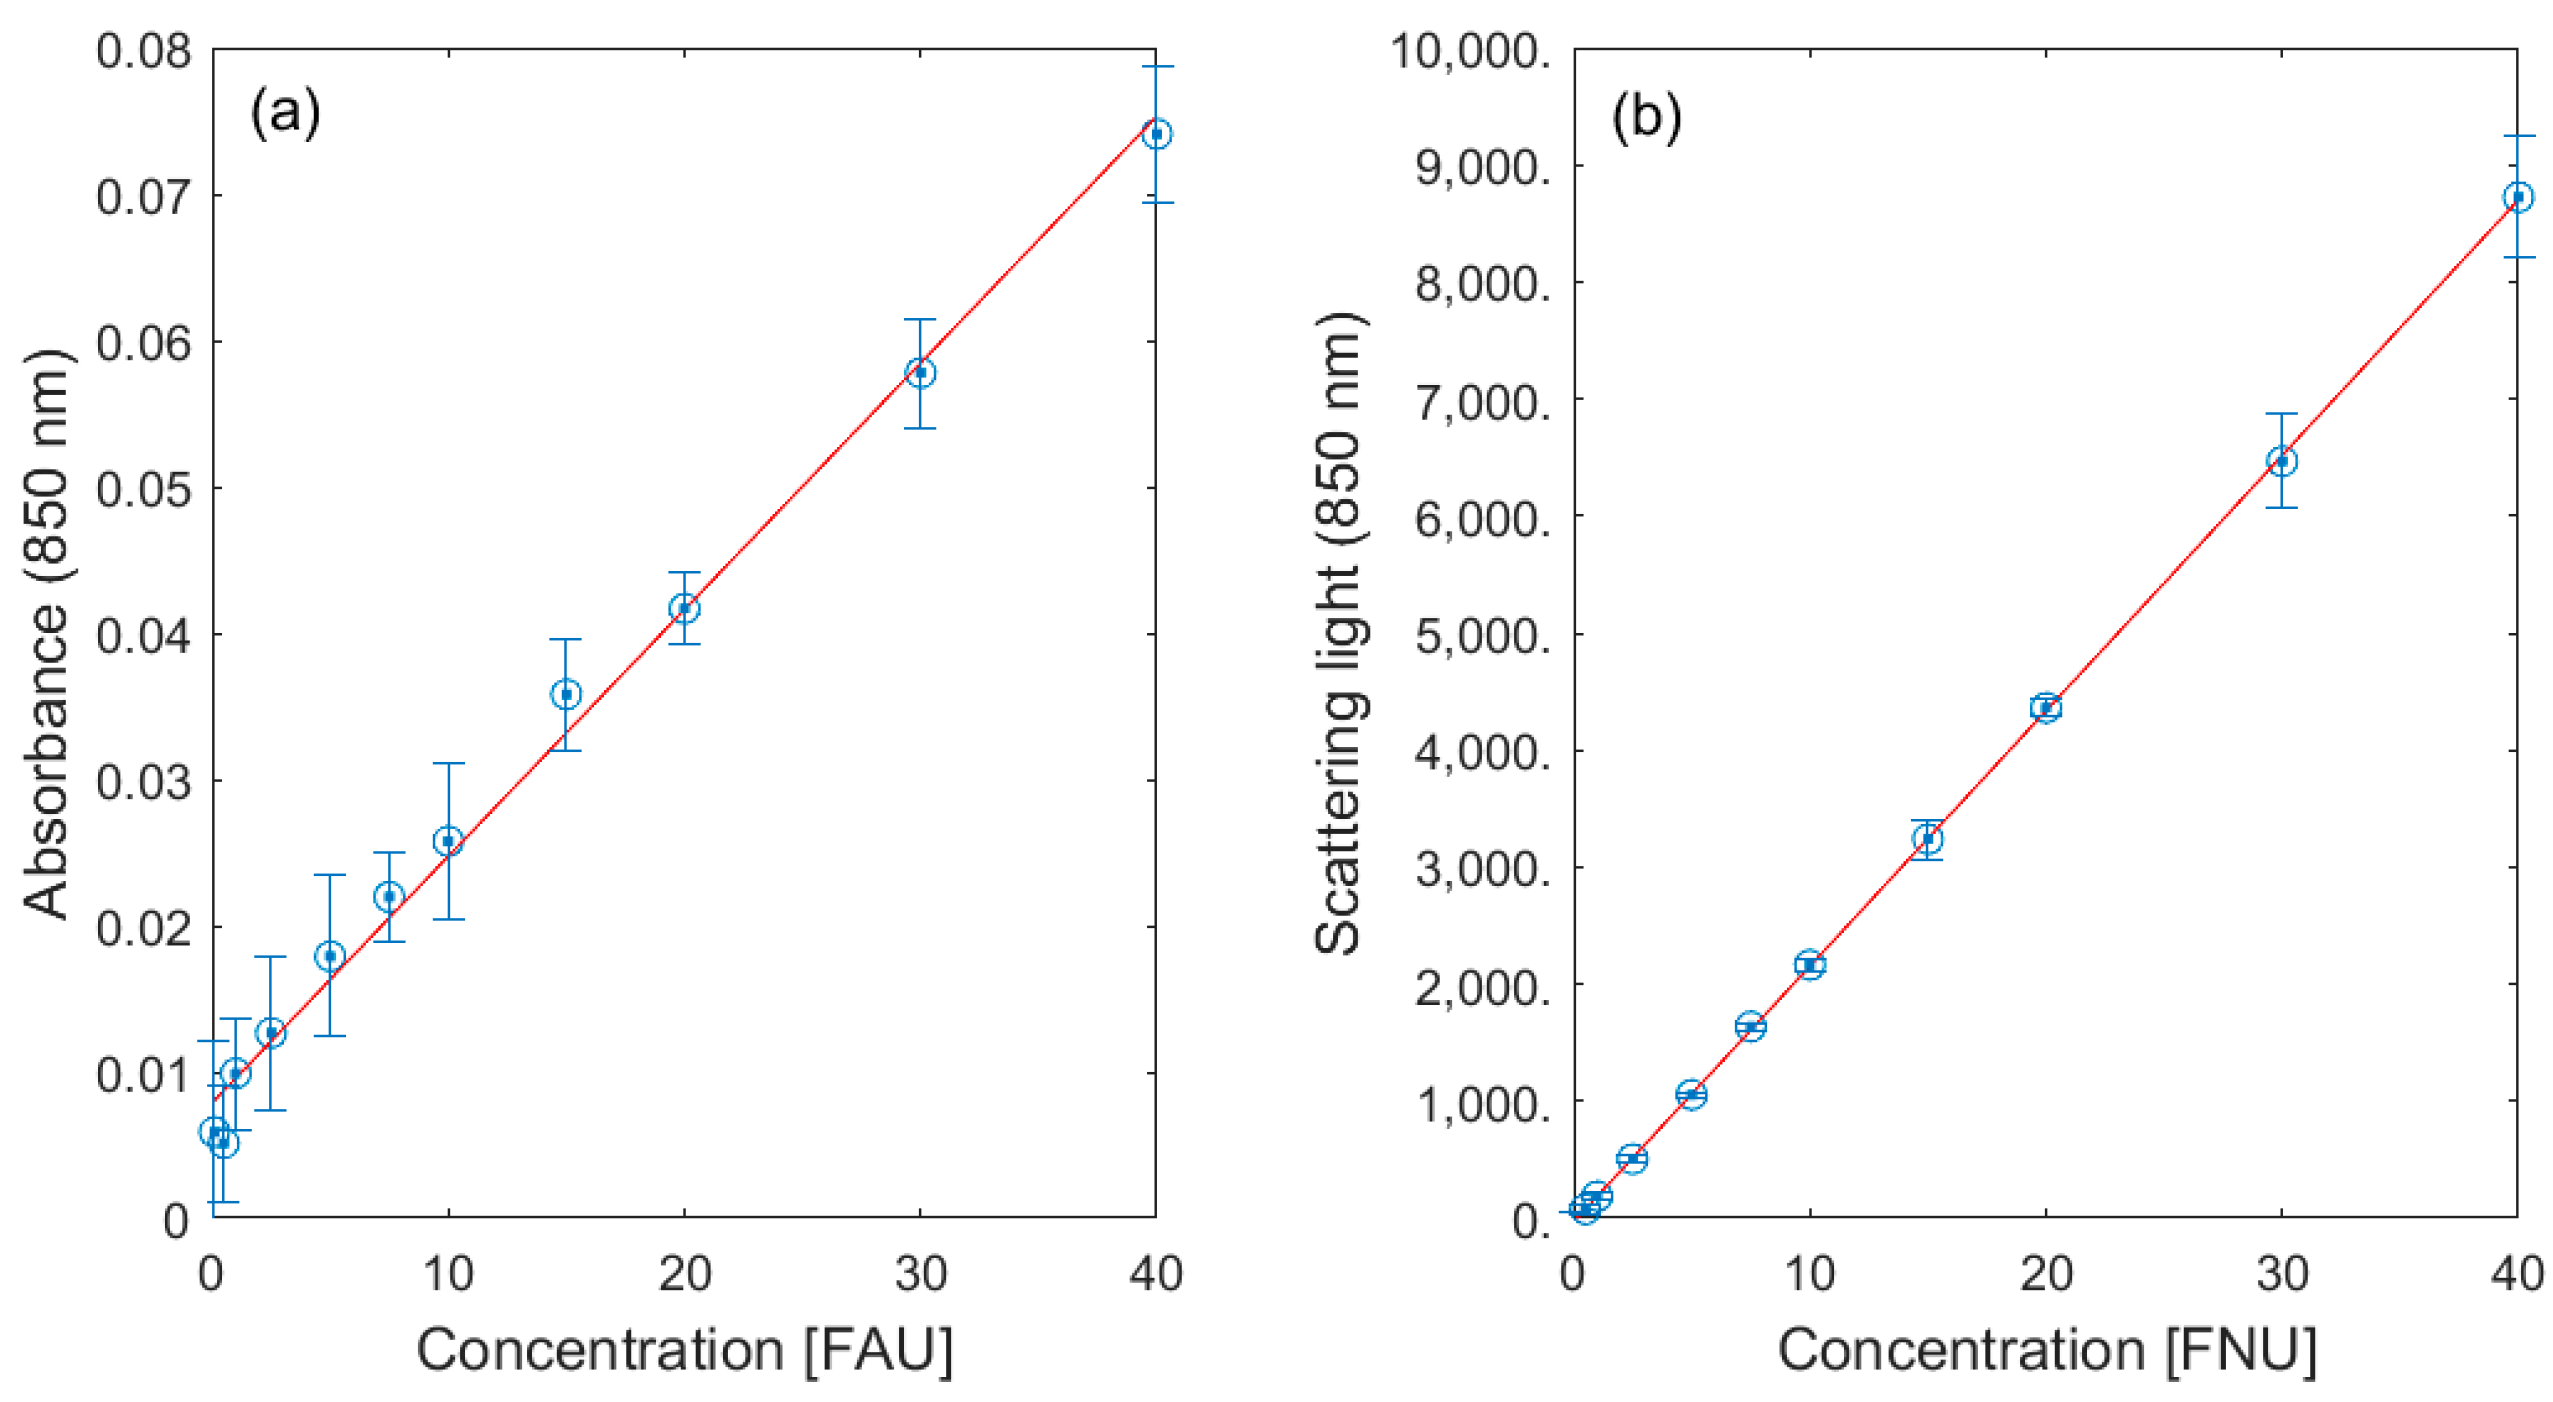
3.1. Lab Validation
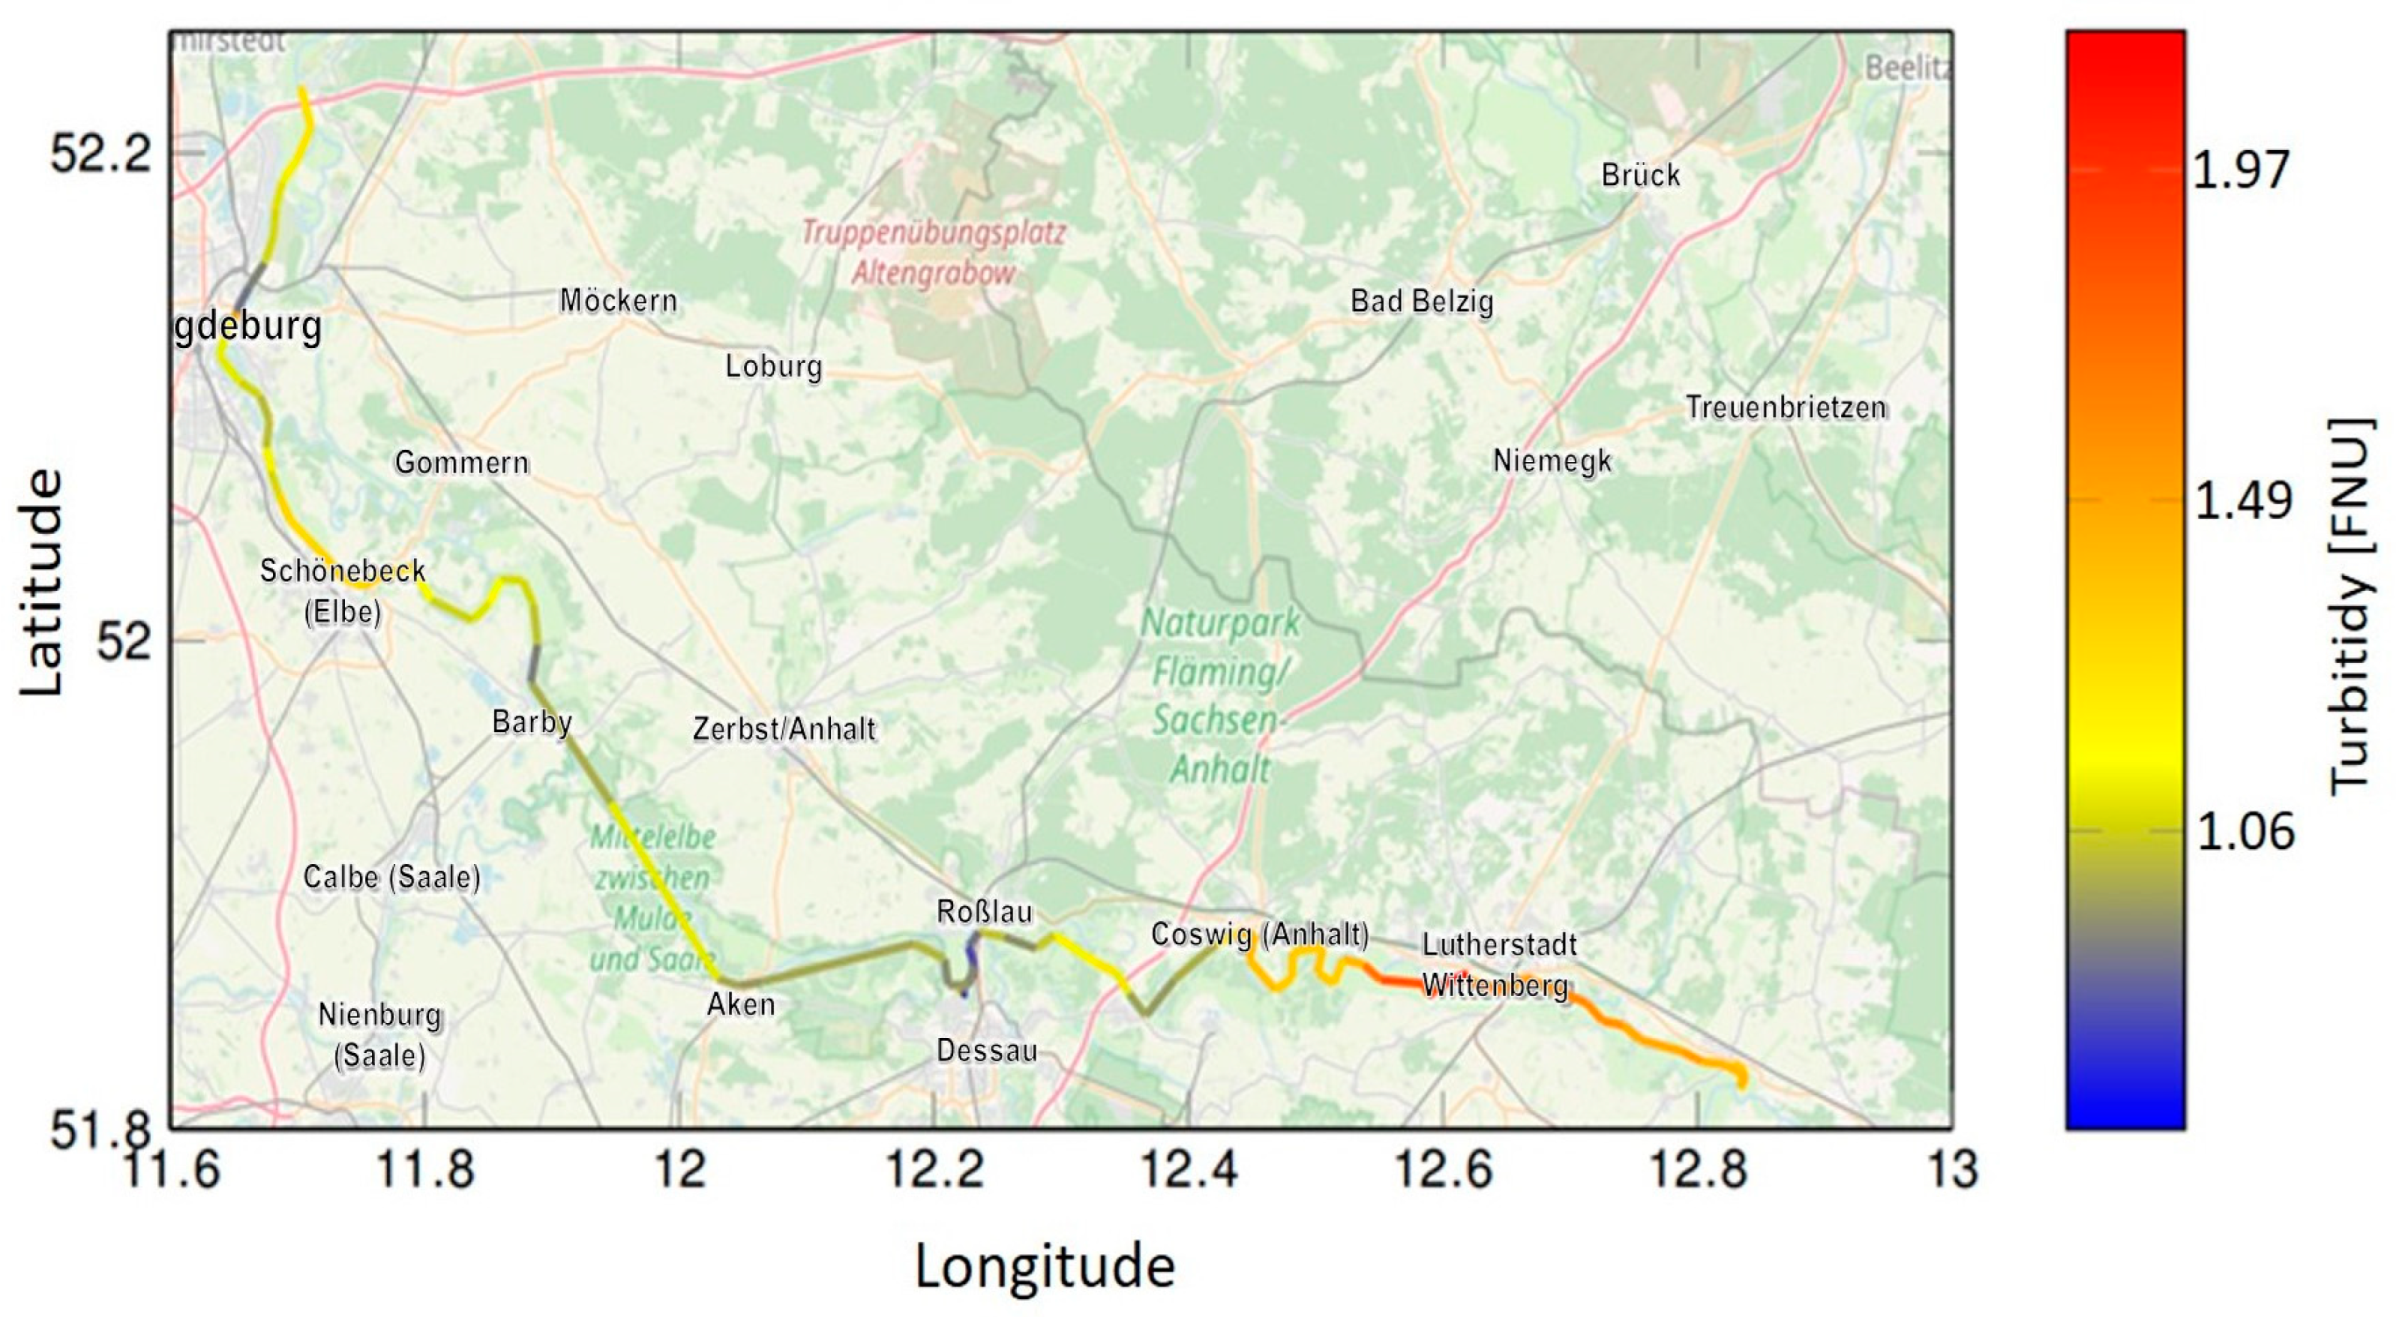
3.2. Results from Field Tests
4. Conclusions
Author Contributions
Funding
Institutional Review Board Statement
Informed Consent Statement
Data Availability Statement
Acknowledgments
Conflicts of Interest
References
- Ruhala, S.S.; Zarnetske, J.P. Using in-situ optical sensors to study dissolved organic carbon dynamics of streams and watersheds: A review. Sci. Total Environ. 2017, 575, 713–723. [Google Scholar] [CrossRef] [PubMed]
- Borsdorf, H.; Roland, U. In situ determination of organic compounds in liquid samples using a combined UV-Vis/fluorescence submersible sensor. Int. J. Environ. Anal. Chem. 2008, 88, 279–288. [Google Scholar] [CrossRef]
- Mills, G.; Fones, G. A review of in situ methods and sensors for monitoring the marine environment. Sens. Rev. 2012, 32, 17–28. [Google Scholar] [CrossRef]
- Zulkifli, S.N.; Rahim, H.A.; Lau, W.J. Detection of contaminants in water supply: A review on state-of-the-art monitoring technologies and their applications. Sens. Actuators B Chem. 2018, 255, 2657–2689. [Google Scholar] [CrossRef] [PubMed]
- Carstea, E.M.; Bridgeman, J.; Baker, A.; Reynolds, D.M. Fluorescence spectroscopy for wastewater monitoring: A review. Water Res. 2016, 95, 205–219. [Google Scholar] [CrossRef] [PubMed]
- Guo, Y.; Liu, C.; Ye, R.; Duan, Q. Advances on Water Quality Detection by UV-Vis Spectroscopy. Appl. Sci. 2020, 10, 6874. [Google Scholar] [CrossRef]
- Huebsch, M.; Grimmeisen, F.; Zemann, M.; Fenton, O.; Richards, K.G.; Jordan, P.; Sawarieh, A.; Blum, P.; Goldscheider, N. Technical Note: Field experiences using UV/VIS sensors for high-resolution monitoring of nitrate in groundwater. Hydrol. Earth Syst. Sci. 2015, 19, 1589–1598. [Google Scholar] [CrossRef]
- Pons, M.-N.; Assaad, A.; Oucacha, C.; Pontvianne, S.; Pollier, B.; Wagner, P.; Legout, A.; Guérold, F. Nitrates monitoring by UV–vis spectral analysis. Ecohydrol. Hydrobiol. 2017, 17, 46–52. [Google Scholar] [CrossRef]
- Karanfil, T.; Schlautman, M.A.; Erdogan, I. Survey of DOC and UV measurement practices with implications for SUVA determination. J. AWWA 2002, 94, 68–80. [Google Scholar] [CrossRef]
- Sorensen, J.P.R.; Vivanco, A.; Ascott, M.J.; Gooddy, D.C.; Lapworth, D.J.; Read, D.S.; Rushworth, C.M.; Bucknall, J.; Herbert, K.; Karapanos, I.; et al. Online fluorescence spectroscopy for the real-time evaluation of the microbial quality of drinking water. Water Res. 2018, 137, 301–309. [Google Scholar] [CrossRef]
- Zamyadi, A.; Choo, F.; Newcombe, G.; Stuetz, R.; Henderson, R.K. A review of monitoring technologies for real-time management of cyanobacteria: Recent advances and future direction. TrAC Trends Anal. Chem. 2016, 85, 83–96. [Google Scholar] [CrossRef]
- Zeng, L.; Li, D. Development of In Situ Sensors for Chlorophyll Concentration Measurement. J. Sens. 2015, 2015, 903509. [Google Scholar] [CrossRef]
- Carstea, E.M.; Popa, C.L.; Baker, A.; Bridgeman, J. In situ fluorescence measurements of dissolved organic matter: A review. Sci Total Environ. 2020, 699, 134361. [Google Scholar] [CrossRef] [PubMed]
- Silva, G.M.e.; Campos, D.F.; Brasil, J.A.T.; Tremblay, M.; Mendiondo, E.M.; Ghiglieno, F. Advances in Technological Research for Online and In Situ Water Quality Monitoring—A Review. Sustainability 2022, 14, 5059. [Google Scholar] [CrossRef]
- Wang, Y.; Rajib, S.M.S.M.; Collins, C.; Grieve, B. Low-Cost Turbidity Sensor for Low-Power Wireless Monitoring of Fresh-Water Courses. IEEE Sens. J. 2018, 18, 4689–4696. [Google Scholar] [CrossRef]
- Shin, Y.-H.; Teresa Gutierrez-Wing, M.; Choi, J.-W. Review—Recent Progress in Portable Fluorescence Sensors. J. Electrochem. Soc. 2021, 168, 017502. [Google Scholar] [CrossRef]
- Chowdhury, R.I.; Wahid, K.A.; Nugent, K.; Baulch, H. Design and Development of Low-Cost, Portable, and Smart Chlorophyll-A Sensor. IEEE Sens. J. 2020, 20, 7362–7371. [Google Scholar] [CrossRef]
- Cai, W.; Huang, H.; Li, Z.; Li, X.; Fan, J.; Zhang, S.; Feng, G.; Chen, J. Compact Fluorescence Spectrometer with Built-In In-Line Calibration: Application to Detect Dissolved Organic Matter in Water. Anal. Chem. 2023, 95, 14228–14234. [Google Scholar] [CrossRef]
- Bedell, E.; Harmon, O.; Fankhauser, K.; Shivers, Z.; Thomas, E. A continuous, in-situ, near-time fluorescence sensor coupled with a machine learning model for detection of fecal contamination risk in drinking water: Design, characterization and field validation. Water Res. 2022, 220, 118644. [Google Scholar] [CrossRef]
- Ng, C.-L.; Senft-Grupp, S.; Hemond, H.F. A multi-platform optical sensor for in situ sensing of water chemistry. Limnol. Oceanogr. Methods 2012, 10, 978–990. [Google Scholar] [CrossRef]
- Sorensen, J.P.; Lapworth, D.J.; Marchant, B.P.; Nkhuwa, D.C.; Pedley, S.; Stuart, M.E.; Bell, R.A.; Chirwa, M.; Kabika, J.; Liemisa, M.; et al. In-situ tryptophan-like fluorescence: A real-time indicator of faecal contamination in drinking water supplies. Water Res. 2015, 81, 38–46. [Google Scholar] [CrossRef] [PubMed]
- Sorensen, J.P.R.; Carr, A.F.; Nayebare, J.; Diongue, D.M.L.; Pouye, A.; Roffo, R.; Gwengweya, G.; Ward, J.S.T.; Kanoti, J.; Okotto-Okotto, J.; et al. Tryptophan-like and humic-like fluorophores are extracellular in groundwater: Implications as real-time faecal indicators. Sci. Rep. 2020, 10, 15379. [Google Scholar] [CrossRef] [PubMed]
- Lee, E.J.; Yoo, G.Y.; Jeong, Y.; Kim, K.U.; Park, J.H.; Oh, N.H. Comparison of UV–VIS and FDOM sensors for in situ monitoring of stream DOC concentrations. Biogeosciences 2015, 12, 3109–3118. [Google Scholar] [CrossRef]
- Rousso, B.Z.; Bertone, E.; Stewart, R.A.; Rinke, K.; Hamilton, D.P. Light-induced fluorescence quenching leads to errors in sensor measurements of phytoplankton chlorophyll and phycocyanin. Water Res. 2021, 198, 117133. [Google Scholar] [CrossRef] [PubMed]
- Henderson, R.K.; Stuetz, R.; Bowling, L.; Newcombe, G.; Newton, K.; Zamyadi, A.; Choo, F. Performance evaluation of in situ fluorometers for real-time cyanobacterial monitoring. H2Open J. 2018, 1, 26–46. [Google Scholar] [CrossRef]
- Cory, R.M.; McKnight, D.M. Fluorescence Spectroscopy Reveals Ubiquitous Presence of Oxidized and Reduced Quinones in Dissolved Organic Matter. Environ. Sci. Technol. 2005, 39, 8142–8149. [Google Scholar] [CrossRef] [PubMed]
- ISO 7027-1:2016; Water Quality—Determination of Turbidity—Part 1: Quantitative Methods. ISO: Geneva, Switzerland, 2016. Available online: https://www.iso.org/standard/62801.html (accessed on 31 December 2016).
- Kellner, K.; Posnicek, T.; Brandl, M. An Integrated Optical Measurement System for Water Quality Monitoring. Procedia Eng. 2014, 87, 1306–1309. [Google Scholar] [CrossRef]
- Erlandsson, M.; Futter, M.N.; Kothawala, D.N.; Kohler, S.J. Variability in spectral absorbance metrics across boreal lake waters. J. Environ. Monit. 2012, 14, 2643–2652. [Google Scholar] [CrossRef]
- Li, P.; Hur, J. Utilization of UV-Vis spectroscopy and related data analyses for dissolved organic matter (DOM) studies: A review. Crit. Rev. Environ. Sci. Technol. 2017, 47, 131–154. [Google Scholar] [CrossRef]
- Chen, X.; Yin, G.; Zhao, N.; Gan, T.; Yang, R.; Xia, M.; Feng, C.; Chen, Y.; Huang, Y. Simultaneous determination of nitrate, chemical oxygen demand and turbidity in water based on UV–Vis absorption spectrometry combined with interval analysis. Spectrochim. Acta Part A Mol. Biomol. Spectrosc. 2021, 244, 118827. [Google Scholar] [CrossRef]
- Bertone, E.; Chuang, A.; Burford, M.A.; Hamilton, D.P. In-situ fluorescence monitoring of cyanobacteria: Laboratory-based quantification of species-specific measurement accuracy. Harmful Algae 2019, 87, 101625. [Google Scholar] [CrossRef] [PubMed]
- Shi, Z.; Chow, C.W.K.; Fabris, R.; Liu, J.; Jin, B. Applications of Online UV-Vis Spectrophotometer for Drinking Water Quality Monitoring and Process Control: A Review. Sensors 2022, 22, 2987. [Google Scholar] [CrossRef] [PubMed]
- ISO 11929-1:2019; Determination of the Characteristic Limits (Decision Threshold, Detection Limit and Limits of the Coverage interval) for Measurements of Ionizing Radiation. ISO: Geneva, Switzerland, 2019. Available online: https://www.iso.org/standard/69579.html (accessed on 31 December 2019).


| Module | Component | Software |
|---|---|---|
| View | Data Fusion Dashboard | Grafana |
| Model | HAL Storage | Python-FastAPI InfluxDB 2.0 |
| Control | DPM | Node-Red |
| LED | Excitation Wavelength [nm] | Current [mA] | Parameter |
|---|---|---|---|
| DUV-HL5N, Roithner LaserTechnik GmbH | 340 | 40 (pulsed) | DOM |
| VL440-5-15 | 440 | 100 (pulsed) | Chlorophyll a |
| CY5111A-WY, Roithner | 590 | 100 (pulsed) | Phycocyanin |
| OP265FAB, TT Electronics | 850 | 120 (constant) | Turbidity |
Disclaimer/Publisher’s Note: The statements, opinions and data contained in all publications are solely those of the individual author(s) and contributor(s) and not of MDPI and/or the editor(s). MDPI and/or the editor(s) disclaim responsibility for any injury to people or property resulting from any ideas, methods, instructions or products referred to in the content. |
© 2023 by the authors. Licensee MDPI, Basel, Switzerland. This article is an open access article distributed under the terms and conditions of the Creative Commons Attribution (CC BY) license (https://creativecommons.org/licenses/by/4.0/).
Share and Cite
Goblirsch, T.; Mayer, T.; Penzel, S.; Rudolph, M.; Borsdorf, H. In Situ Water Quality Monitoring Using an Optical Multiparameter Sensor Probe. Sensors 2023, 23, 9545. https://doi.org/10.3390/s23239545
Goblirsch T, Mayer T, Penzel S, Rudolph M, Borsdorf H. In Situ Water Quality Monitoring Using an Optical Multiparameter Sensor Probe. Sensors. 2023; 23(23):9545. https://doi.org/10.3390/s23239545
Chicago/Turabian StyleGoblirsch, Tobias, Thomas Mayer, Stefanie Penzel, Mathias Rudolph, and Helko Borsdorf. 2023. "In Situ Water Quality Monitoring Using an Optical Multiparameter Sensor Probe" Sensors 23, no. 23: 9545. https://doi.org/10.3390/s23239545