
Machine Learning Model for Leak Detection Using Water Pipeline Vibration Sensor


Abstract
:1. Introduction
- Introduction of a Novel Leak Detection Model: The paper proposes a new leak detection model specifically designed to address challenges associated with aging water pipelines made of a combination of metal and non-metal materials. This model also effectively handles various types of noise, including environmental, electrical, and natural sounds, which can interfere with leak detection.
- Comprehensive Model Comparison: The proposed model was rigorously compared with several representative machine learning models, including K-Nearest Neighbor, decision tree, random forest, extra trees, LightGBM, XGBoost, and CatBoost.
- Applicability in Diverse Environments: The results underscore the model’s capability to accurately detect and pinpoint leaks in water pipelines that comprise a mix of different materials and are subjected to various noises. This is crucial for the efficient management and upkeep of water supply systems.
2. Related Works
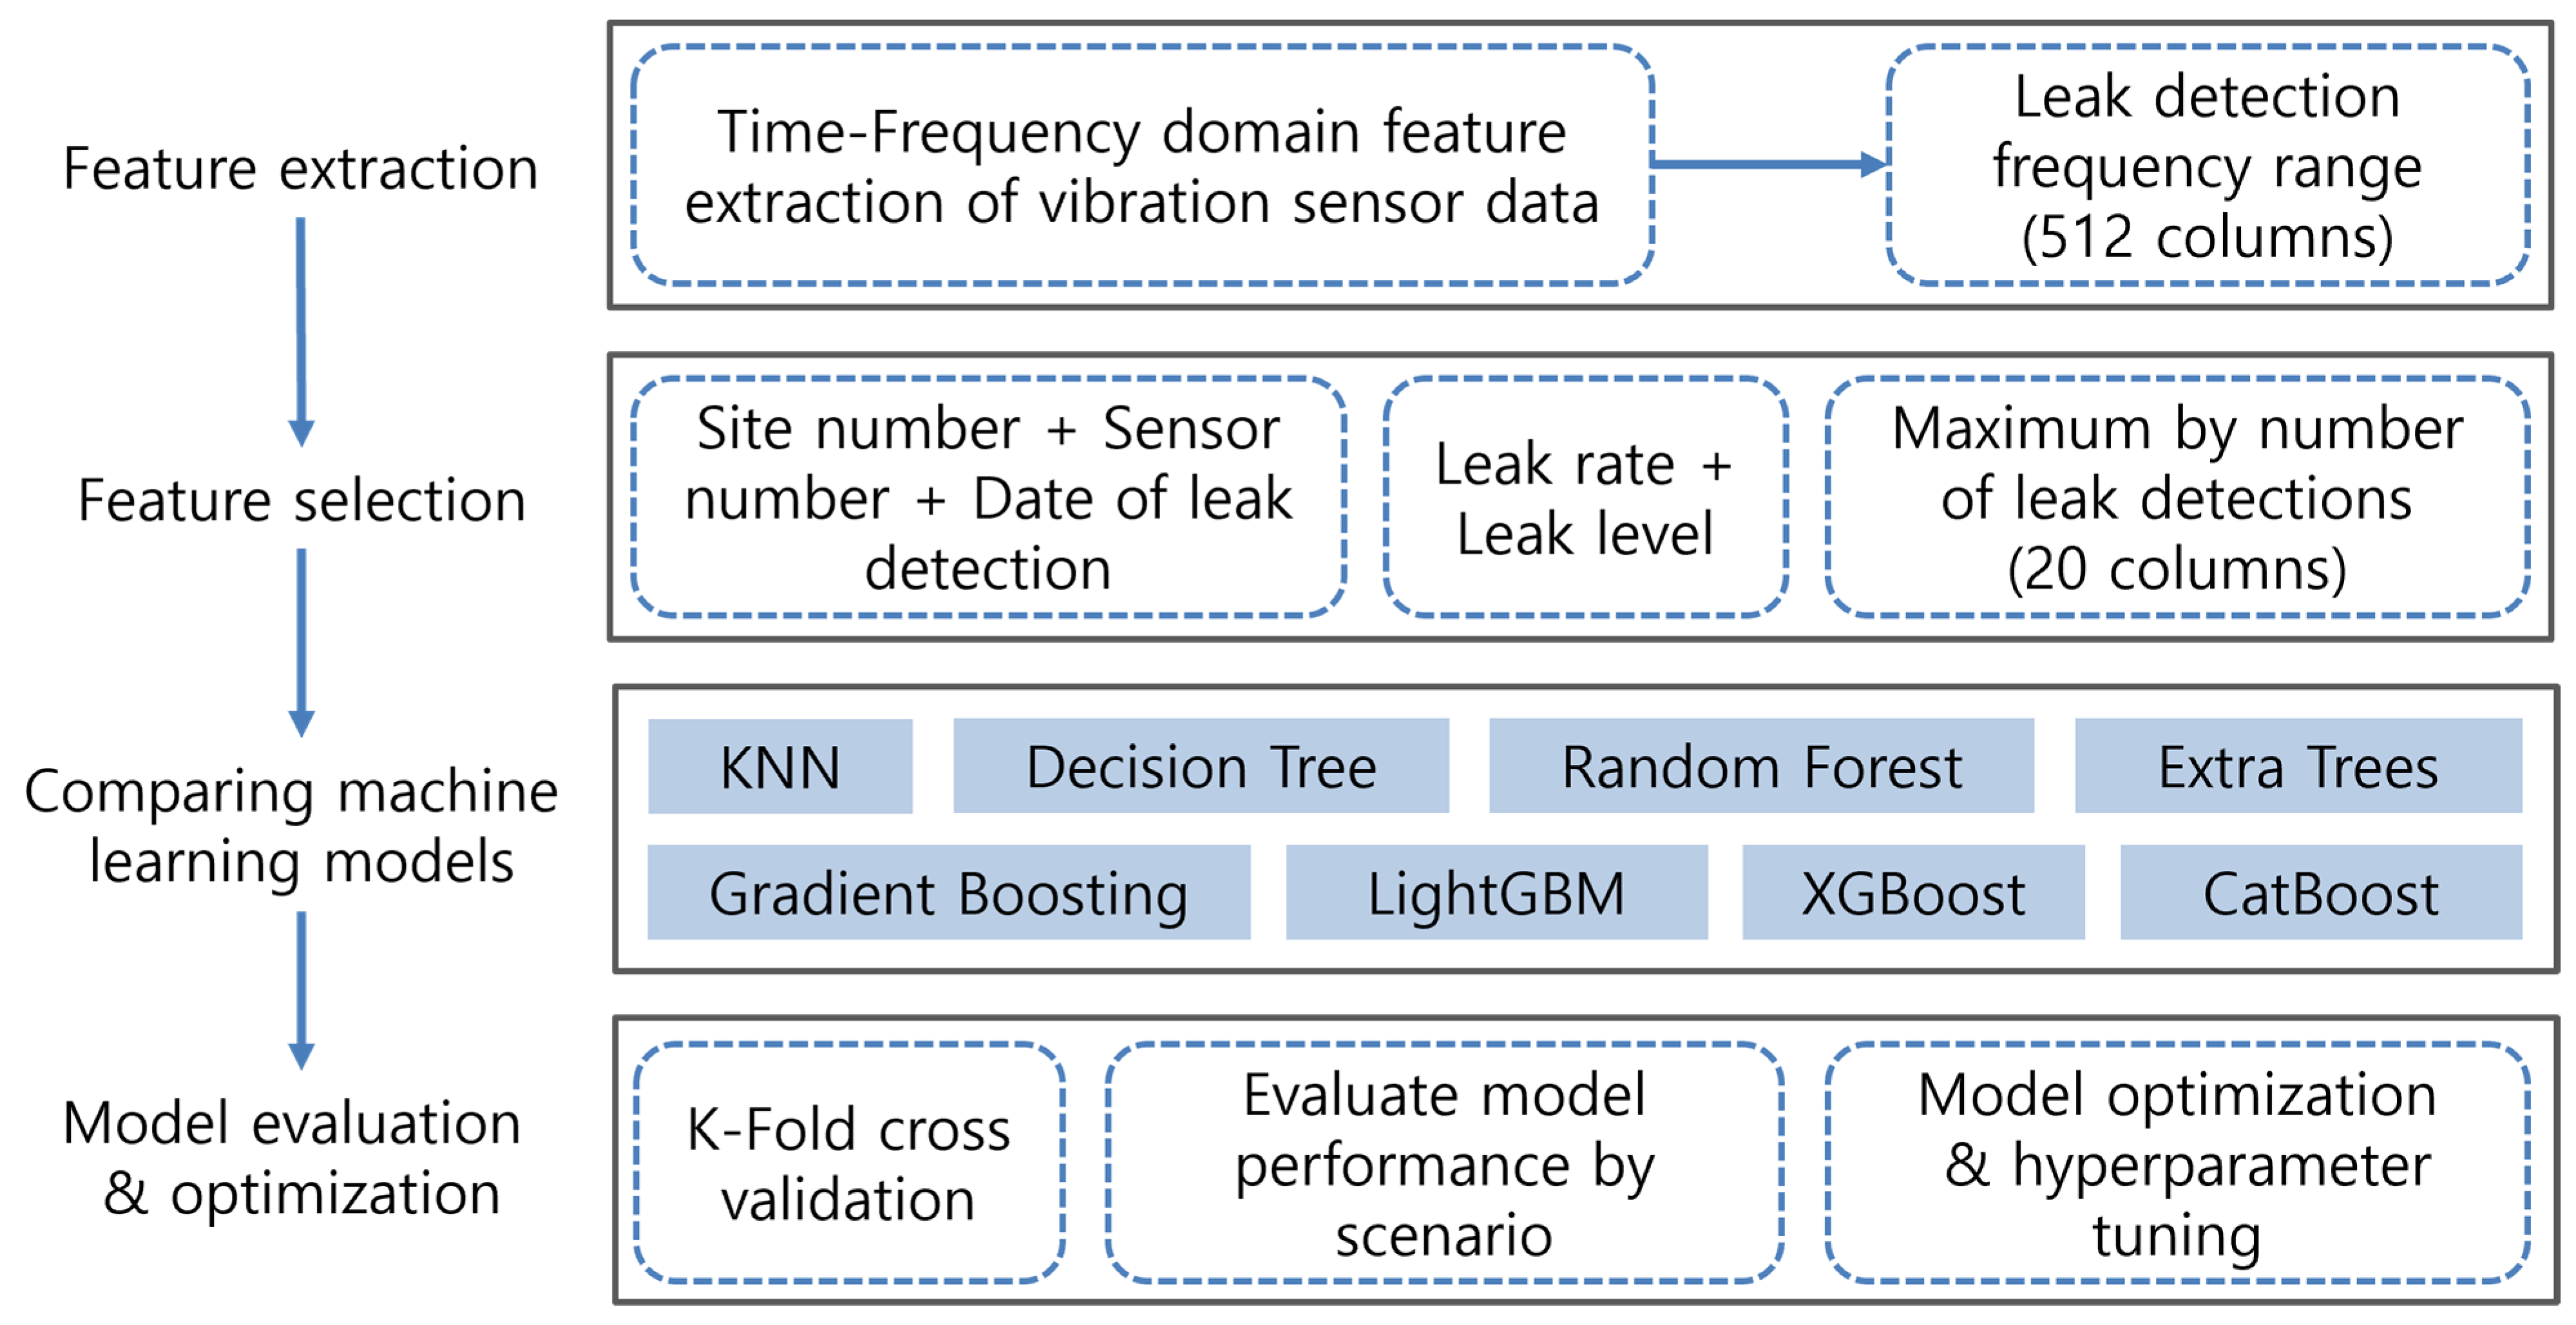
3. Water Leakage Detection Framework
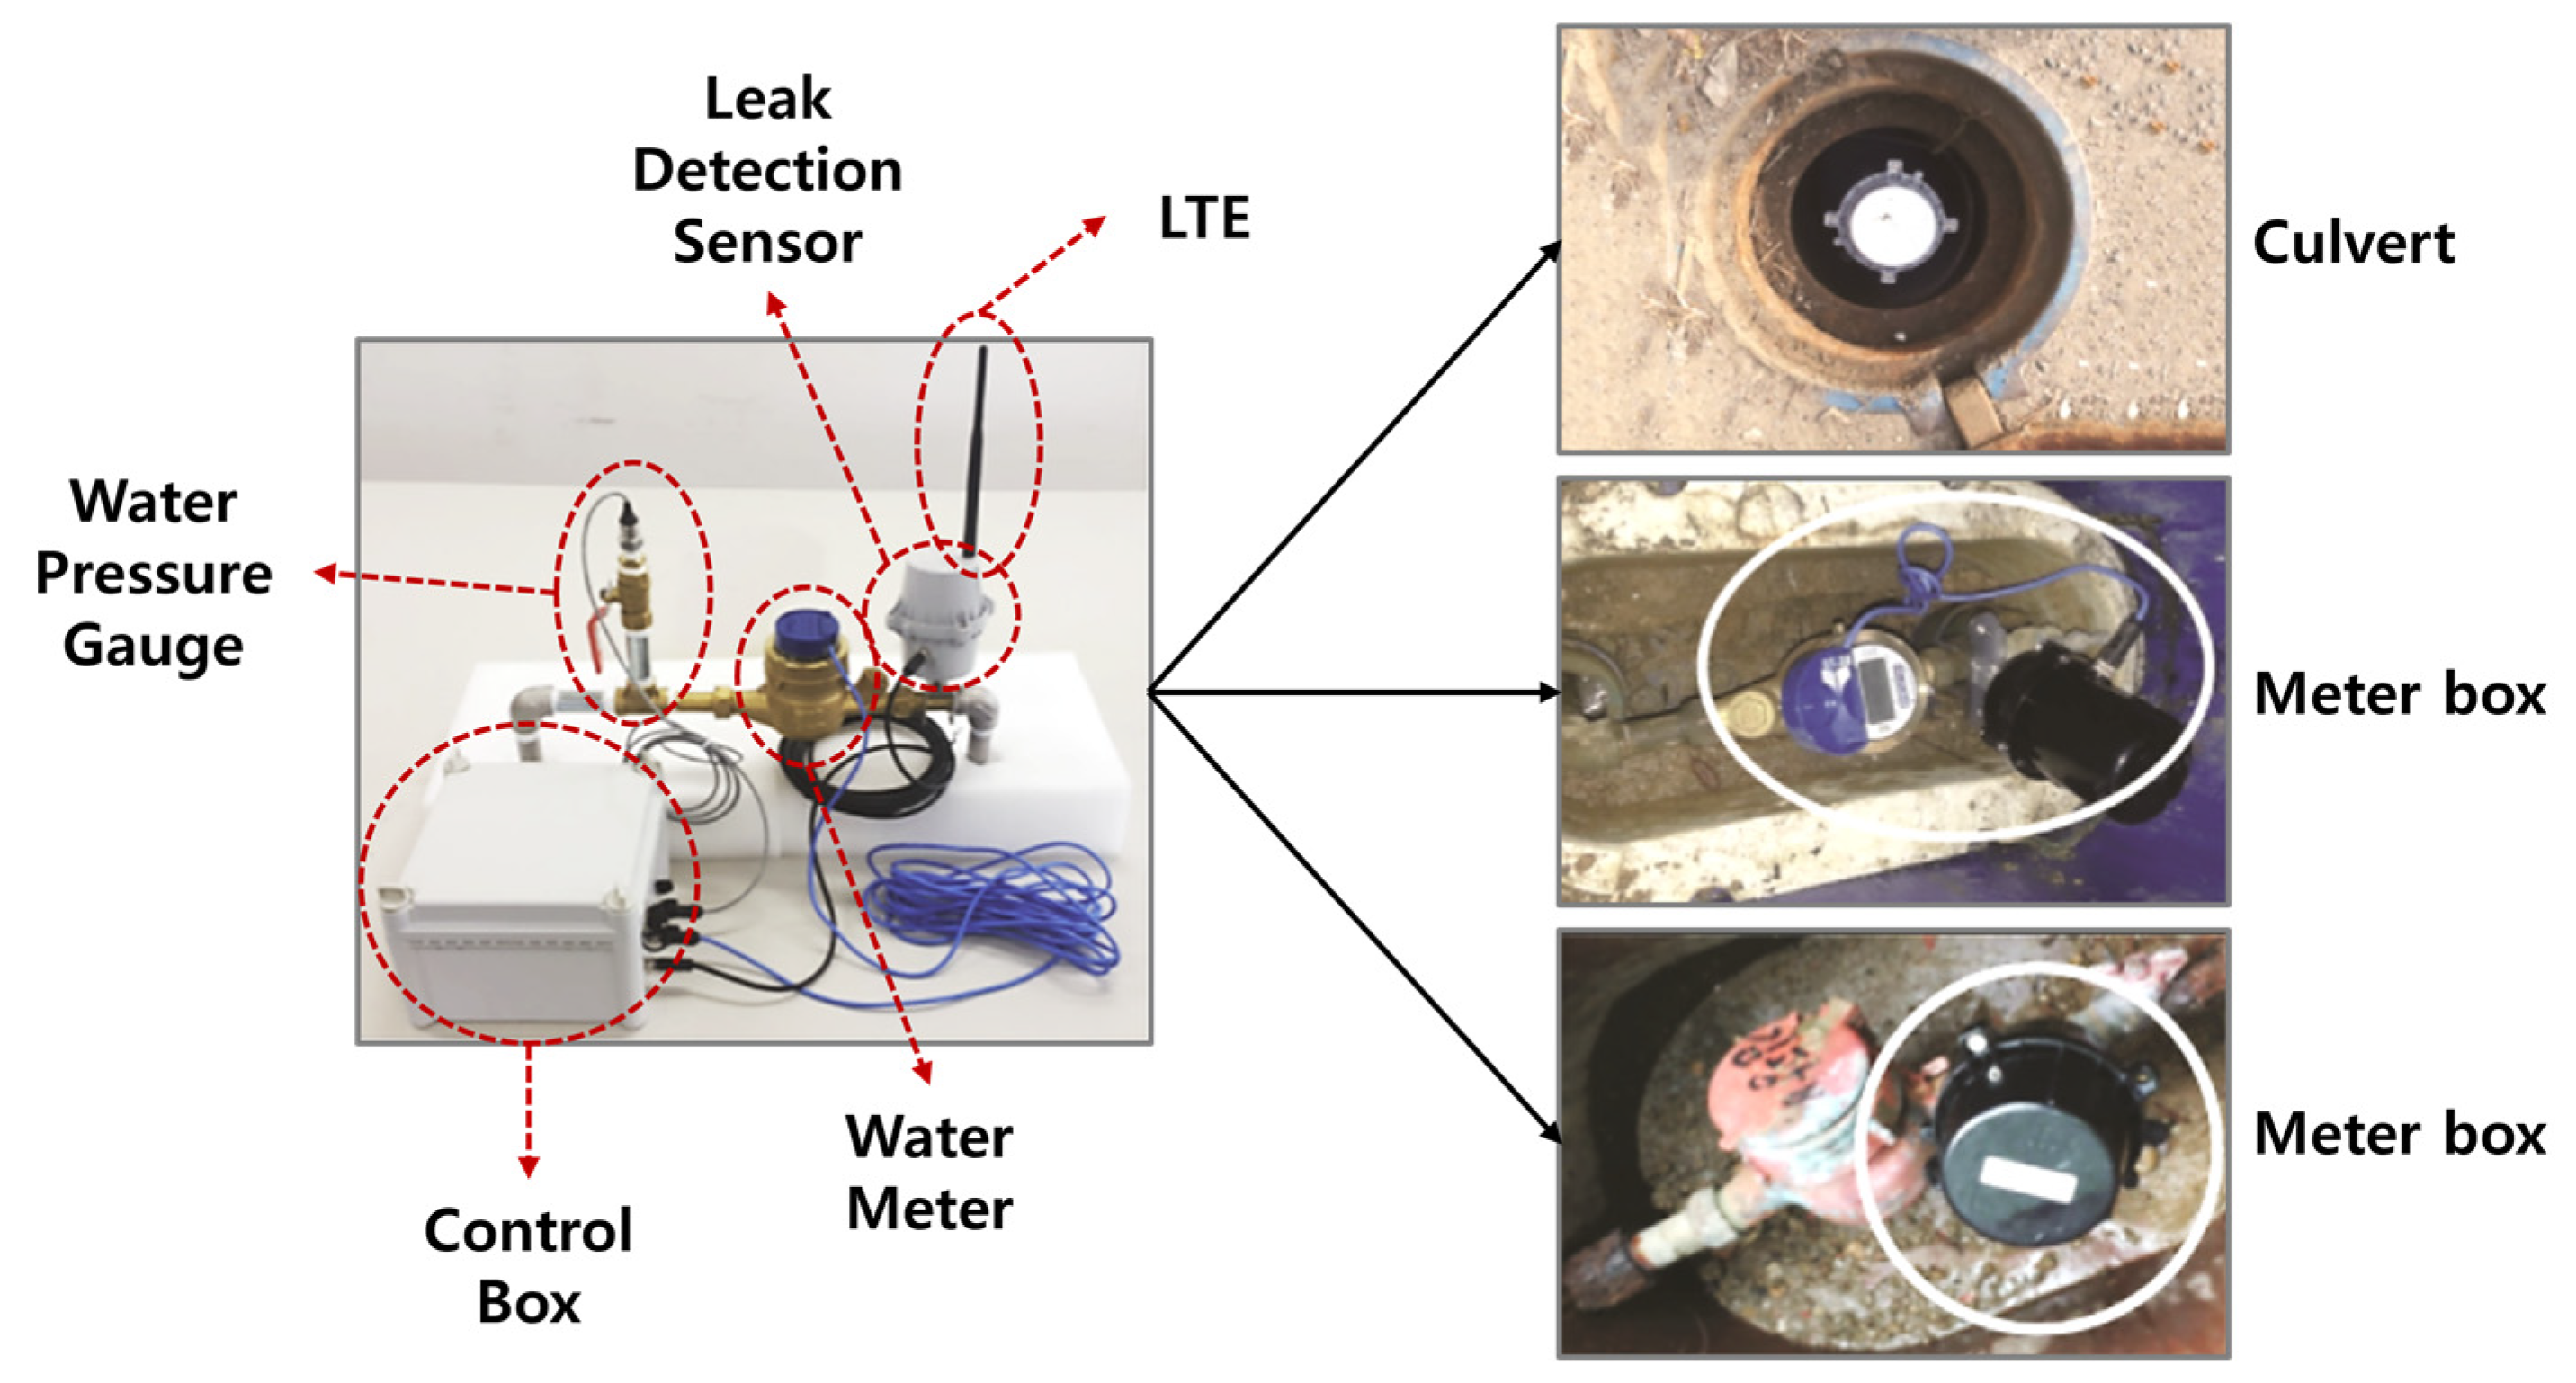
3.1. Water Pipeline Leak Vibration Dataset
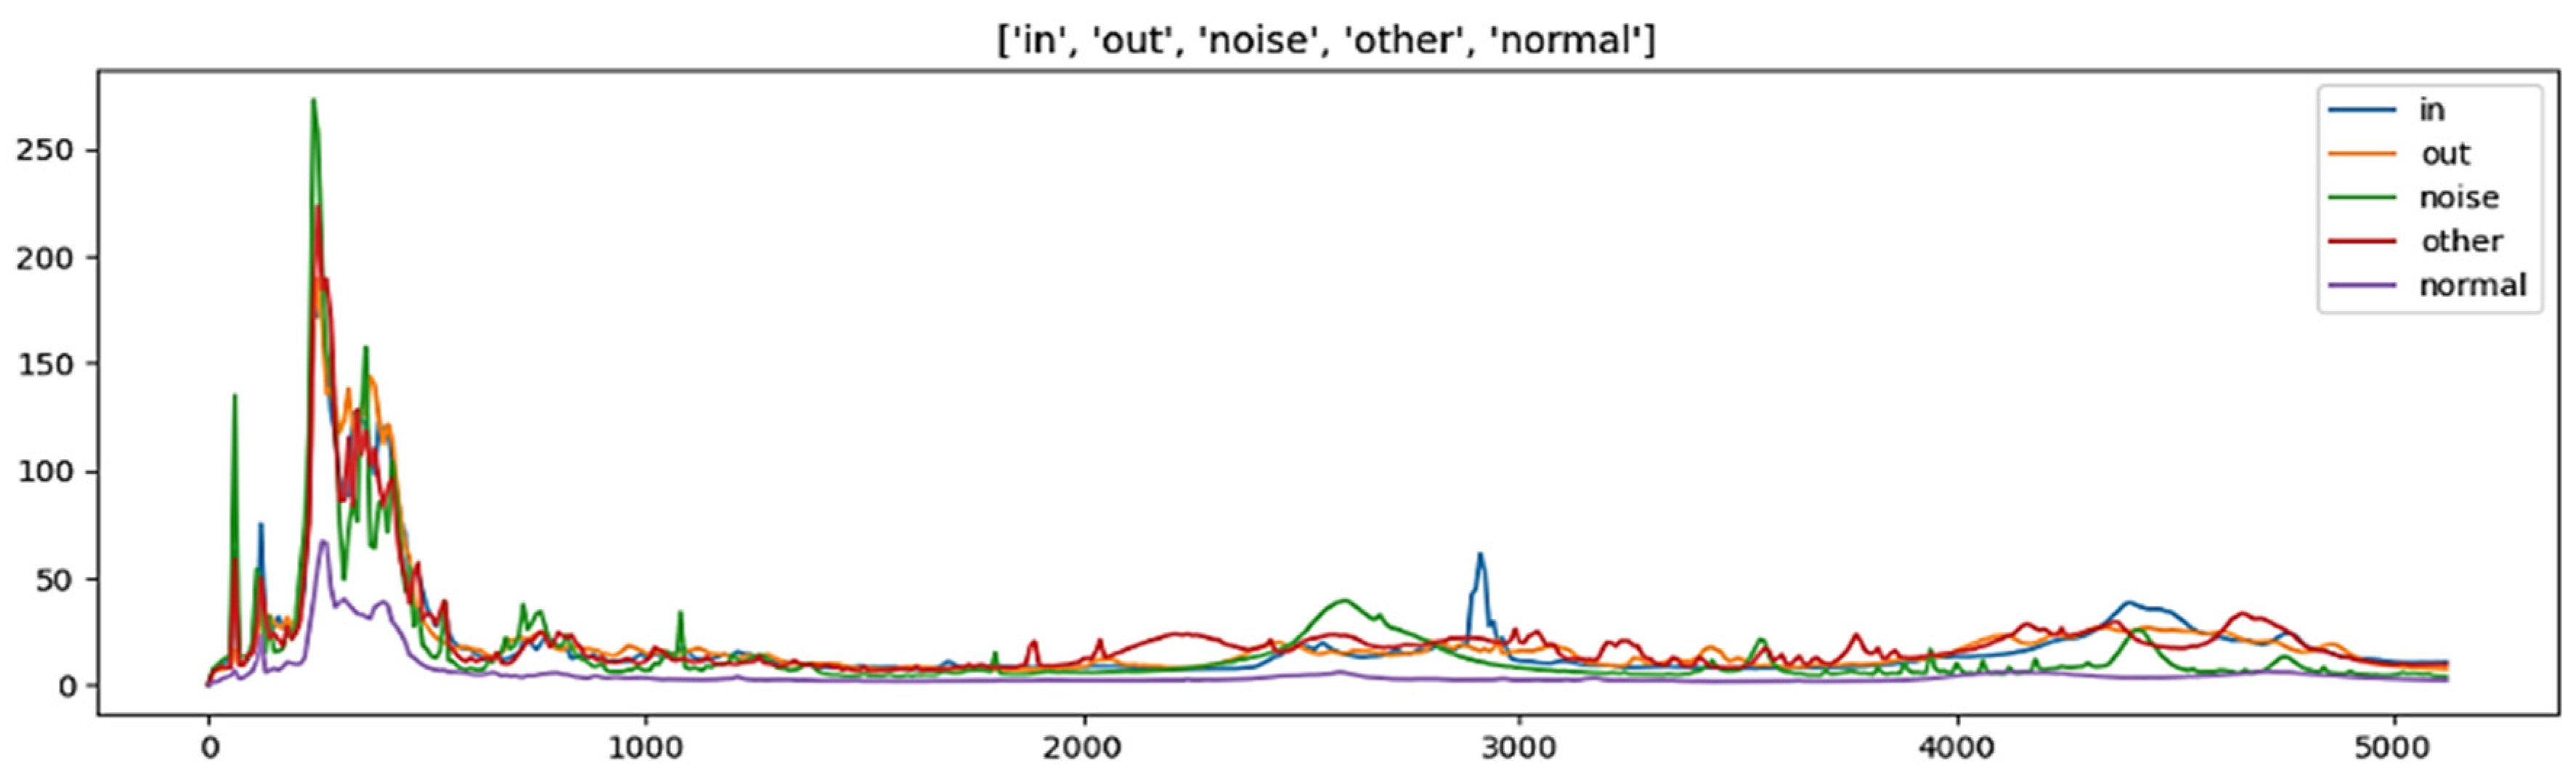
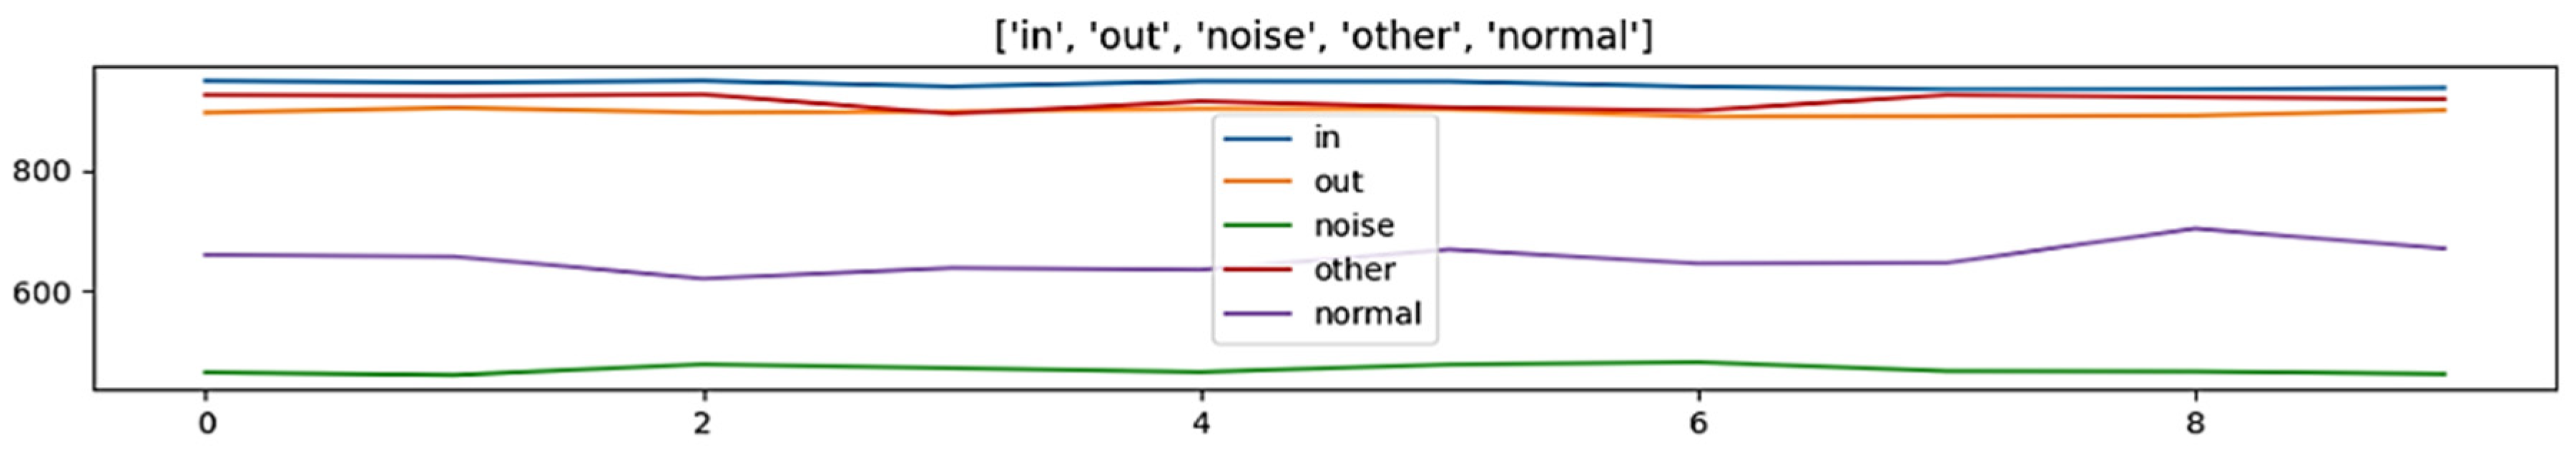
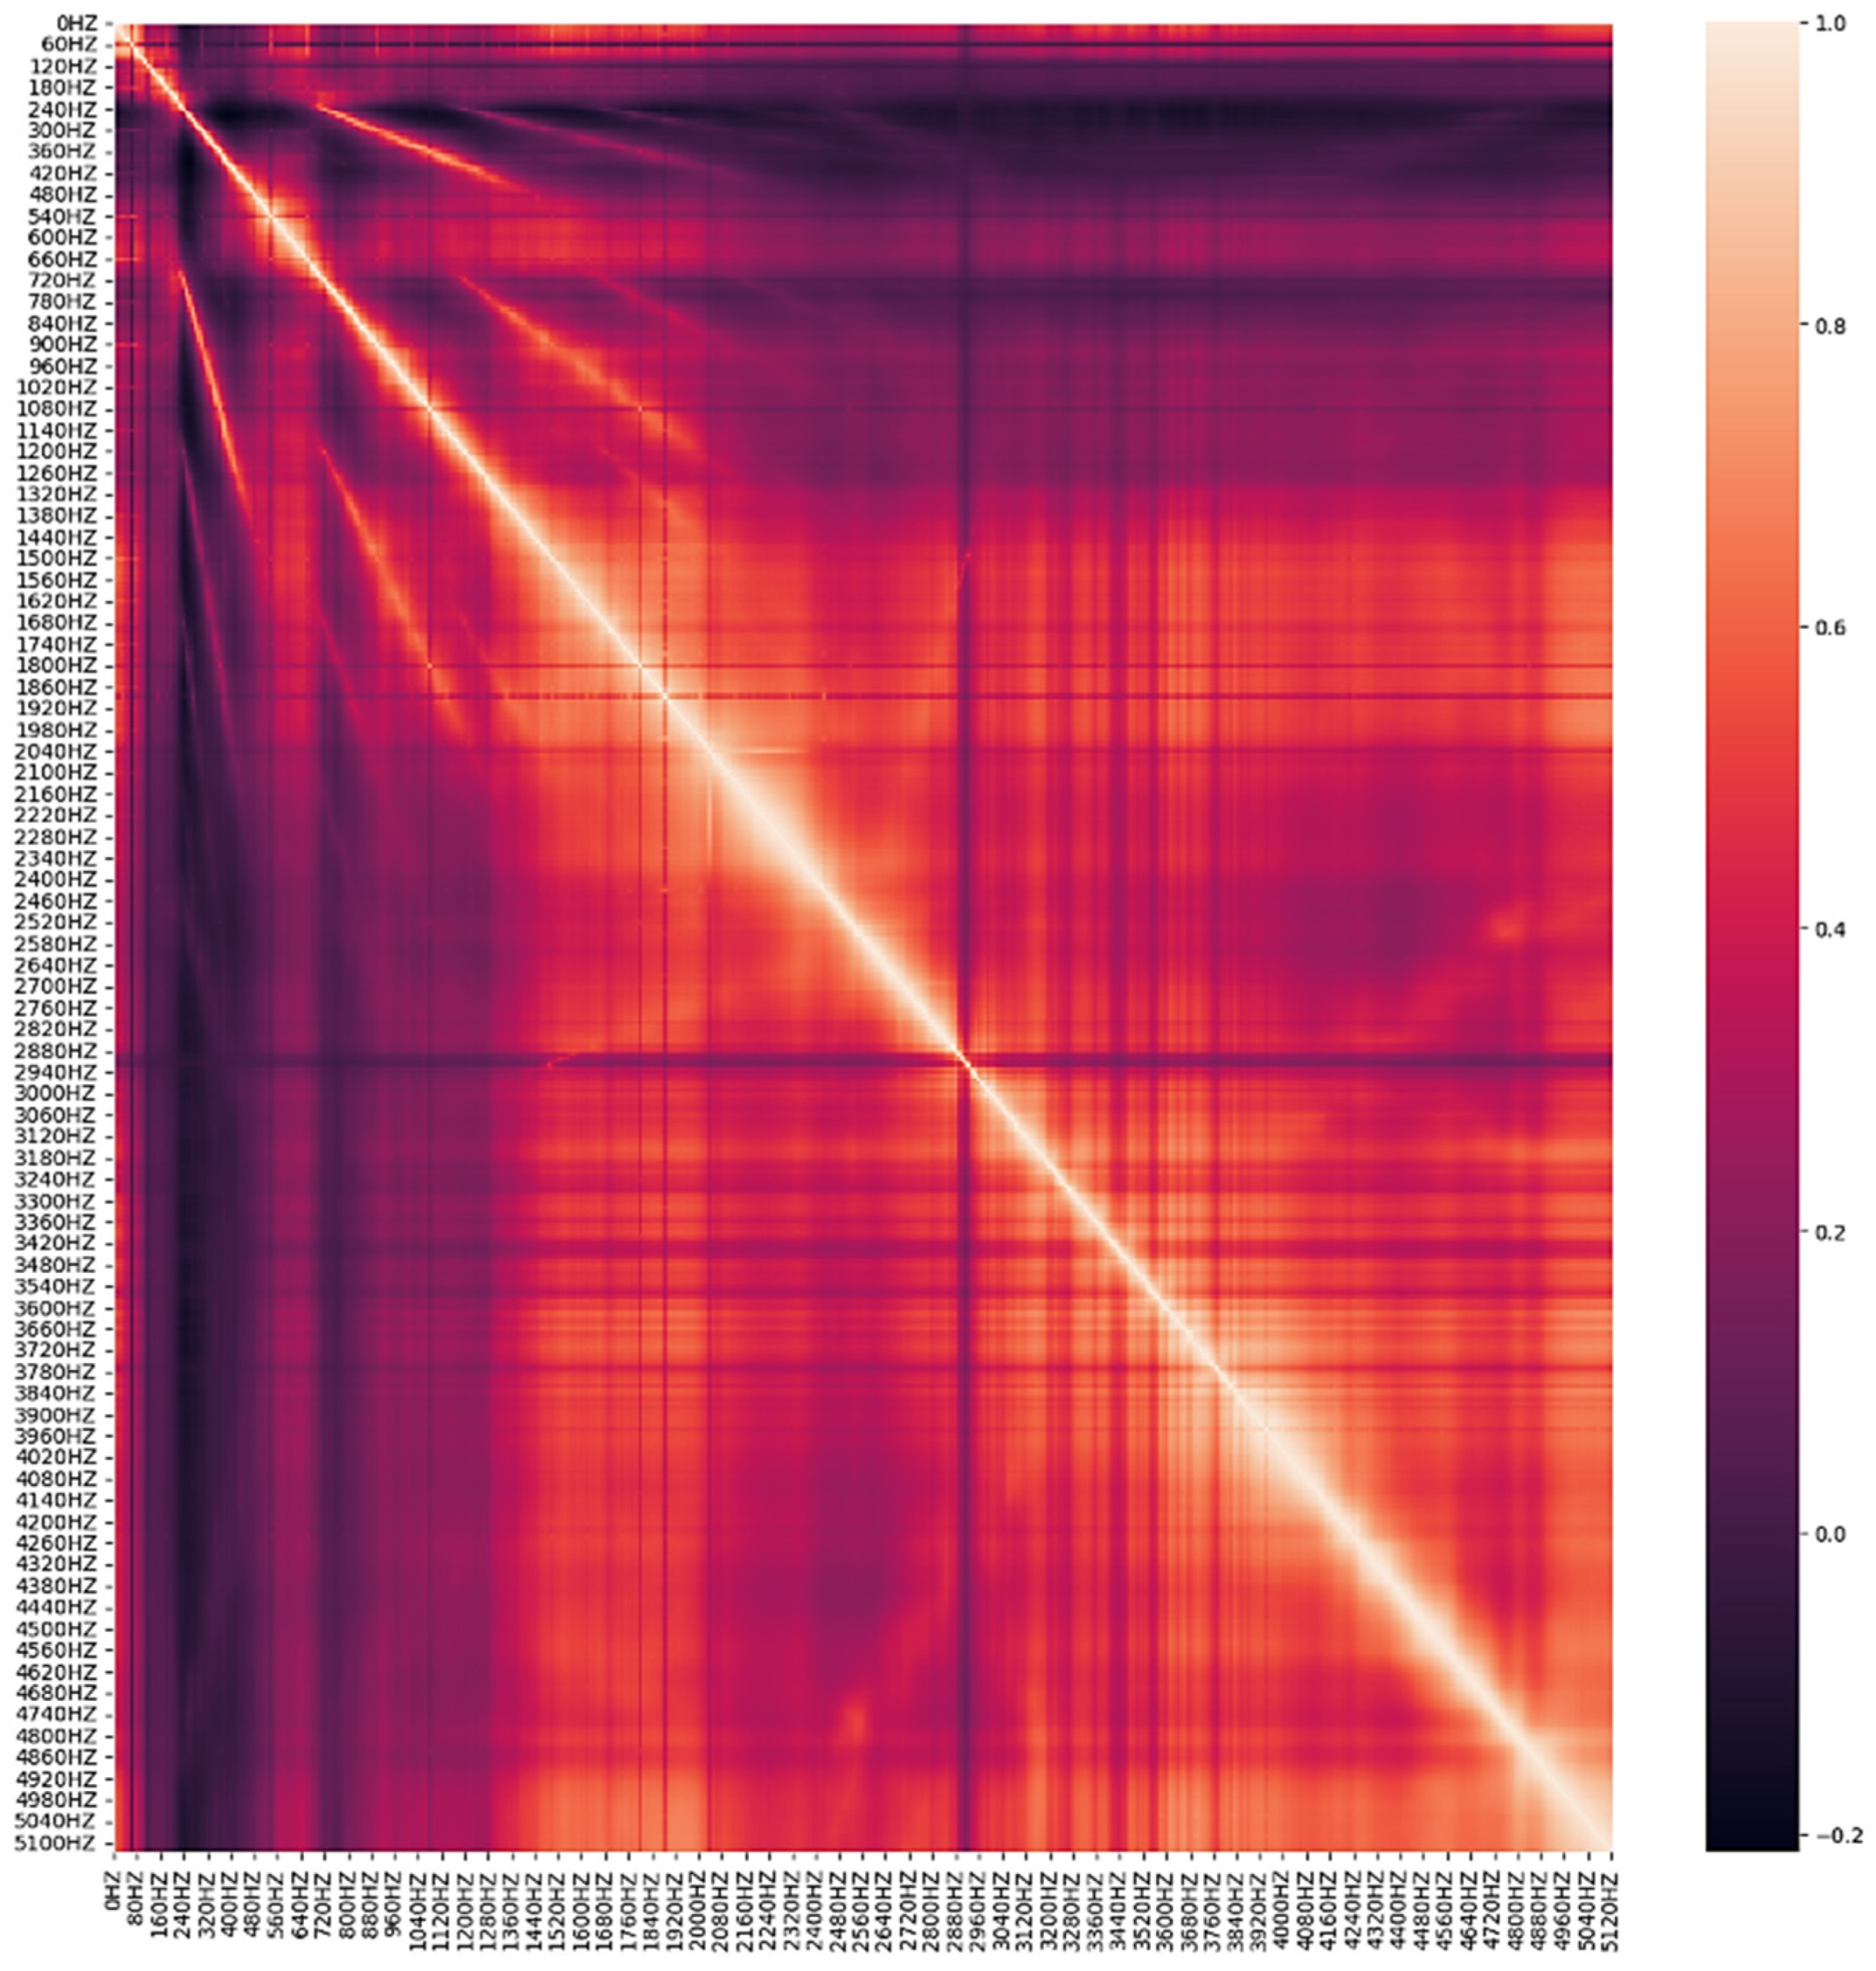
3.2. Leak Data Analysis and Preprocessing
3.3. Leak Detection Models
3.3.1. K-Nearest Neighbor
3.3.2. Decision Tree
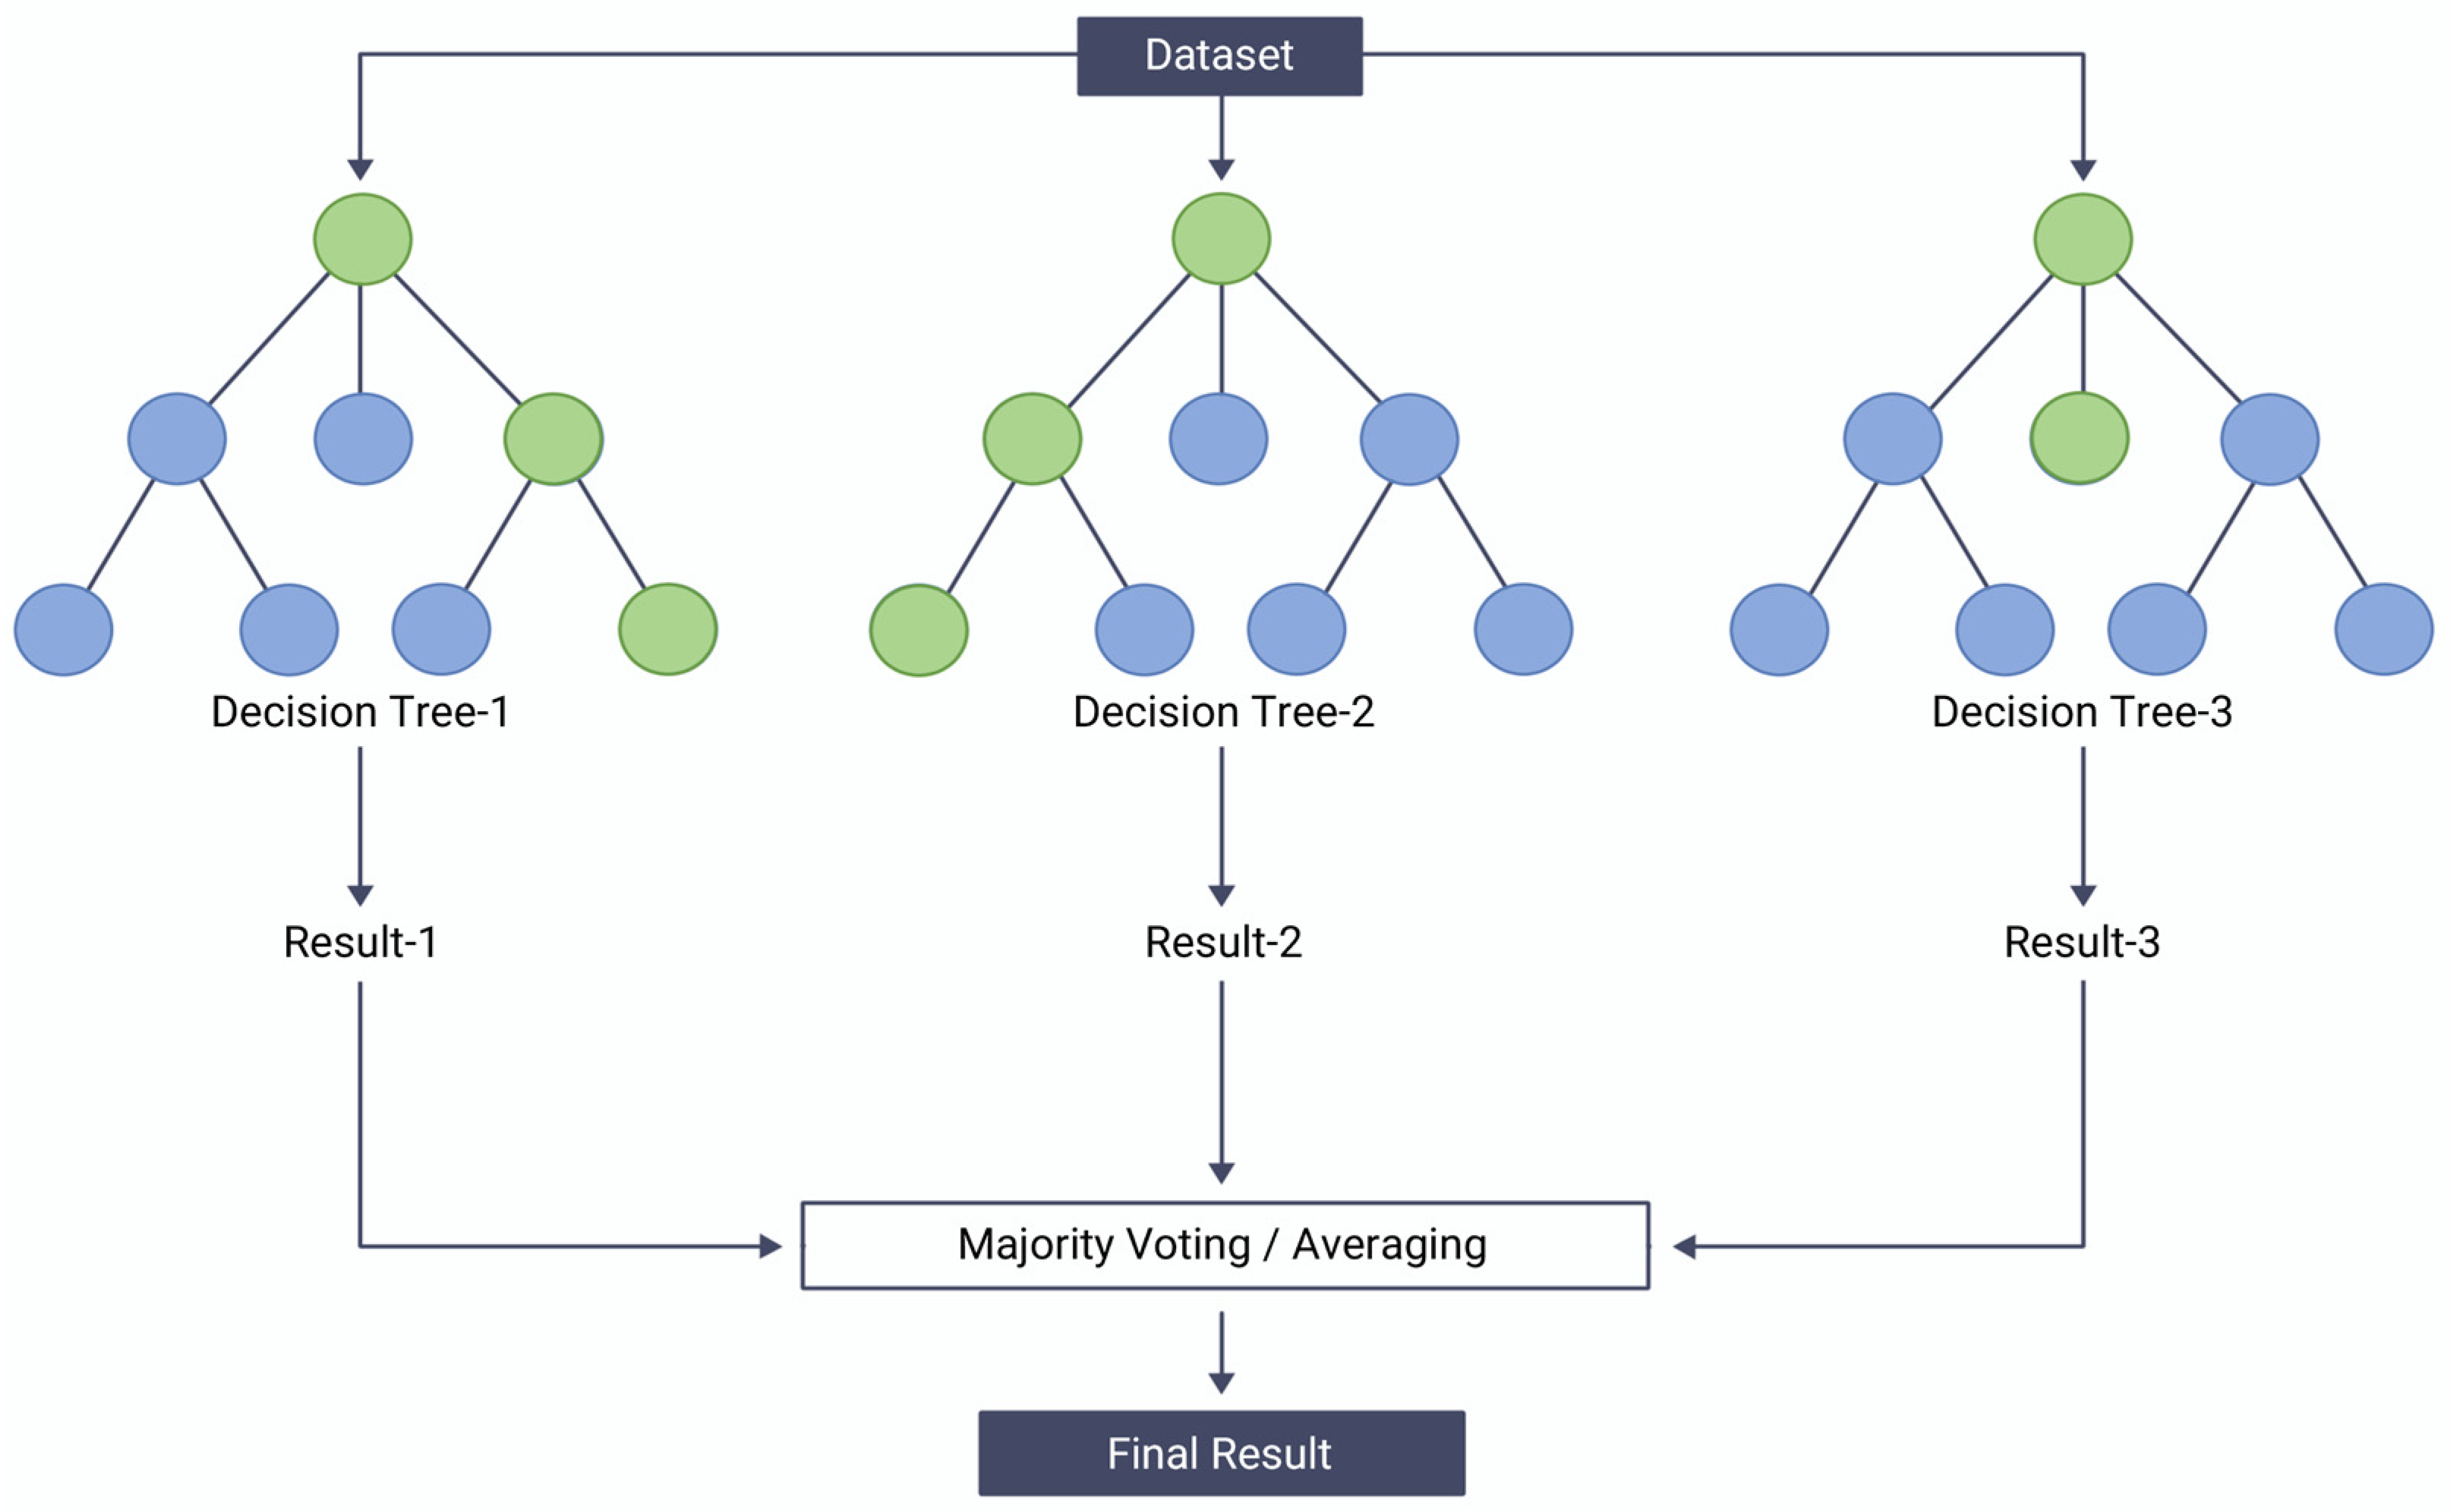
3.3.3. Random Forest and Extra Trees
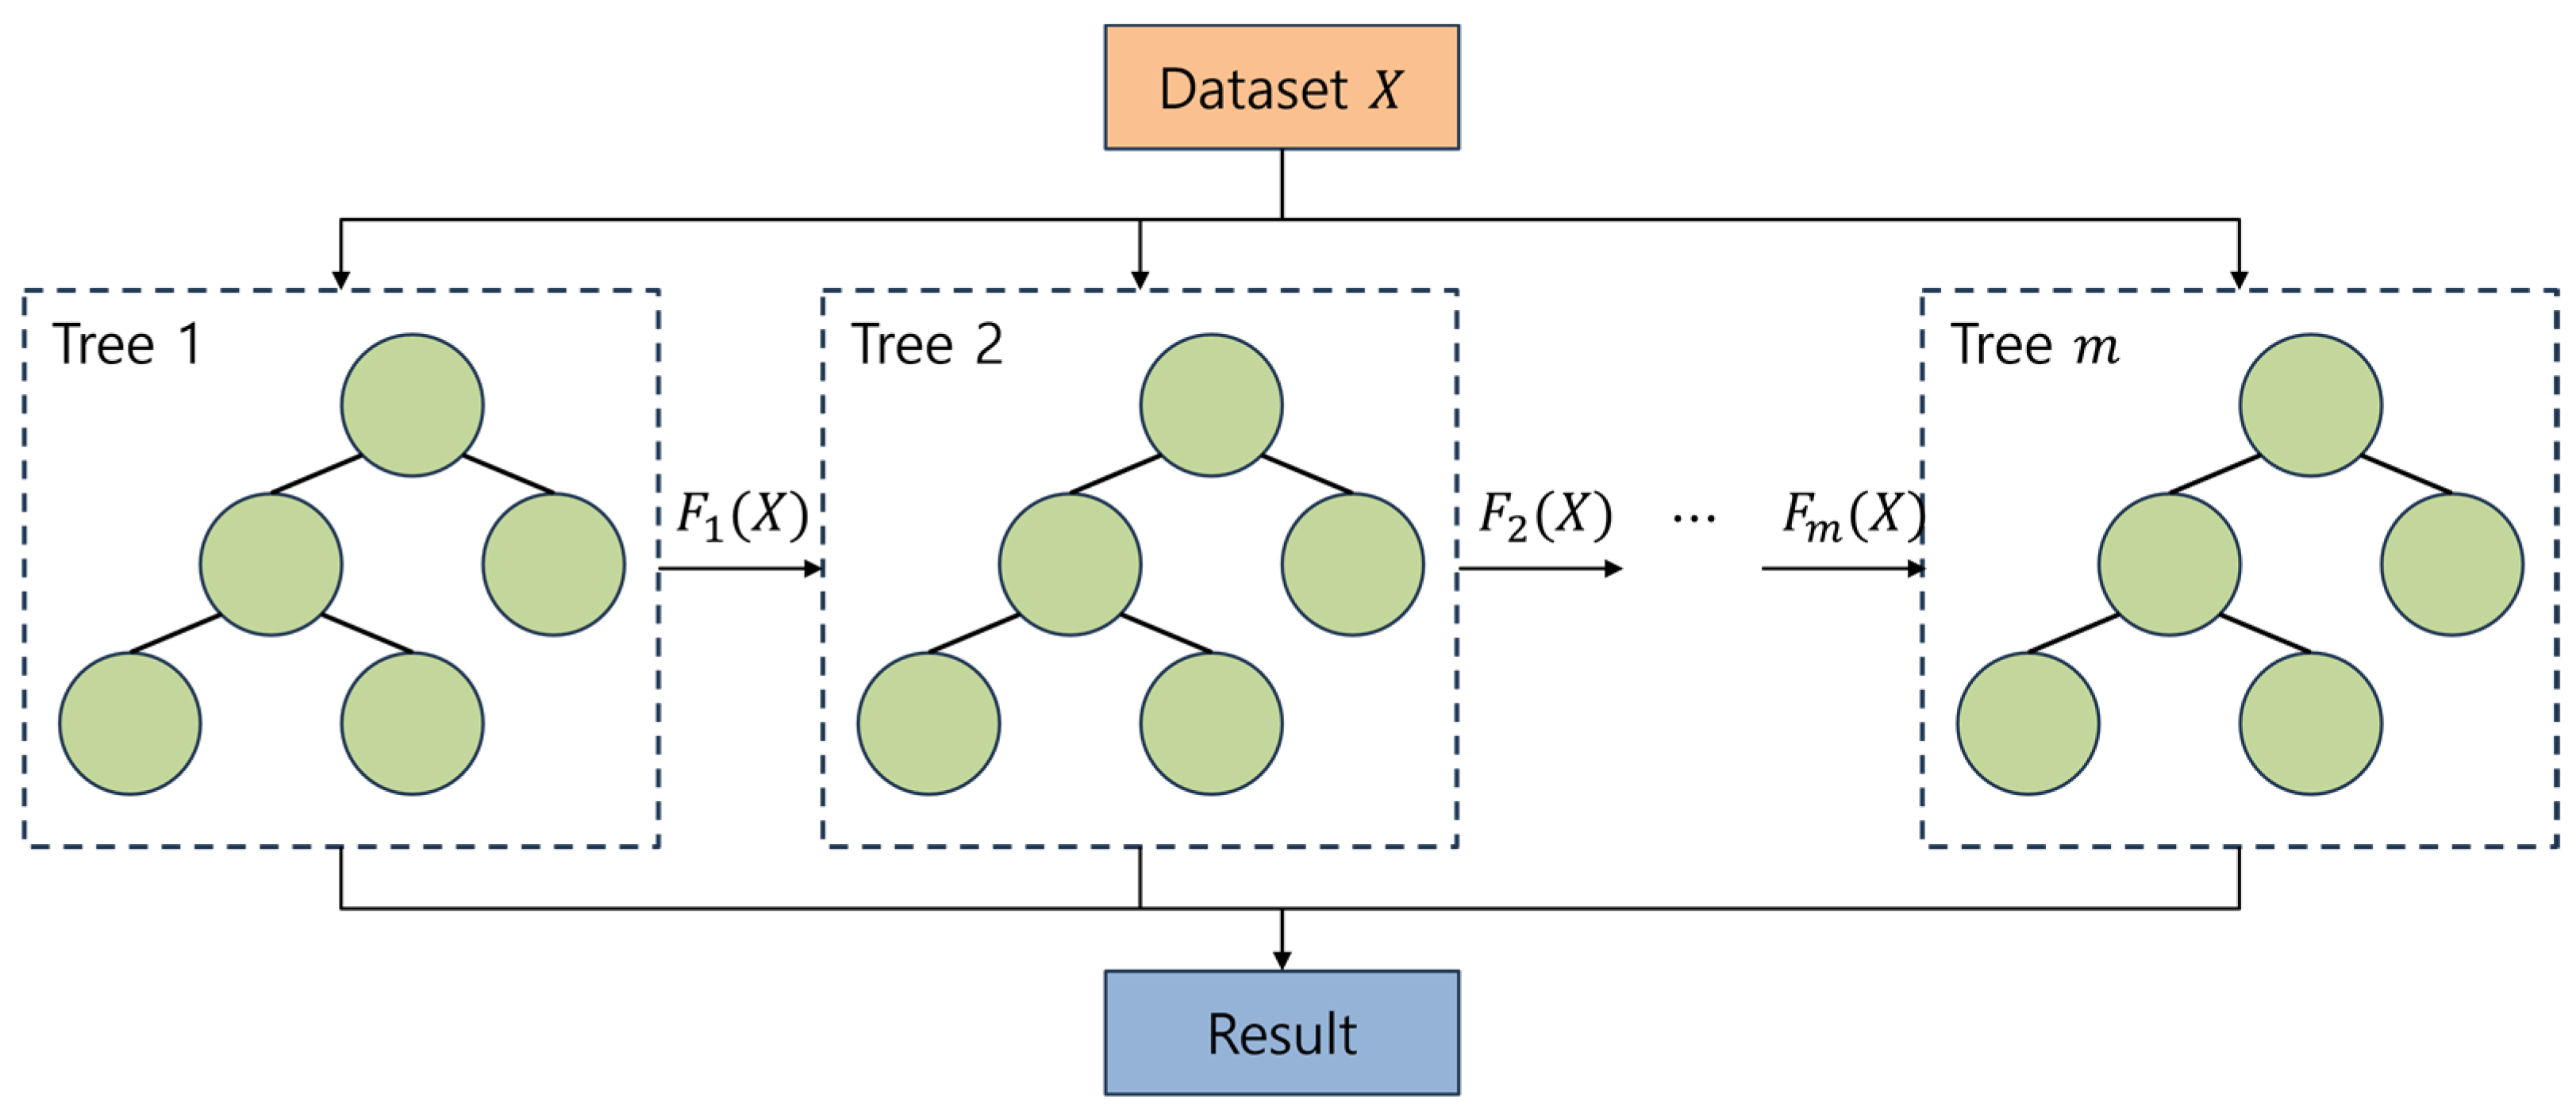
3.3.4. Gradient Boosting
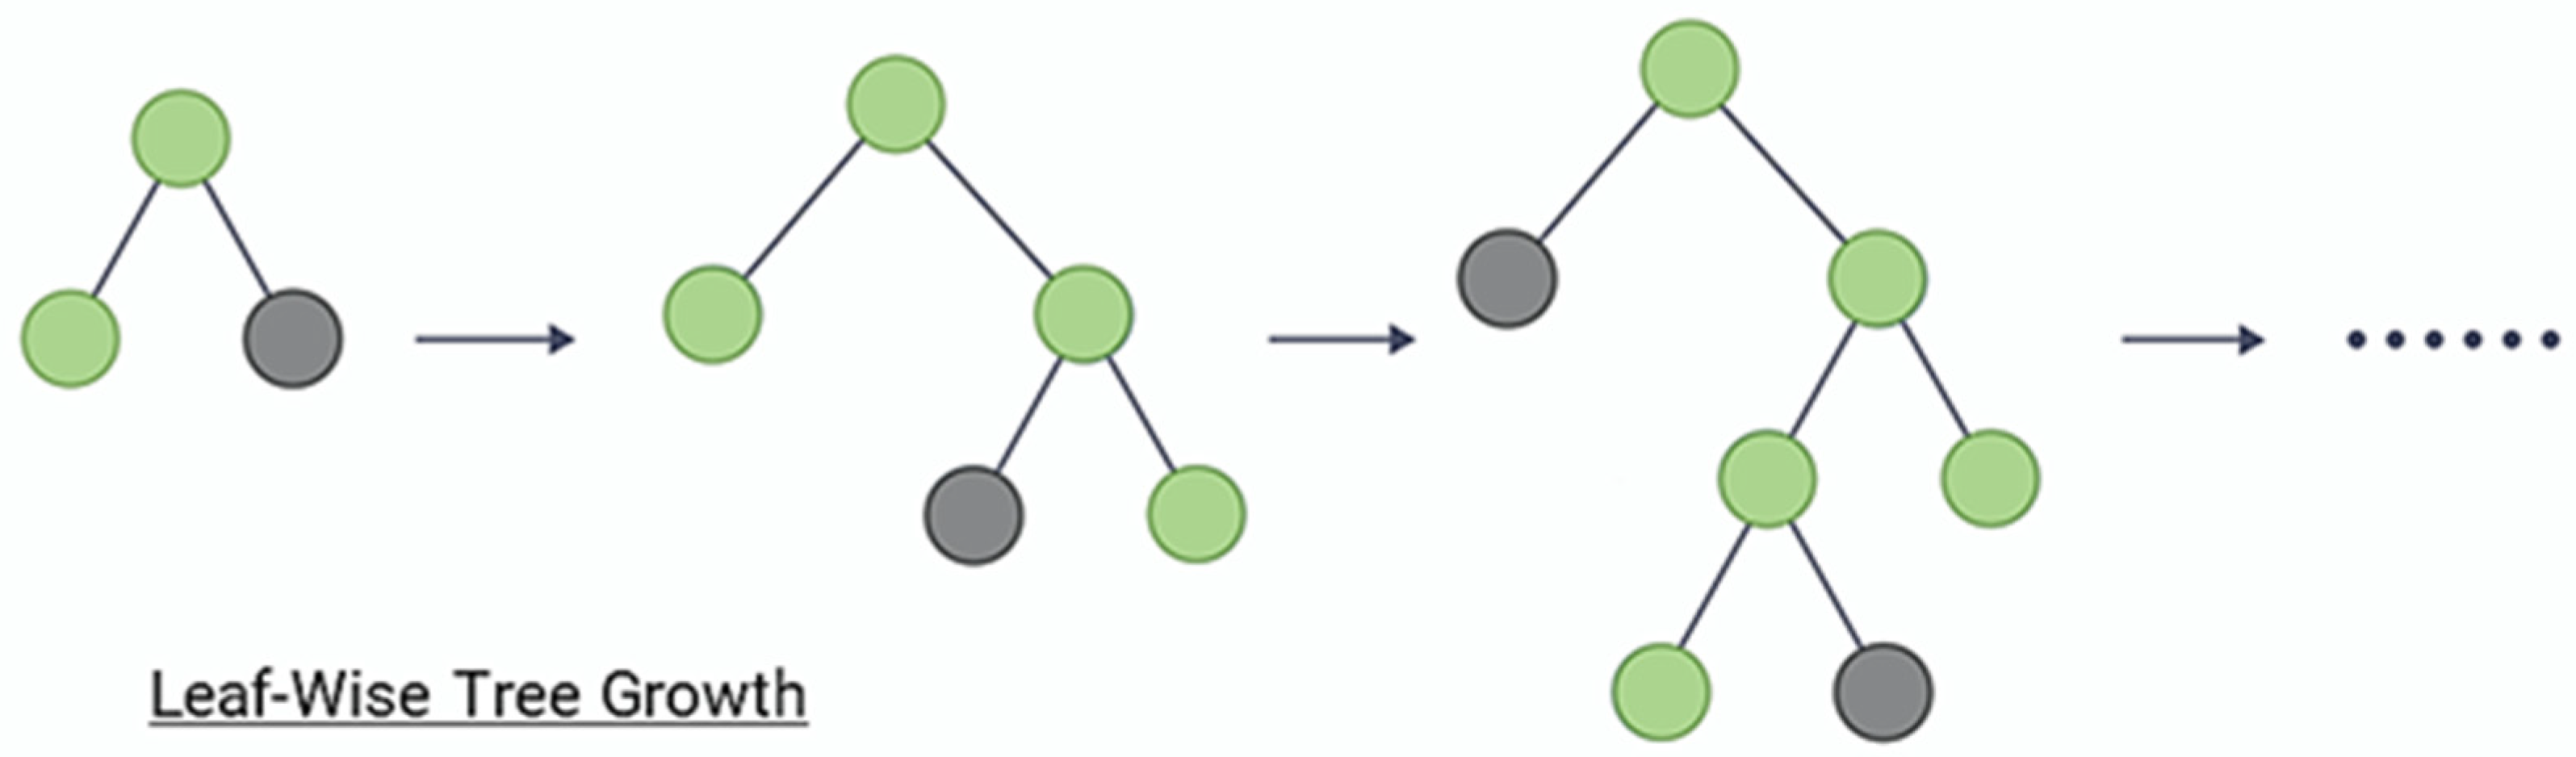
3.3.5. LightGBM
3.3.6. eXtreme Gradient Boosting (XGBoost)
3.3.7. CatBoost
4. Experimental Results
4.1. Experimental Environments
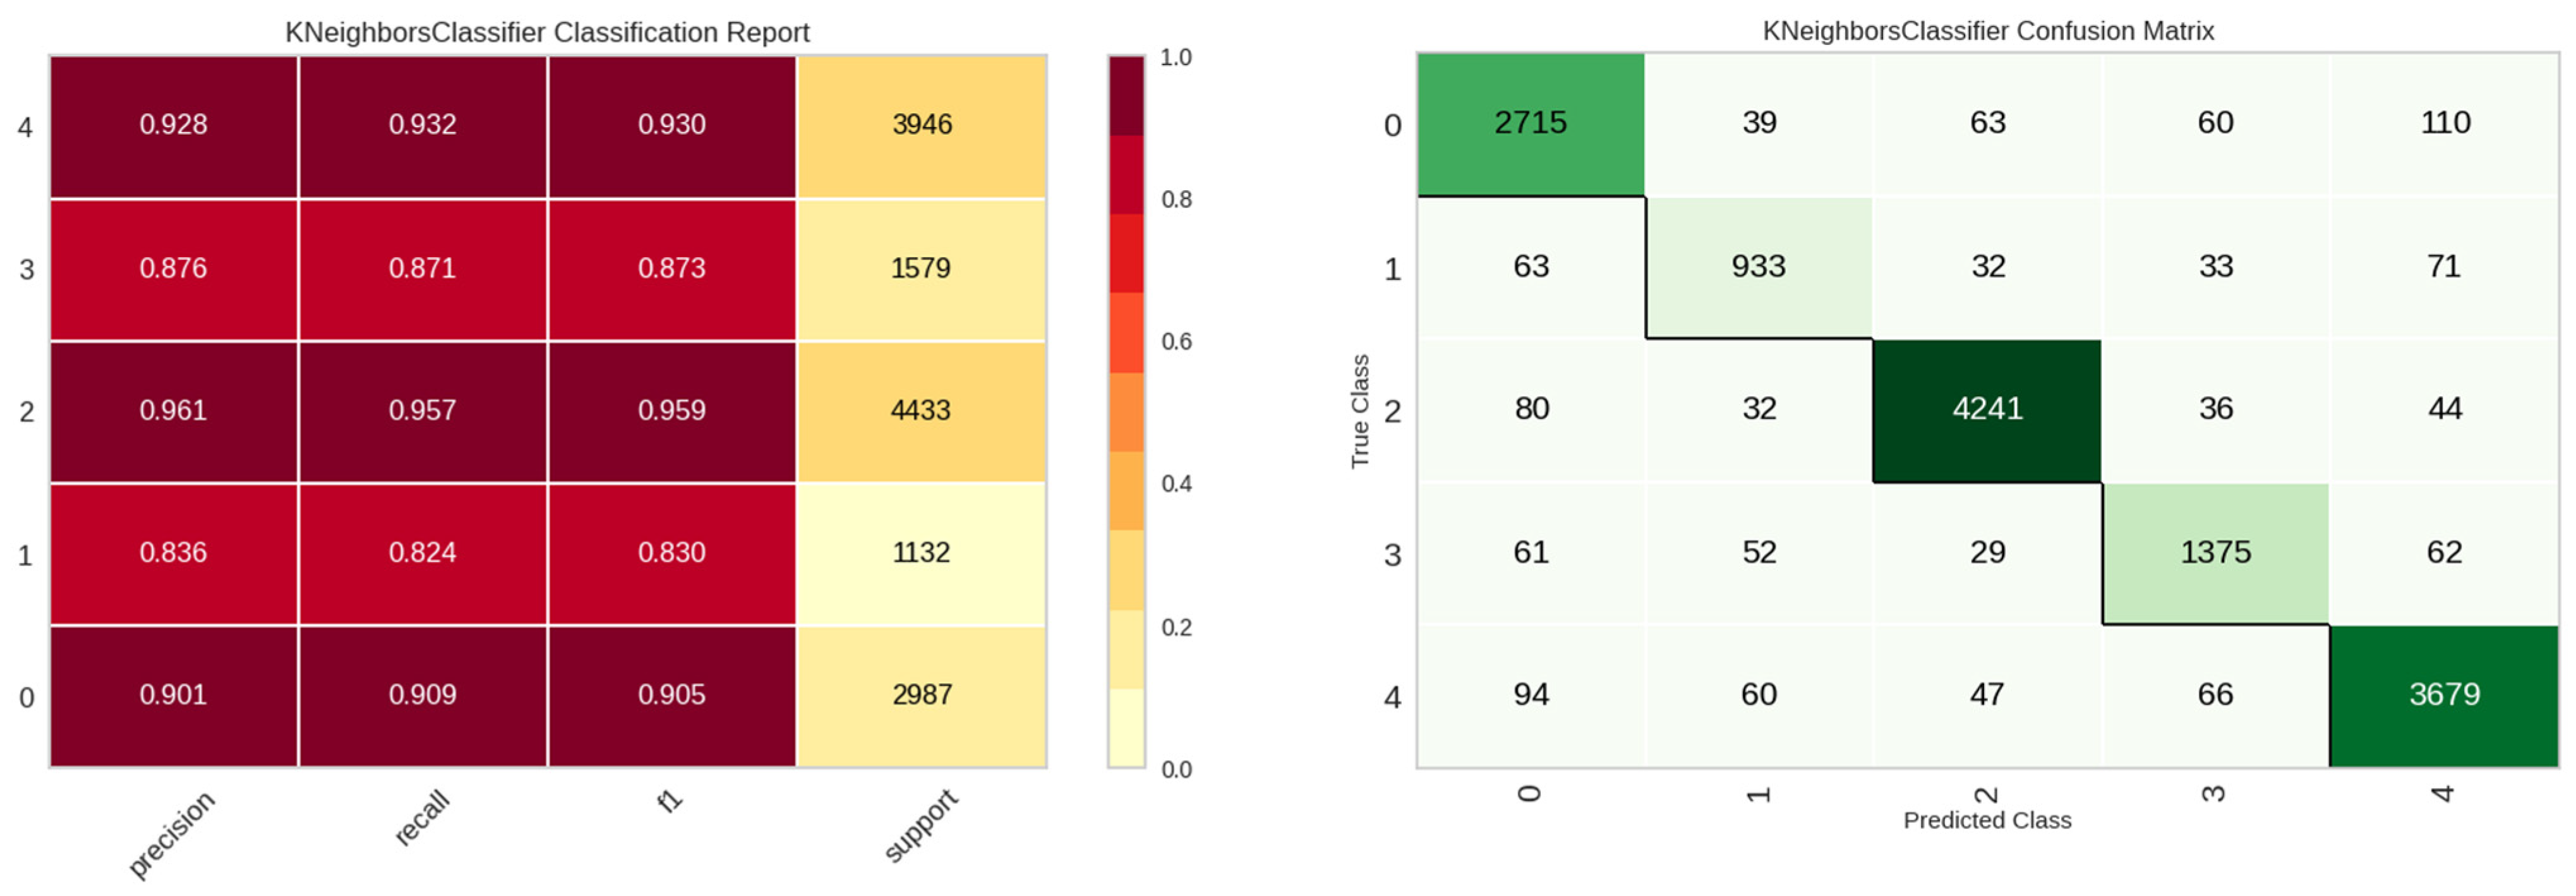
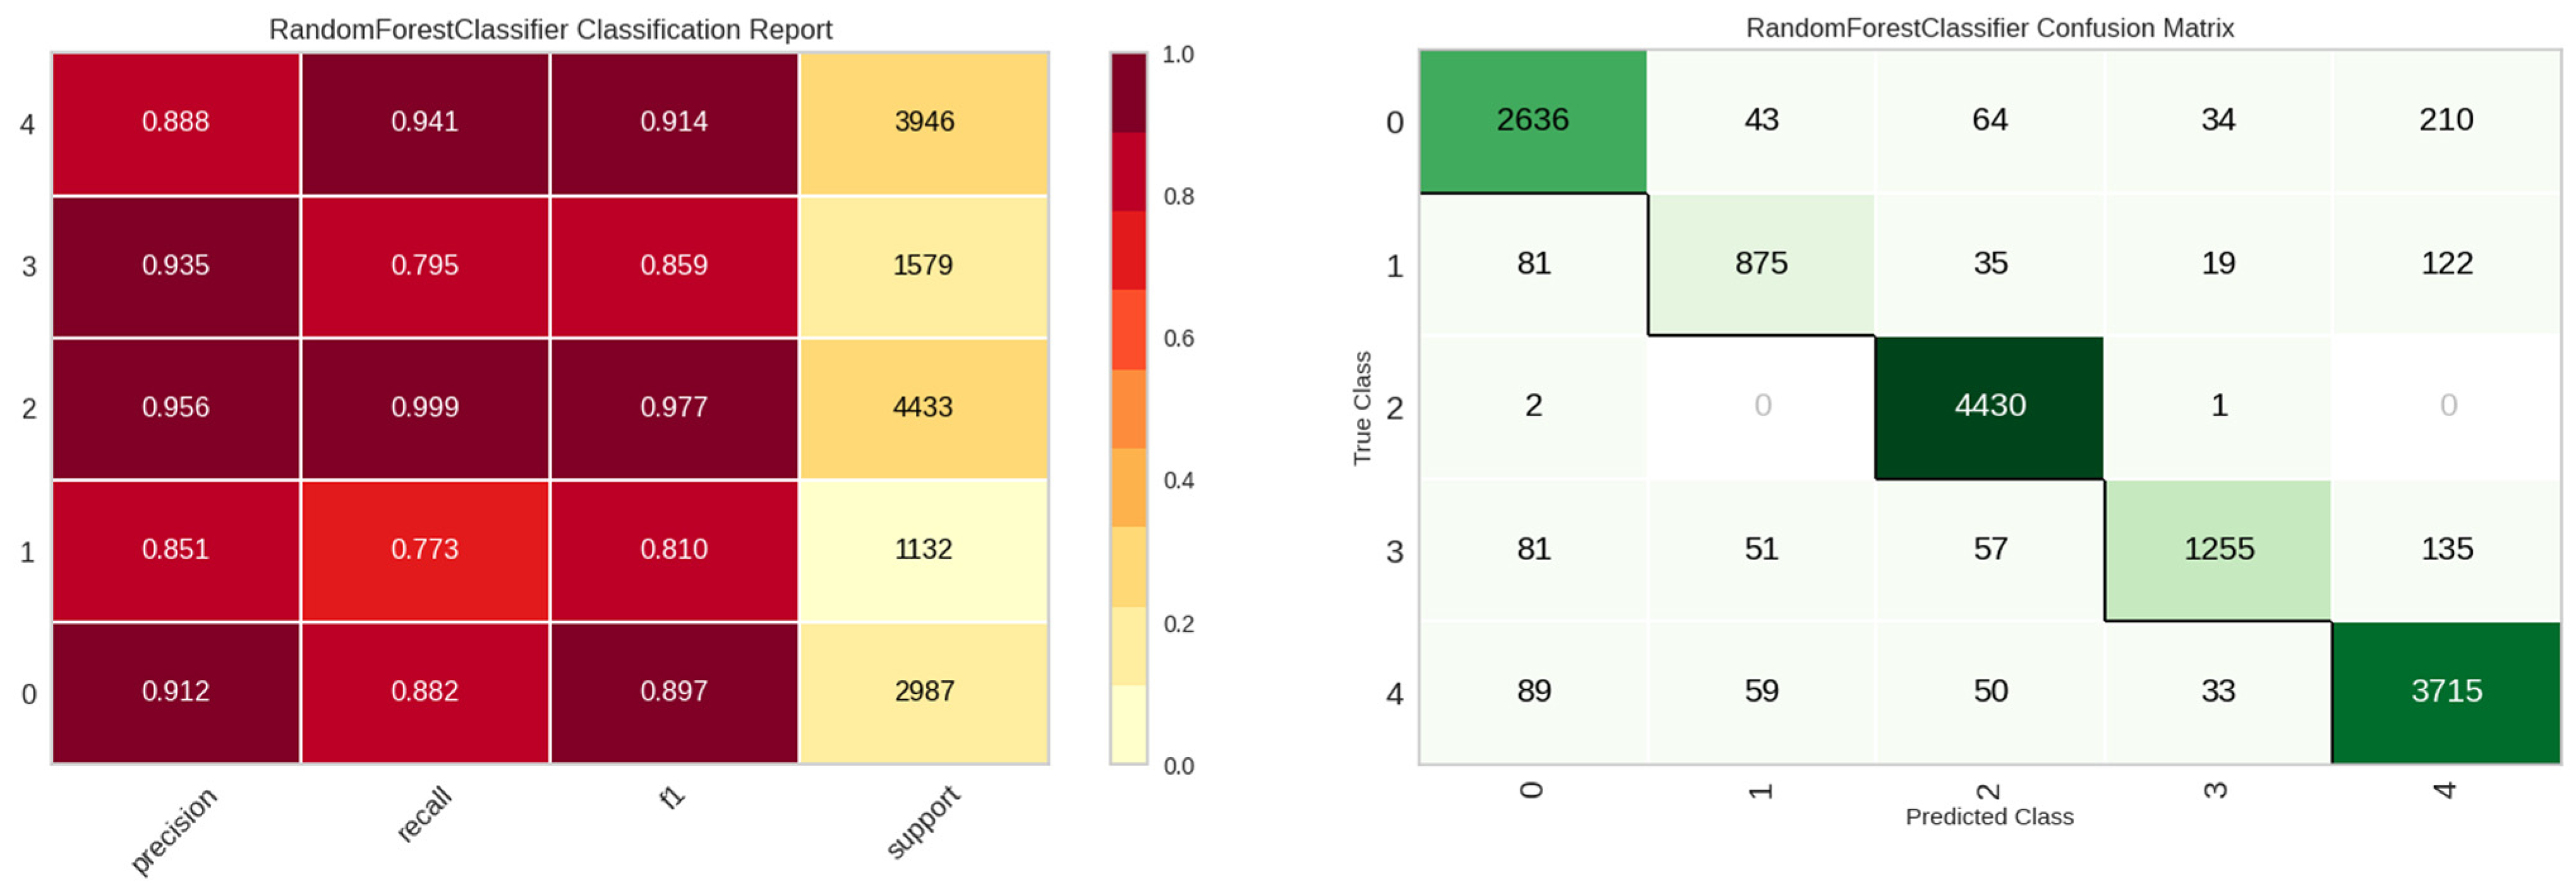
4.2. Model Evaluation
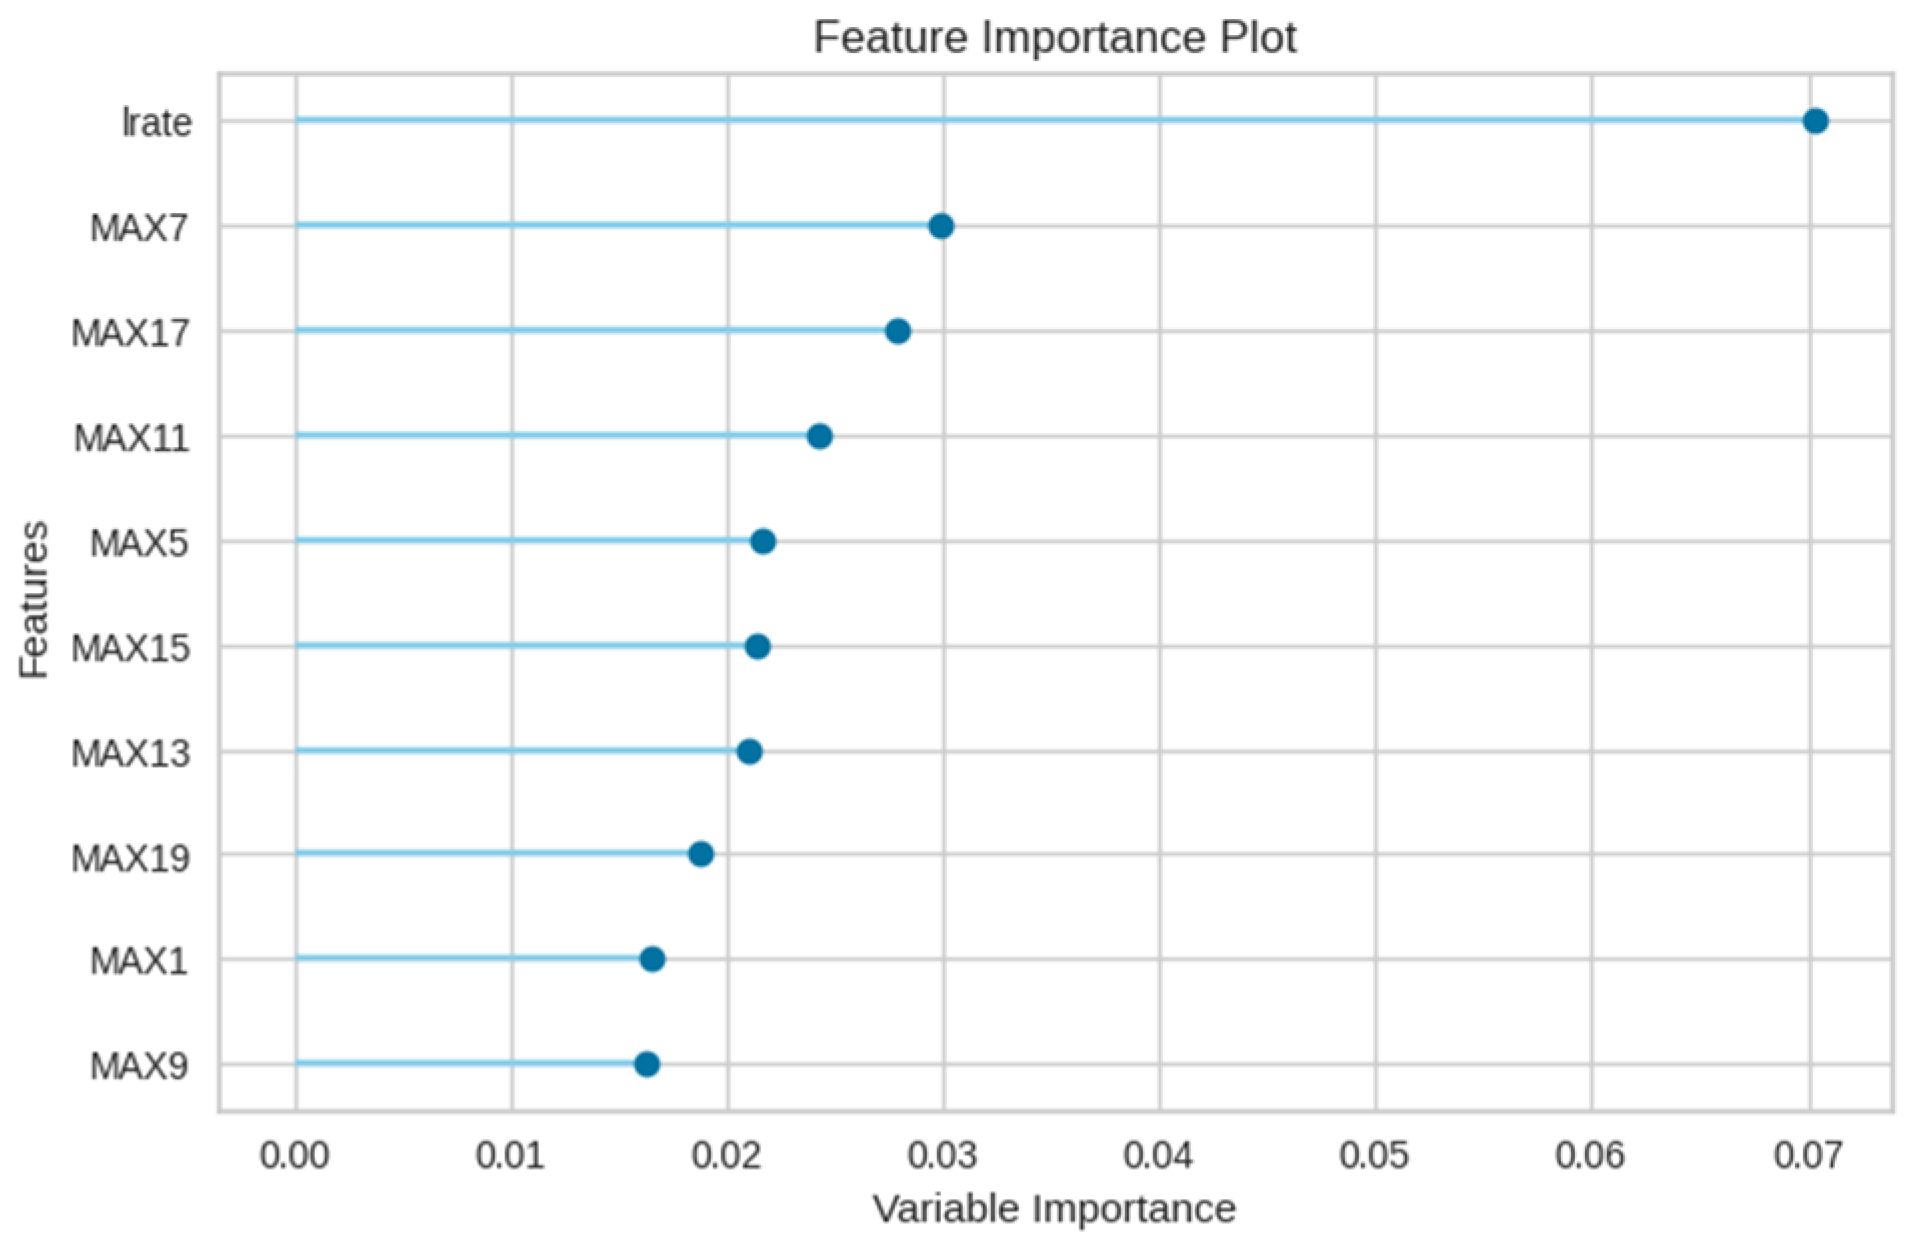
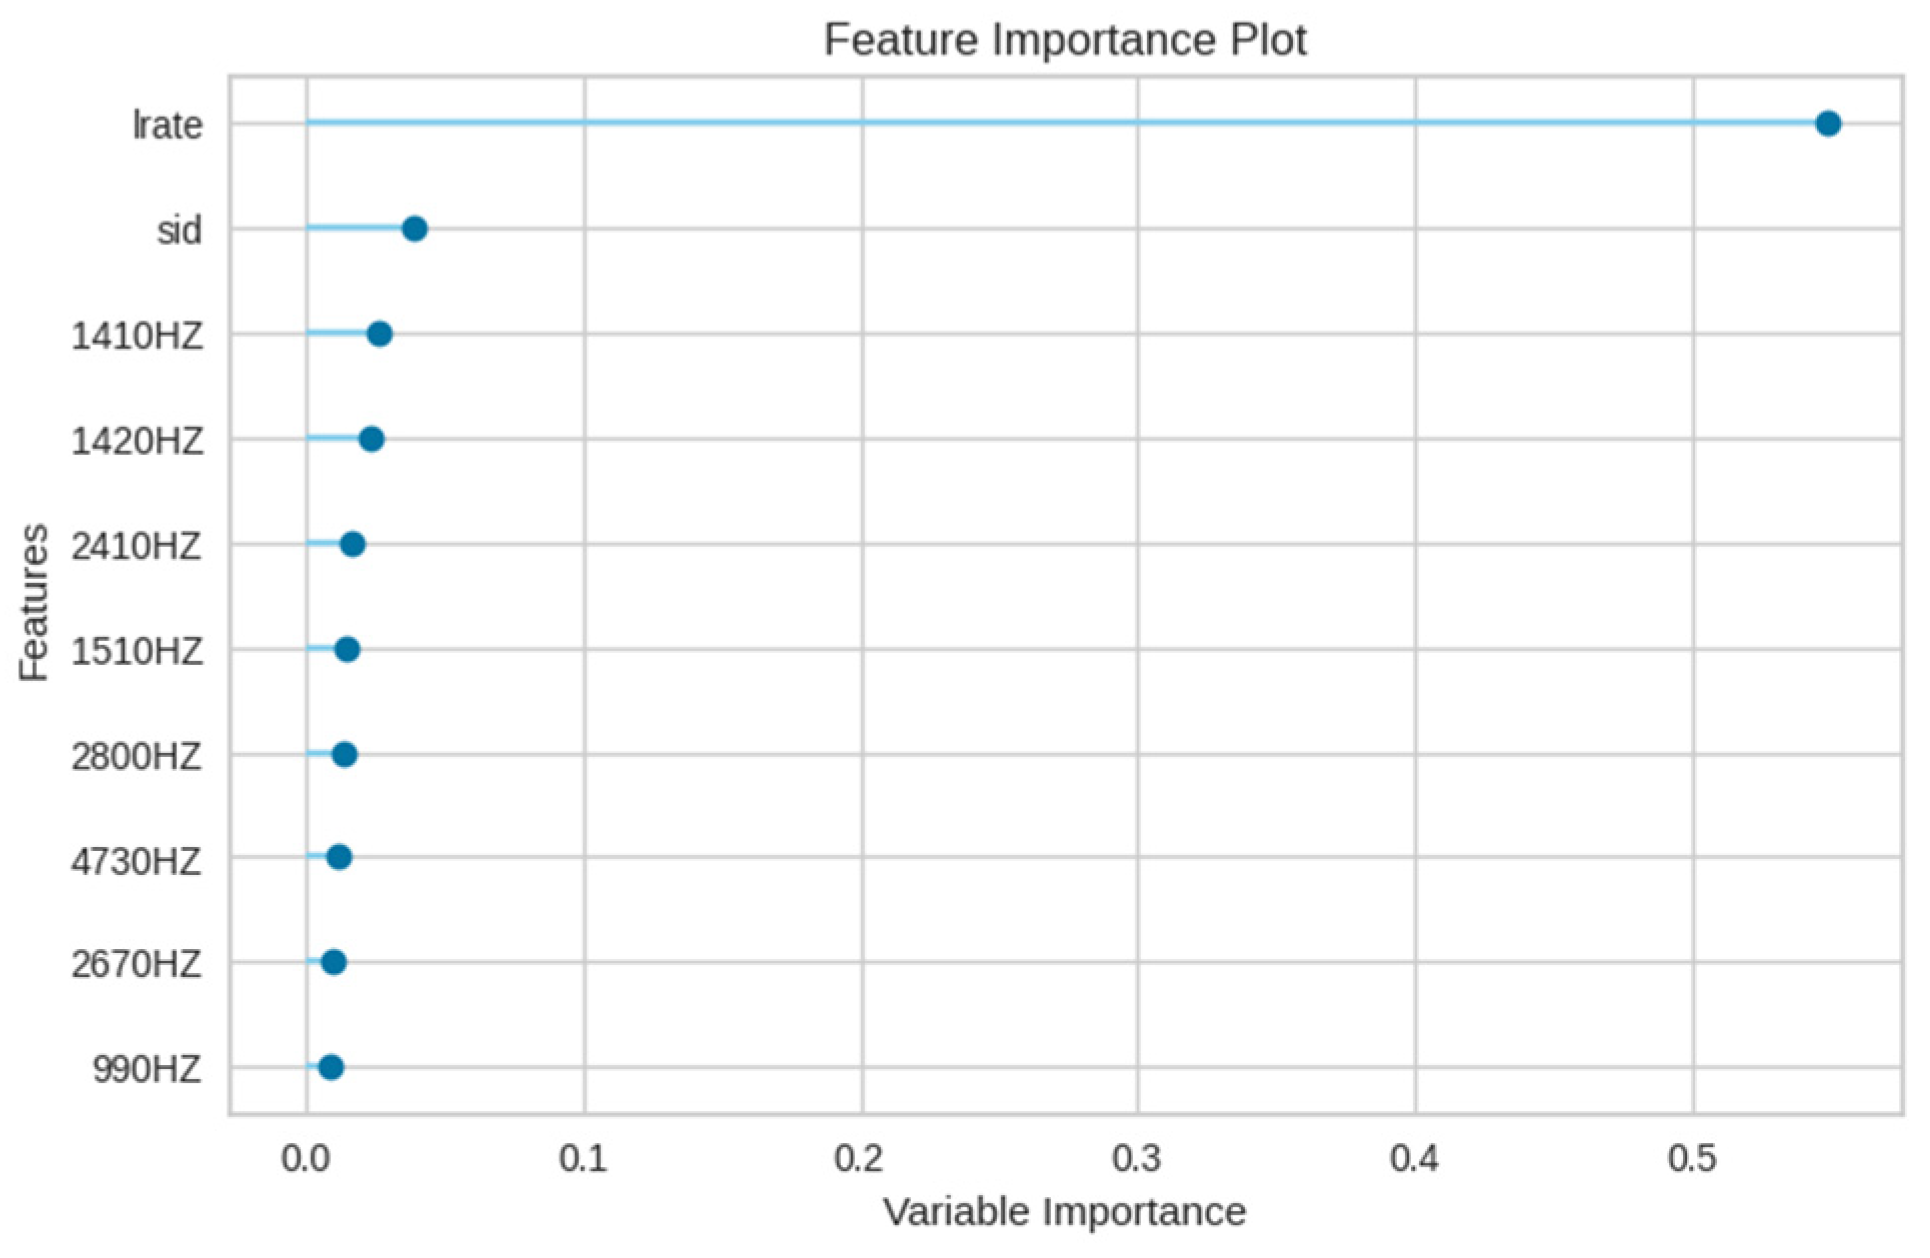
4.2.1. Experimental Results for E1
4.2.2. Experimental Results for E2
4.2.3. Experimental Results for E3
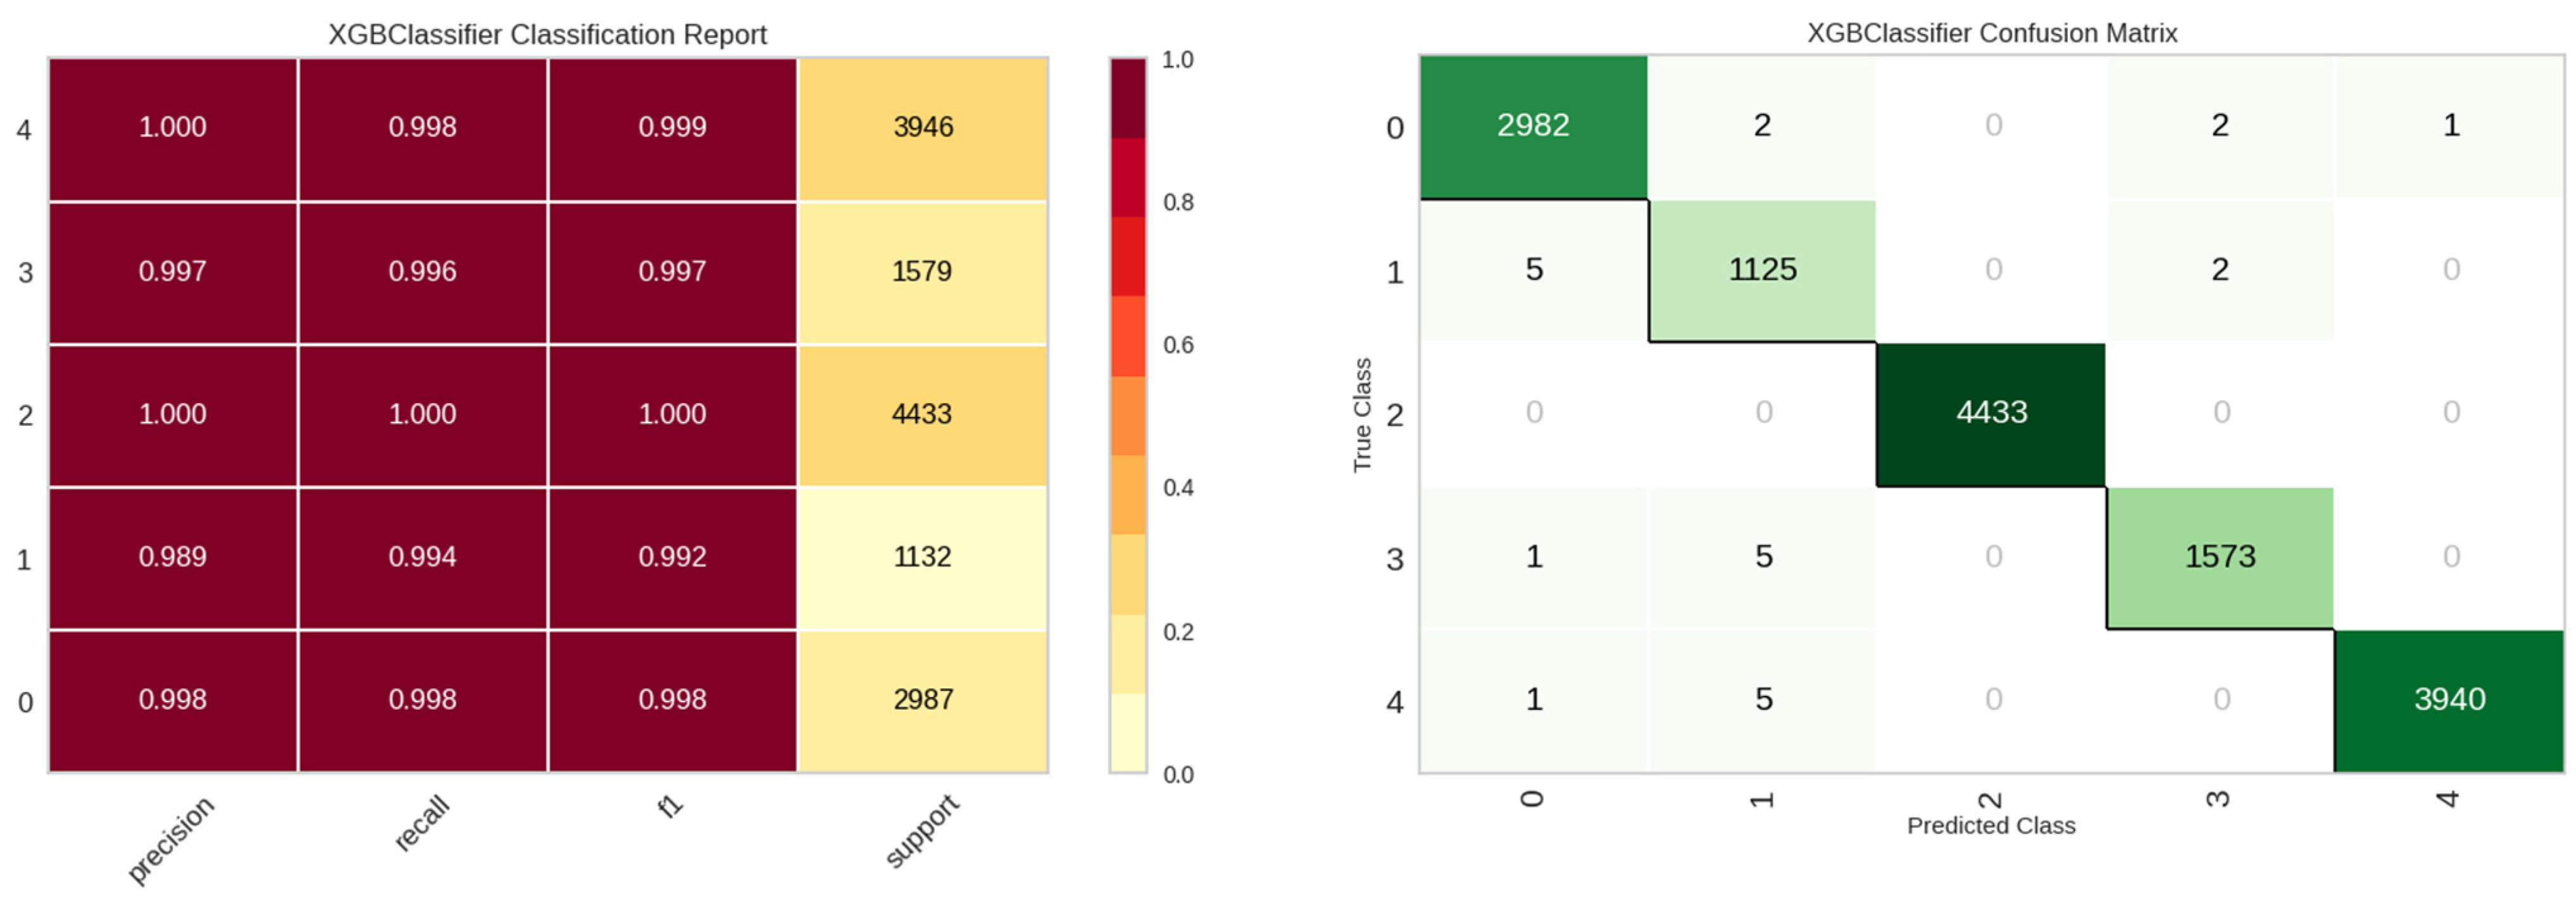
4.2.4. Experimental Results for E4
5. Conclusions
Author Contributions
Funding
Institutional Review Board Statement
Informed Consent Statement
Data Availability Statement
Conflicts of Interest
References
- Faheem, M.; Butt, R.A.; Raza, B.; Alquhayz, H.; Ashraf, M.W.; Shah, S.B.; Ngadi, M.A.; Gungor, V.C. QoSRP: A cross-layer QoS channel-aware routing protocol for the Internet of underwater acoustic sensor networks. Sensors 2019, 19, 4762. [Google Scholar] [CrossRef] [PubMed]
- Faheem, M.; Ngadi, M.A.; Gungor, V.C. Energy efficient multi-objective evolutionary routing scheme for reliable data gathering in Internet of underwater acoustic sensor networks. Ad Hoc Netw. 2019, 93, 101912. [Google Scholar] [CrossRef]
- Ismail, M.I.M.; Dziyauddin, R.A.; Salleh, N.A.A.; Muhammad-Sukki, F.; Bani, N.A.; Izhar, M.A.M.; Latiff, L.A. A review of vibration detection methods using accelerometer sensors for water pipeline leakage. IEEE Access 2019, 7, 51965–51981. [Google Scholar] [CrossRef]
- Liu, Y.; Ma, X.; Li, Y.; Tie, Y.; Zhang, Y.; Gao, J. Water pipeline leakage detection based on machine learning and wireless sensor networks. Sensors 2019, 19, 5086. [Google Scholar] [CrossRef] [PubMed]
- Fereidooni, Z.; Tahayori, H.; Bahadori-Jahromi, A. A hybrid model-based method for leak detection in large scale water distribution networks. J. Ambient. Intell. Humaniz. Comput. 2021, 12, 1613–1629. [Google Scholar] [CrossRef]
- Luong, T.T.; Kim, J.M. The enhancement of leak detection performance for water pipelines through the renovation of training data. Sensors 2020, 20, 2542. [Google Scholar] [CrossRef]
- Nkemeni, V.; Mieyeville, F.; Tsafack, P. A distributed computing solution based on distributed kalman filter for leak detection in WSN-based water pipeline monitoring. Sensors 2020, 20, 5204. [Google Scholar] [CrossRef] [PubMed]
- Shukla, H.; Piratla, K. Leakage detection in water pipelines using supervised classification of acceleration signals. Autom. Constr. 2020, 117, 103256. [Google Scholar] [CrossRef]
- Mysorewala, M.F.; Cheded, L.; Ali, I.M. Leak detection using flow-induced vibrations in pressurized wall-mounted water pipelines. IEEE Access 2020, 8, 188673–188687. [Google Scholar]
- Wang, W.; Sun, H.; Guo, J.; Lao, L.; Wu, S.; Zhang, J. Experimental study on water pipeline leak using In-Pipe acoustic signal analysis and artificial neural network prediction. Measurement 2021, 186, 110094. [Google Scholar] [CrossRef]
- Guo, G.; Yu, X.; Liu, S.; Ma, Z.; Wu, Y.; Xu, X.; Wang, X.; Smith, K.; Wu, X. Leakage detection in water distribution systems based on time–frequency convolutional neural network. J. Water Resour. Plan. Manag. 2021, 147, 04020101. [Google Scholar] [CrossRef]
- Ravichandran, T.; Gavahi, K.; Ponnambalam, K.; Burtea, V.; Mousavi, S.J. Ensemble-based machine learning approach for improved leak detection in water mains. J. Hydroinformatics 2021, 23, 307–323. [Google Scholar] [CrossRef]
- Zhou, M.; Yang, Y.; Xu, Y.; Hu, Y.; Cai, Y.; Lin, J.; Pan, H. A pipeline leak detection and localization approach based on ensemble TL1DCNN. IEEE Access 2021, 9, 47565–47578. [Google Scholar] [CrossRef]
- Liu, M.; Yang, J.; Zheng, W. Leak Detection in Water Pipes Based on Maximum Entropy Version of Least Square Twin K-Class Support Vector Machine. Entropy 2021, 23, 1247. [Google Scholar] [CrossRef]
- Sekhavati, J.; Hashemabadi, S.H.; Soroush, M. Computational methods for pipeline leakage detection and localization: A review and comparative study. J. Loss Prev. Process Ind. 2022, 77, 104771. [Google Scholar] [CrossRef]
- Tariq, S.; Bakhtawar, B.; Zayed, T. Data-driven application of MEMS-based accelerometers for leak detection in water distribution networks. Sci. Total Environ. 2022, 809, 151110. [Google Scholar] [CrossRef]
- Tijani, I.A.; Abdelmageed, S.; Fares, A.; Fan, K.H.; Hu, Z.Y.; Zayed, T. Improving the leak detection efficiency in water distribution networks using noise loggers. Sci. Total Environ. 2022, 821, 153530. [Google Scholar] [CrossRef]
- Ahmad, S.; Ahmad, Z.; Kim, C.H.; Kim, J.M. A method for pipeline leak detection based on acoustic imaging and deep learning. Sensors 2022, 22, 1562. [Google Scholar] [CrossRef]
- Xu, W.; Fan, S.; Wang, C.; Wu, J.; Yao, Y.; Wu, J. Leakage identification in water pipes using explainable ensemble tree model of vibration signals. Measurement 2022, 194, 110996. [Google Scholar] [CrossRef]
- Fu, G.; Jin, Y.; Sun, S.; Yuan, Z.; Butler, D. The role of deep learning in urban water management: A critical review. Water Res. 2022, 223, 118973. [Google Scholar] [CrossRef]
- Yu, T.; Chen, X.; Yan, W.; Xu, Z.; Ye, M. Leak detection in water distribution systems by classifying vibration signals. Mech. Syst. Signal Process. 2023, 185, 109810. [Google Scholar] [CrossRef]
- Zhang, C.; Alexander, B.J.; Stephens, M.L.; Lambert, M.F.; Gong, J. A convolutional neural network for pipe crack and leak detection in smart water network. Struct. Health Monit. 2023, 22, 232–244. [Google Scholar] [CrossRef]
- Vanijjirattikhan, R.; Khomsay, S.; Kitbutrawat, N.; Khomsay, K.; Supakchukul, U.; Udomsuk, S.; Suwatthikul, J.; Oumtrakul, N.; Anusart, K. AI-based acoustic leak detection in water distribution systems. Results Eng. 2022, 15, 100557. [Google Scholar] [CrossRef]
- Choudhary, P.; Botre, B.A.; Akbar, S.A. 1-D convolution neural network based leak detection, location and size estimation in smart water grid. Urban Water J. 2023, 20, 341–351. [Google Scholar] [CrossRef]
- Islam, M.R.; Azam, S.; Shanmugam, B.; Mathur, D. A Review on Current Technologies and Future Direction of Water Leakage Detection in Water Distribution Network. IEEE Access 2022, 10, 107177–107201. [Google Scholar] [CrossRef]
- Shen, Y.; Cheng, W. A Tree-Based Machine Learning Method for Pipeline Leakage Detection. Water 2022, 14, 2833. [Google Scholar] [CrossRef]
- Choi, J.; Im, S. Application of CNN Models to Detect and Classify Leakages in Water Pipelines Using Magnitude Spectra of Vibration Sound. Appl. Sci. 2023, 13, 2845. [Google Scholar] [CrossRef]
- Yussif, A.M.; Sadeghi, H.; Zayed, T. Application of Machine Learning for Leak Localization in Water Supply Networks. Buildings 2023, 13, 849. [Google Scholar] [CrossRef]
- Ullah, N.; Ahmed, Z.; Kim, J.M. Pipeline Leakage Detection Using Acoustic Emission and Machine Learning Algorithms. Sensors 2023, 23, 3226. [Google Scholar] [CrossRef]
- Peterson, L.E. K-nearest neighbor. Scholarpedia 2009, 4, 1883. [Google Scholar] [CrossRef]
- Myles, A.J.; Feudale, R.N.; Liu, Y.; Woody, N.A.; Brown, S.D. An introduction to decision tree modeling. J. Chemom. A J. Chemom. Soc. 2004, 18, 275–285. [Google Scholar] [CrossRef]
- Breiman, L. Random forests. Mach. Learn. 2001, 45, 5–32. [Google Scholar] [CrossRef]
- Geurts, P.; Ernst, D.; Wehenkel, L. Extremely randomized trees. Mach. Learn. 2006, 63, 3–42. [Google Scholar] [CrossRef]
- Friedman, J.H. Greedy function approximation: A gradient boosting machine. Ann. Stat. 2001, 29, 1189–1232. [Google Scholar] [CrossRef]
- Ke, G.; Meng, Q.; Finley, T.; Wang, T.; Chen, W.; Ma, W.; Ye, Q.; Liu, T.-Y. Lightgbm: A highly efficient gradient boosting decision tree. In Advances in Neural Information Processing Systems, Proceedings of the 31st Conference on Neural Information Processing Systems (NIPS 2017), Long Beach, CA, USA, 4–9 December 2017; NeurIPS Proceedings: Long Beach, CA, USA, 2017; Volume 30. [Google Scholar]
- Chen, T.; Guestrin, C. Xgboost: A scalable tree boosting system. In Proceedings of the 22nd ACM SIGKDD International Conference on Knowledge Discovery and Data Mining, San Francisco, CA, USA, 13–17 August 2016; Association for Computing Machinery: New York, NY, USA; pp. 785–794. [Google Scholar]
- Prokhorenkova, L.; Gusev, G.; Vorobev, A.; Dorogush, A.V.; Gulin, A. CatBoost: Unbiased boosting with categorical features. In Advances in Neural Information Processing Systems, Proceedings of the 32nd Conference on Neural Information Processing Systems (NeurIPS 2018), Montréal, QC, Canada, 2–8 December 2018; NeurIPS Proceedings: Montréal, QC, Canada, 2018; Volume 31. [Google Scholar]
- Scikit-Learn: Machine Learning in Python. Available online: https://scikit-learn.org/ (accessed on 30 October 2023).
- A Fast, Distributed, High Performance Gradient Boosting (GBT, GBDT, GBRT, GBM or MART) Framework Based on Decision Tree Algorithms, Used for Ranking, Classification and Many Other Machine Learning Tasks. Available online: https://github.com/microsoft/LightGBM (accessed on 30 October 2023).
- Scalable, Portable and Distributed Gradient Boosting (GBDT, GBRT or GBM) Library, for Python, R, Java, Scala, C++ and More. Runs on Single Machine, Hadoop, Spark, Dask, Flink and DataFlow. Available online: https://github.com/dmlc/xgboost (accessed on 30 October 2023).
- A Fast, Scalable, High Performance Gradient Boosting on Decision Trees Library, Used for Ranking, Classification, Regression and Other Machine Learning Tasks for Python, R, Java, C++. Supports Computation on CPU and GPU. Available online: https://github.com/catboost/catboost/ (accessed on 30 October 2023).


| Water Pipe | Status Type | Leak Class | Train Data | Test Data |
|---|---|---|---|---|
| Metallic Pipes: Steel Pipe (SP), Stainless Steel Pipe (STS), Ductile Cast Iron Pipe (DCIP) Non-metallic Pipes: Polyethylene (PE), Polyvinyl chloride (PVC) | Leak detection | Outdoor leak (out) | 17,539 | 2192 |
| Indoor leak (in) | 13,273 | 1659 | ||
| Electric noise (noise) | 5029 | 629 | ||
| Other noise (other) | 7019 | 878 | ||
| Undetected | Normal noise (normal) | 19,704 | 2462 | |
| Total | 2 | 5 | 62,564 | 7820 |
| Name | Column | Description | Format or Range | Type |
|---|---|---|---|---|
| Site no. | site | Site number where the leak detection sensor is installed (identifier 1) | S-00000000 | string |
| Sensor no. | sid | Leak detection sensor number (identifier 2) | S-00000 00000 00000 | string |
| Date of leak detection | ldate | The date the leak event was detected (identifier 3) | YYYYMMDD | string |
| Leak rate | lrate | Daily dawn hours for a total of 10 leak detection leak detection and set a schedule threshold over a certain threshold and display the result as a probability (Automatically create a leak detection sensor) | 0~90 | int |
| Leak level | llevel | Daily at dawn a total of 10 water leak detection leak detection, and if the threshold over a certain threshold and display the average value. (Automatically create a leak detection sensor) | 0~5000 | int |
| Leak Detection Classification | leaktype | Indicates whether a leak is detected. | outdoor leak (out), indoor leak (in), electric noise (noise), other noise (other), normal noise (normal) | string |
| Leak Detection Frequency Range (512 columns) | 0 Hz | Leakage vibration magnitude detected at frequency 0 Hz | 0 | int |
| 10 Hz | Leakage vibration magnitude detected at frequency 10 Hz | 0~5000 | int | |
| … | … | … | … | |
| 5120 Hz | Leakage vibration magnitude detected at frequency 5120 Hz | 0~5000 | int | |
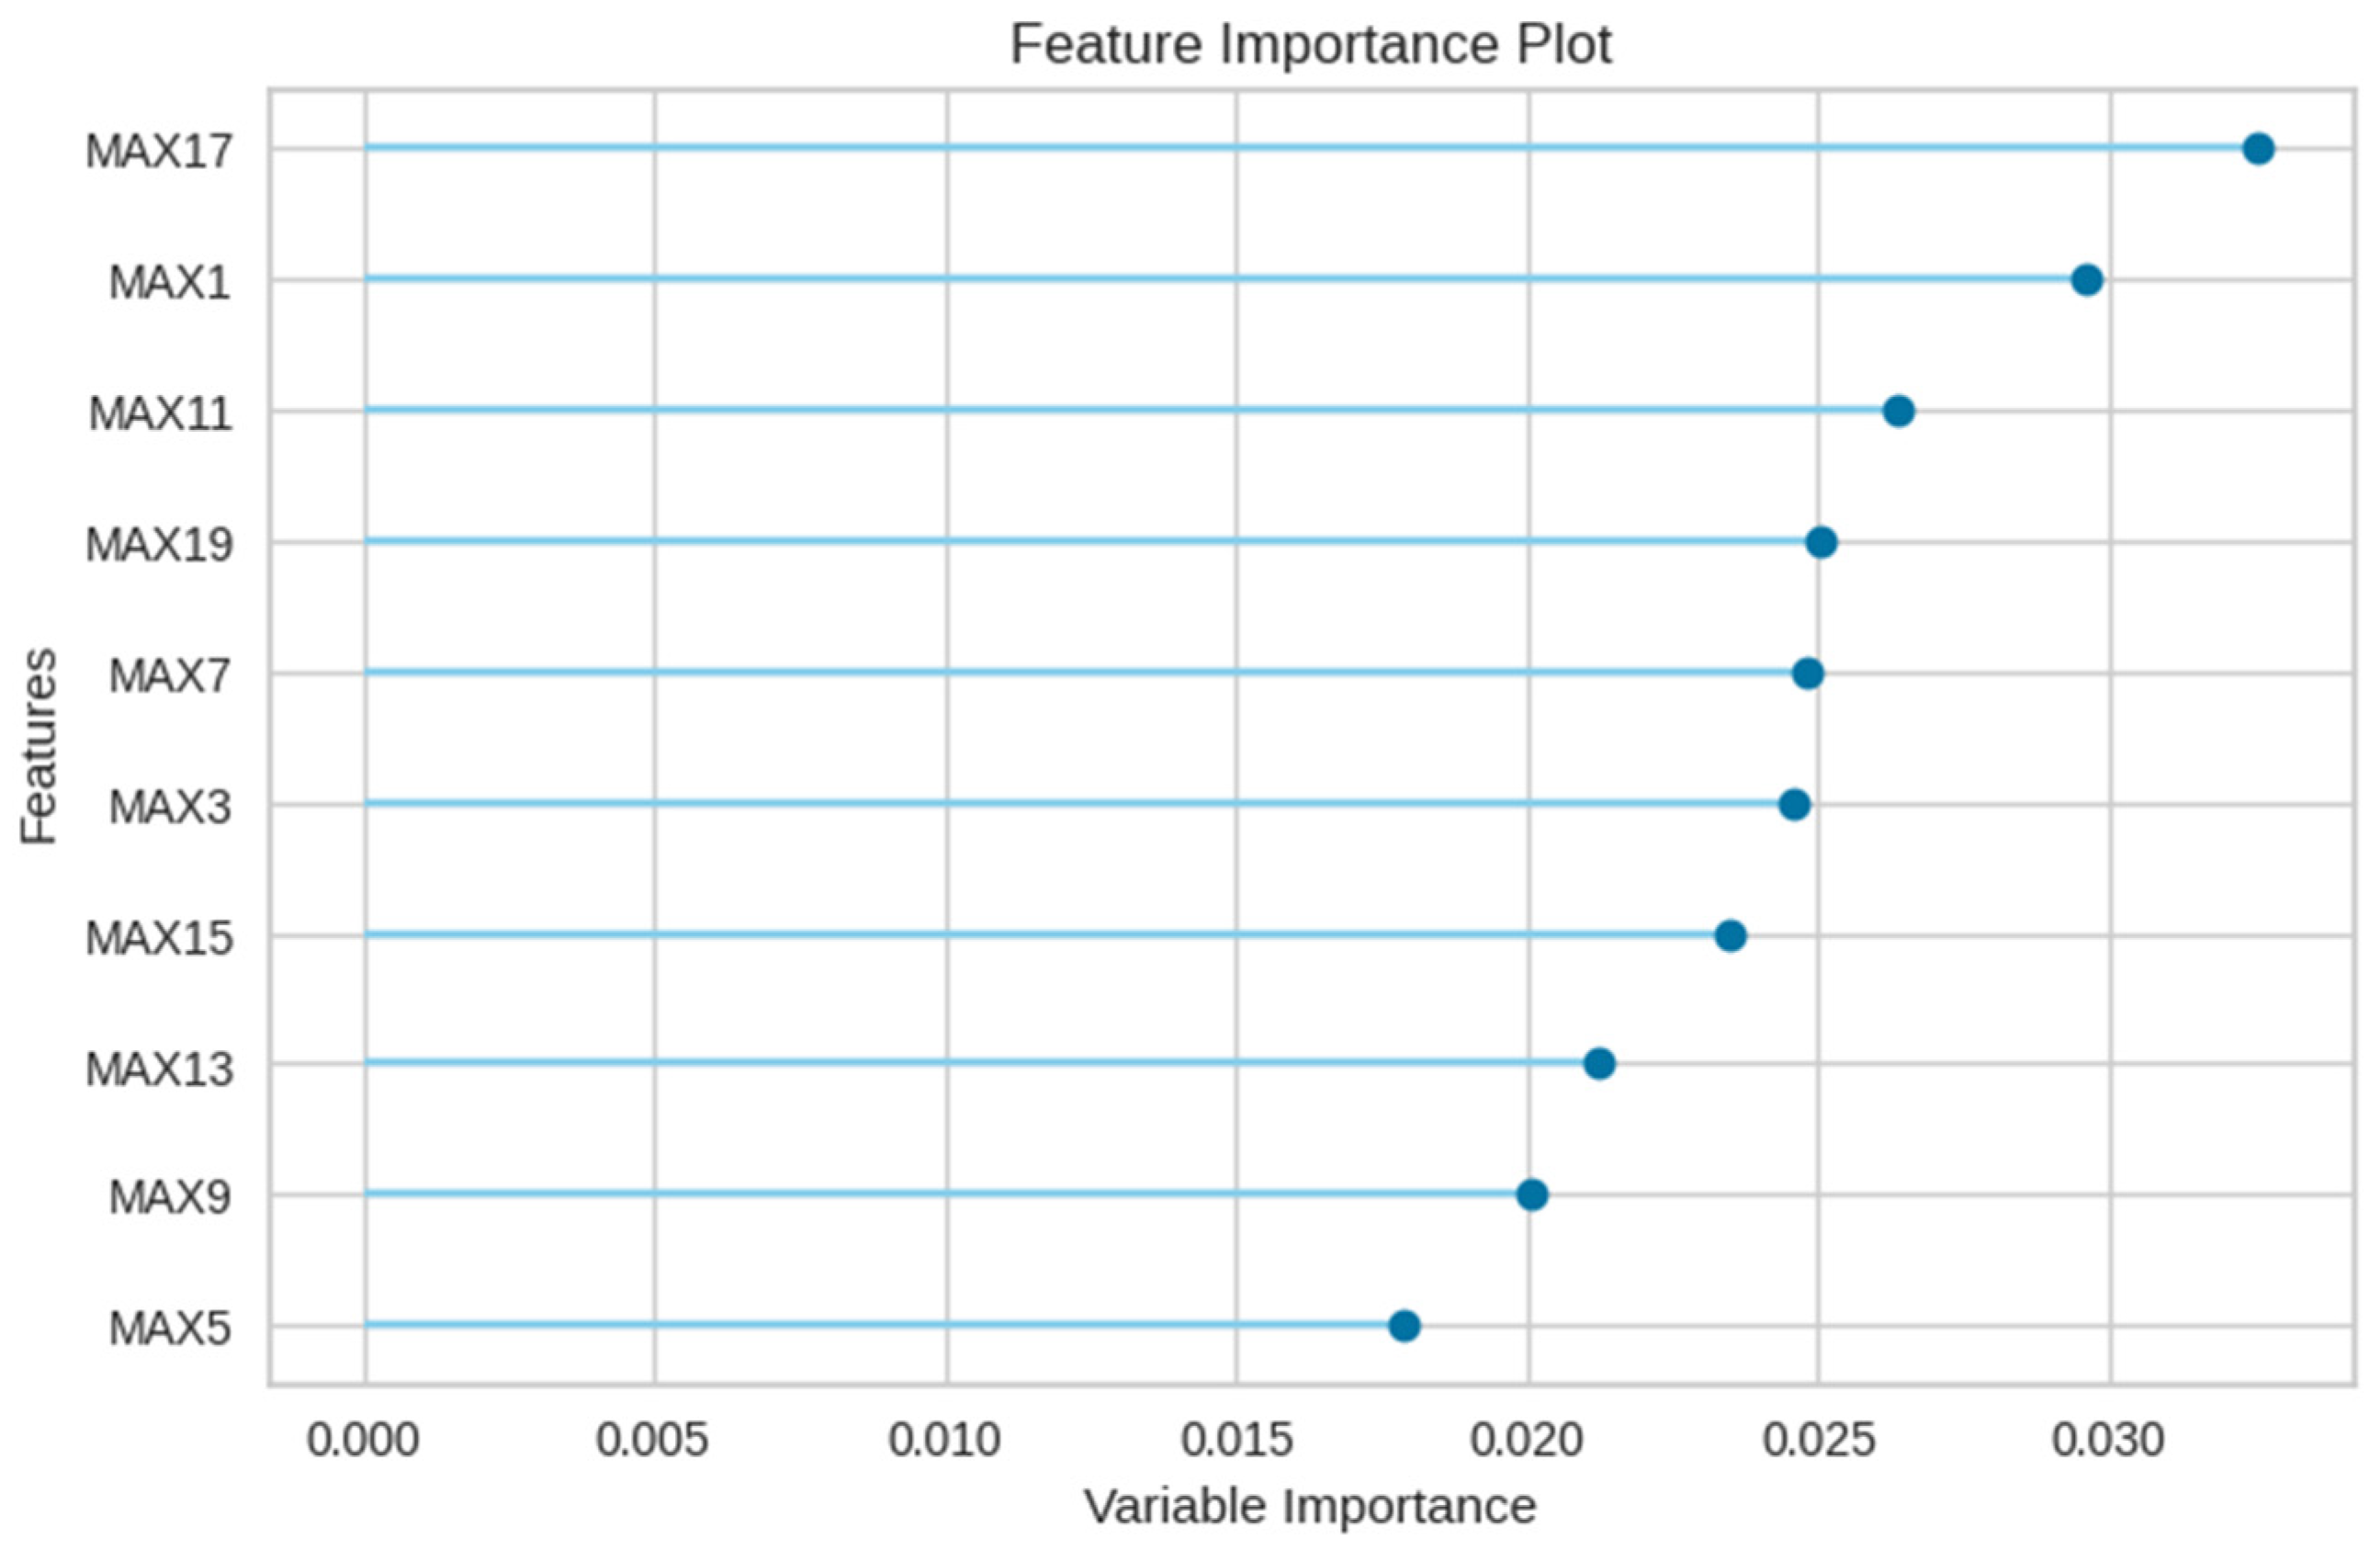
| Maximum by number of leak detections (20 columns) | MAX0 | Maximum frequency Hz detected in one leak detection | 0~5120 | int |
| MAX1 | Maximum leak size detected at one leak detection | 0~5000 | int | |
| … | Maximum frequency Hz and maximum leak size detected in the number of leak detections | 0~5000 | int | |
| MAX18 | Maximum frequency Hz detected in 10 leak detections | 0~5120 | int | |
| MAX19 | Leak detection 10 times maximum leak size | 0~5000 | int |
| Classification | Type | Distance (m) |
|---|---|---|
| Metallic Pipes | ECSP | 975,242 |
| LECSP | 9,983,024 | |
| CIP | 12,379,317 | |
| DIP | 56,089,910 | |
| GSP | 762,782 | |
| CP | 273,259 | |
| SSP | 25,565,017 | |
| Non-metallic Pipes | PVC | 24,061,418 |
| IRWP | 29,260,560 | |
| PE | 44,812,817 | |
| HP | 35,990 | |
| Other Pipes | OTH | 16,023,203 |
| Total | 228,322,539 |
| No. | Features | Target |
|---|---|---|
| E1 | Leak Detection Frequency Range (512 columns) | Leak Detection Classification (leaktype) |
| E2 | Leak detection frequency range (512 columns) + Maximum by number of leak detections (20 columns) | |
| E3 | Leak rate + Leak level + Leak detection frequency range (512 columns) + Maximum by number of leak detections (20 columns) | |
| E4 | Site number + Sensor number + Date of leak detection + Leak rate + Leak level + Leak detection frequency range (512 columns) + Maximum by number of leak detections (20 columns) |
| Model | Accuracy | AUC | Recall | Precision | F1 | Kappa | MCC | Training Time |
|---|---|---|---|---|---|---|---|---|
| KNN | 0.9133 | 0.9818 | 0.9133 | 0.9135 | 0.9133 | 0.8857 | 0.8857 | 2.1840 |
| XGBoost | 0.8917 | 0.9836 | 0.8917 | 0.8913 | 0.8903 | 0.8561 | 0.8567 | 41.6480 |
| MLP | 0.8788 | 0.9759 | 0.8788 | 0.8810 | 0.8789 | 0.8402 | 0.8407 | 19.7120 |
| Random Forest | 0.8780 | 0.9807 | 0.8780 | 0.8794 | 0.8755 | 0.8372 | 0.8387 | 2.8340 |
| LightGBM | 0.8765 | 0.9797 | 0.8765 | 0.8764 | 0.8748 | 0.8358 | 0.8366 | 8.3830 |
| CatBoost | 0.8708 | 0.9781 | 0.8708 | 0.8700 | 0.8684 | 0.8280 | 0.8290 | 60.2310 |
| Extra Trees | 0.8389 | 0.9724 | 0.8389 | 0.8443 | 0.8335 | 0.7834 | 0.7872 | 2.8490 |
| Decision Tree | 0.7705 | 0.8529 | 0.7705 | 0.7708 | 0.7706 | 0.6973 | 0.6973 | 2.2730 |
| Gradient Boosting | 0.6978 | 0.9089 | 0.6978 | 0.7016 | 0.6791 | 0.5899 | 0.5979 | 94.0720 |
| Model | Accuracy | AUC | Recall | Precision | F1 | Kappa | MCC | Training Time |
|---|---|---|---|---|---|---|---|---|
| Random Forest | 0.9115 | 0.9892 | 0.9115 | 0.9113 | 0.9099 | 0.8823 | 0.8830 | 2.8770 |
| XGBoost | 0.9008 | 0.9860 | 0.9008 | 0.9017 | 0.9001 | 0.8685 | 0.8691 | 46.6050 |
| LightGBM | 0.8971 | 0.9850 | 0.8971 | 0.8981 | 0.8962 | 0.8635 | 0.8642 | 8.7430 |
| CatBoost | 0.8933 | 0.9846 | 0.8933 | 0.8928 | 0.8920 | 0.8585 | 0.8590 | 61.5220 |
| Extra Trees | 0.8655 | 0.9797 | 0.8655 | 0.8668 | 0.8611 | 0.8199 | 0.8221 | 2.7550 |
| MLP | 0.8472 | 0.9701 | 0.8472 | 0.8532 | 0.8478 | 0.7992 | 0.8004 | 24.8520 |
| Decision Tree | 0.8076 | 0.8789 | 0.8076 | 0.8079 | 0.8077 | 0.7463 | 0.7463 | 2.1420 |
| KNN | 0.7532 | 0.9201 | 0.7532 | 0.7532 | 0.7521 | 0.6738 | 0.6744 | 2.2280 |
| Gradient Boosting | 0.7360 | 0.9302 | 0.7360 | 0.7494 | 0.7231 | 0.6439 | 0.6526 | 100.9720 |
| Model | Accuracy | AUC | Recall | Precision | F1 | Kappa | MCC | Training Time |
|---|---|---|---|---|---|---|---|---|
| Random Forest | 0.9221 | 0.9911 | 0.9221 | 0.9225 | 0.9212 | 0.8967 | 0.8972 | 2.5410 |
| XGBoost | 0.9030 | 0.9868 | 0.9030 | 0.9035 | 0.9023 | 0.8715 | 0.8720 | 38.0860 |
| CatBoost | 0.8972 | 0.9857 | 0.8972 | 0.8973 | 0.8963 | 0.8637 | 0.8642 | 61.6760 |
| LightGBM | 0.8962 | 0.9853 | 0.8962 | 0.8970 | 0.8954 | 0.8624 | 0.8630 | 8.6350 |
| Extra Trees | 0.8960 | 0.9859 | 0.8960 | 0.8969 | 0.8938 | 0.8616 | 0.8627 | 2.2420 |
| MLP | 0.8473 | 0.9723 | 0.8473 | 0.8533 | 0.8462 | 0.7981 | 0.8000 | 28.6360 |
| Decision Tree | 0.8321 | 0.8949 | 0.8321 | 0.8321 | 0.320 | 0.7785 | 0.7785 | 1.7550 |
| KNN | 0.7506 | 0.9185 | 0.7506 | 0.7507 | 0.7497 | 0.6705 | 0.6710 | 2.2210 |
| Gradient Boosting | 0.7369 | 0.9300 | 0.7369 | 0.7541 | 0.7239 | 0.6448 | 0.6547 | 99.8280 |
| Model | Accuracy | AUC | Recall | Precision | F1 | Kappa | MCC | Training Time |
|---|---|---|---|---|---|---|---|---|
| XGBoost | 0.9979 | 1.0000 | 0.9979 | 0.9979 | 0.9979 | 0.9973 | 0.9973 | 37.9660 |
| LightGBM | 0.9971 | 1.0000 | 0.9971 | 0.9972 | 0.9971 | 0.9962 | 0.9962 | 8.7510 |
| CatBoost | 0.9950 | 0.9998 | 0.9950 | 0.9951 | 0.9950 | 0.9934 | 0.9934 | 60.6540 |
| Gradient Boosting | 0.9909 | 0.9999 | 0.9909 | 0.9912 | 0.9910 | 0.9881 | 0.9881 | 100.3840 |
| Decision Tree | 0.9878 | 0.9927 | 0.9878 | 0.9878 | 0.9878 | 0.9839 | 0.9839 | 1.3310 |
| Random Forest | 0.9828 | 0.9994 | 0.9828 | 0.9828 | 0.9827 | 0.9773 | 0.9774 | 2.4130 |
| Extra Trees | 0.9721 | 0.9987 | 0.9721 | 0.9721 | 0.9718 | 0.9631 | 0.9632 | 2.0980 |
| KNN | 0.8296 | 0.9541 | 0.8296 | 0.8296 | 0.8291 | 0.7751 | 0.7753 | 2.2800 |
| MLP | 0.4084 | 0.6336 | 0.4084 | 0.4084 | 0.3289 | 0.2402 | 0.2990 | 16.3160 |
Disclaimer/Publisher’s Note: The statements, opinions and data contained in all publications are solely those of the individual author(s) and contributor(s) and not of MDPI and/or the editor(s). MDPI and/or the editor(s) disclaim responsibility for any injury to people or property resulting from any ideas, methods, instructions or products referred to in the content. |
© 2023 by the authors. Licensee MDPI, Basel, Switzerland. This article is an open access article distributed under the terms and conditions of the Creative Commons Attribution (CC BY) license (https://creativecommons.org/licenses/by/4.0/).
Share and Cite
Lee, S.; Kim, B. Machine Learning Model for Leak Detection Using Water Pipeline Vibration Sensor. Sensors 2023, 23, 8935. https://doi.org/10.3390/s23218935
Lee S, Kim B. Machine Learning Model for Leak Detection Using Water Pipeline Vibration Sensor. Sensors. 2023; 23(21):8935. https://doi.org/10.3390/s23218935
Chicago/Turabian StyleLee, Suan, and Byeonghak Kim. 2023. "Machine Learning Model for Leak Detection Using Water Pipeline Vibration Sensor" Sensors 23, no. 21: 8935. https://doi.org/10.3390/s23218935