1. Introduction
Traditional industrial robots are being used in manufacturing sectors for physically demanding tasks requiring high precision or numerous iterations [
1]. However, conventional robots are not well-suited when the customisation of products involves variable levels of automation [
2]. A completely automated environment is highly desirable but challenging to achieve because of constraints like cost and resources, whereas entirely manual systems, even though adaptable, can be highly erroneous and time-consuming due to a human worker’s exhaustion and stress [
2]. To achieve a customised level of automation by leveraging the speed, precision, and power of robots, the focus of research is now converging towards human–robot collaboration (HRC) in the context of industry 5.0.
Collaborative robots, also known as cobots, are specifically designed to operate with humans in the same workspace. In HRC, one of the most significant benefits is that cobots can ensure human worker safety by controlling their motion as they sense the position of a human operator around them [
3]. Major applications of cobots include machine tending, assembly tasks, pick-and-place jobs, palletising, etc. [
4].
Even though the introduction of cobots has upgraded performance, HRC has led to several issues related to HF and ergonomics in terms of mental stress and cognitive workload. A human worker can feel disconcerted and nervous by a robot’s size and unexpected mobility [
5]. Numerous factors, including human worker resistance to cobots, prolonged task durations, fatigue, and safety concerns posed by the motion and speed of cobots’ physical components, can contribute to these challenges [
5,
6]. This overwhelming experience for a human worker can lead to unfavourable productivity, as an HRC task is prone to more human errors and mishaps in a panic condition [
6]. Under these circumstances, there is a need to develop human-centred industrial setups that prioritise HF considerations to reduce human workers’ anxiety level, hence enhancing system efficiency [
7]. Therefore, monitoring the cognitive stress of a human operator accurately is an essential goal to achieve.
Researchers have been estimating mental stress factors using behavioural, subjective (i.e., questionnaires), and objective measures (i.e., physiological data) [
8]. To investigate the impact of cobot speed and path predictability on a human worker, two concurrent tasks, manufacturing components and a quality control task in a 3D virtual environment, were carried out by Koppenborg et al. (2017) [
9]. The NASA task load index (NASA-TLX) and state-trait anxiety Inventory (STAI-S) questionnaires have both been used as subjective measures to assess the mental workload and anxiety of human workers, respectively. Alongside, as a physiological measure, mean inter-beat intervals were analysed using a chest sensor [
9]. The impact of graphical signage on a human worker’s performance and anxiety was evaluated for a bolt extraction task from tubes using the KUKA robot by Eimontaite et al. (2019) [
1]. The negative attitude towards robot scale (NARS) and robot anxiety scale (RAS) [
10] have been used to quantify human workers’ cognitive strain, whereas facial expressions have also been monitored, using cameras, as behavioural stress indicators [
1]. Another 10-item questionnaire, the perceived stress scale (PSS-10), was employed by Björling et al. (2019) to evaluate the perceived stress of a teen during robot interaction [
11]. Rossato et al. (2021) assessed the subjective experience of senior and younger workers in HRC using the technology acceptance model (TAM) and NASA-TLX for measuring a user’s acceptance of technology and cognitive task load, respectively [
12]. NARS was also administered by Gervasi et al. (2022) to monitor the mental workload of an operator while performing a collaborative assembly task [
13].
A relatively simple secondary task is often introduced alongside a major primary task to increase the complexity of the experiment, so that the decision-making aspect, in the context of reaction time, of a human worker can be assessed as a behavioural measure [
8]. Initially, Zakeri et al. (2021) designed an experiment to replicate an industrial situation for studying HF pertaining to a human worker’s mental stress in a factory environment. A primary cobot–Stroop task accompanied by a secondary pedalling activity was designed considering performance parameters, i.e., different speeds of cobot motion, cobot payload capacities, and task complexities [
8]. Subjective, behavioural, and physiological measures were taken into consideration while devising this scheme. Since the stress assessment questionnaires are filled in by the human worker at the end of the task, there are no means to objectively observe the changes in stress levels during the task via subjective measures. Therefore, EEG and fNIRS signals, as physiological measures, along with the NASA-TLX questionnaire, were utilised by Zakeri et al. (2022) to estimate the cognitive stress of a factory employee in real time throughout the task execution, in terms of experiment performance parameters [
14]. Results of this study indicate that task complexity is directly related to heart rate, beta and gamma average band power, and left prefrontal cortex activation, whereas it is indirectly related to alpha band power.
In factories, especially in manufacturing environments, there is a need to consider neuroergonomics and HF to create a stress-free atmosphere for employees working with cobots. When a human worker is interacting with a cobot, there will inevitably be moments of hesitation, fear, and anxiety. Developing a scheme to determine cognitive stress and implementing required measures to alleviate a human worker’s mental load can lead to a healthy change for factory employees, thus boosting their confidence, motivation, and determination. Such a strategy can ensure emotional, physical, and mental safety around cobots, hence reducing human workers’ insecurity toward robots. The first goal of this study is to analyse how task properties (e.g., speed, complexity, etc.) affect the perceptual state of factory workers under cognitive load conditions by monitoring this impact in subjective, behavioural, and physiological measures. Therefore, this research intends to examine the effect of varying levels of task properties, by considering them individually, in pairwise combinations, and collectively, on the mental stress of factory employees.
Physiological measures can be more informative, as they can provide real-time information while the experiment is being performed [
15], whereas other conventional metrics have multiple factors due to which their results can be biased. The gap lies in the fact that physiological measures have not been established yet. Therefore, the second aim of this study is to find out whether the physiological measures can predict the traditional ones, i.e., behavioural and subjective measures. The goal is to understand how well neuroimaging is able to predict traditional measures.
2. Methodology
The experiment for this study was formulated, using cobots, in such a way that it mimics the situation of a factory worker in an automated industrial setup. Brain signals of the human operator were acquired to get neurovascular information during the task implementation.
A brain–computer interface (BCI) was implemented to obtain brain data, such as EEG and fNIRS signals, during the experiment. These techniques can aid in the acquisition of attributes which are useful in the assessment of cognitive stress and anxiety [
16]. Both BCIs are categorised as non-invasive neuroimaging methods. fNIRS measures the changes in local cerebral haemoglobin concentration by sensing the light absorption in the cortex, using an infrared light-emitting source and detector combination [
17]. Heart rate, which is expected to vary with the occurrence of stress [
18], can be extracted from fNIRS data [
19]. EEG is an electrophysiological measure that analyses the neural activity of the brain using electrodes located at the head surface [
20]. These variables can come in handy for monitoring the vigilance and attention of a person [
16] while performing the required experiment.
2.1. Experimental Paradigm
For this research, a pick-and-place task is selected which involves the decision-making of a human worker. An environment is created where the human operator needs to collaborate with a cobot and adjust his performance speed to match that of the cobot. The complete experiment is composed of two tasks to be performed concurrently. These factors can collectively induce cognitive stress in a person.
Participants were initially selected based on the criteria that only healthy adults, male and female, within the age range of 18 to 55 years, without any neurological disorder, head trauma or other head injury background, could take part in the experiment. Age was used as a criterion since a child’s and an older person’s brain characteristics are different to those of a normal adult brain. Any motor disability (upper or lower extremity injury or disability) was also used as an exclusion criterion, as the experiments involved testing participants performing bimanual motor activity. Data were acquired from a total of 13 selected participants, from among university students and staff from PepsiCo International Limited, but only data from 9 participants were used for this research. The remaining data were discarded due to their poor quality. The technological background of participants was such that 84.6% of them were social media users, 100% were smartphone users and 30.7% were already familiar with robot interaction. The total task duration was approximately an hour for each participant. The Stroop task, which is a standard task for assessing a person’s control of his cognitive behaviour [
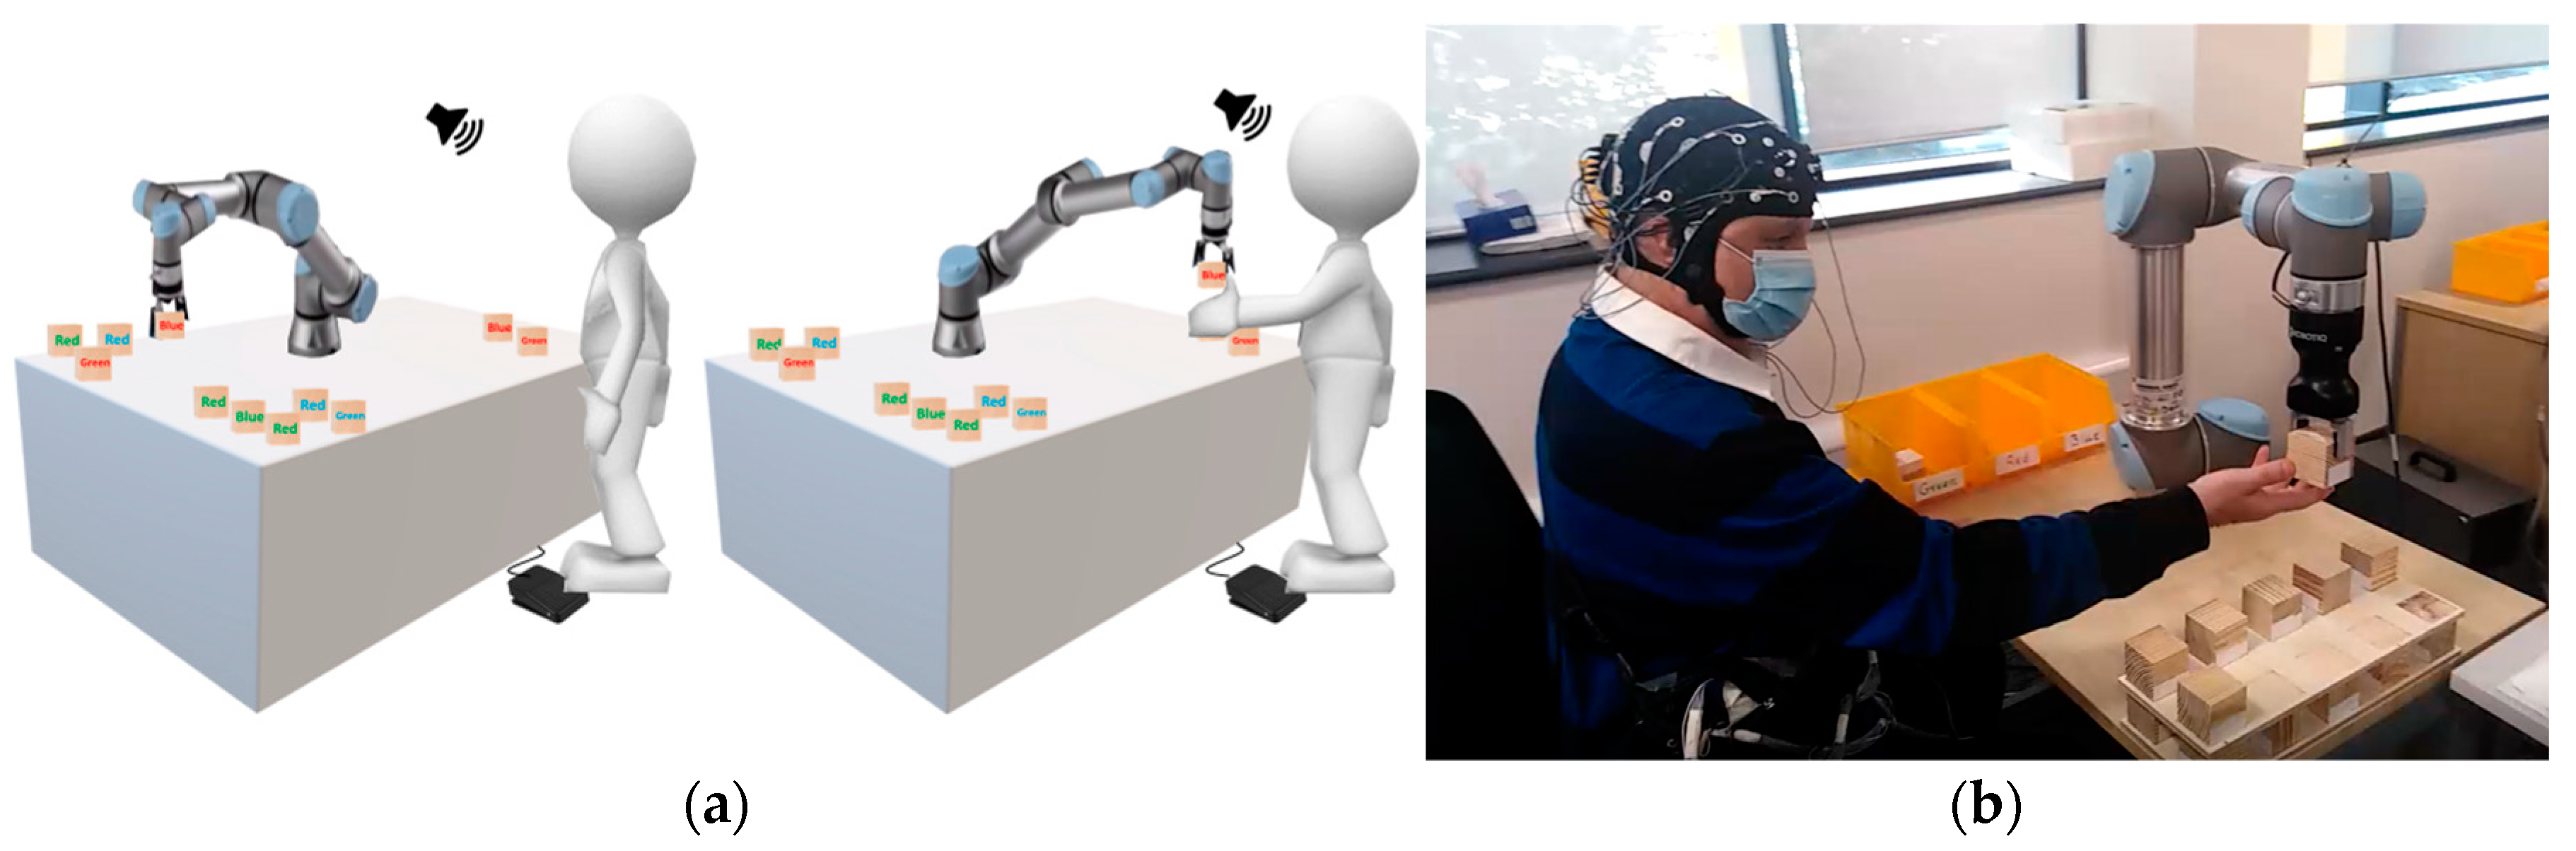
21], was adapted in this study. Forty cubic boxes were provided for this experiment, each with an equation and a colour name (red, blue, or green) printed on it in a different coloured ink. For instance, “blue” might be written on a box with red-coloured ink. In this research, the Stroop task, in collaboration with a robot as shown in
Figure 1, was considered a primary task. The participant has to categorise the boxes based on the rule that if the equation is correct, he has to consider the colour of the text rather than the word written on it; otherwise, he has to focus on the name of the colour. A cobot is involved in this task in such a manner that it has to pick a cubic box from a corner, where all boxes are present initially, and pass it on to the human participant. The participant has to take the box and place it in its designated place on the workstation, according to the rule described above [
14]. The participant must match his speed with that of the cobot; otherwise, he might be occupied in placing the previous box, whereas the cobot would not wait for the human and drop the next box. This can be considered an error on the human’s part, and consequently, performance can be reduced as a result of slow decision-making. Each participant has to carry out the task in eight different experimental conditions, termed episodes, determined by different combinations of the cobot payload capacities, task complexities, and cobot movement speed.
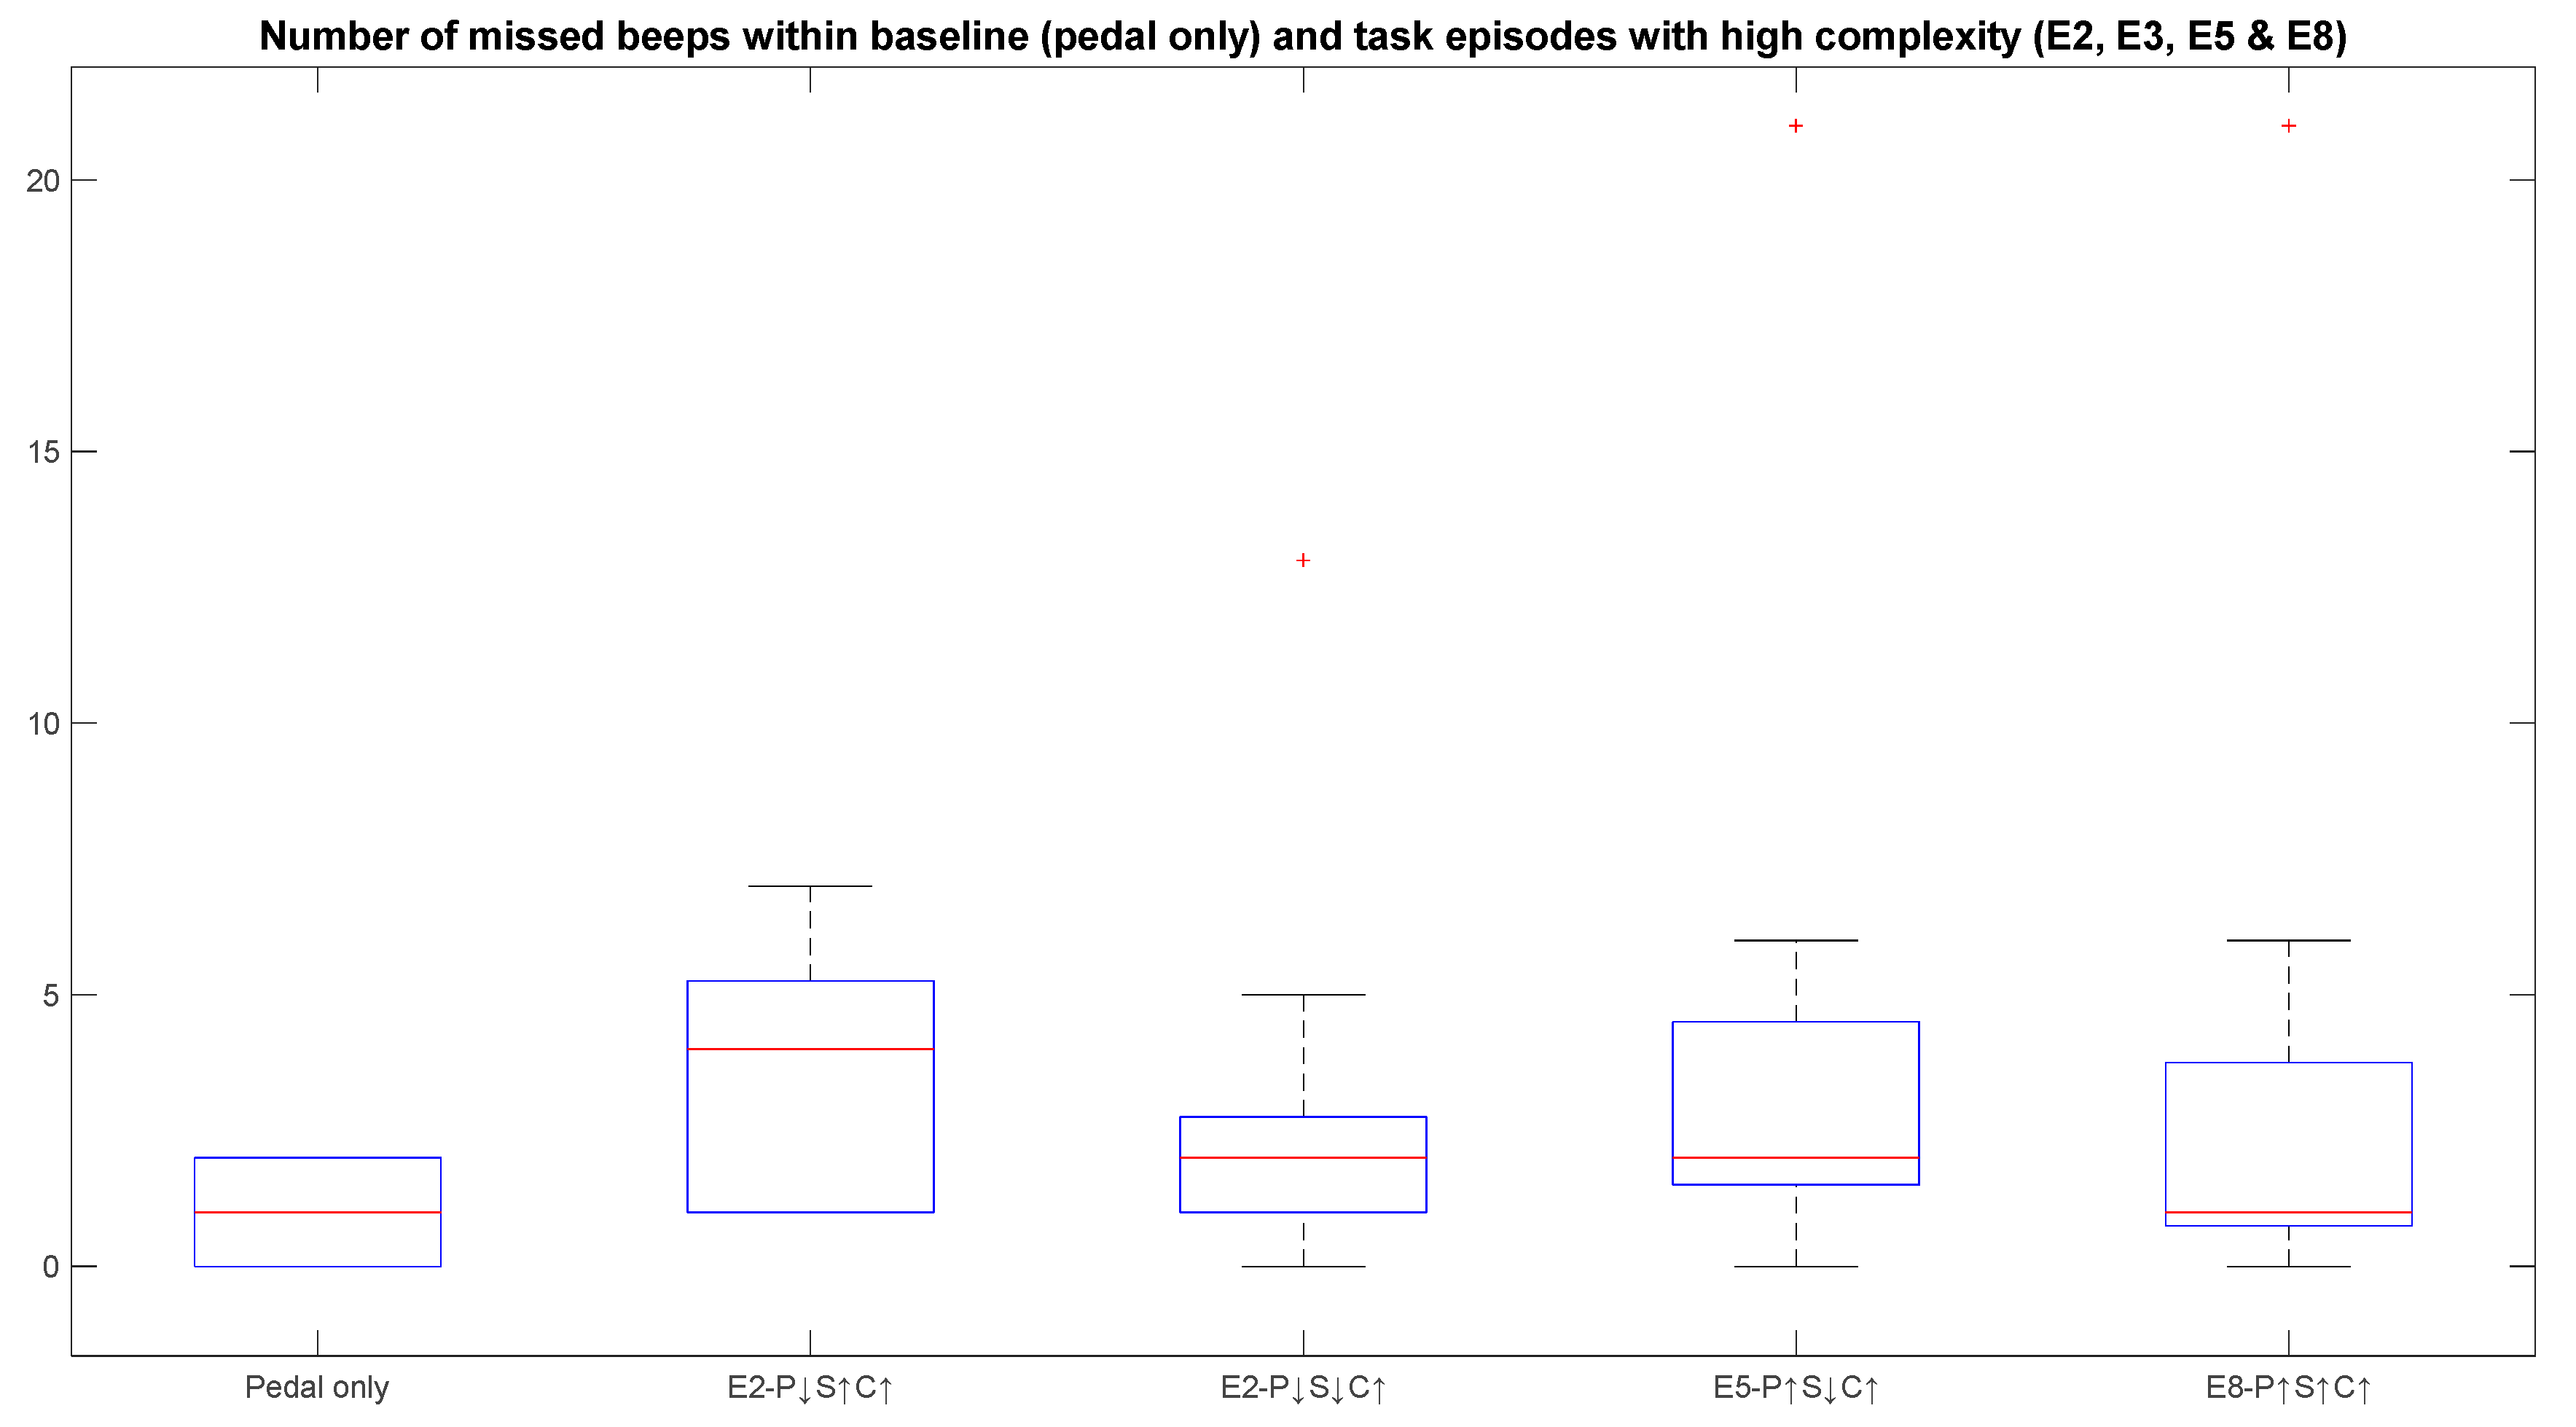
To imitate an industrial scenario, where the human worker has to make decisions while performing multiple tasks concurrently, the cobot–Stroop task was coupled with another comparatively simpler task. A secondary task was introduced with the primary cobot–Stroop task to vary the task complexity from low to high, in different episodes of the task. The episodes in which complexity needs to be higher must contain the presence of this accompanying task. As a secondary task, beeps are played after 500 to 1000 ms intervals, and the participant has to respond to these beeps by pressing a foot pedal, for each beep. Human error can be calculated by counting the number of missed beeps. Participants’ response rate to beeps and reaction time are considered behavioural measures.
The flow of the experiment is such that the participant’s brain data are collected throughout the 60 min of the experiment. After complete setup at the beginning of the experiment, only the secondary foot-pedalling task is performed for 2 min, as a baseline case. Subsequently, episode 1 of the cobot–Stroop task, where the cobot speed, payload capacity, and task complexity are all at a low level, is performed for 4 min. Afterwards, a rest episode is conducted, where the participant must sit in a relaxed condition for 2 min, followed by filling out the NASA-TLX form. NASA-TLX is used as a subjective measure and the participant is directed to fill out the form after each episode of the experiment. Then, the flow of the experiment is followed as shown in
Figure 2. In each episode, parameter levels are set as either low or high, as illustrated in
Table 1. The cobot speed for high and low levels was 1 m/s and 0.6 m/s, respectively. Universal robots of two payload capacities, 3 kg (low) and 5 kg (high), were employed in the experiment. The episodes with high task complexity included the secondary task along with the primary task whereas the ones with low task complexity included only the primary task.
2.2. Data Acquisition
For this research, EEG and fNIRS signals were collected simultaneously to obtain the brain’s electrical signals and hemodynamic activity, respectively. EEG signals were acquired using TMSi Mobita wireless data acquisition, at a sampling frequency of 2000 Hz [
22]. Data were recorded from 19 EEG electrodes, positioned on the scalp according to the international 10–20 system. fNIRS data were recorded using Artinis Octamon, at a sampling rate of 10 Hz, using 8 channels [
23]. The distance between the transmitter–receiver pairs is 20–30 mm. These selected channels cover the left frontal area between FP1-F3-F7 and a similar frontal region on the right side too.
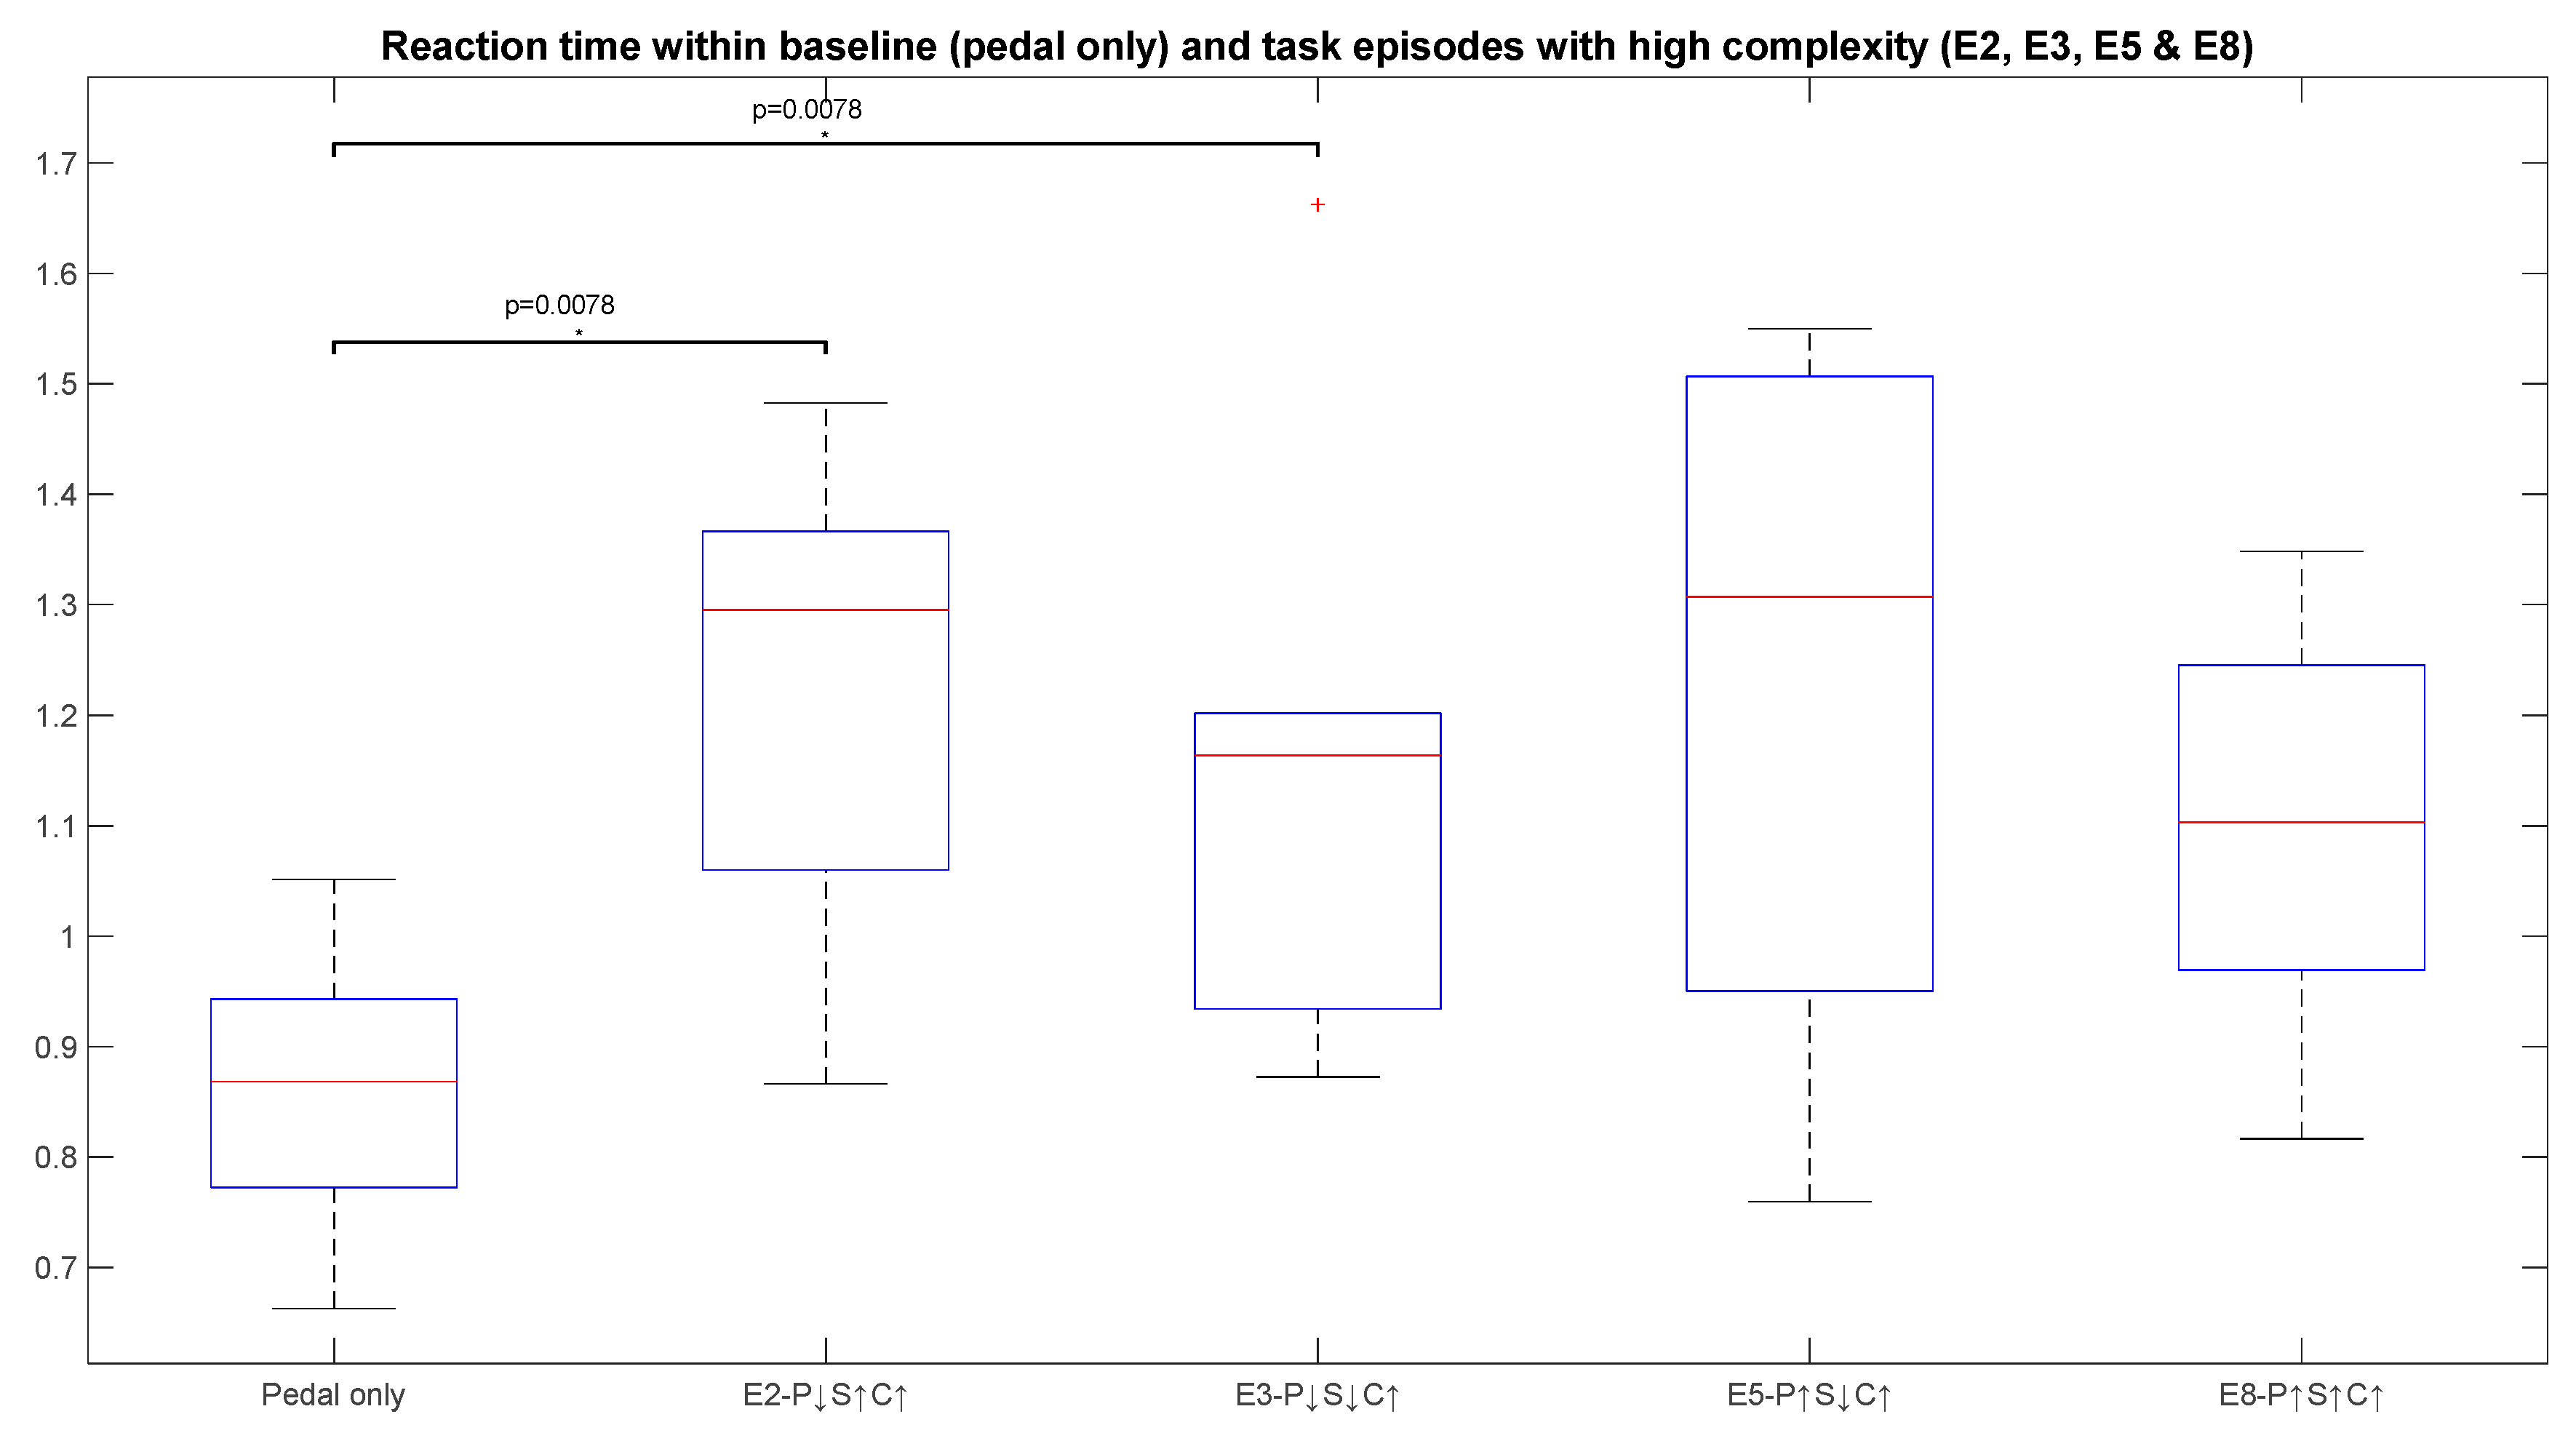
During the experiment, data for 3 behavioural measures were collected, i.e., reaction time, missed beeps, and the Stroop task error rate. The Stroop task error rate was not used in this study as it did not significantly distinguish between different episodes. Only reaction time and missed beeps were used as behavioural metrics. During high-complexity episodes involving the secondary tasks, reaction time was recorded for each beep when the participant pressed the pedal. These values were recorded for each episode. Simultaneously, if the participant missed a beep, it was counted. At the end of each episode, the number of missed beeps was counted for each participant. The significance of the reaction time is that it can be an indicator of stress, as it is measured in the high-complexity episodes involving the secondary task too and can show the delay in the response time of a participant if he/she is mentally stressed. Missed beeps are also measured in the high-complexity episodes. When the participant is preoccupied mentally with the primary task, it would be challenging for him/her to cope with the beeps. Therefore, an increase in the frequency of missed beeps would signify an increase in the cognitive workload of the subject. Additionally, the Stroop task error was also calculated for the complete experiment. A rise in the number of incorrect categorizations would indicate higher levels of mental stress. The Stroop task error could not produce informative results, so it was excluded from this study.
NASA-TLX is a multidimensional standard scale that can be used to measure stress, fatigue, and consciousness of a person, etc. [
24]. The final score of cognitive workload depends on the weighted average of 6 factors, rated by the participant at the end of the experiment. These factors include mental demand, physical demand, temporal demand, performance, effort, and frustration level [
25]. Marking from 0 to 100, having a step increment of 5, can be given by the participant for each factor [
26]. NASA-TLX was used in this research as a subjective measure where each participant/subject has to score each factor on the form, after the completion of each episode. Then, the average of all 6 factors is considered as the overall score associated with each subject.
2.3. Data Pre-Processing and Artefacts Removal
Both EEG and fNIRS data were pre-processed to get clean signals for extracting the required variables. The ICA-based method was used to remove non-brain signals and artefacts from the raw EEG recordings [
27]. A zero-phase Hamming windowed-sinc FIR filter, a band-pass filter of 0.16–40 Hz, was also applied to the data for reducing the high-frequency artefacts and the impact of EEG drift. Moreover, EEG signals from all channels were down-sampled from 2000 Hz to 200 Hz. EEG has multiple frequency bands with different ranges, i.e., delta (0.5–4 Hz), theta (4–8 Hz), alpha (8–12 Hz), beta (12–28 Hz), and gamma (28–50 Hz) [
28]. The expected behavioural states, i.e., deep sleep, deep meditation, awake but relaxed, cognitive thinking, and unifying consciousness, are associated with delta, theta, alpha, beta, and lower gamma bands, respectively [
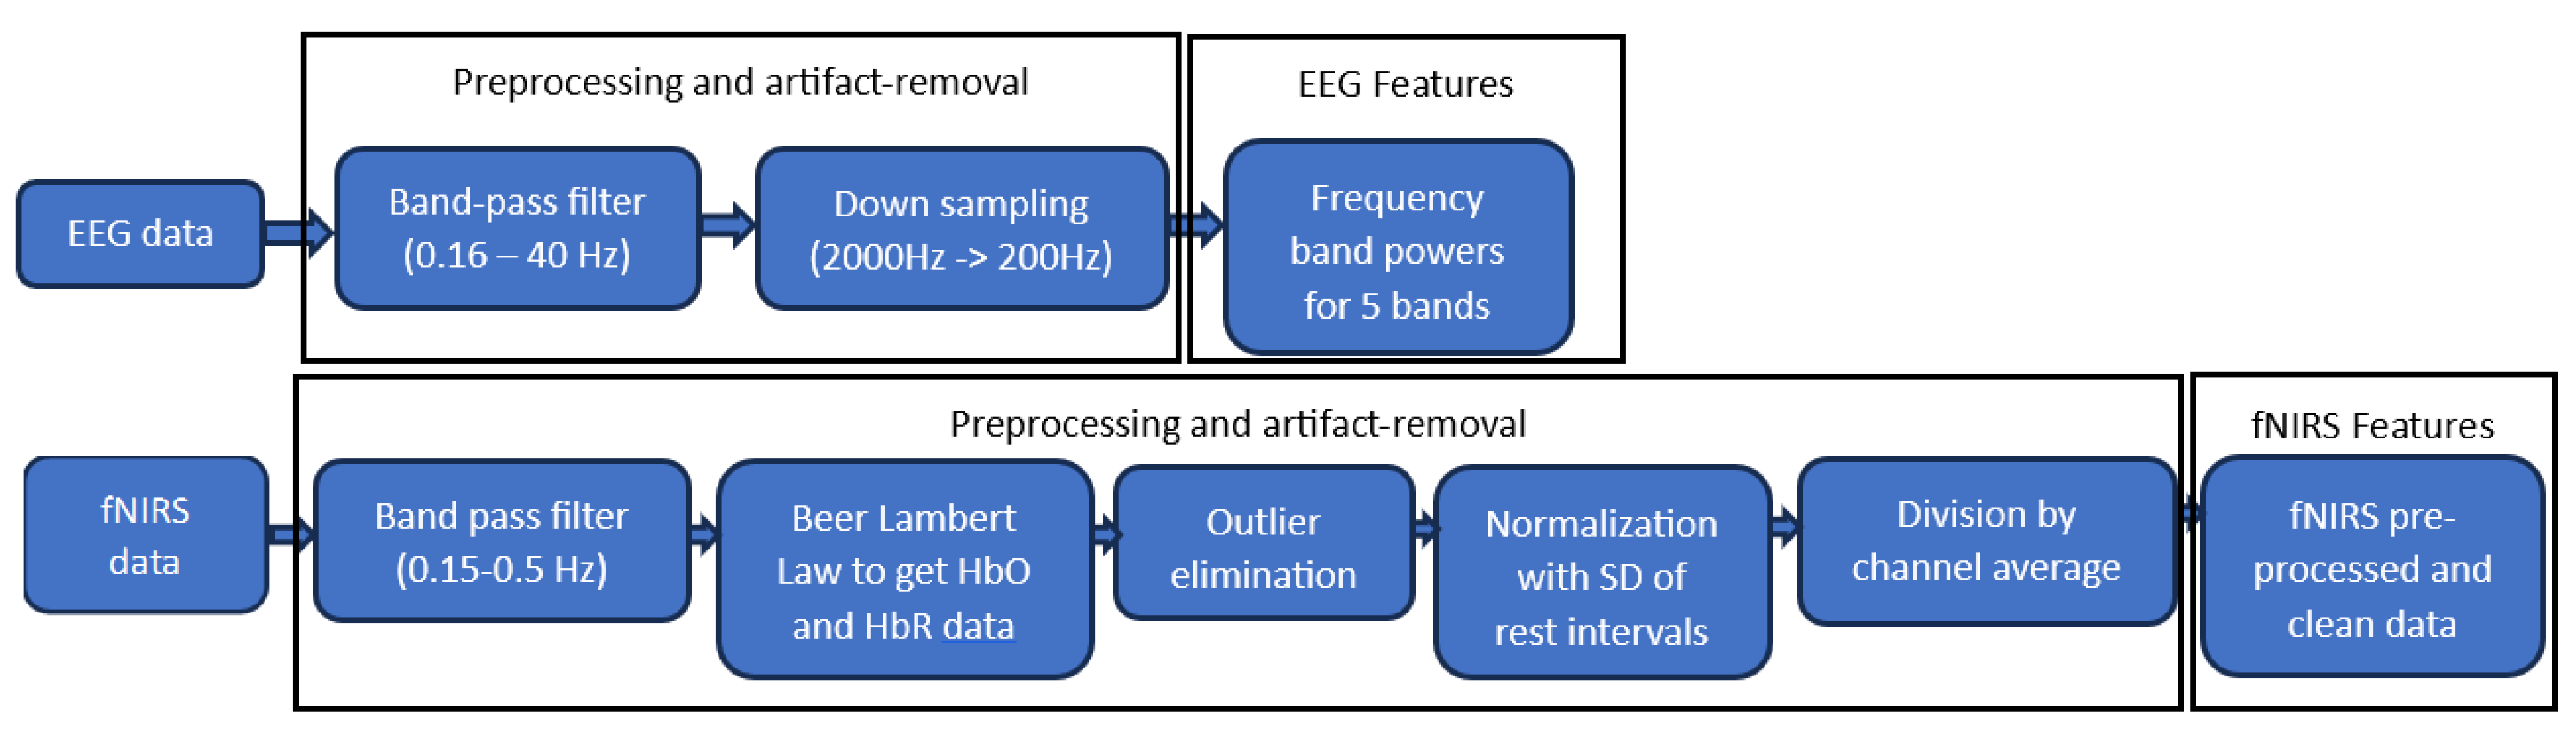
29]. Frequency band power (FBP) was analysed for these 5 bands, as shown in
Figure 3.
Likewise, in fNIRS data, there can be multiple technical and biological artefacts that can distort the data [
30]. One of the technical artefacts can be different calibration and coupling of optodes, causing differences in the average amplitudes of channels, which may stay constant during the task. Biological artefacts include head movements, which cause sudden distortions due to the affected coupling of optodes [
14]. Then, there is muscle oxygenation, occurring particularly close to the temporalis muscle, which results in a long-lasting peak of high amplitude. Transient significant deflections, from variations in blood perfusions, are a consequence of the participant’s upper body movement. Blood flow in superficial (non-cerebral) tissue, Mayer-waves artefacts at the frequency of around 0.1 Hz, and systemic heartbeat at approximately 1 Hz, are all categorised as biological artefacts [
14].
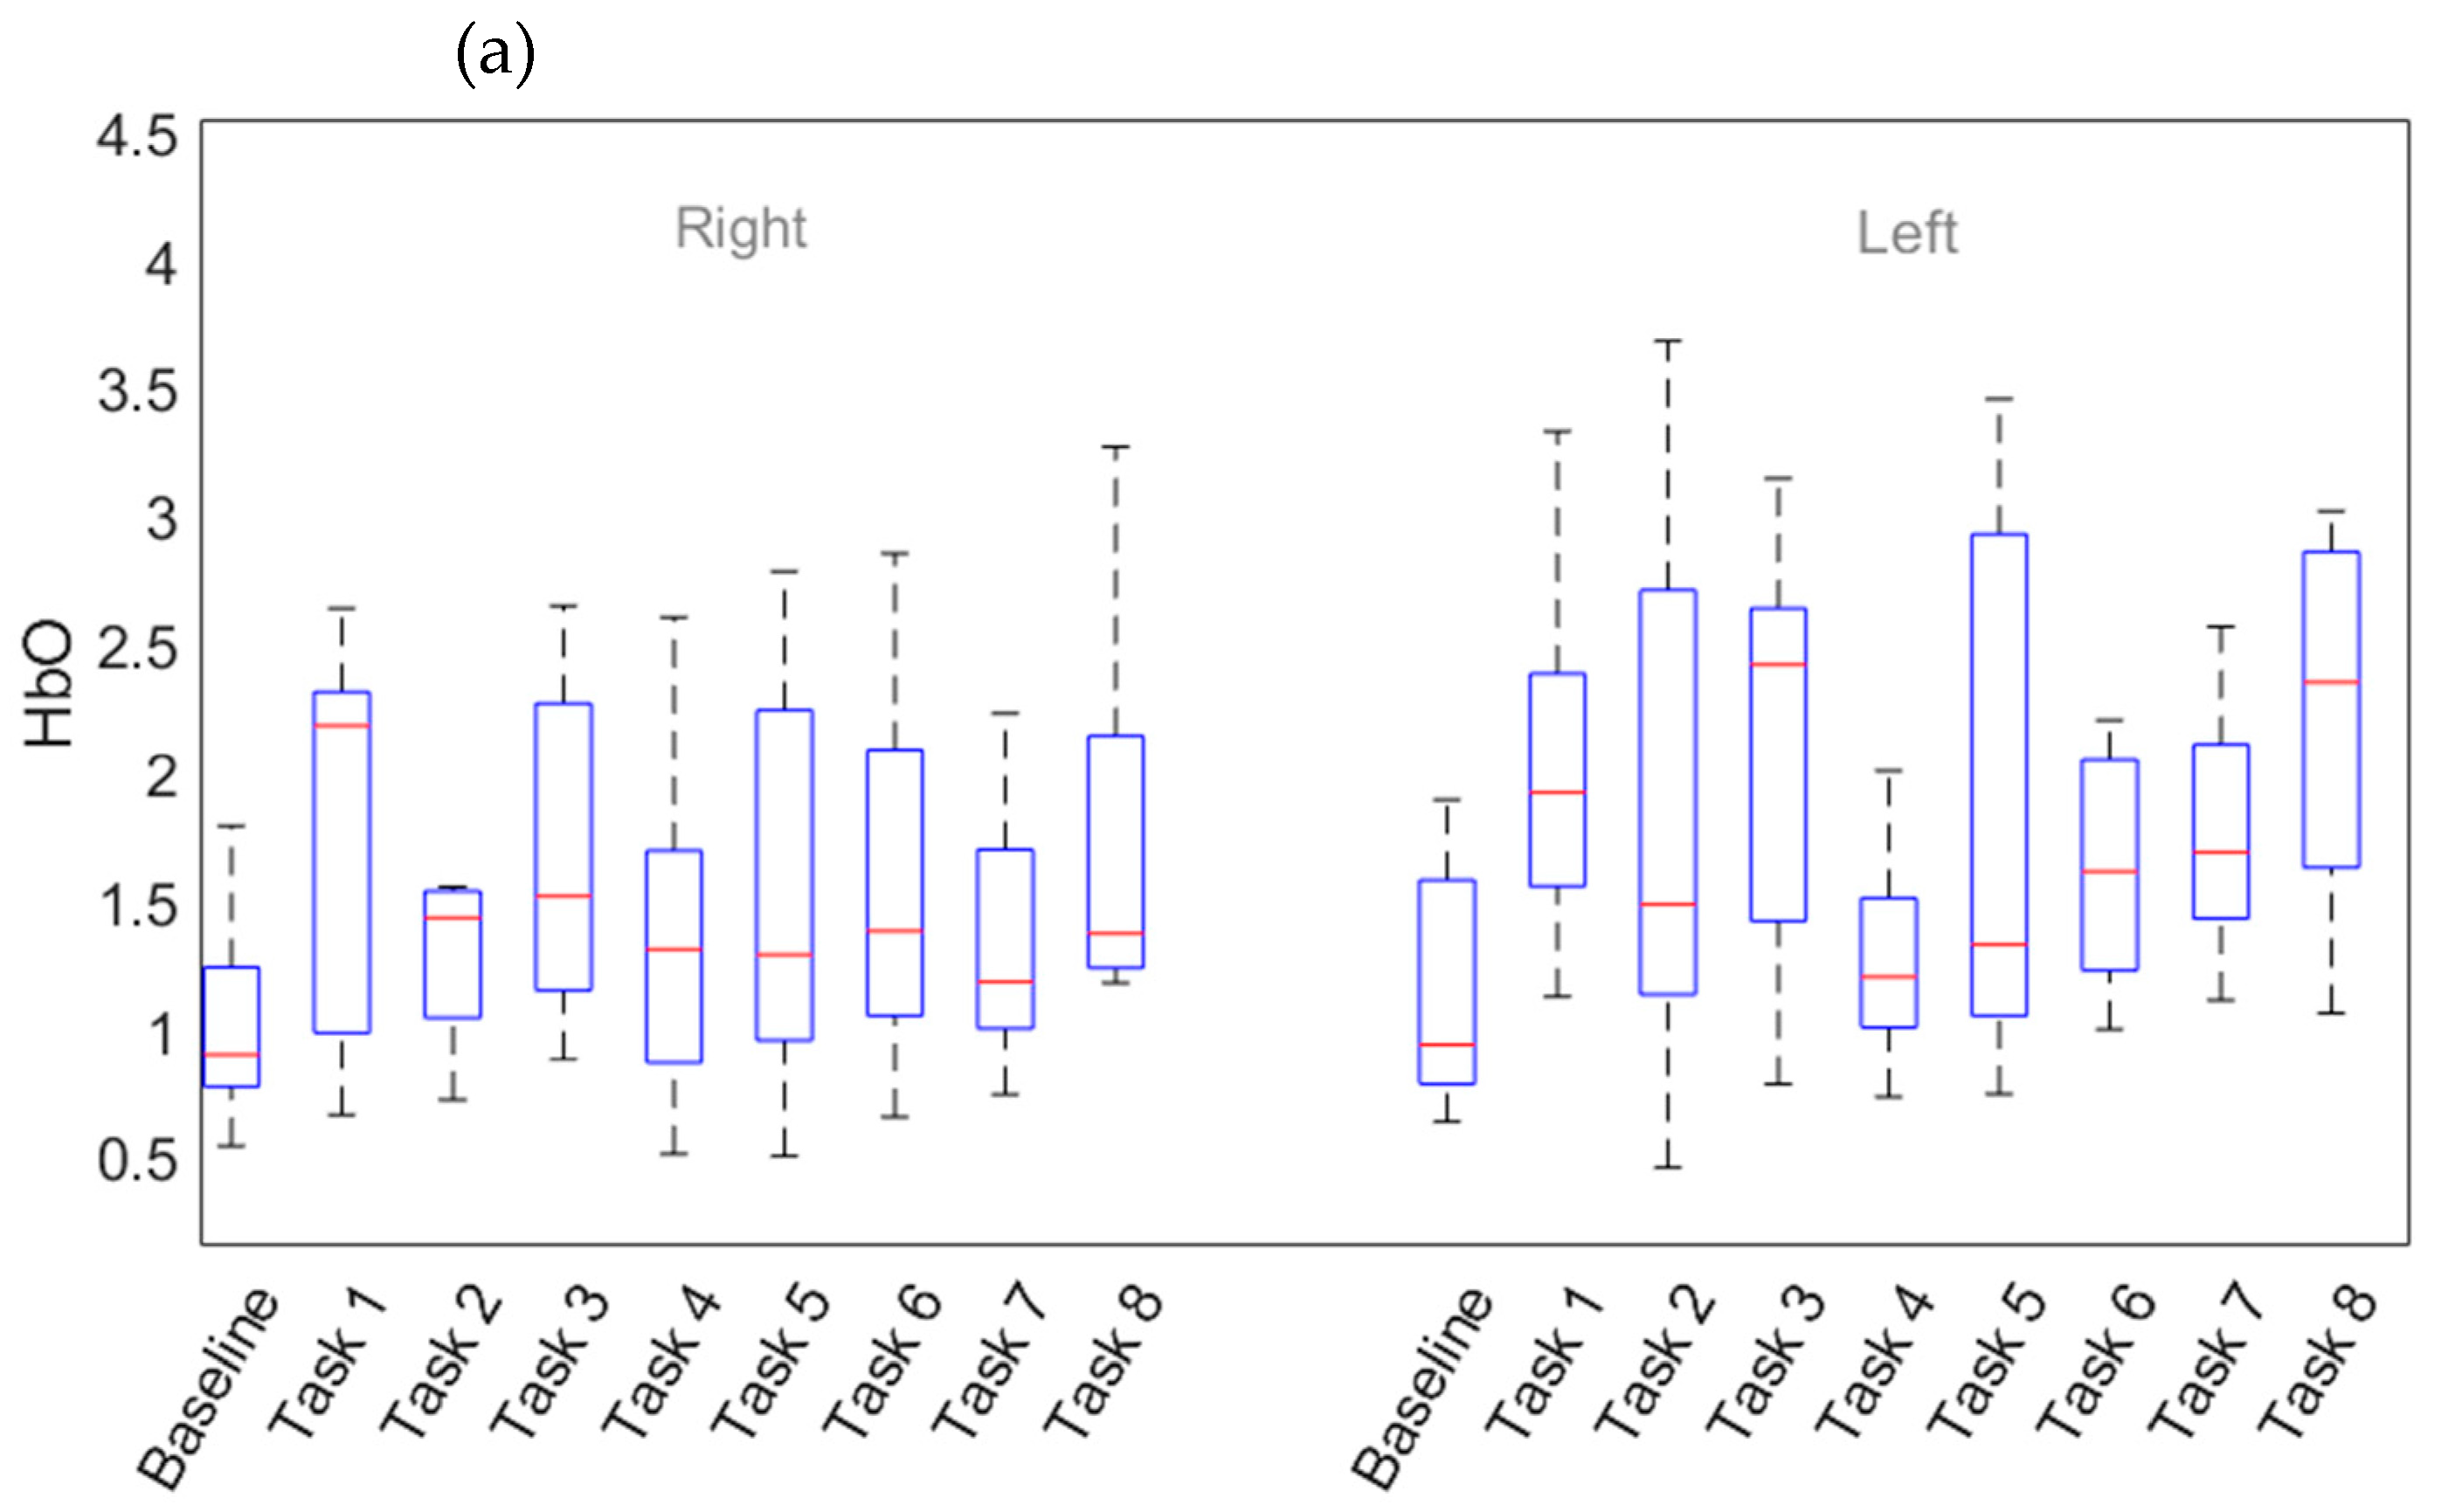
To acquire artefact-free and accurate data, initially, each channel’s signal was passed through a band-pass filter ranging from 0.15 Hz to 0.5 Hz, which minimised heartbeat activity and some slow components. Then, the Beer-Lambert law was applied to filtered recordings to get them in the form of oxy-haemoglobin (HbO) and deoxy-haemoglobin (HbR) concentrations [
8]. Since there is an overlapping time scale of cerebral activity and Mayer waves, band-pass filtering could not be used to minimise the latter. However, Mayer waves are not task-driven, and the waves of different participants are not synchronised; thus, their effects were not expected to influence our study, and they tended to cancel out in group averages [
31,
32]. To remove high-peaked artefacts caused by movement or muscles, outliers in all channels’ recordings were identified and eliminated if they were more than three scaled median absolute deviations (MAD) far from the median [
14]. To reduce the amplitude differences between channels which might be due to a particular subject or optical coupling, haemoglobin concentration signals were normalised as a result of dividing them by the standard deviation (SD) of the preceding rest interval. For episode 1, signals were normalised by using initial rest duration. To diminish systematic components, which can appear in the whole signal, the complete recording for each channel was divided by its average [
14]. Following these steps can help mitigate the above-listed types of artefacts, making the data more accurate and indicative of only cerebral activity. The complete process of artefact removal and feature extraction for EEG and fNIRS data is depicted in
Figure 3.
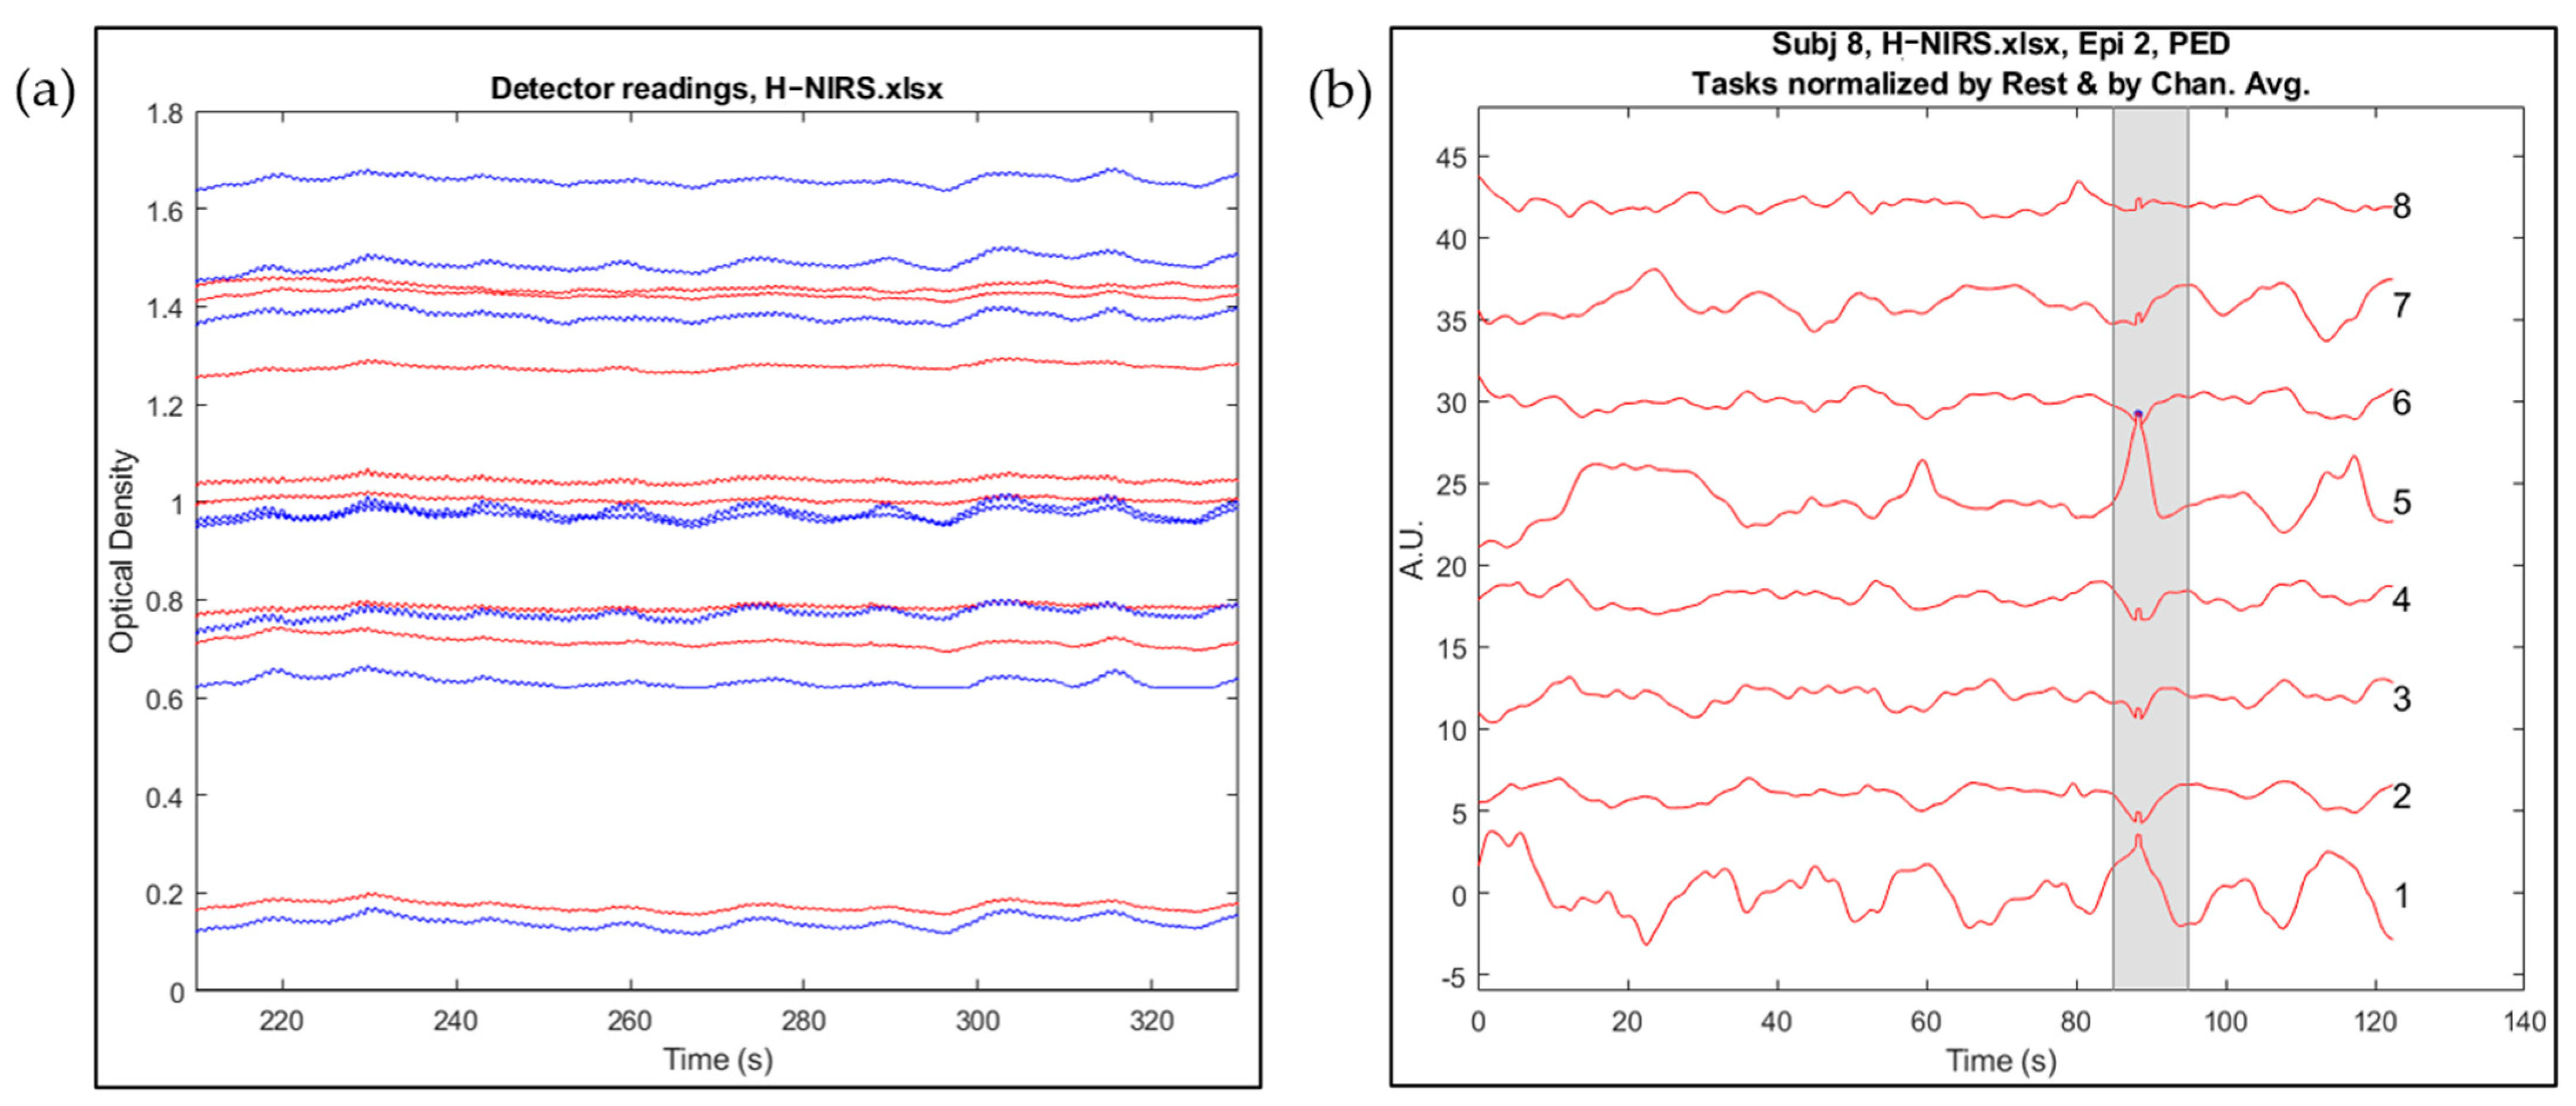
Figure 4 and
Figure 5 show the comparison of raw and processed data for EEG and fNIRS, respectively.
Figure 4a shows the raw EEG data for all 19 channels, whereas artefact-free EEG data are visible in
Figure 4b.
Figure 5a displays the raw data for fNIRS, whereas in
Figure 5b the concentration changes in oxygenated haemoglobin for channels 1–8, of subject 8, episode 2, are shown with y-offset for visibility. The signal-time segment is automatically marked as an artefact and excluded from further analysis, as shown by grey shading.
2.4. Use of Machine Learning and Statistical Analysis for Prediction of Traditional Measures Using Physiological Measures
Artificial intelligence (AI) has an area called machine learning that focuses on constructing algorithms and models that allow computers to learn from the surrounding environments and make predictions or decisions without the need to be explicitly programmed [
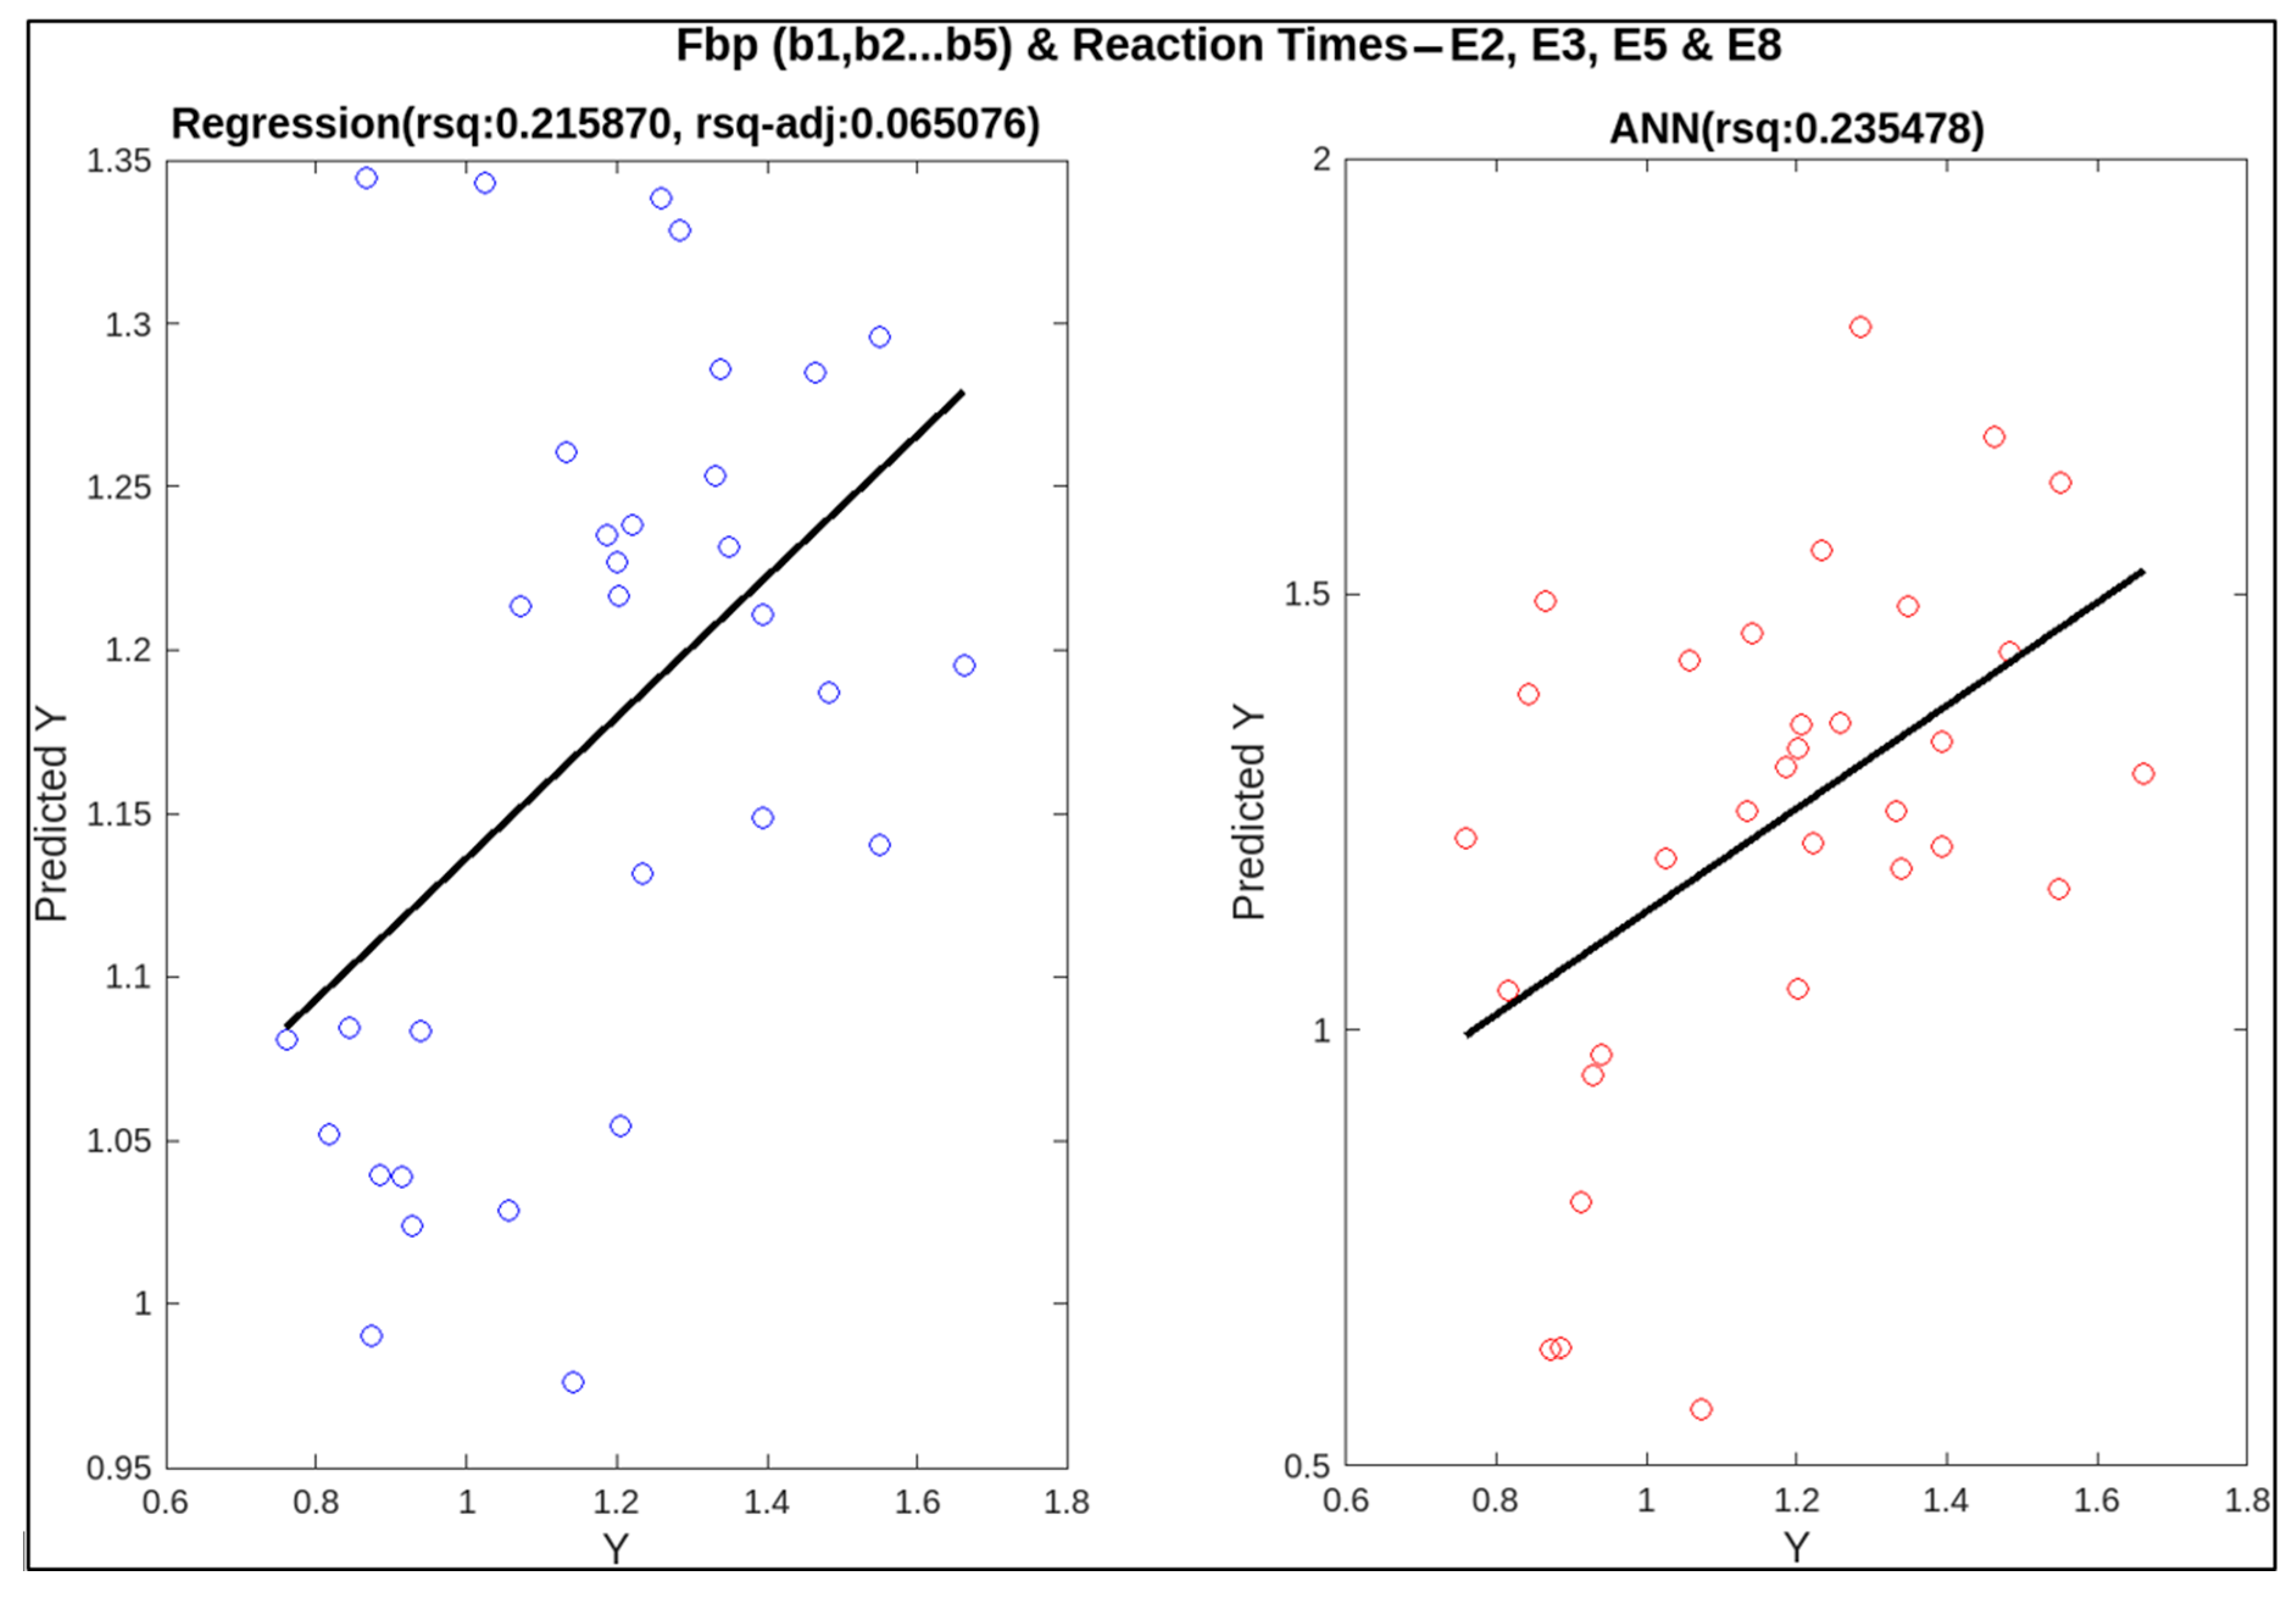
33]. To predict traditional measures using neural measures, two machine learning techniques were employed: linear regression [
34] and artificial neural networks (ANN) [
35], as shown in
Figure 6. For both algorithms, the brain data, i.e., EEG and fNIRS features, were used as predictors, whereas subjective measure (NASA-TLX questionnaire) and behavioural measures (missed beeps and reaction time) were considered as targets. For each target, multiple combinations of predictors, i.e., EEG features alone, fNIRS features alone, and EEG and fNIRS features collectively, were considered.
Statistical analysis was carried out to assess the performance of both models. The Signrank test, used to calculate the p-values, is a non-parametric method suitable for analysing non-normally distributed data to evaluate the significance of differences between paired samples. Subsequently, the Bonferroni correction (threshold = 0.01) was applied to address the multiple comparison issues and uphold the integrity of the statistical inferences.
A variation of the R-squared metric called adjusted R-squared is used to analyse how well the regression model fits the data. When a big set of predictors is introduced or there are numerous variables, an unadjusted R-squared might be deceptive while evaluating the model. An increase in the squared value due to more predictors can result in a poorly fitted model being presented as a well-fitted one. This misleading behaviour of R-squared can be catered to using adjusted R-squared while keeping the number of independent variables in the account [
36]. Adjusted R-squared was used as a metric to compare both models in the context of fitting the data, as it restricts the addition of extraneous features. The value of the adjusted R-squared only rises when a model’s performance improves due to the addition of a new predictor [
37]. Adjusted R-squared can be calculated using the following expression (1):
where
m is the number of independent variables and
n denotes the sample size of data [
36].
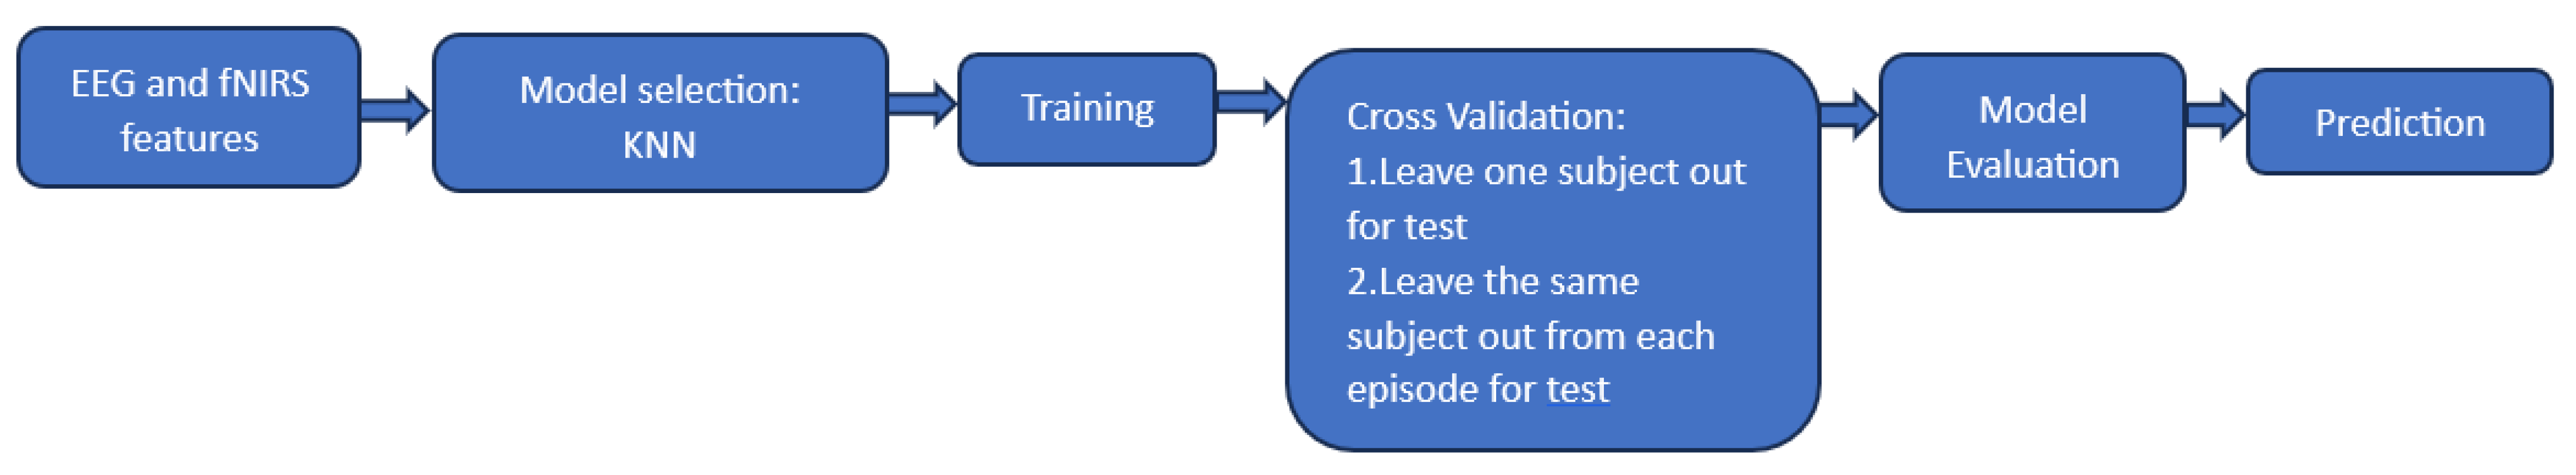
In this study, KNN was also used, as shown in
Figure 7, to assess the accuracy of correlation between EEG-fNIRS data and conventional measures, i.e., subjective and behavioural measures.
4. Challenges and Future Work
During this study, a few challenges were identified. Multiple technical issues with the EEG and fNIRS devices were faced while conducting the experiment. Data for some participants could not be collected because of performance issues of devices and software used for EEG and fNIRS data collection. The EEG-fNISR headcap did not fit properly on some participants’ heads, causing poor connection of the EEG electrodes and fNIRS optodes with the participants’ heads. Some participants had very frizzy and volumized hair, which made it impossible to collect data from their heads. Due to such issues, the data of four participants had to be discarded for this study as they were of poor quality and the dataset reduced from 13 to 9 participants’ data.
The outcomes of this study demonstrate that improved accuracy for mental stress assessment can be achieved using a combination of physiological measures, which can accurately predict the behavioural and subjective measures. This conclusion emphasises the importance of considering additional physiological parameters while estimating cognitive workloads. In the future, a more comprehensive analysis of the mental workload will be possible by incorporating additional physiological, subjective, and behavioural measures like gaze and facial expression monitoring, galvanic skin response (GSR), etc. Larger datasets can be used to acquire more convincing results. Furthermore, other machine-learning techniques can also be used to examine the correlation between physiological and conventional measures, as a comparison with already employed techniques. An aspect of learning was observed in this study, causing a slight increase in performance and a decrease in fatigue and anxiety, as is clearly evident from NASA-TLX scores, missed beeps and reaction time. Further in-depth investigation in this regard can be carried out. This analysis can also be extended to different tasks or populations, i.e., various age groups or occupations. This research can be a step forward to investigate real-time cognitive workloads to provide feedback to people doing stressful jobs.


