


Deep Neural Network-Based Visual Feedback System for Nasopharyngeal Swab Sampling

Abstract
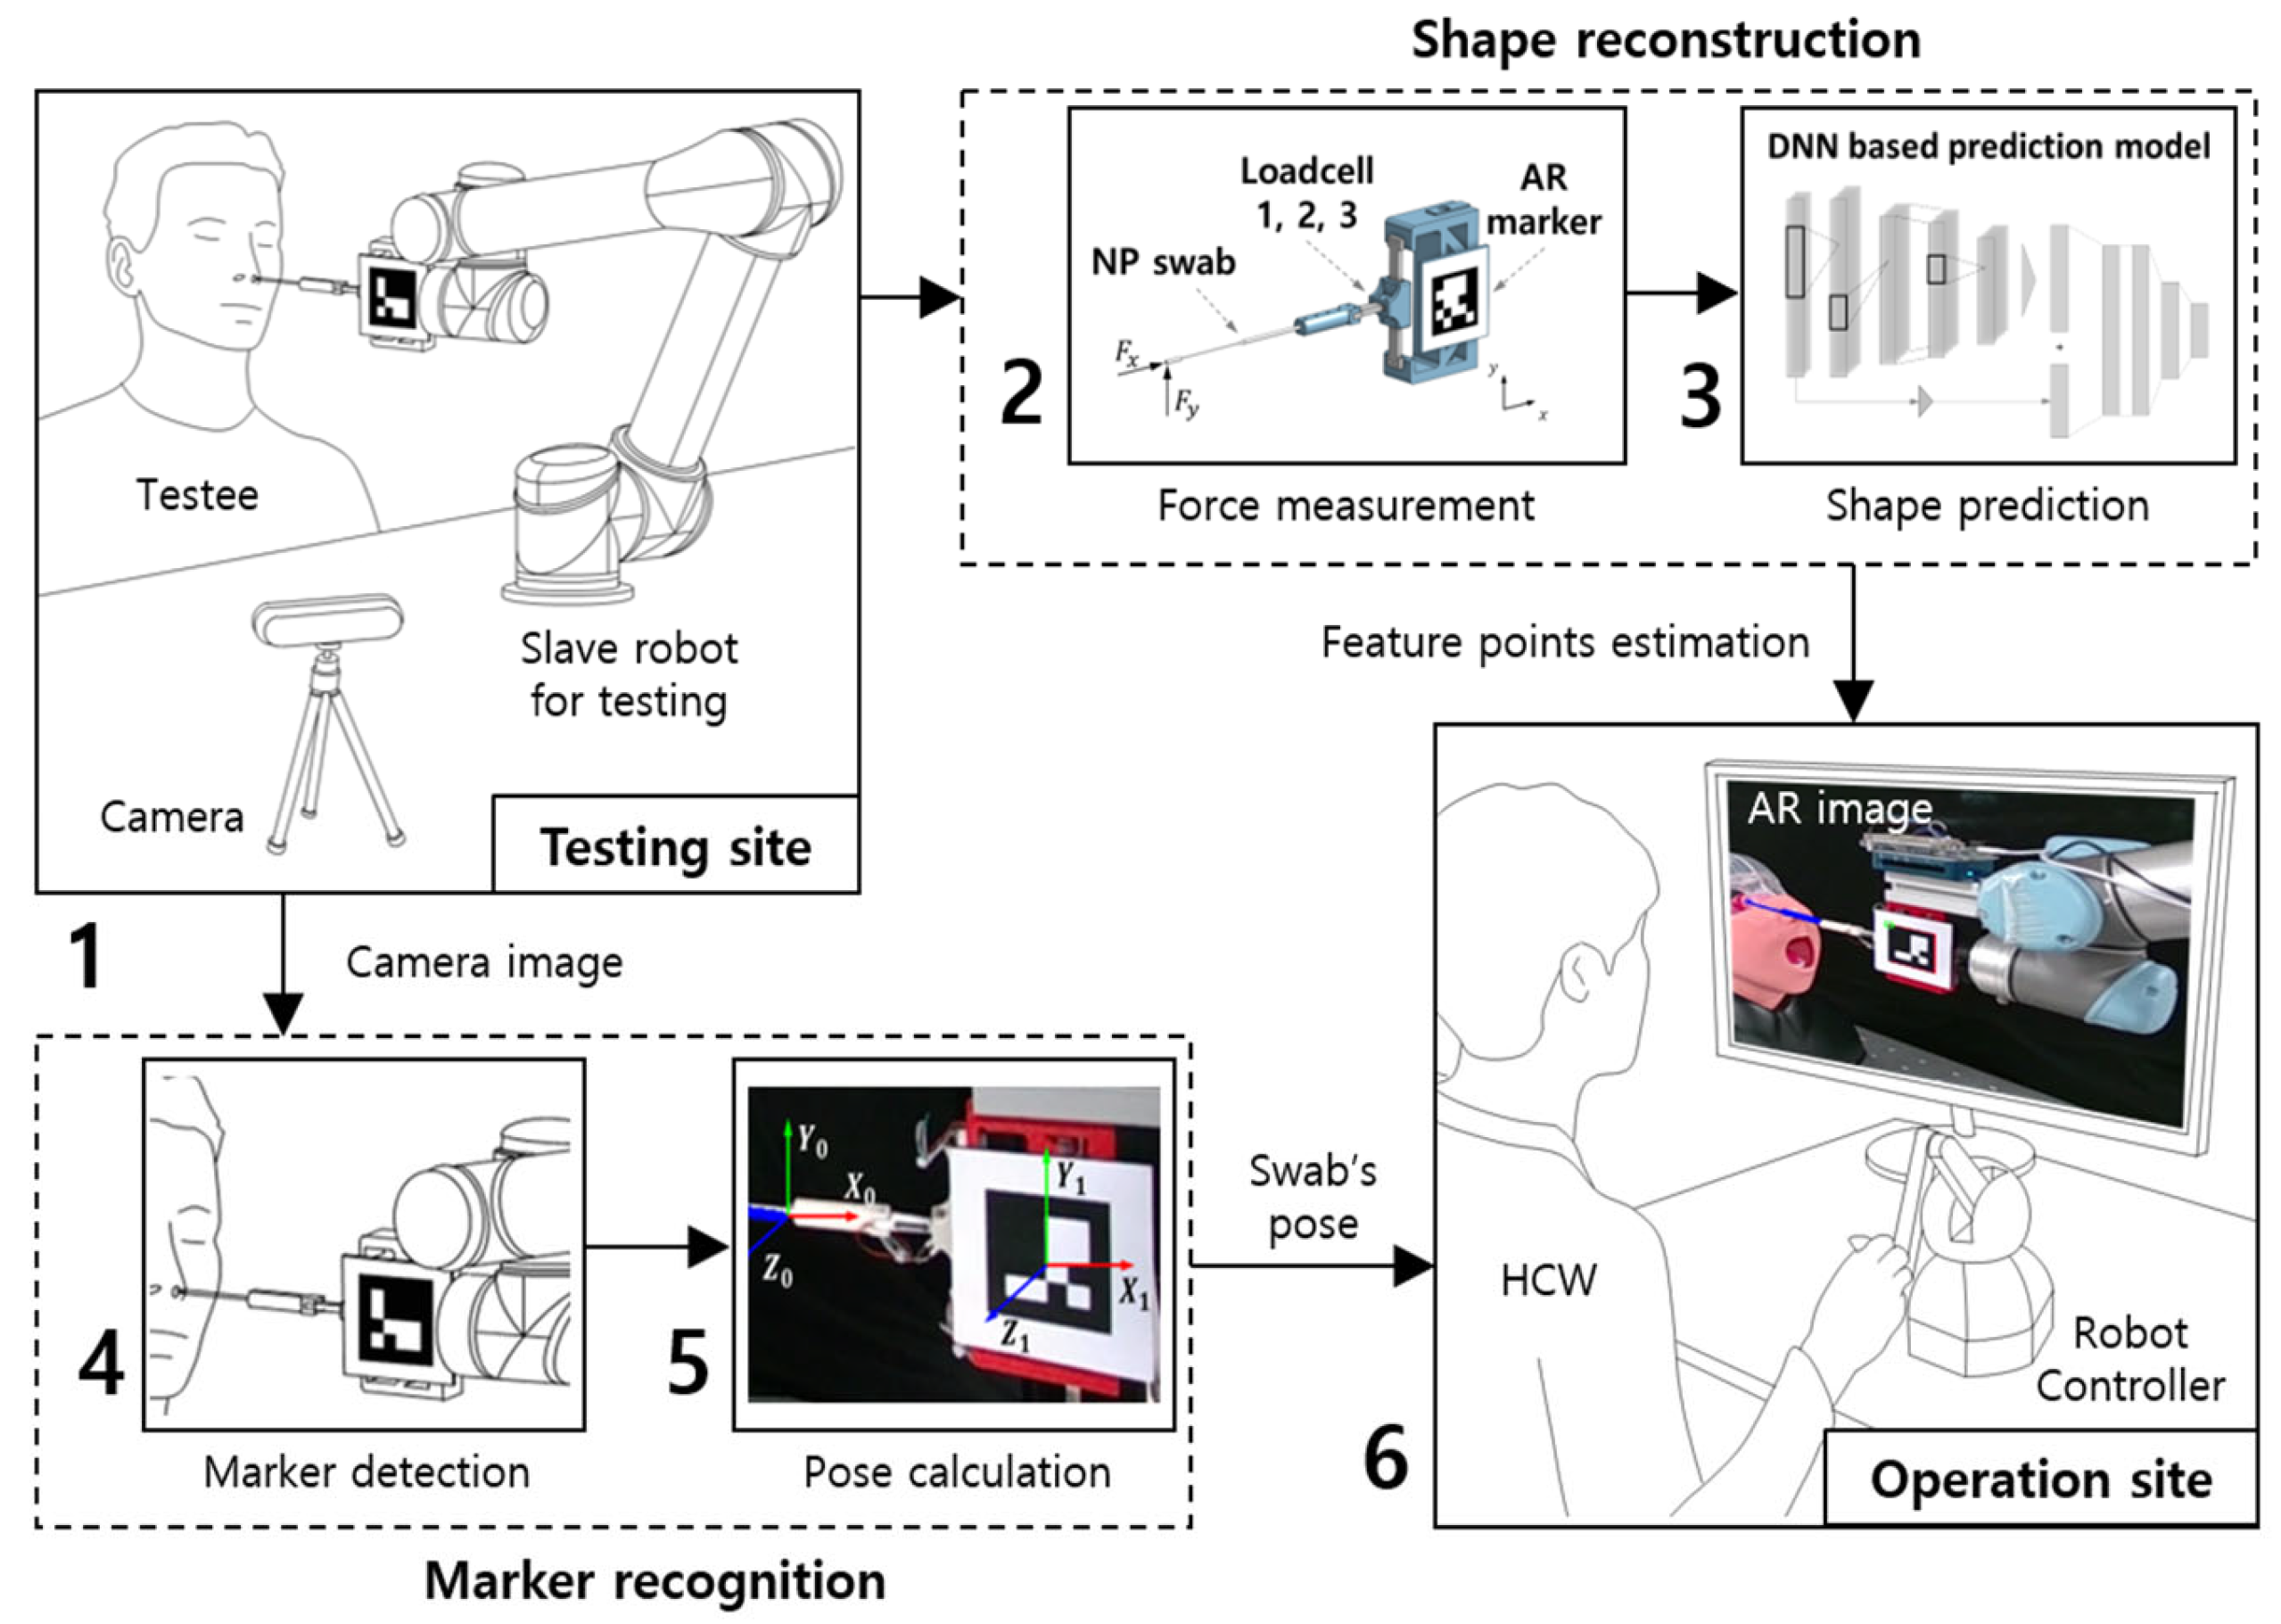
:1. Introduction
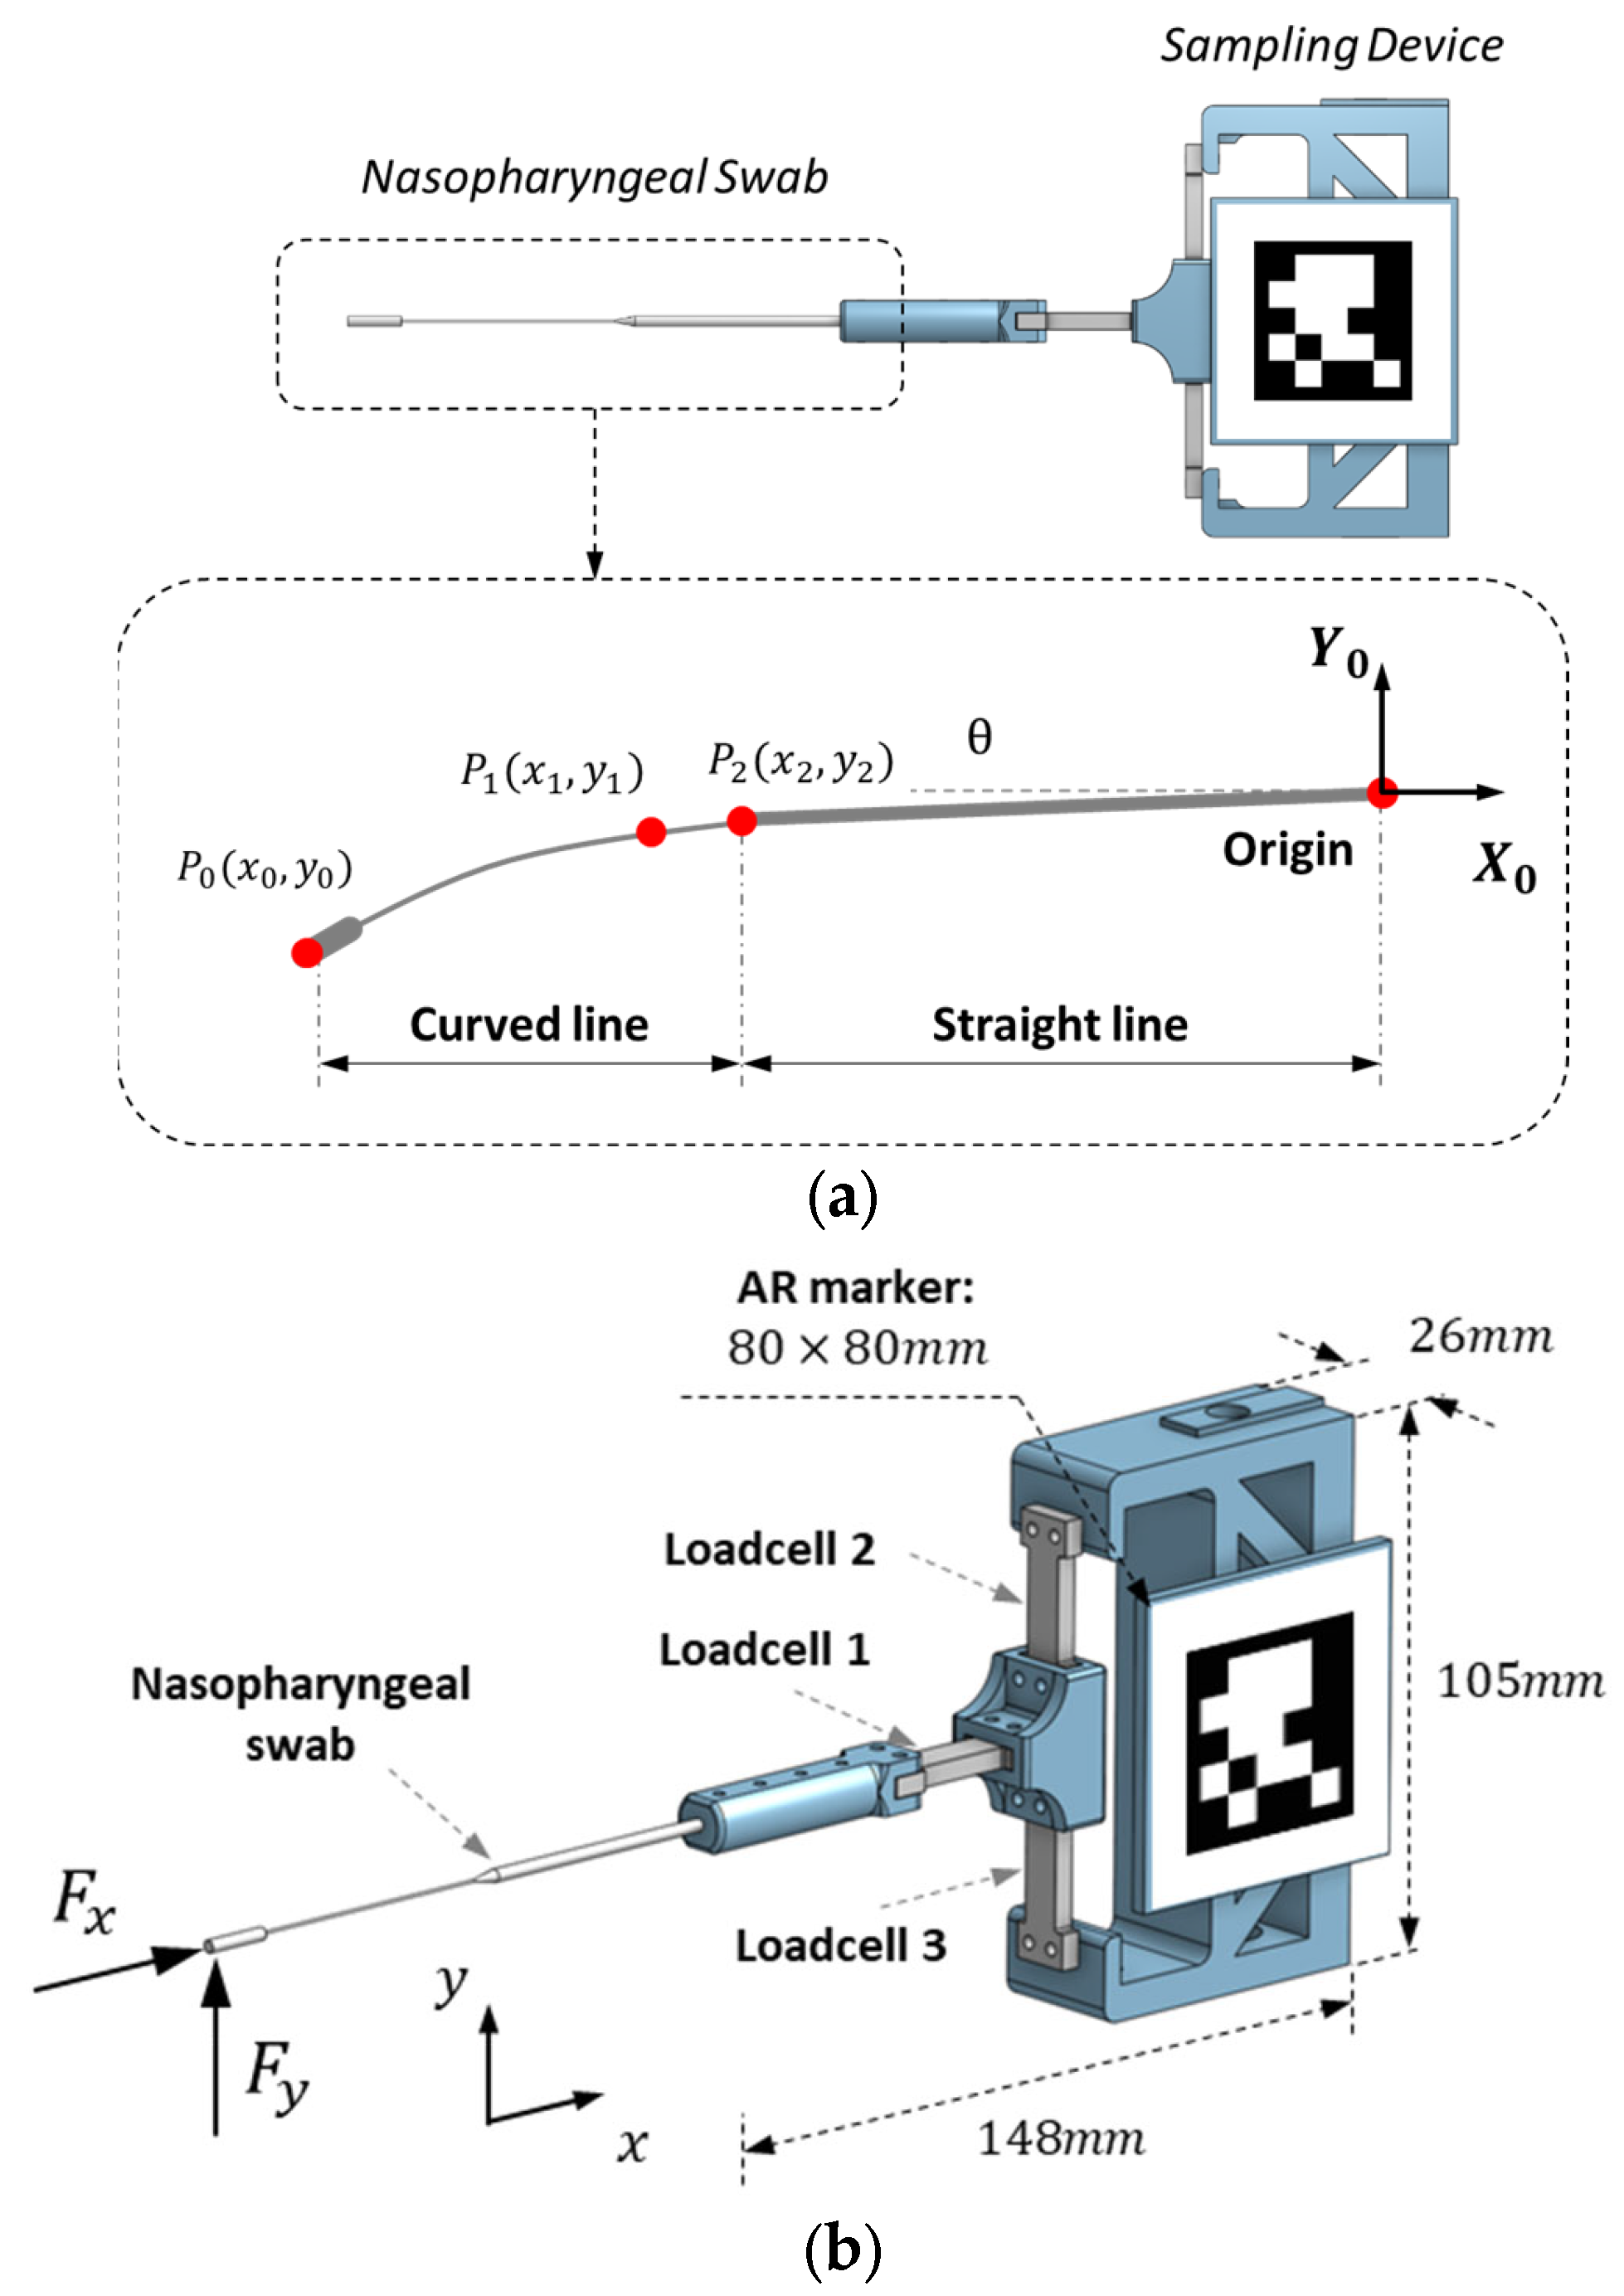
2. Reconstruction of Nasopharyngeal Swab
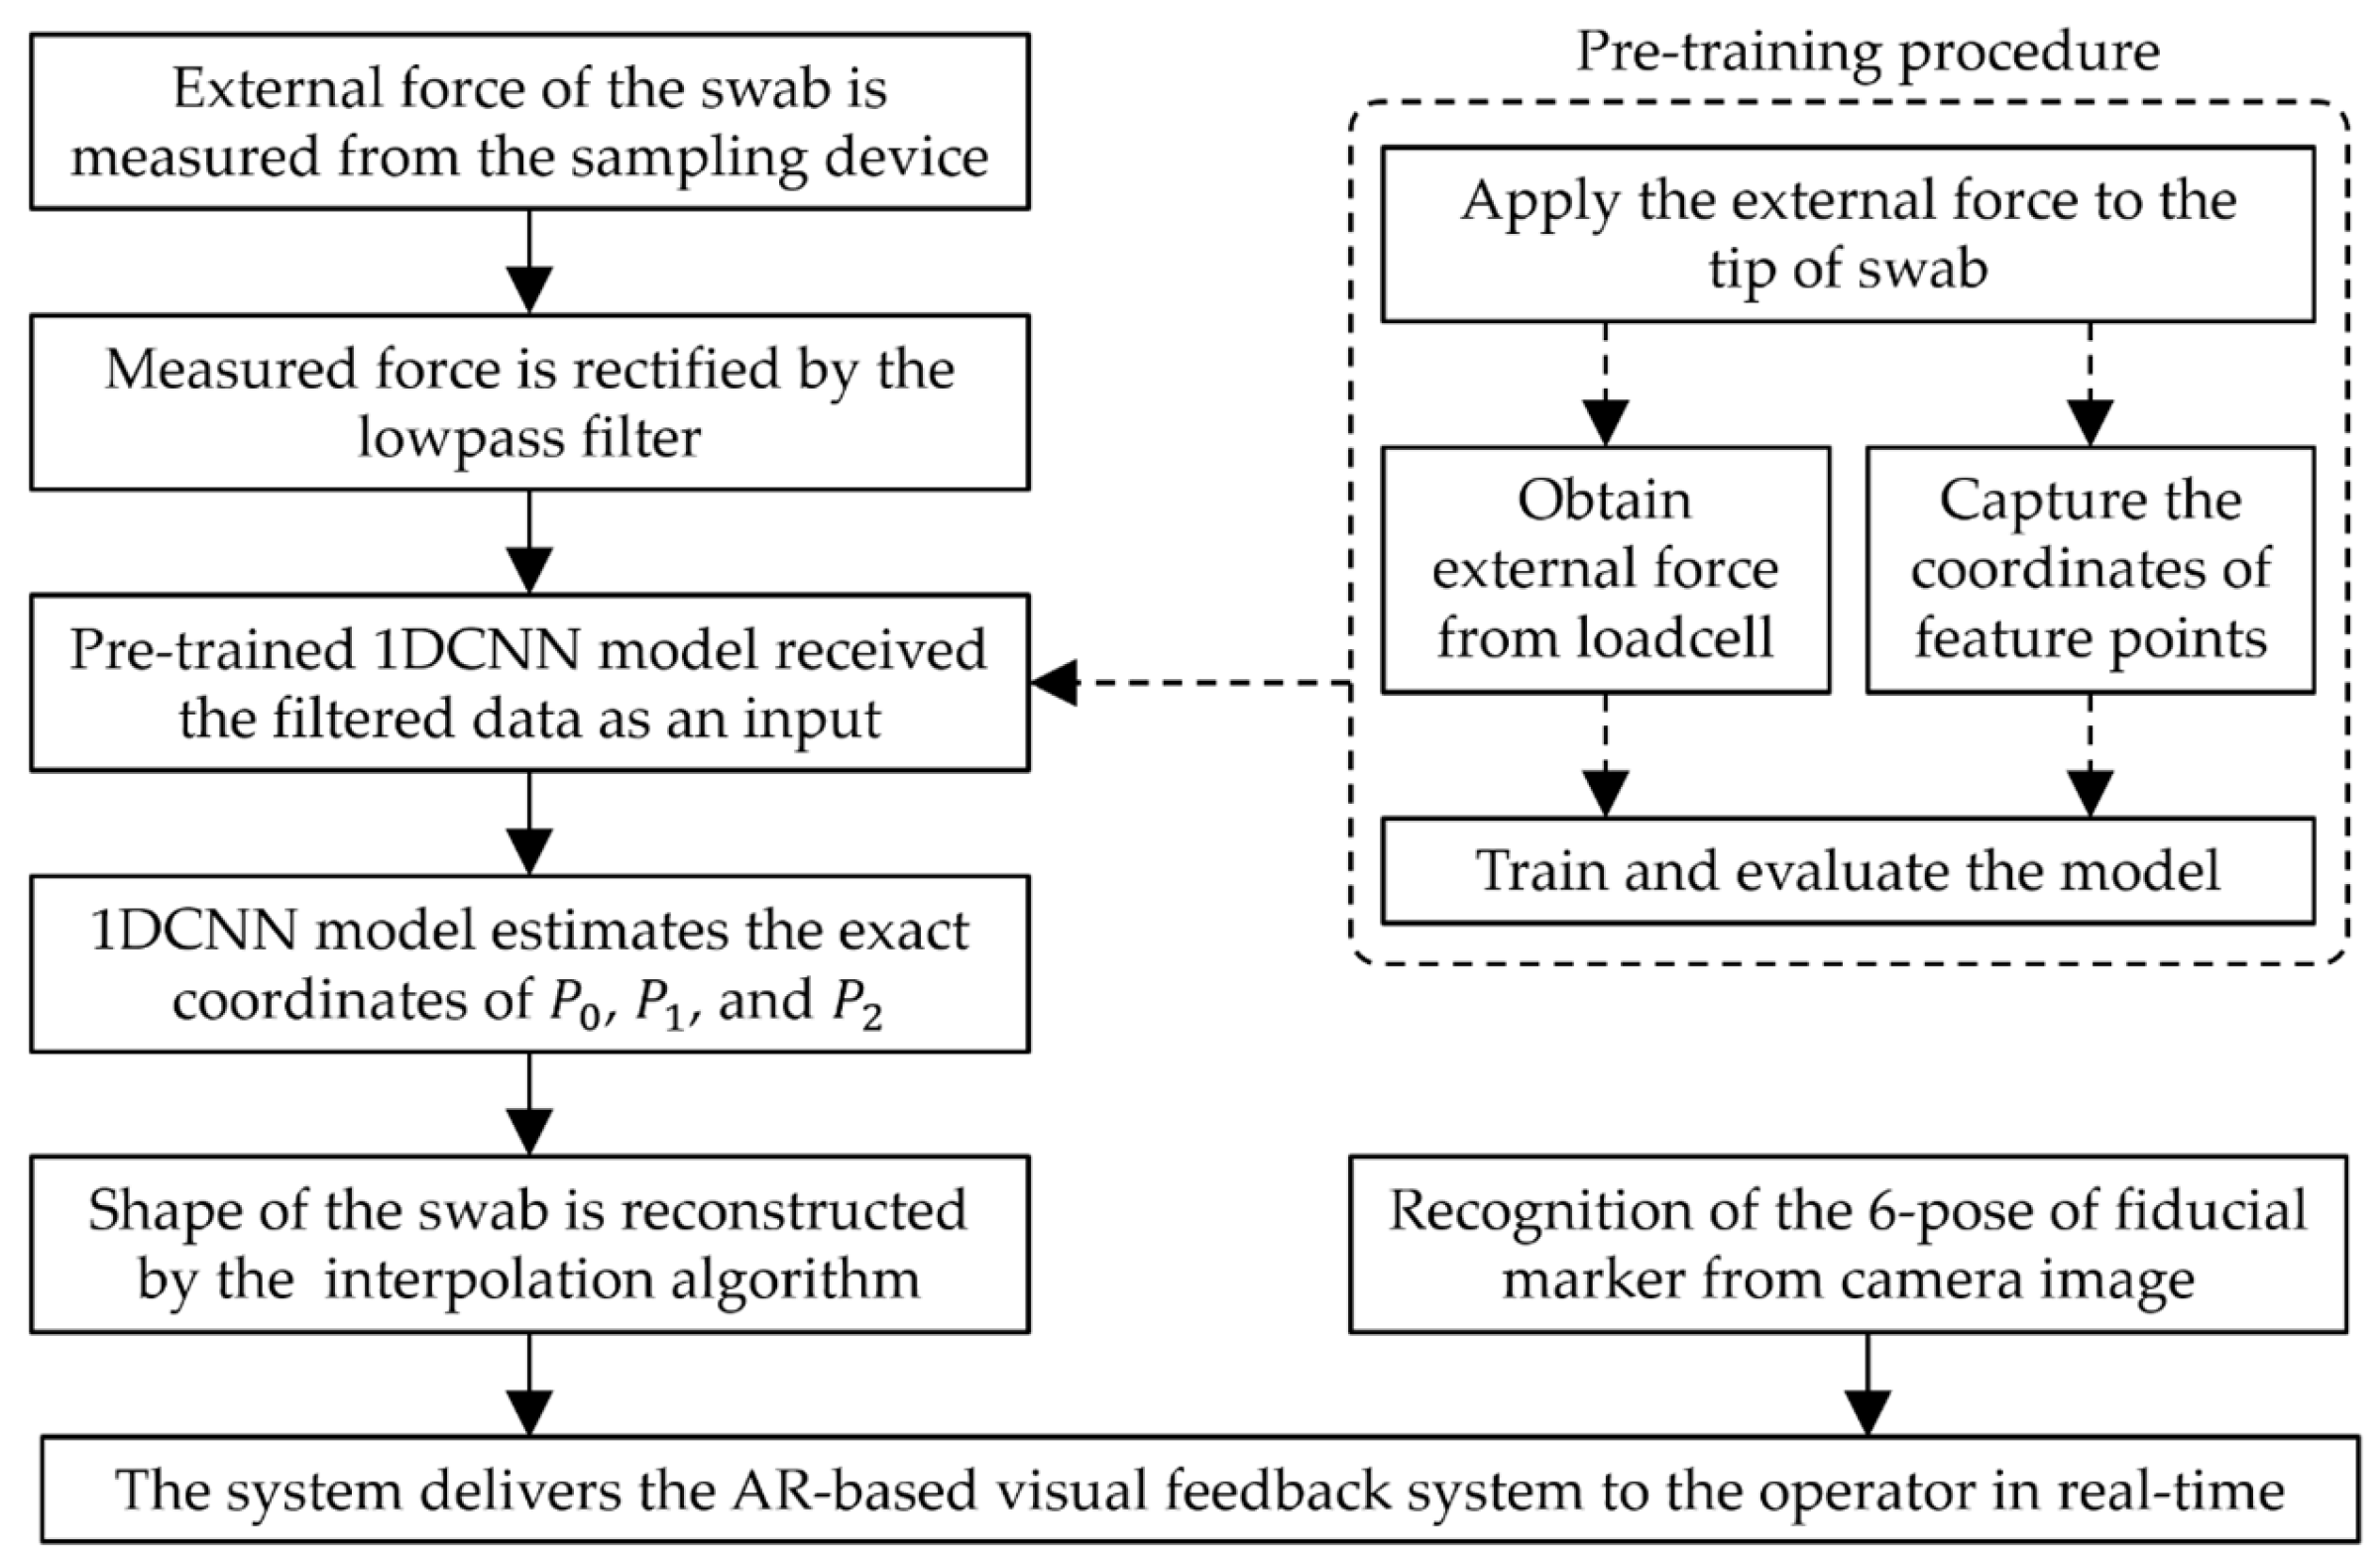
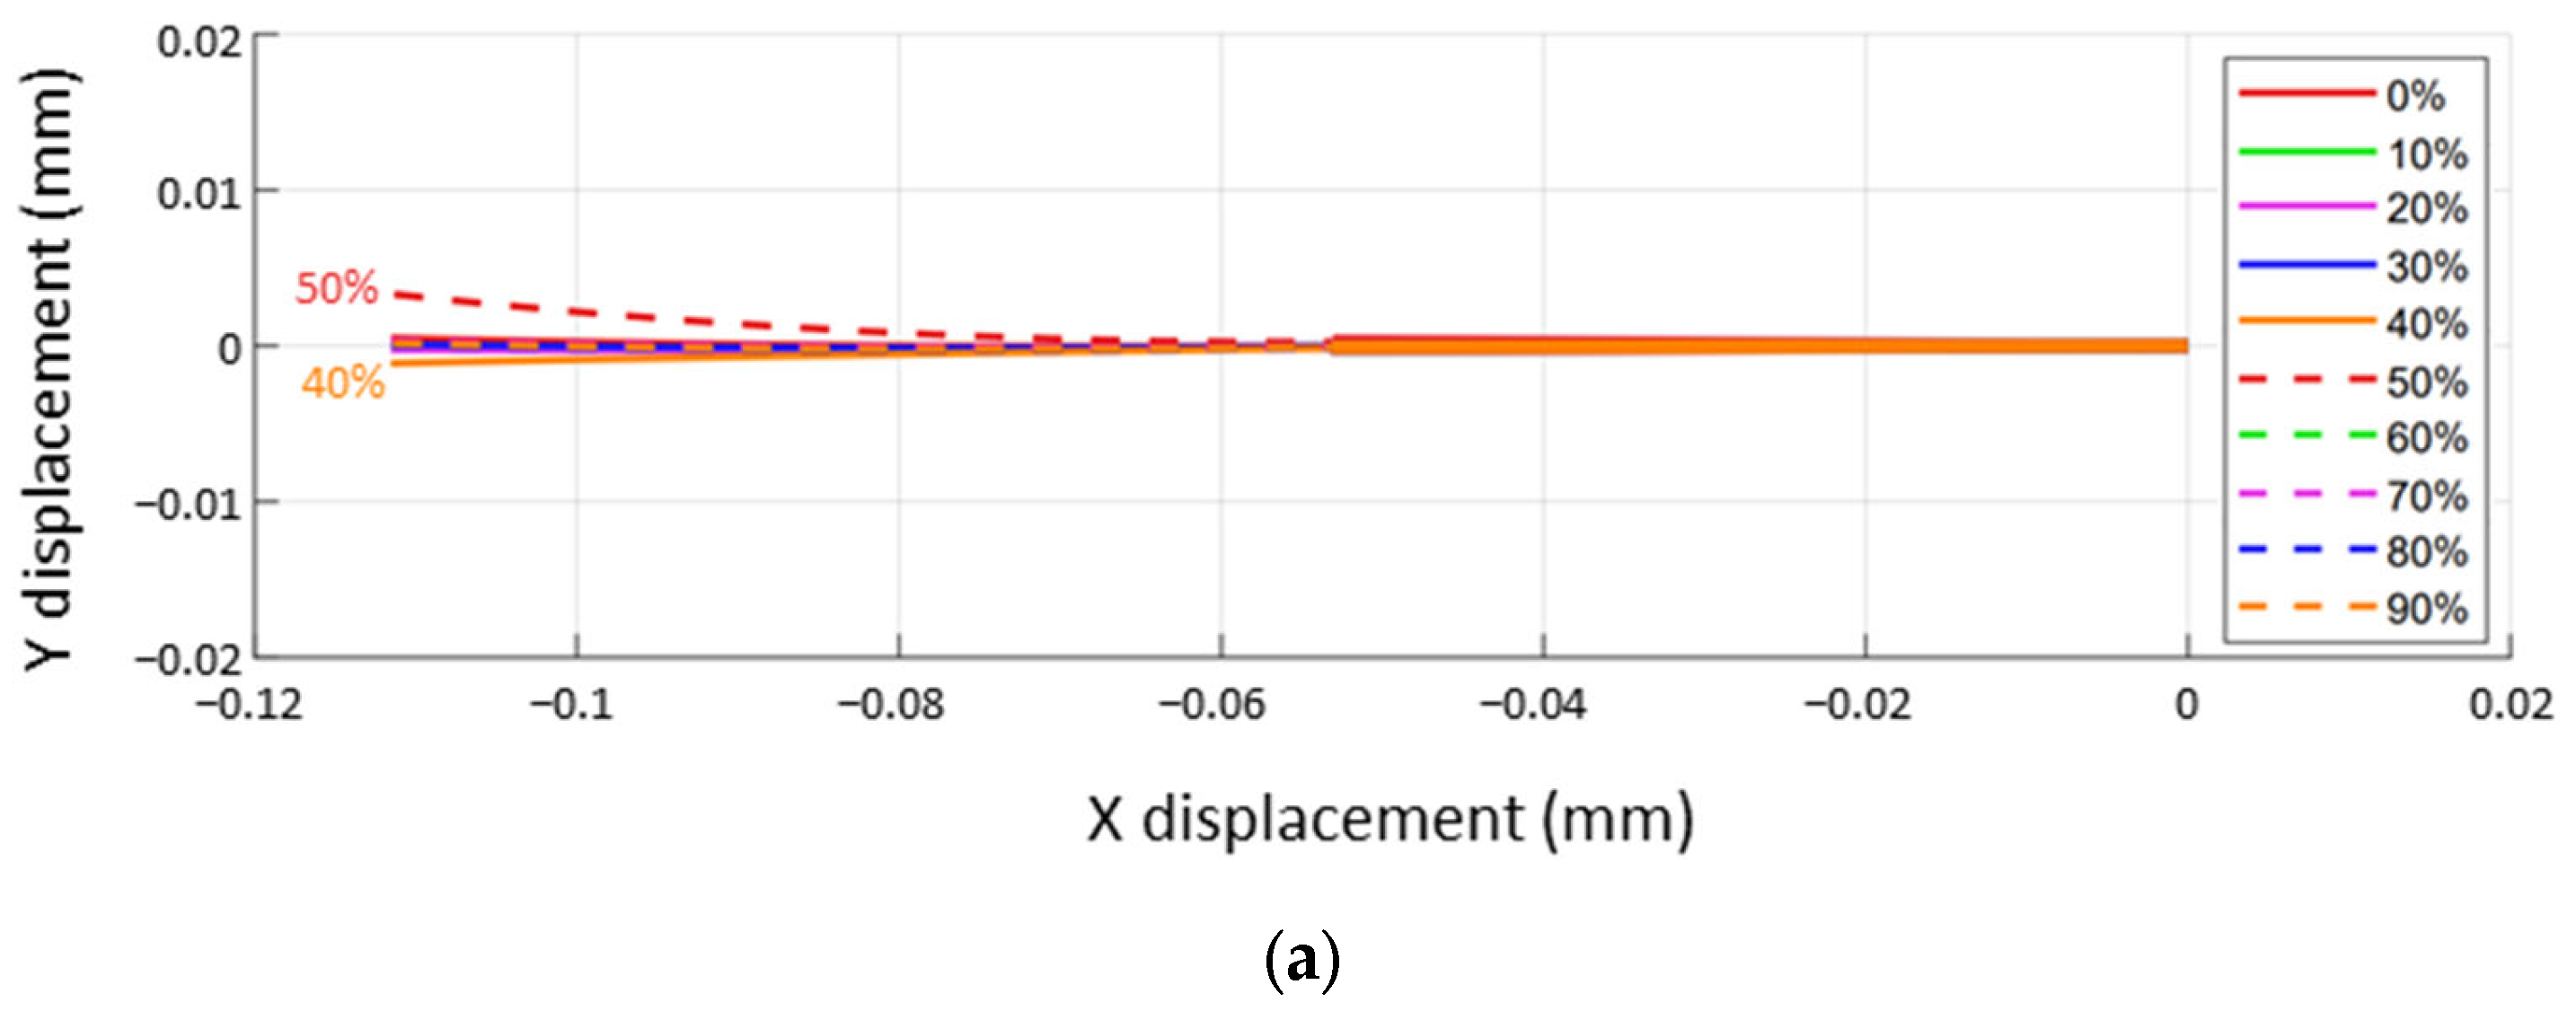
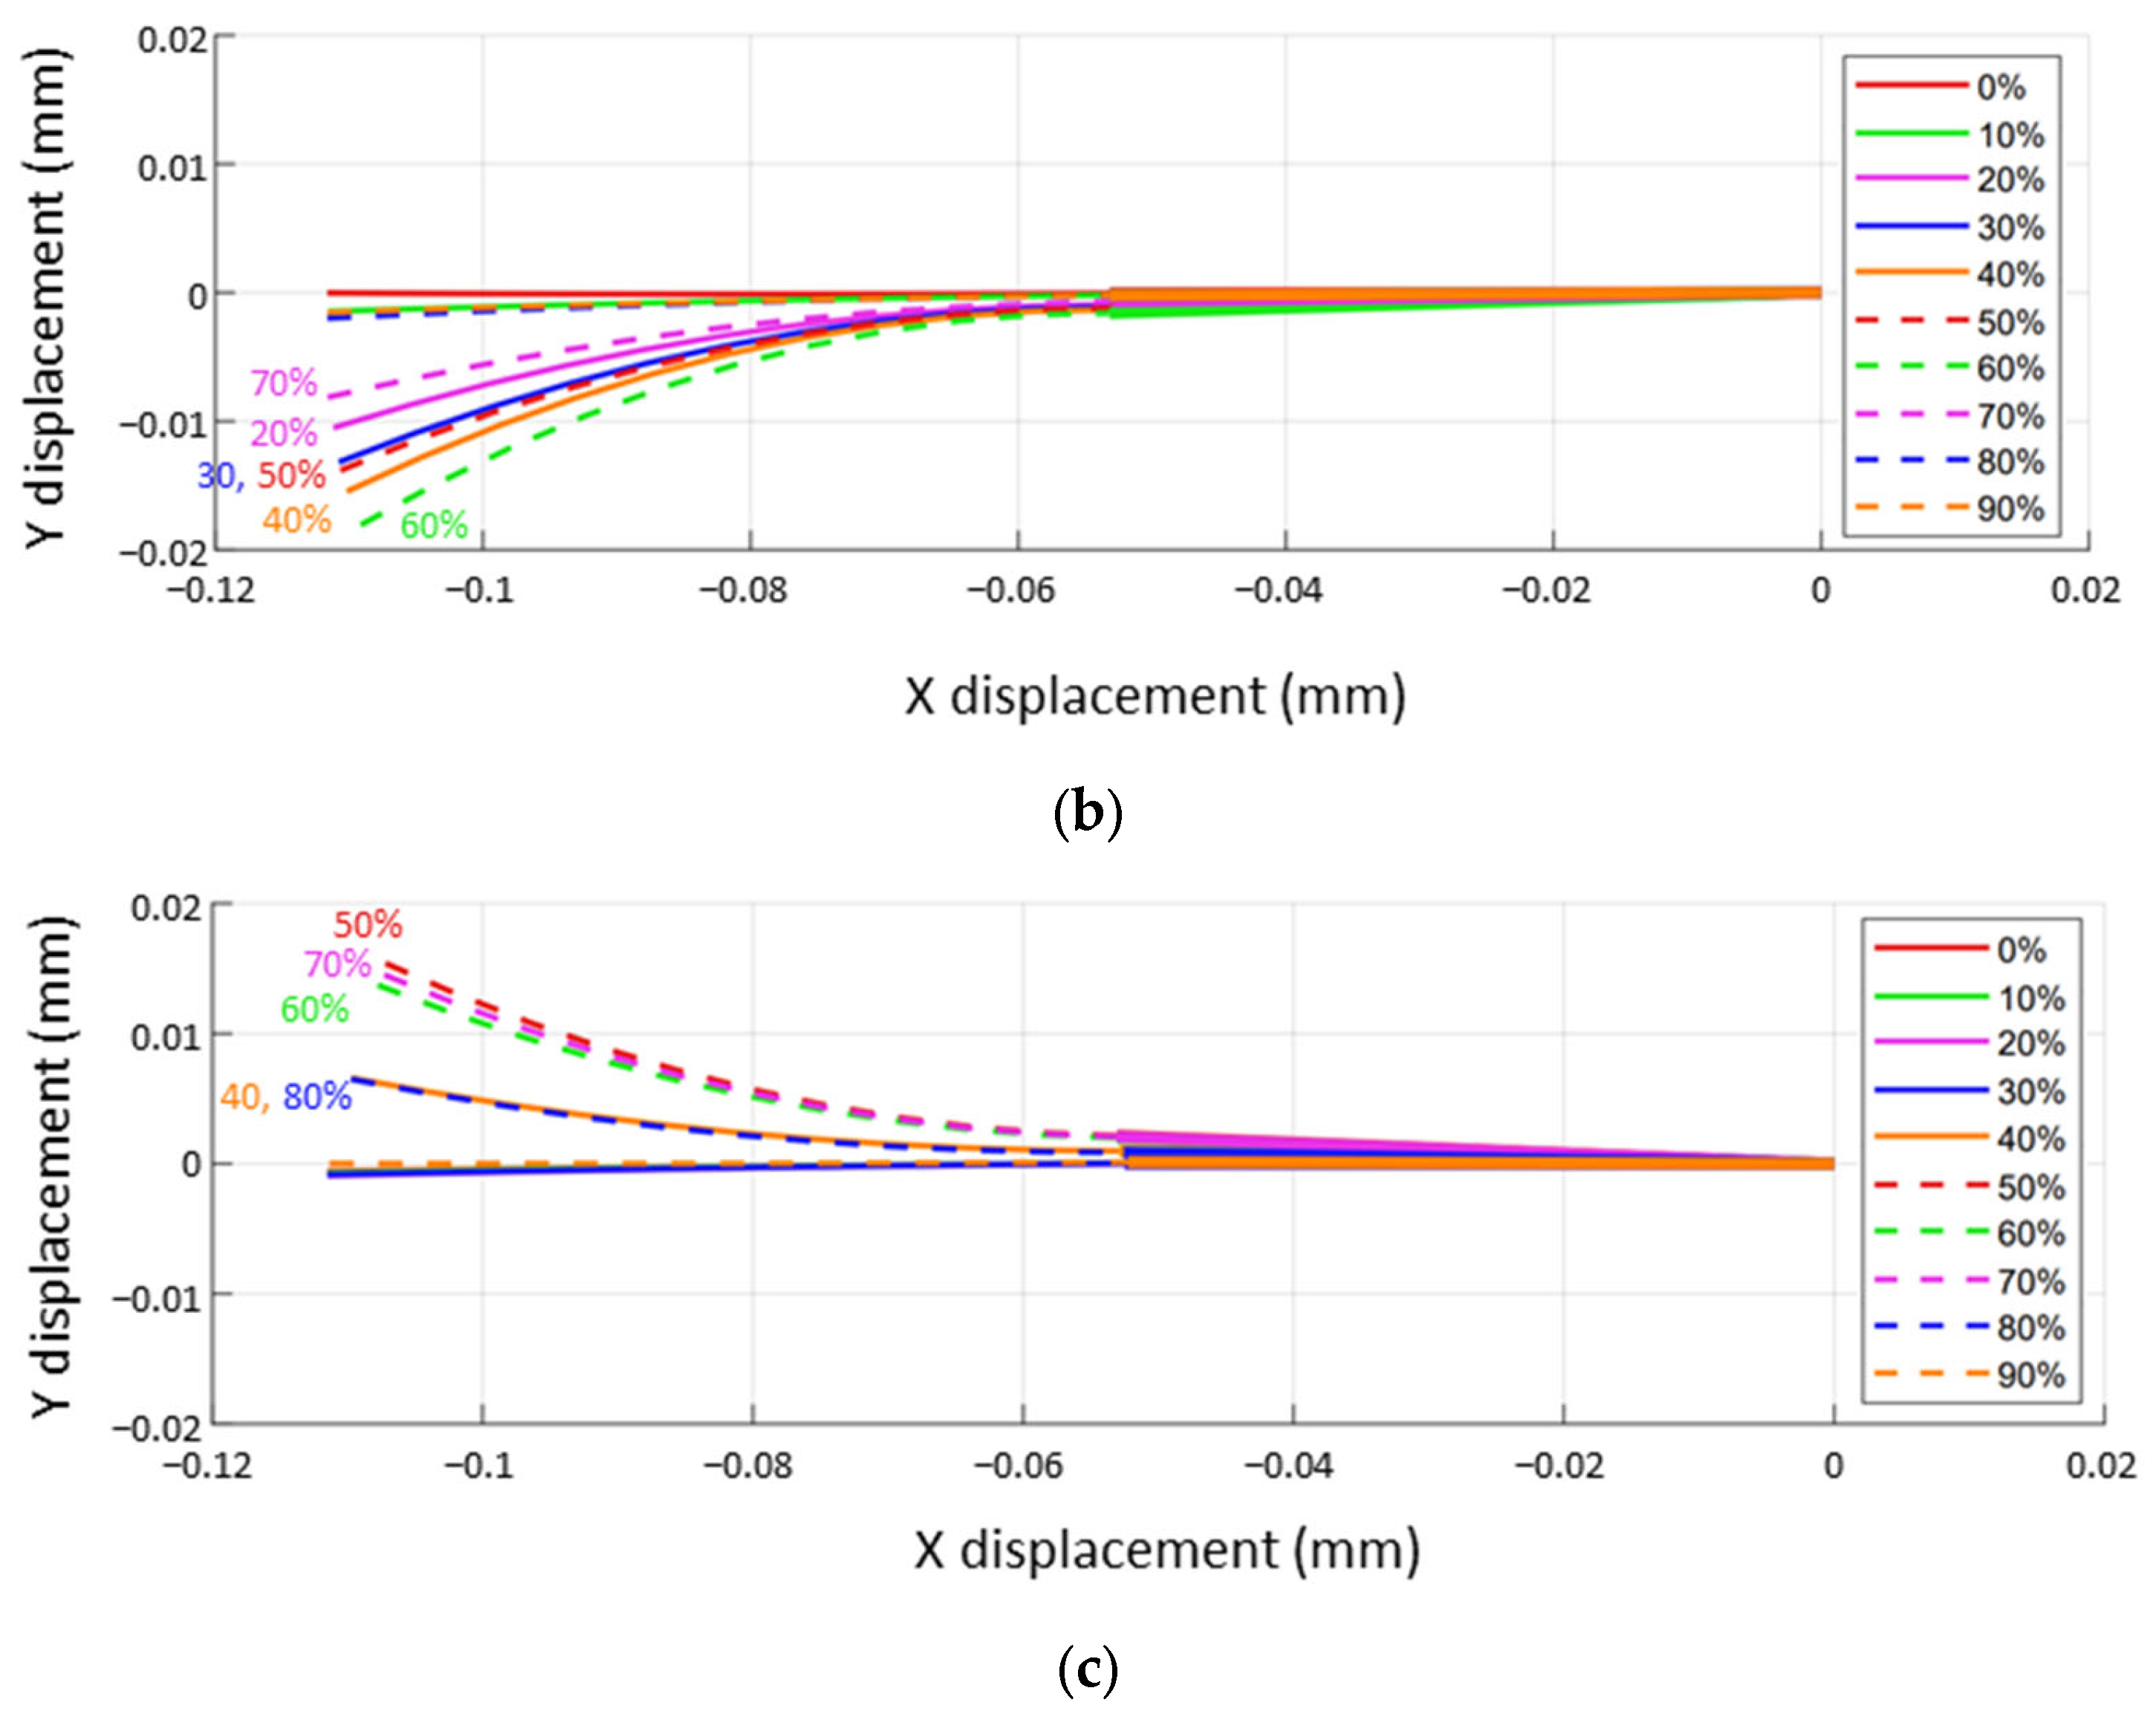
2.1. Methods for the Shape Reconstruction of NP Swab
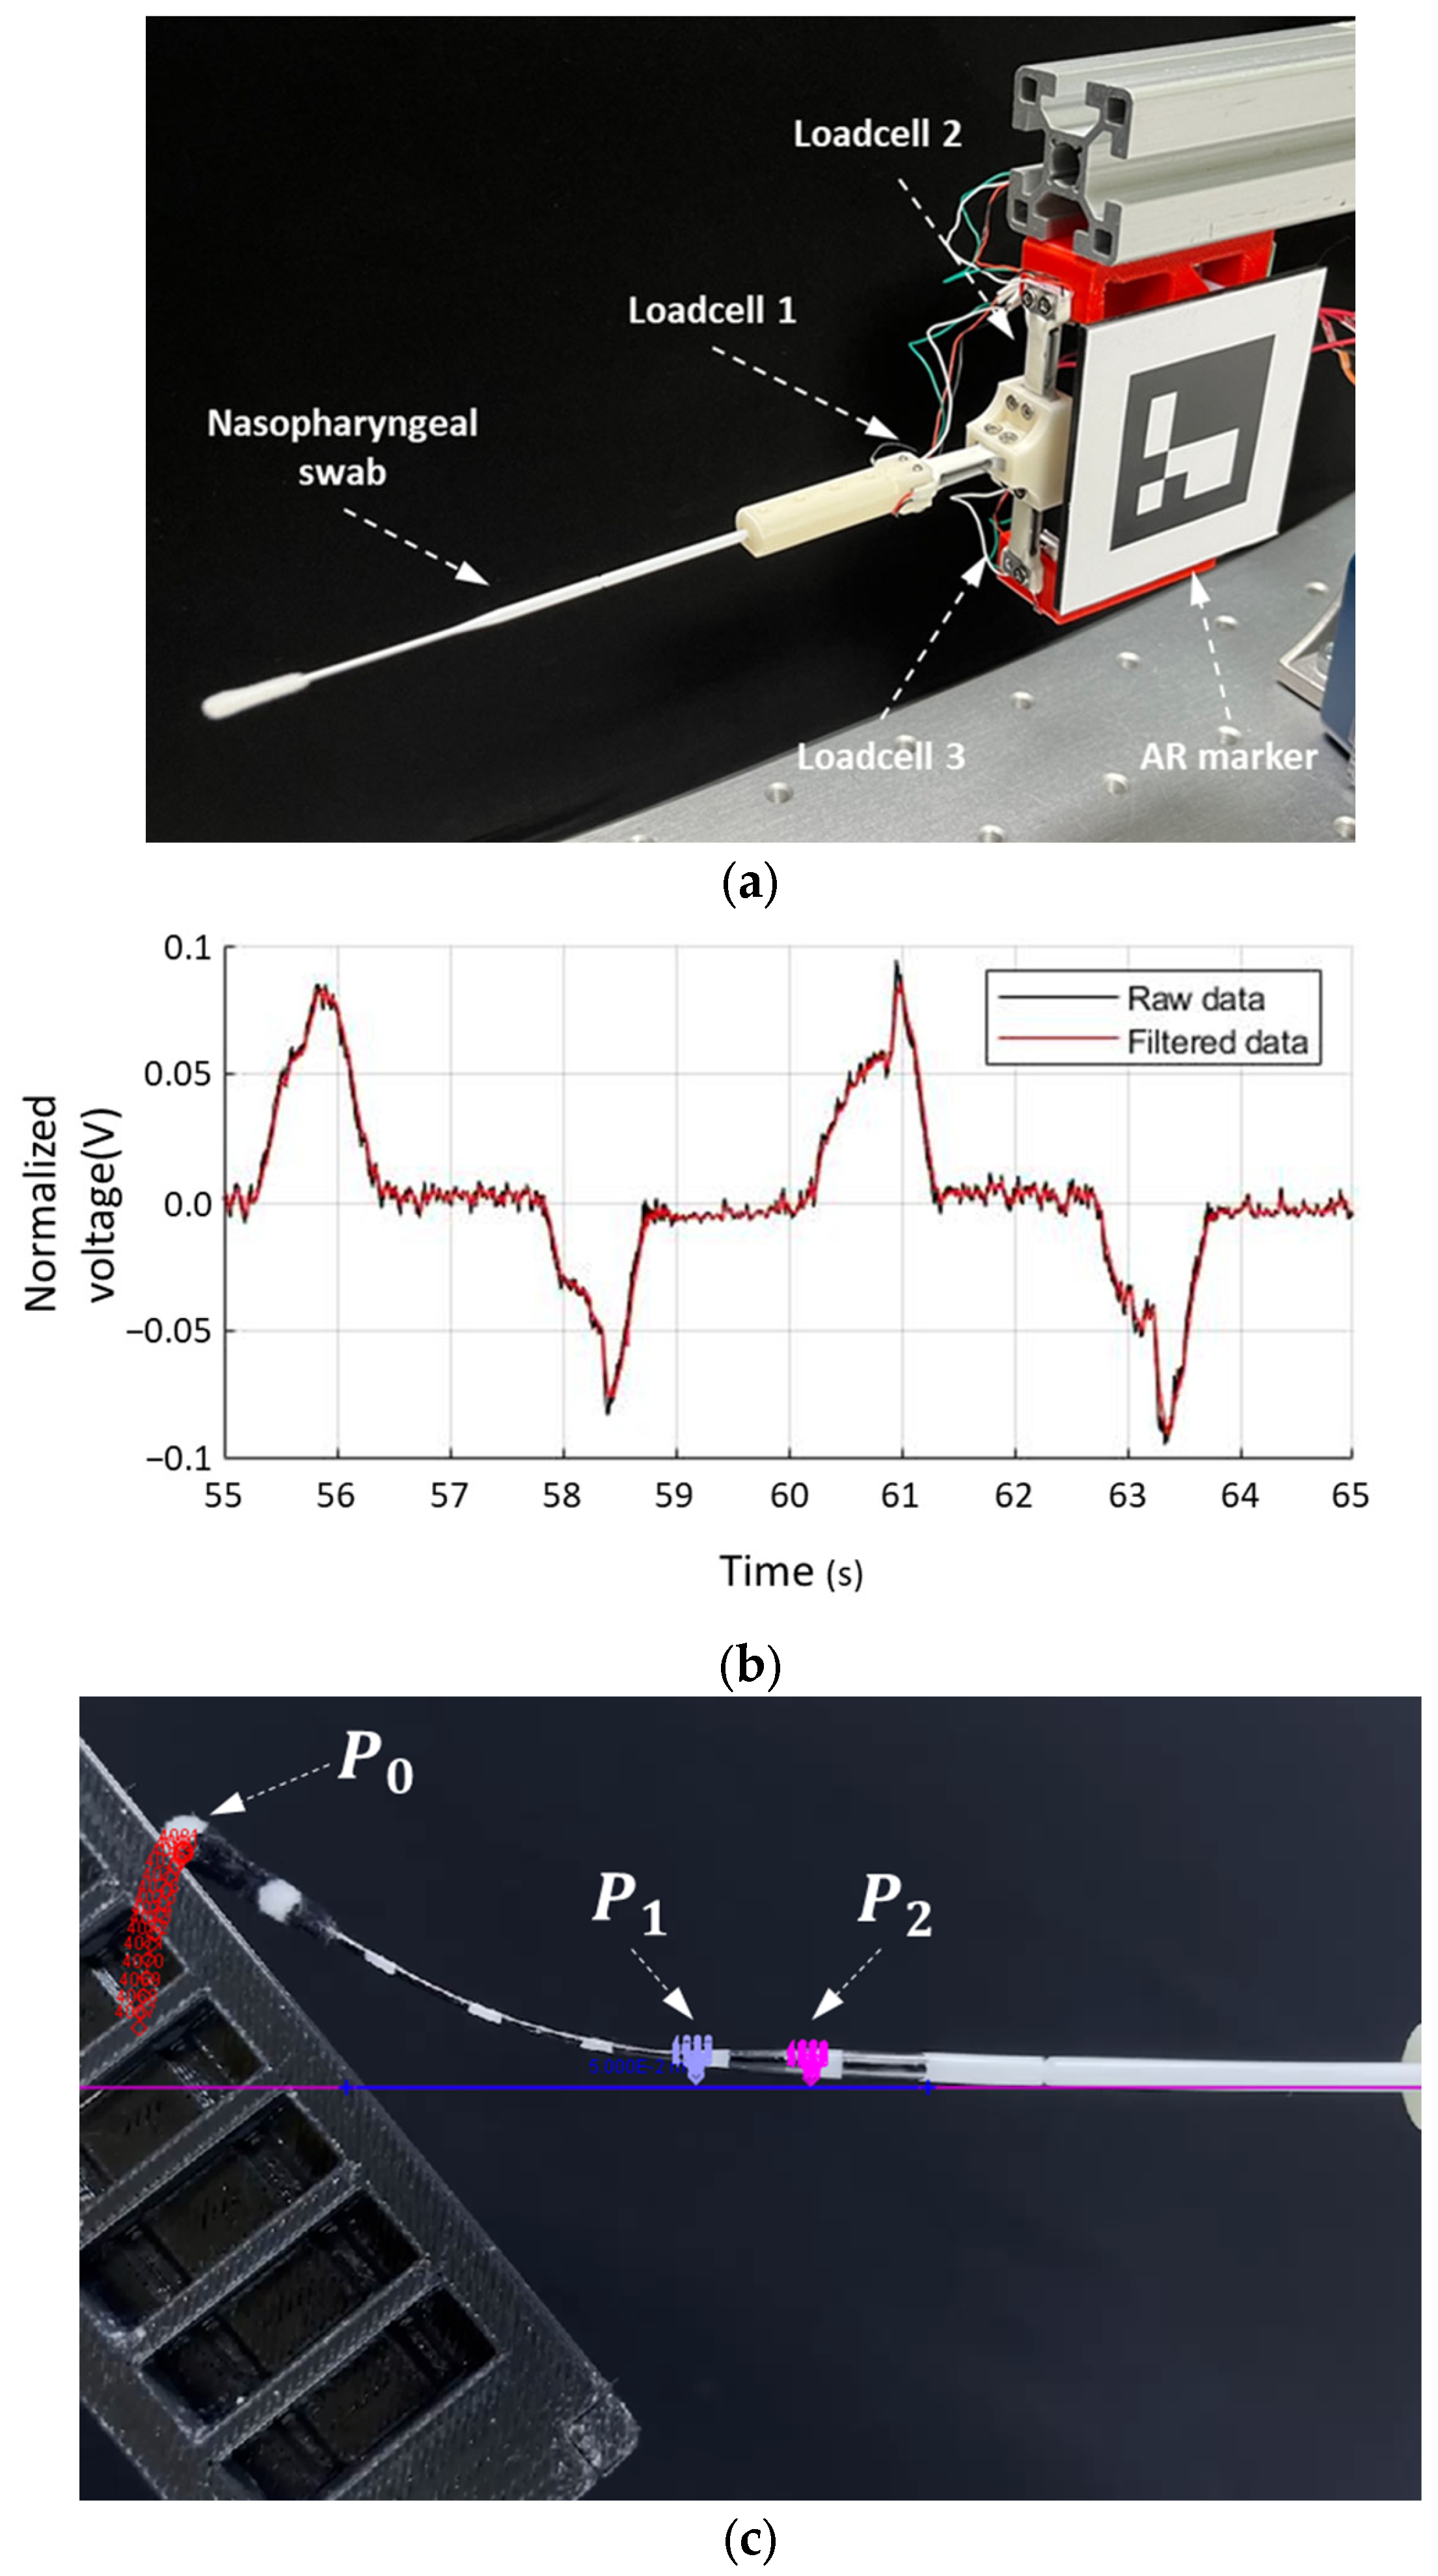
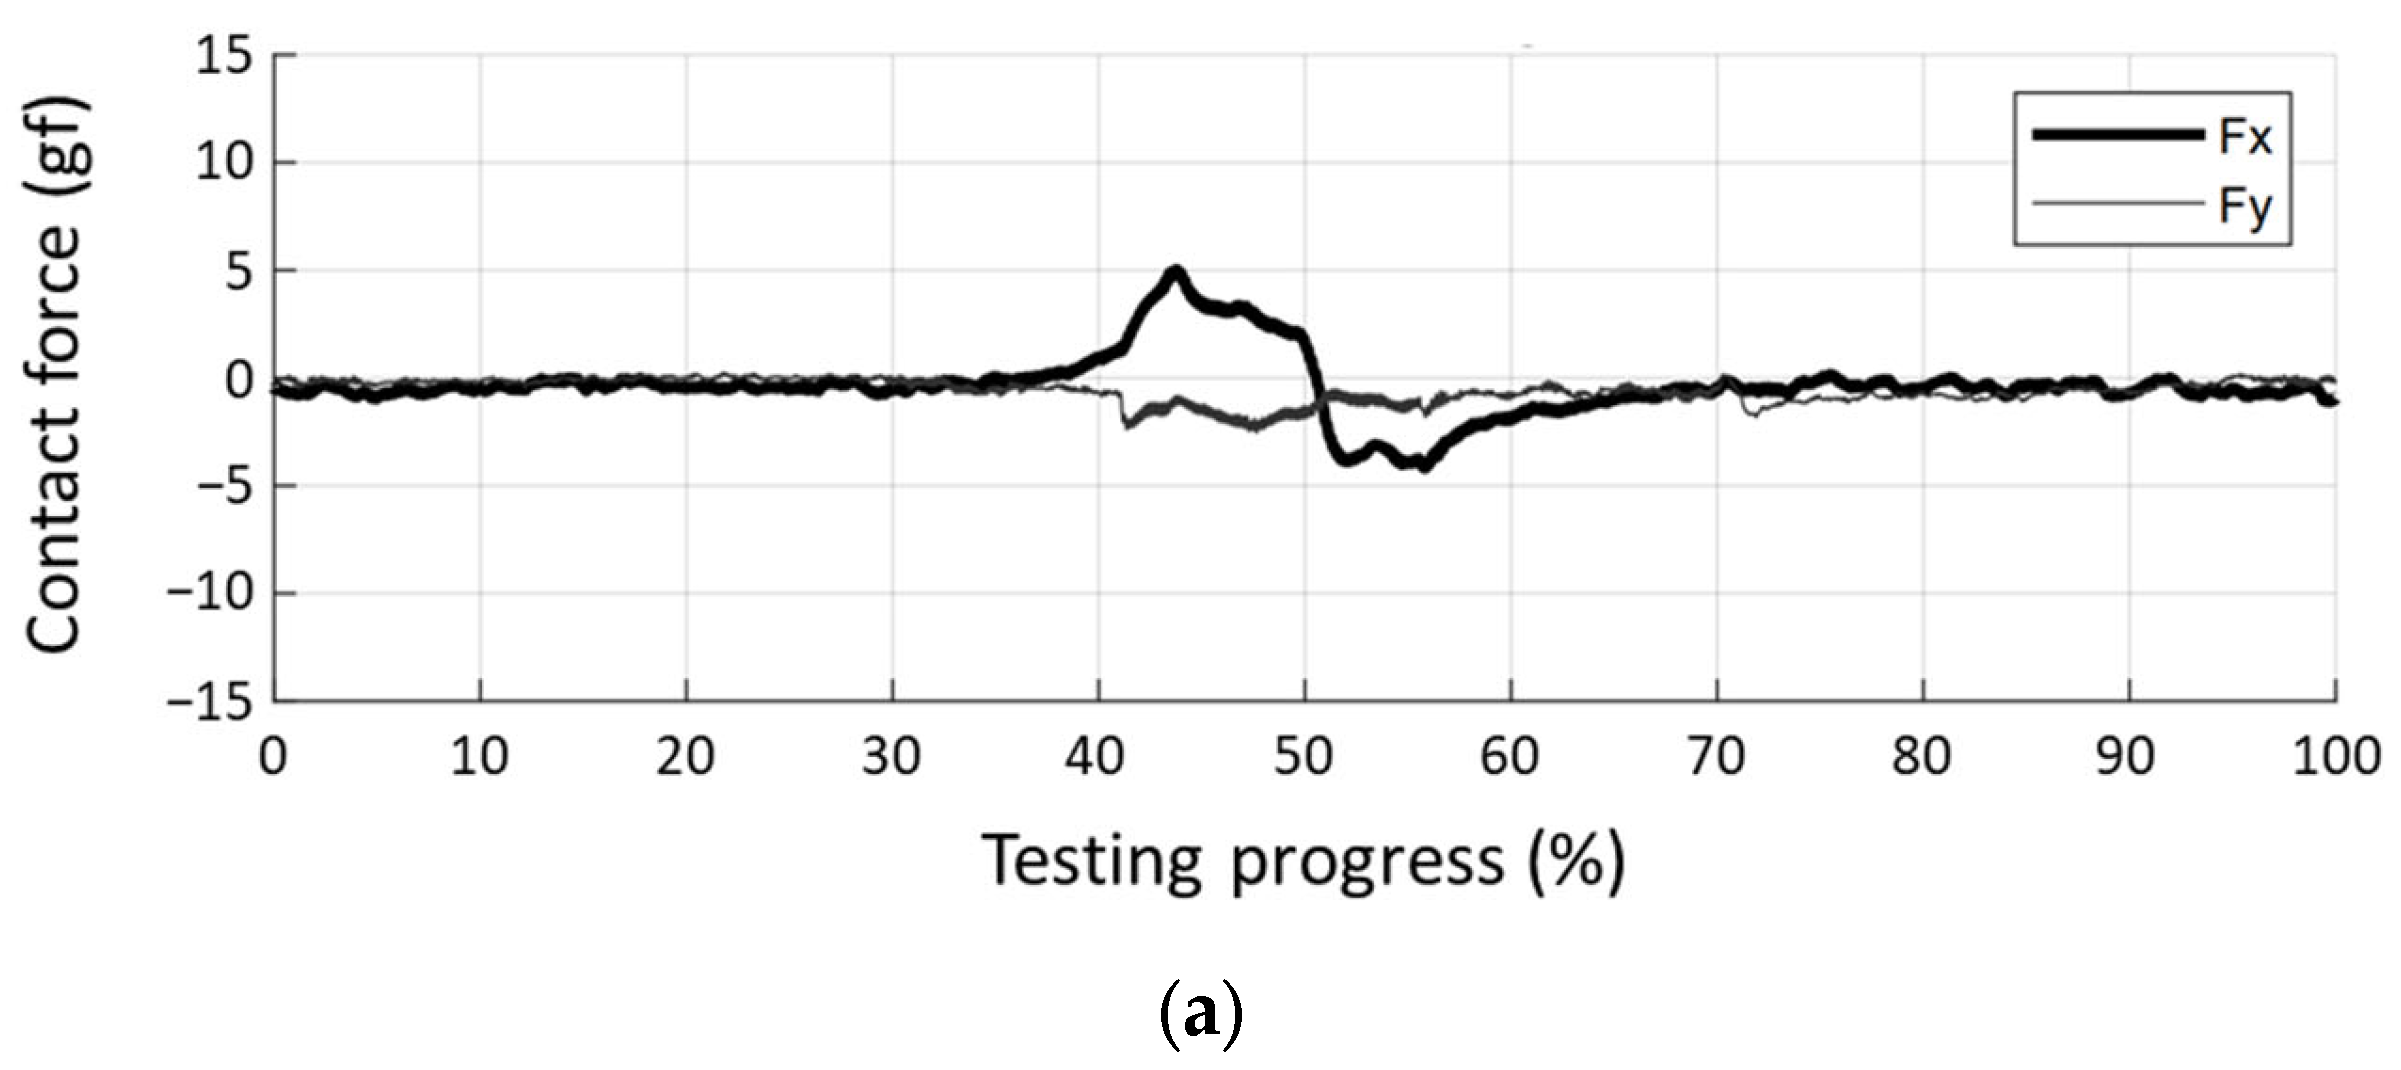
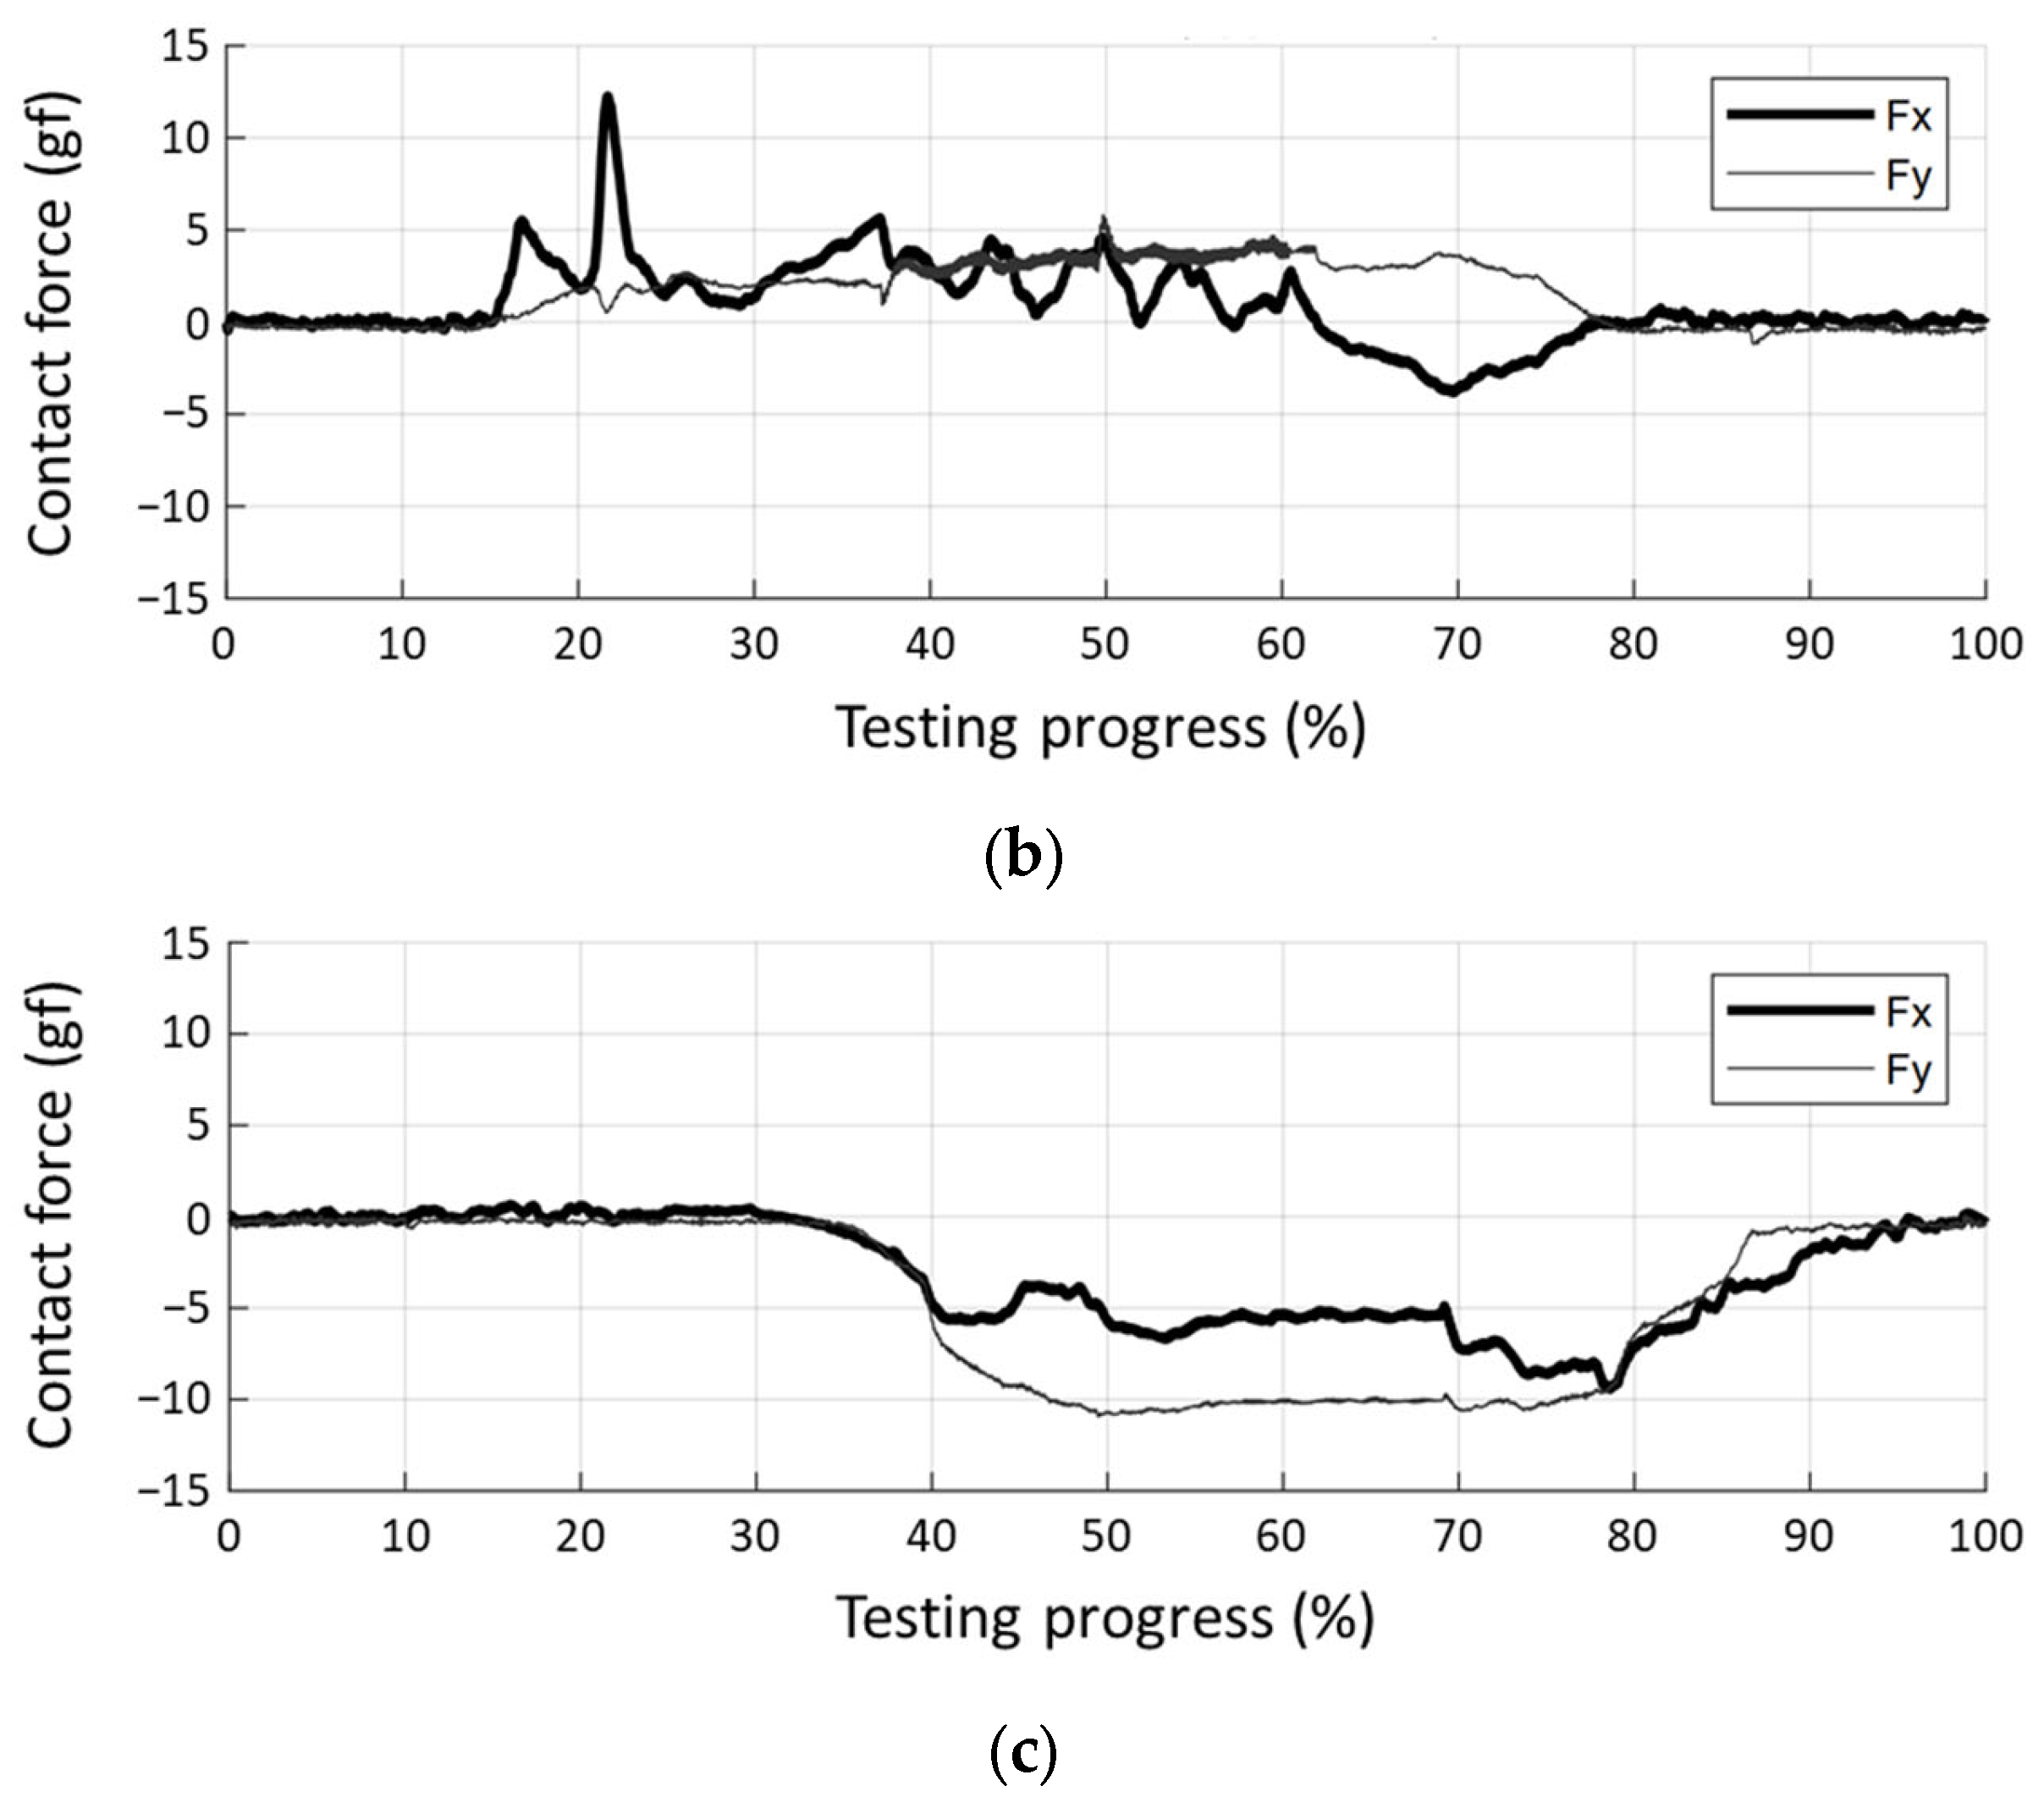
2.2. Data Acquisition and Filtering Method of the Applied Force and Motion
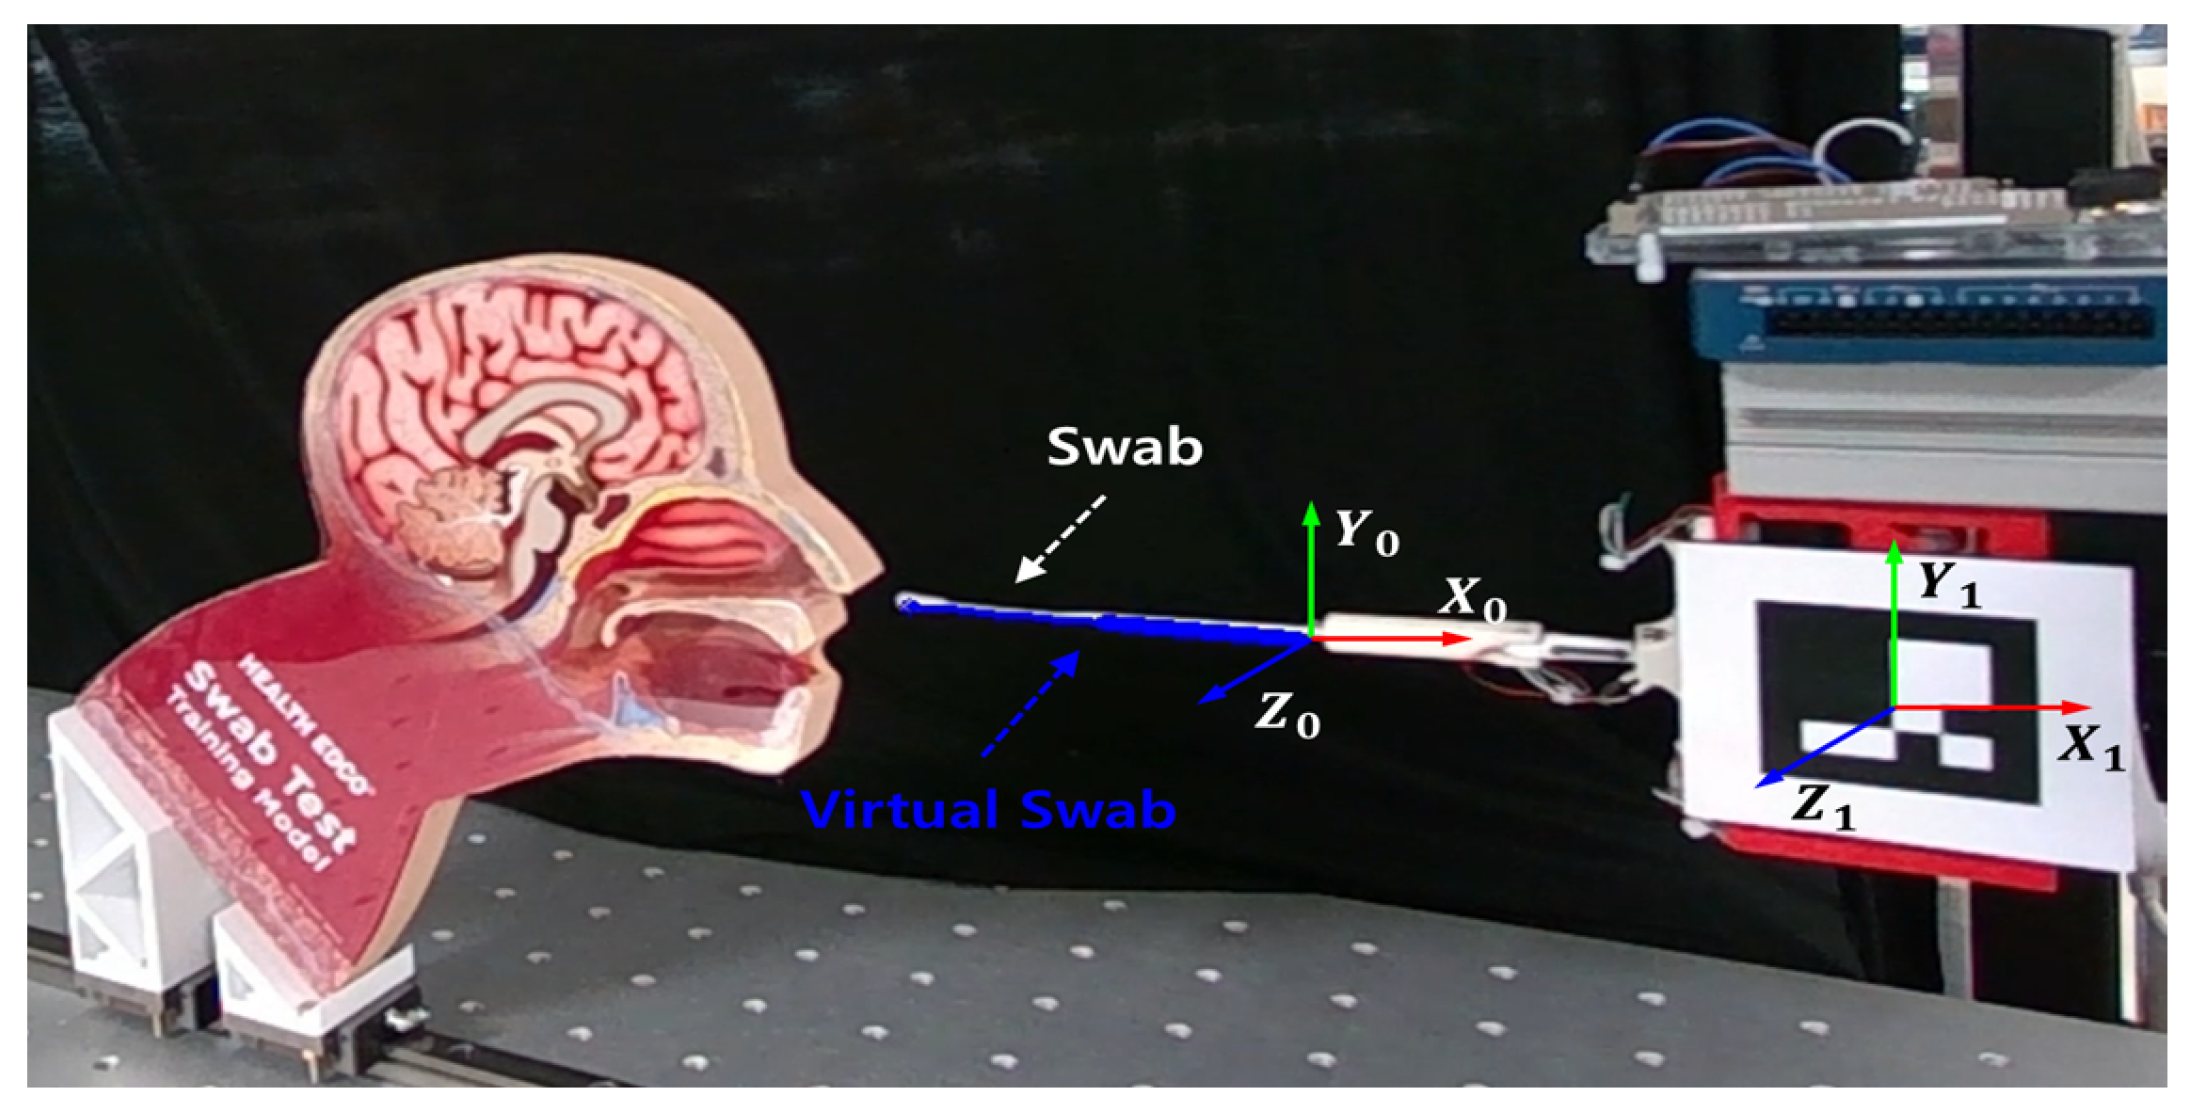
2.3. Visualization in Real-Time Augmented-Reality Model
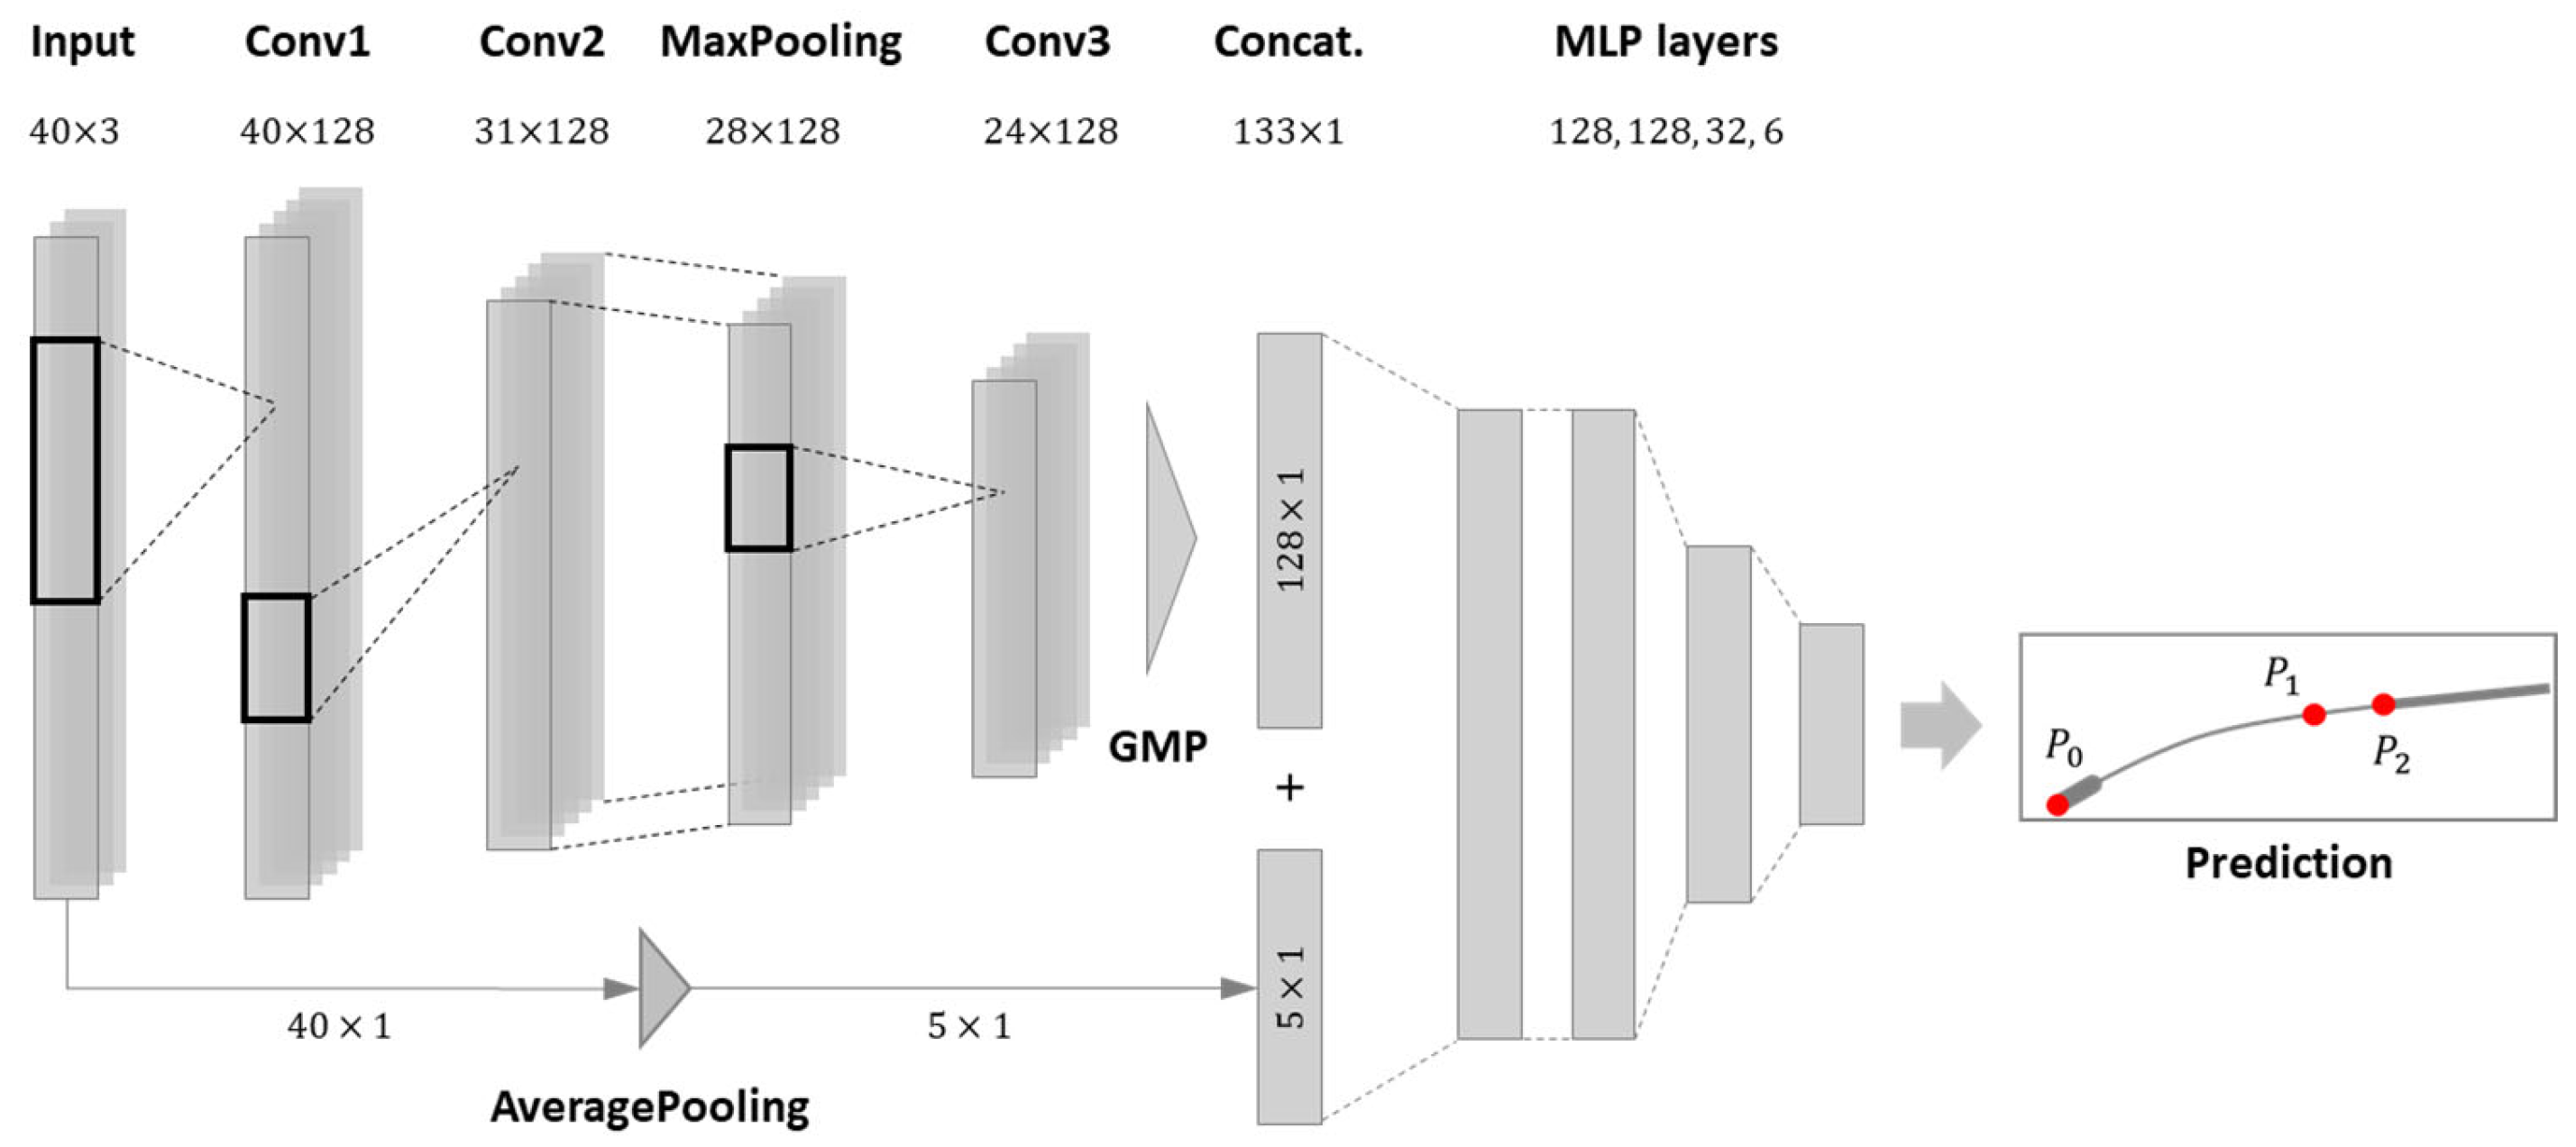
3. Estimation Model for Shape Reconstruction
3.1. Basic Structure of 1DCNN Model
3.2. Training of the Model
4. Experimental Setups and Results
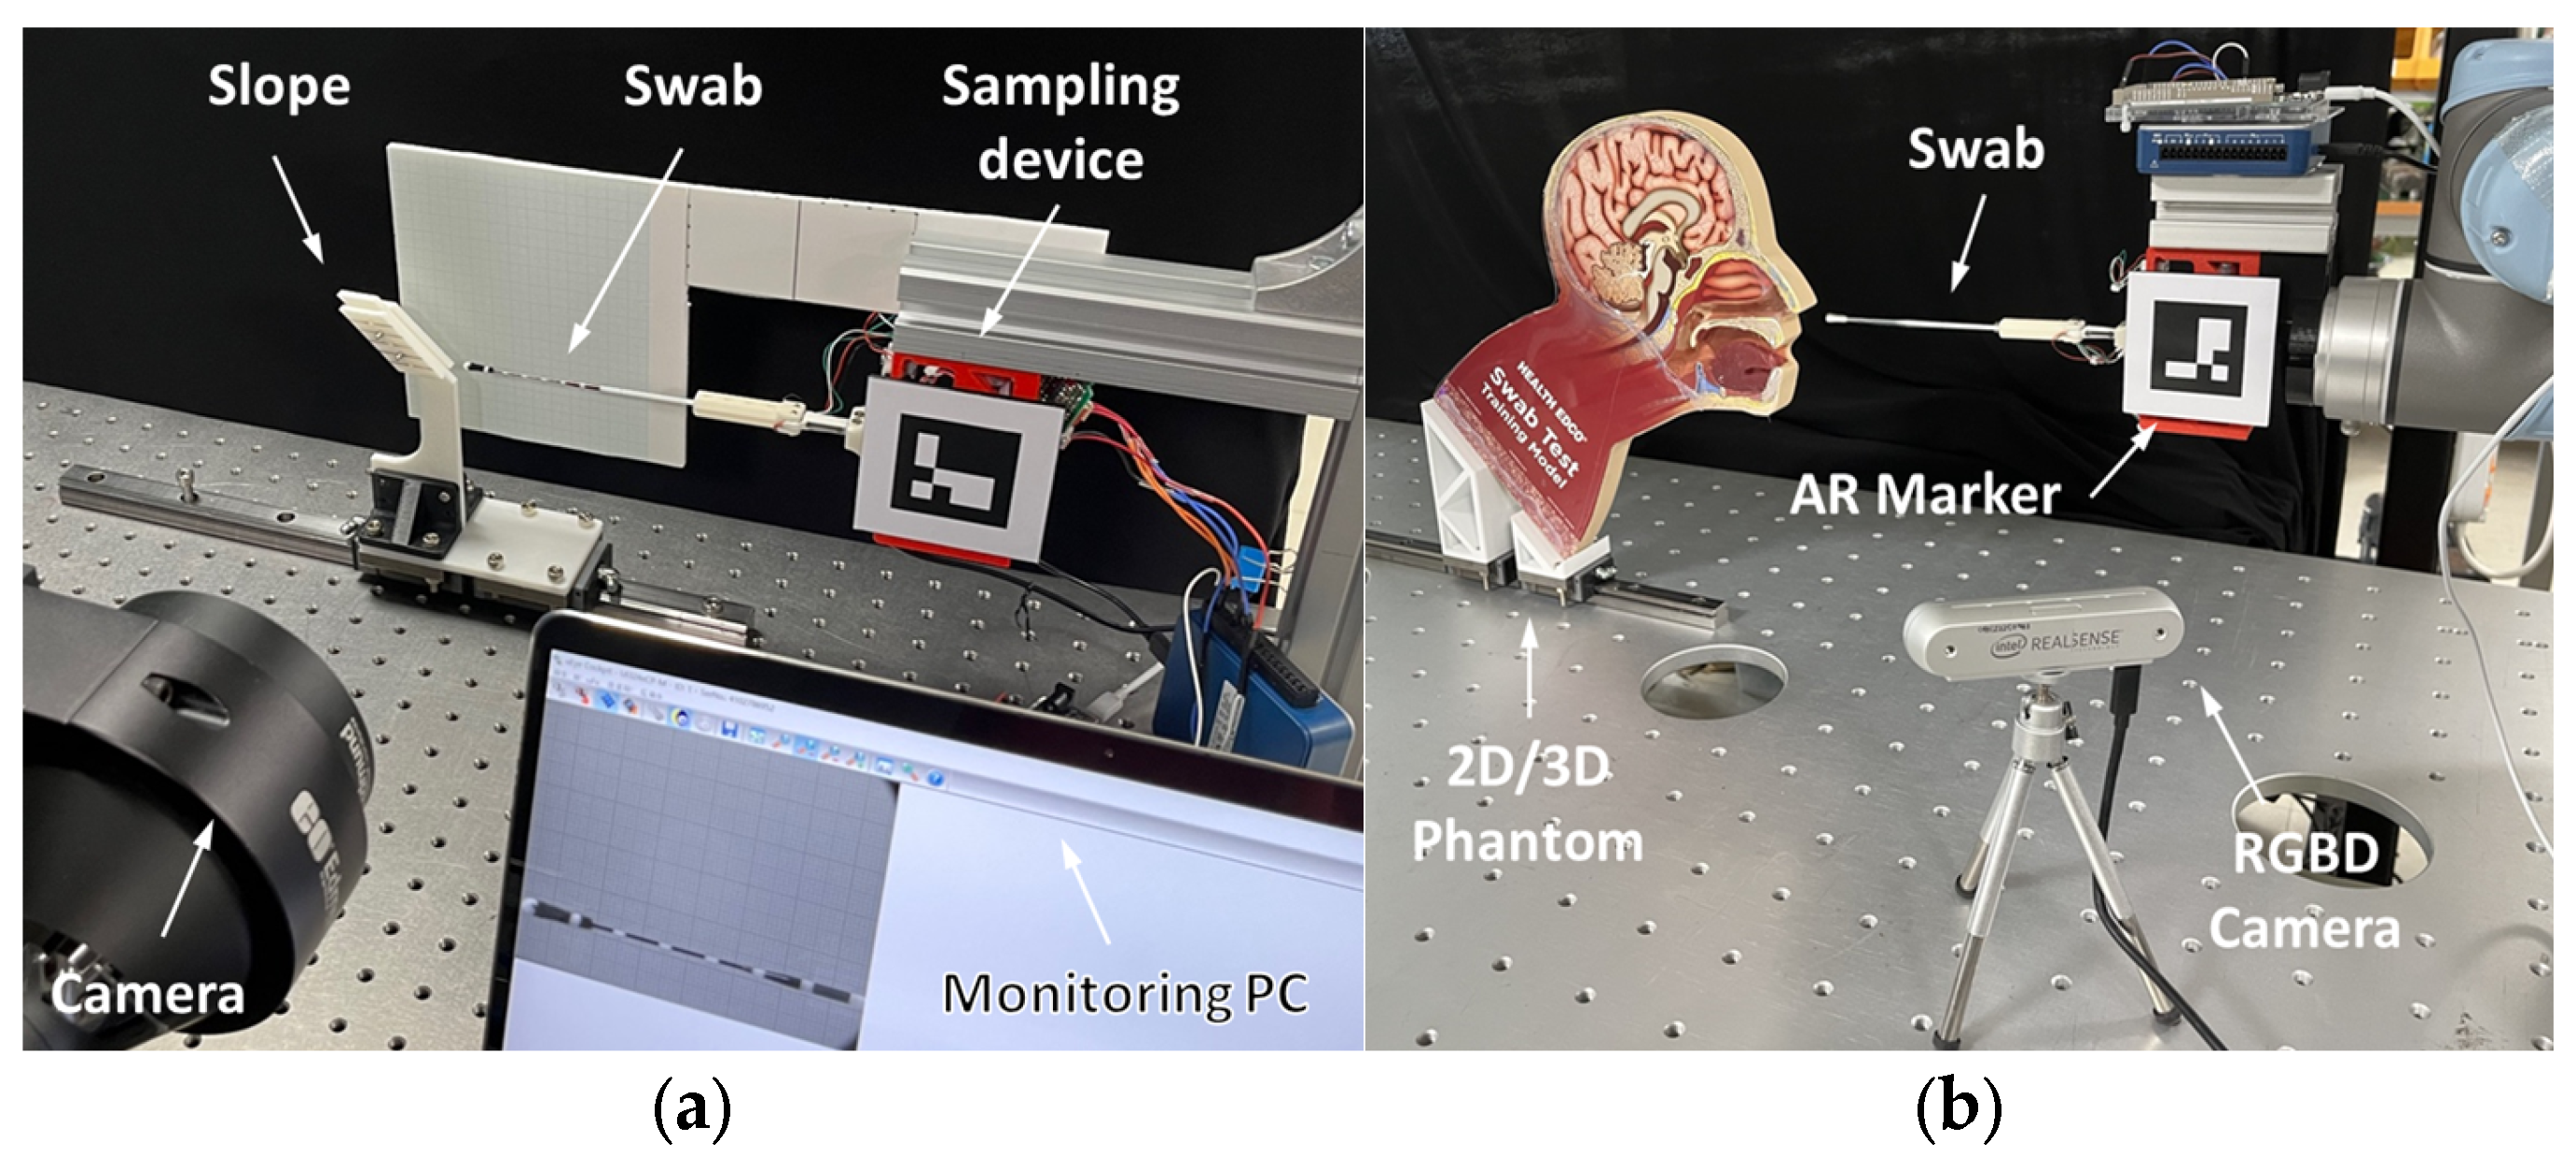
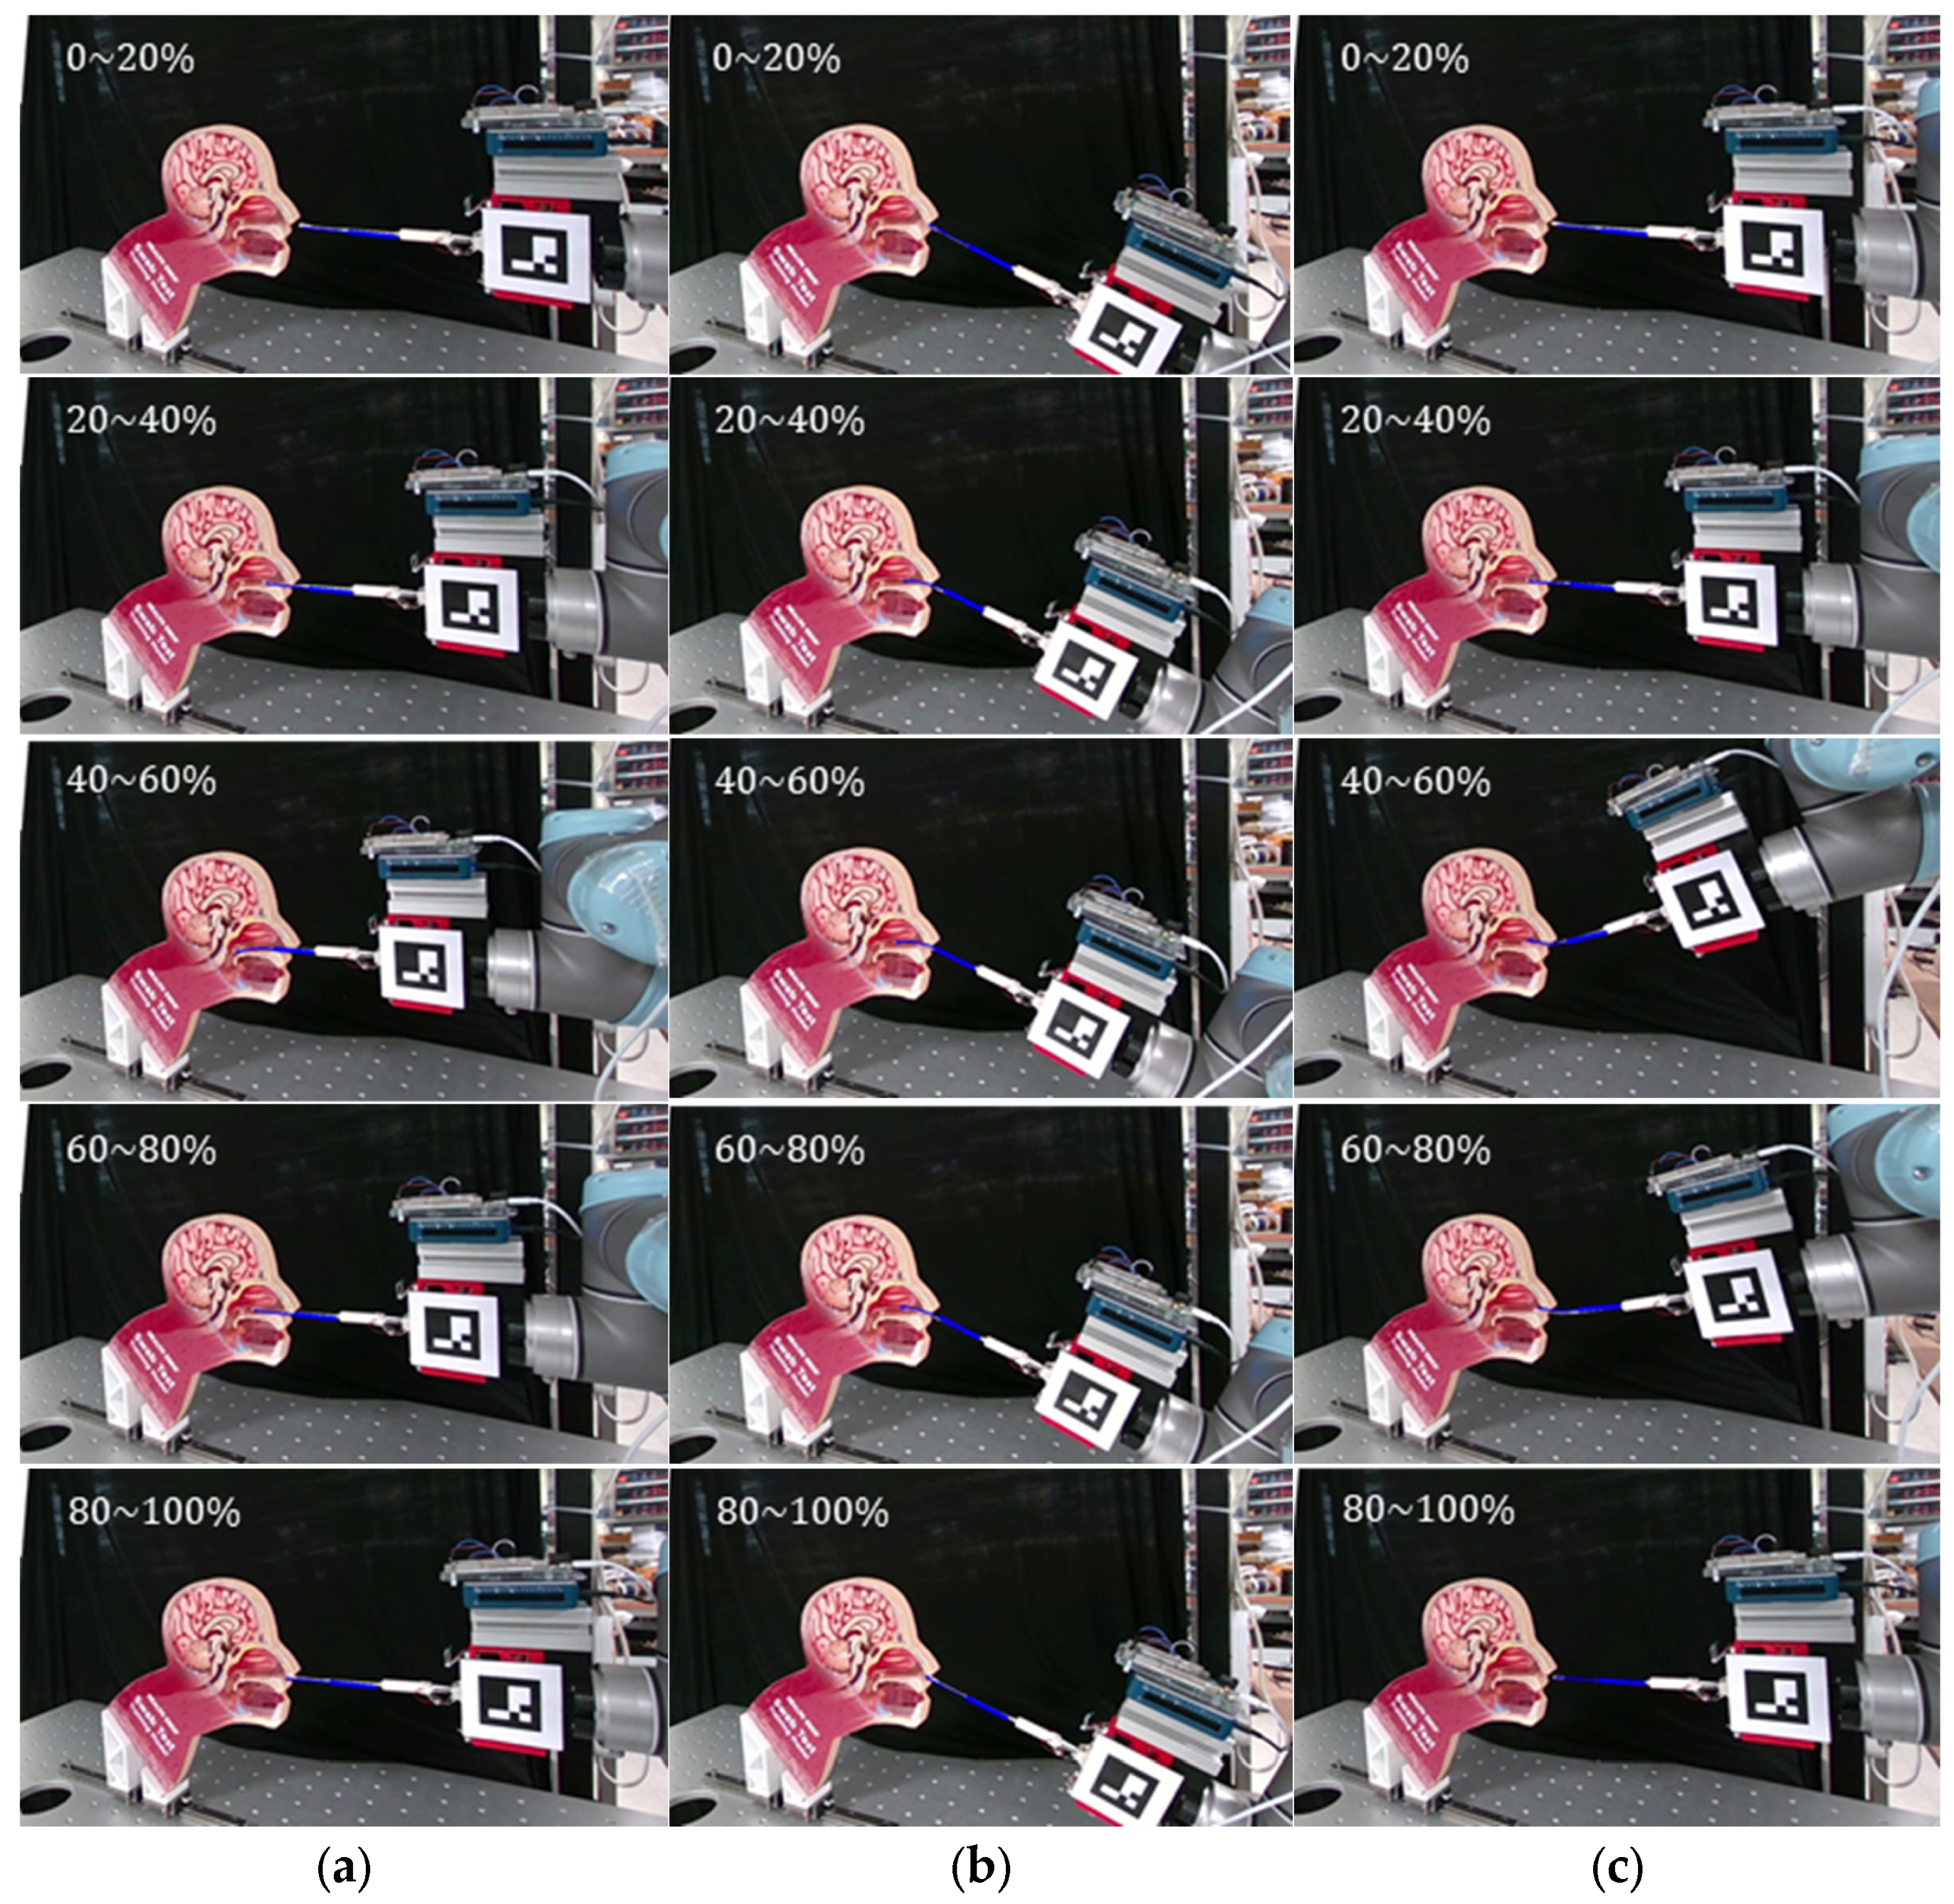
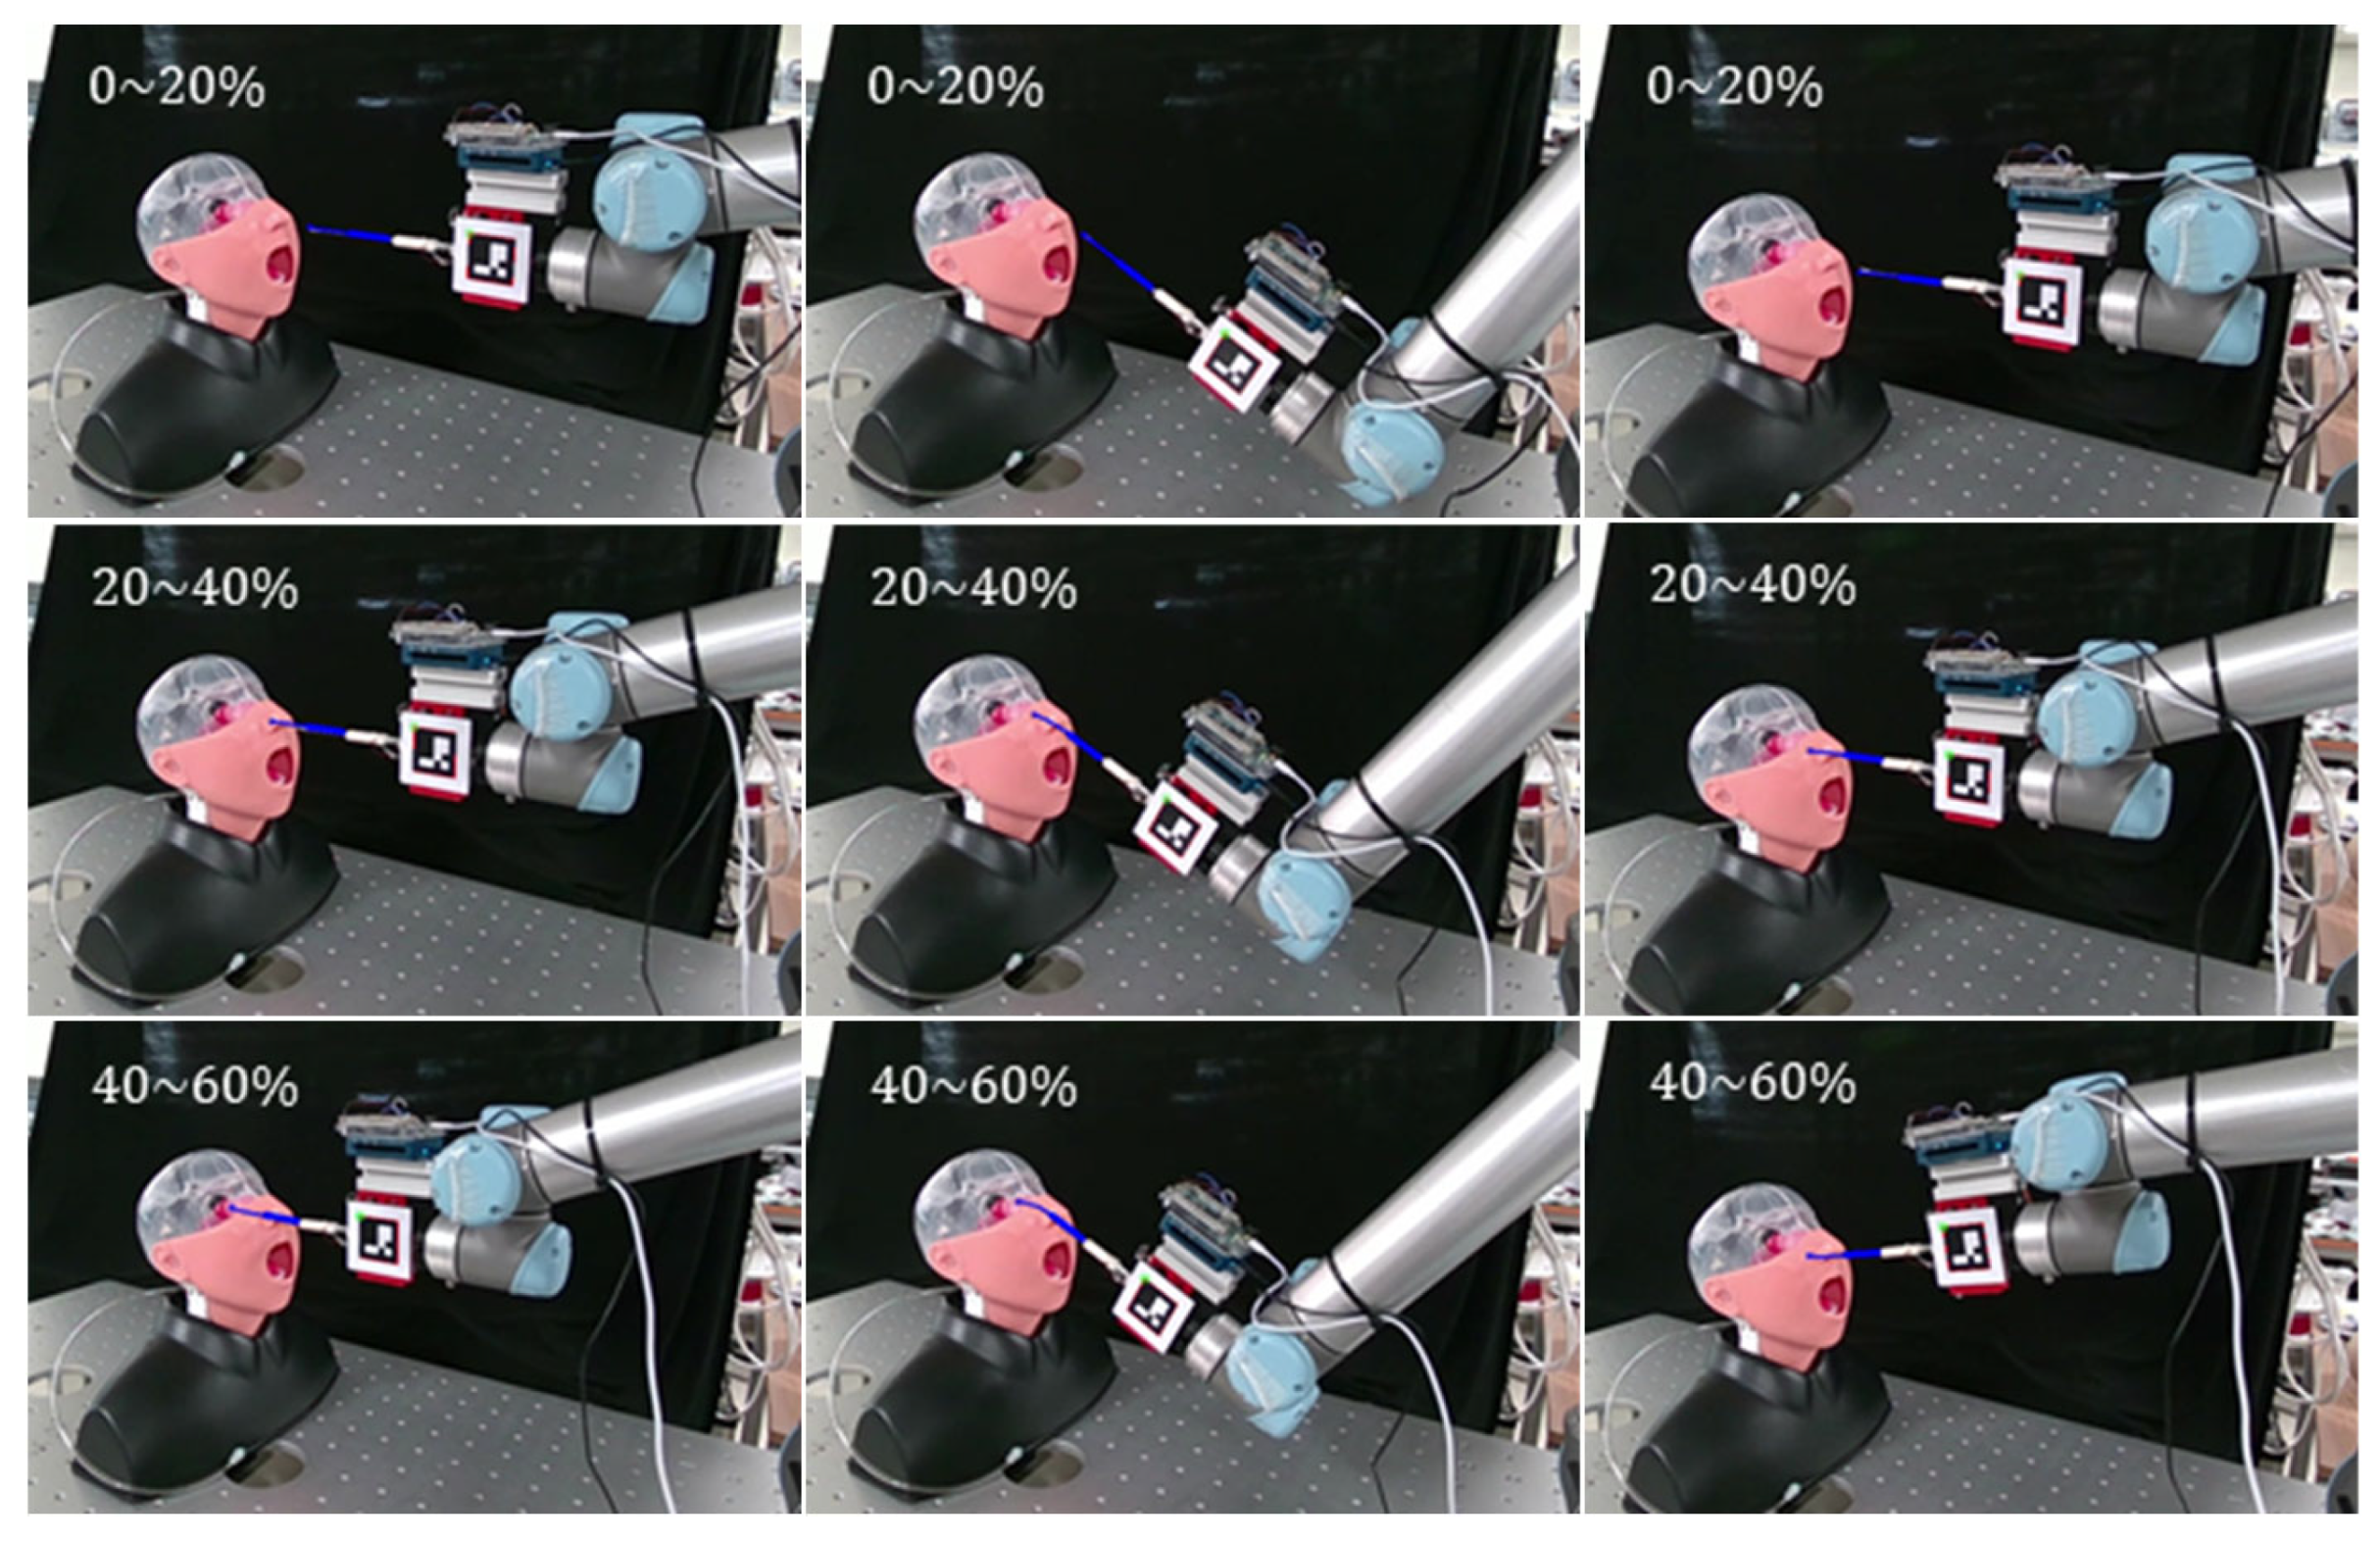
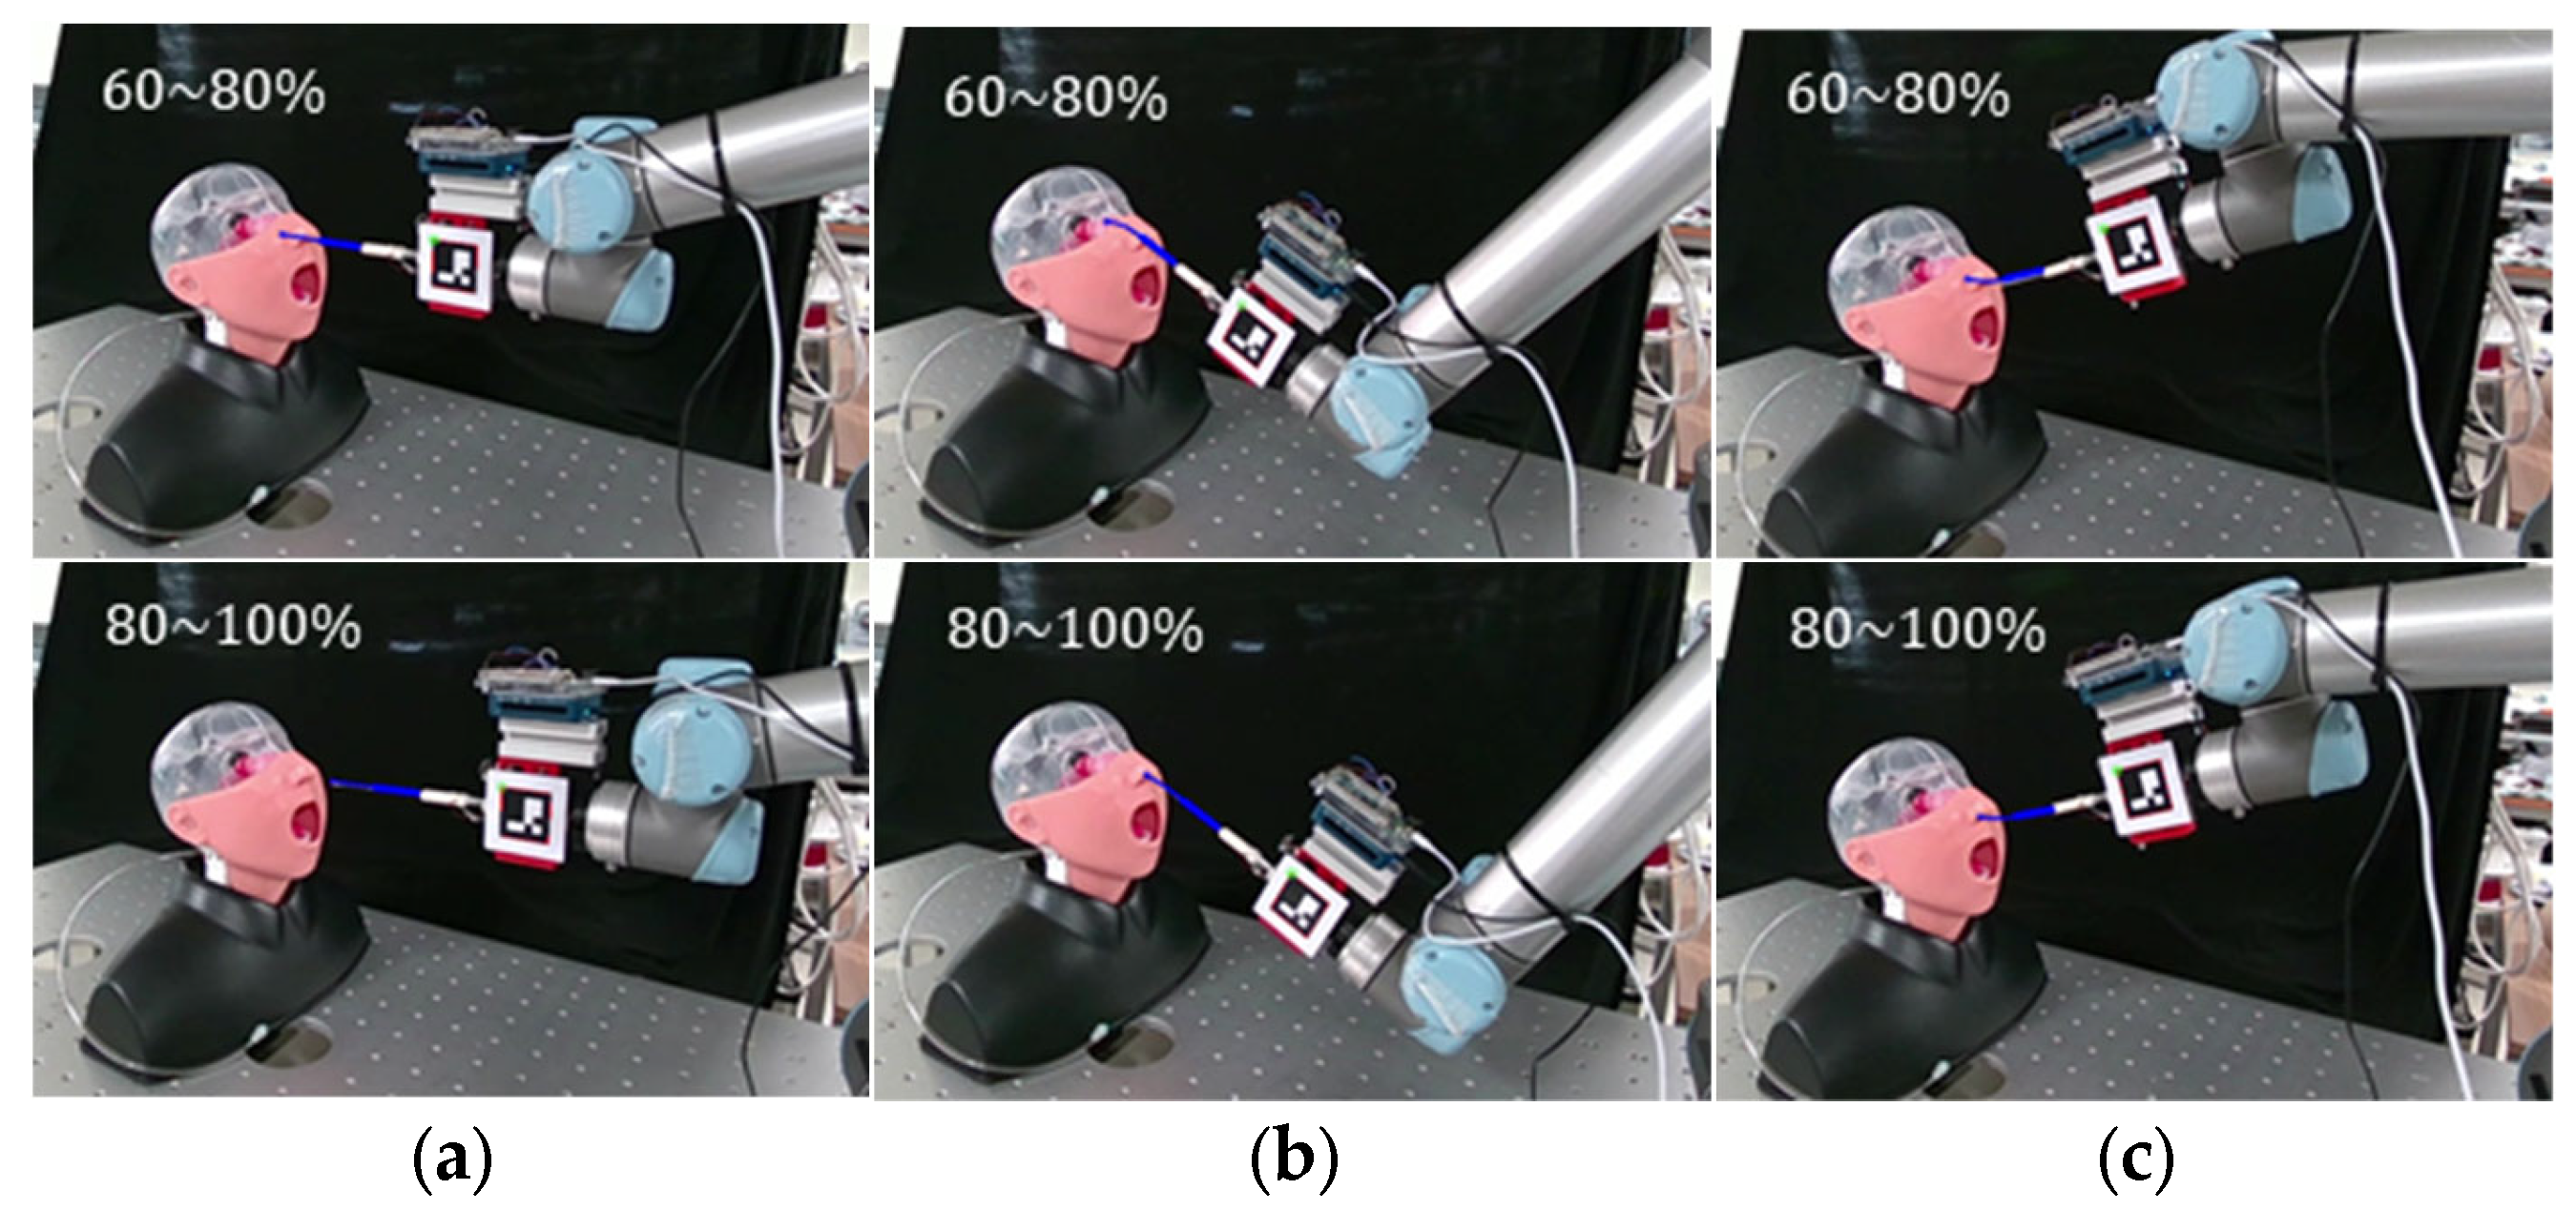
4.1. Experiment with Phantom Models
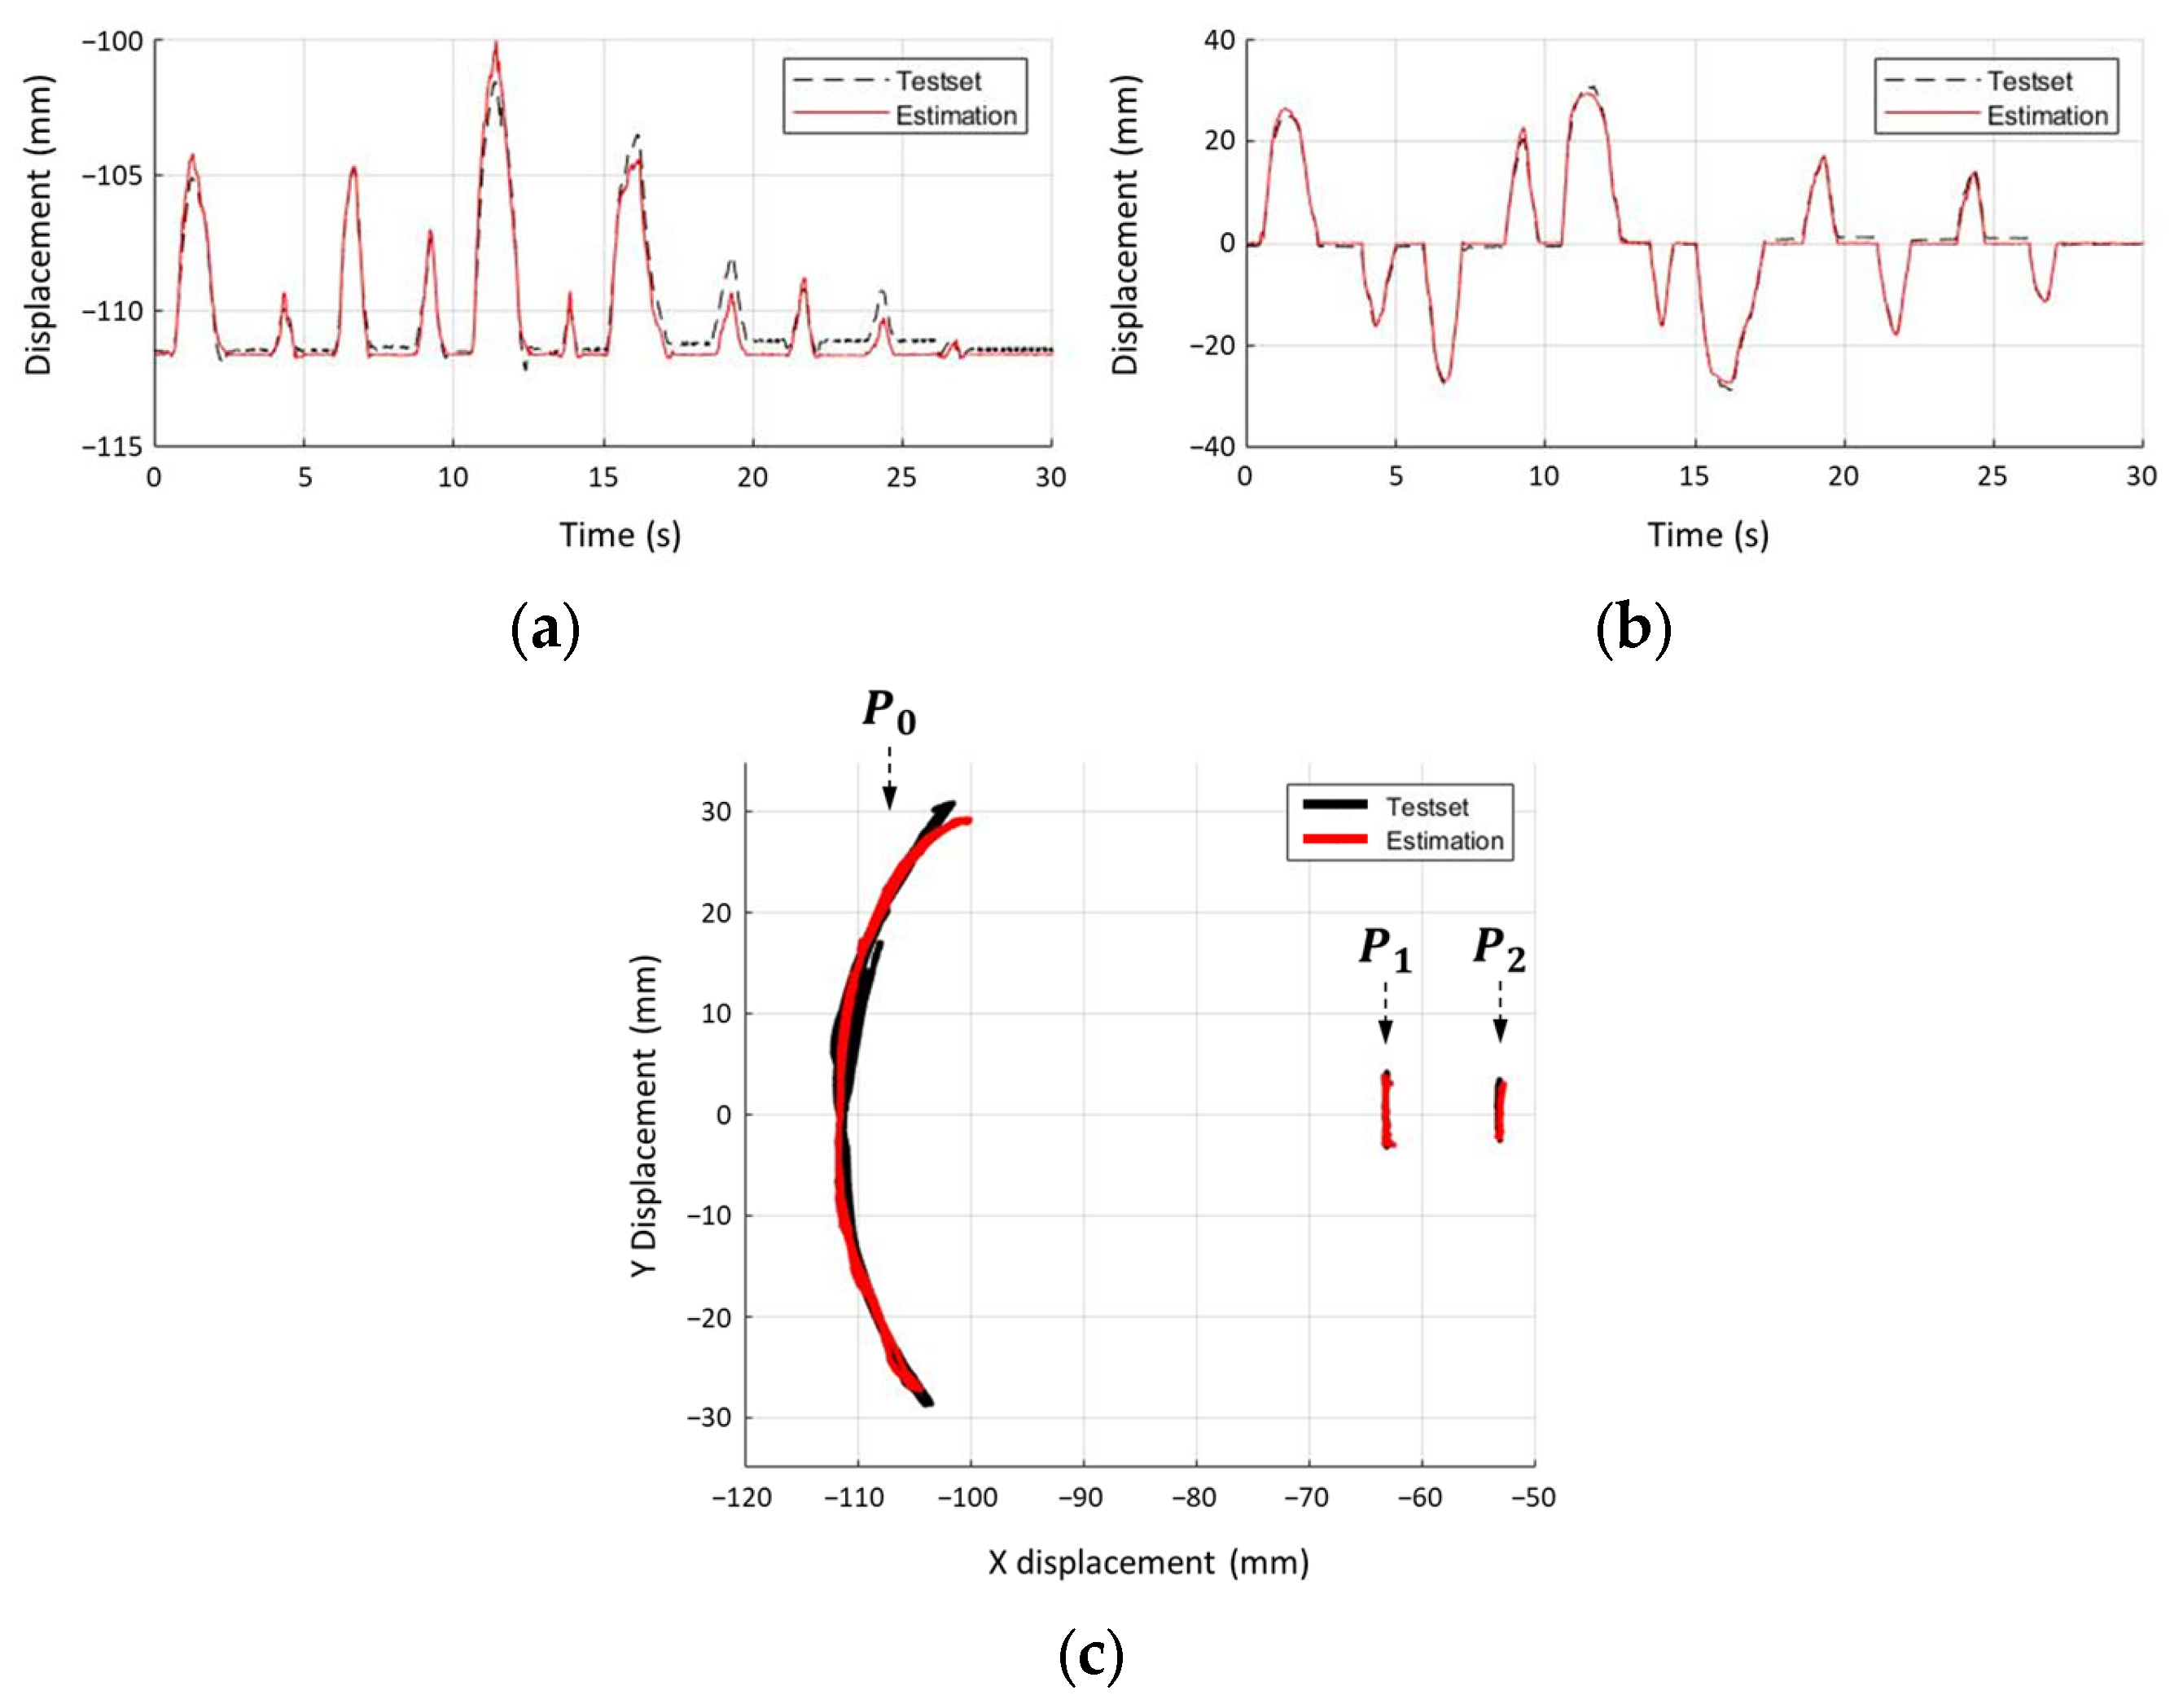
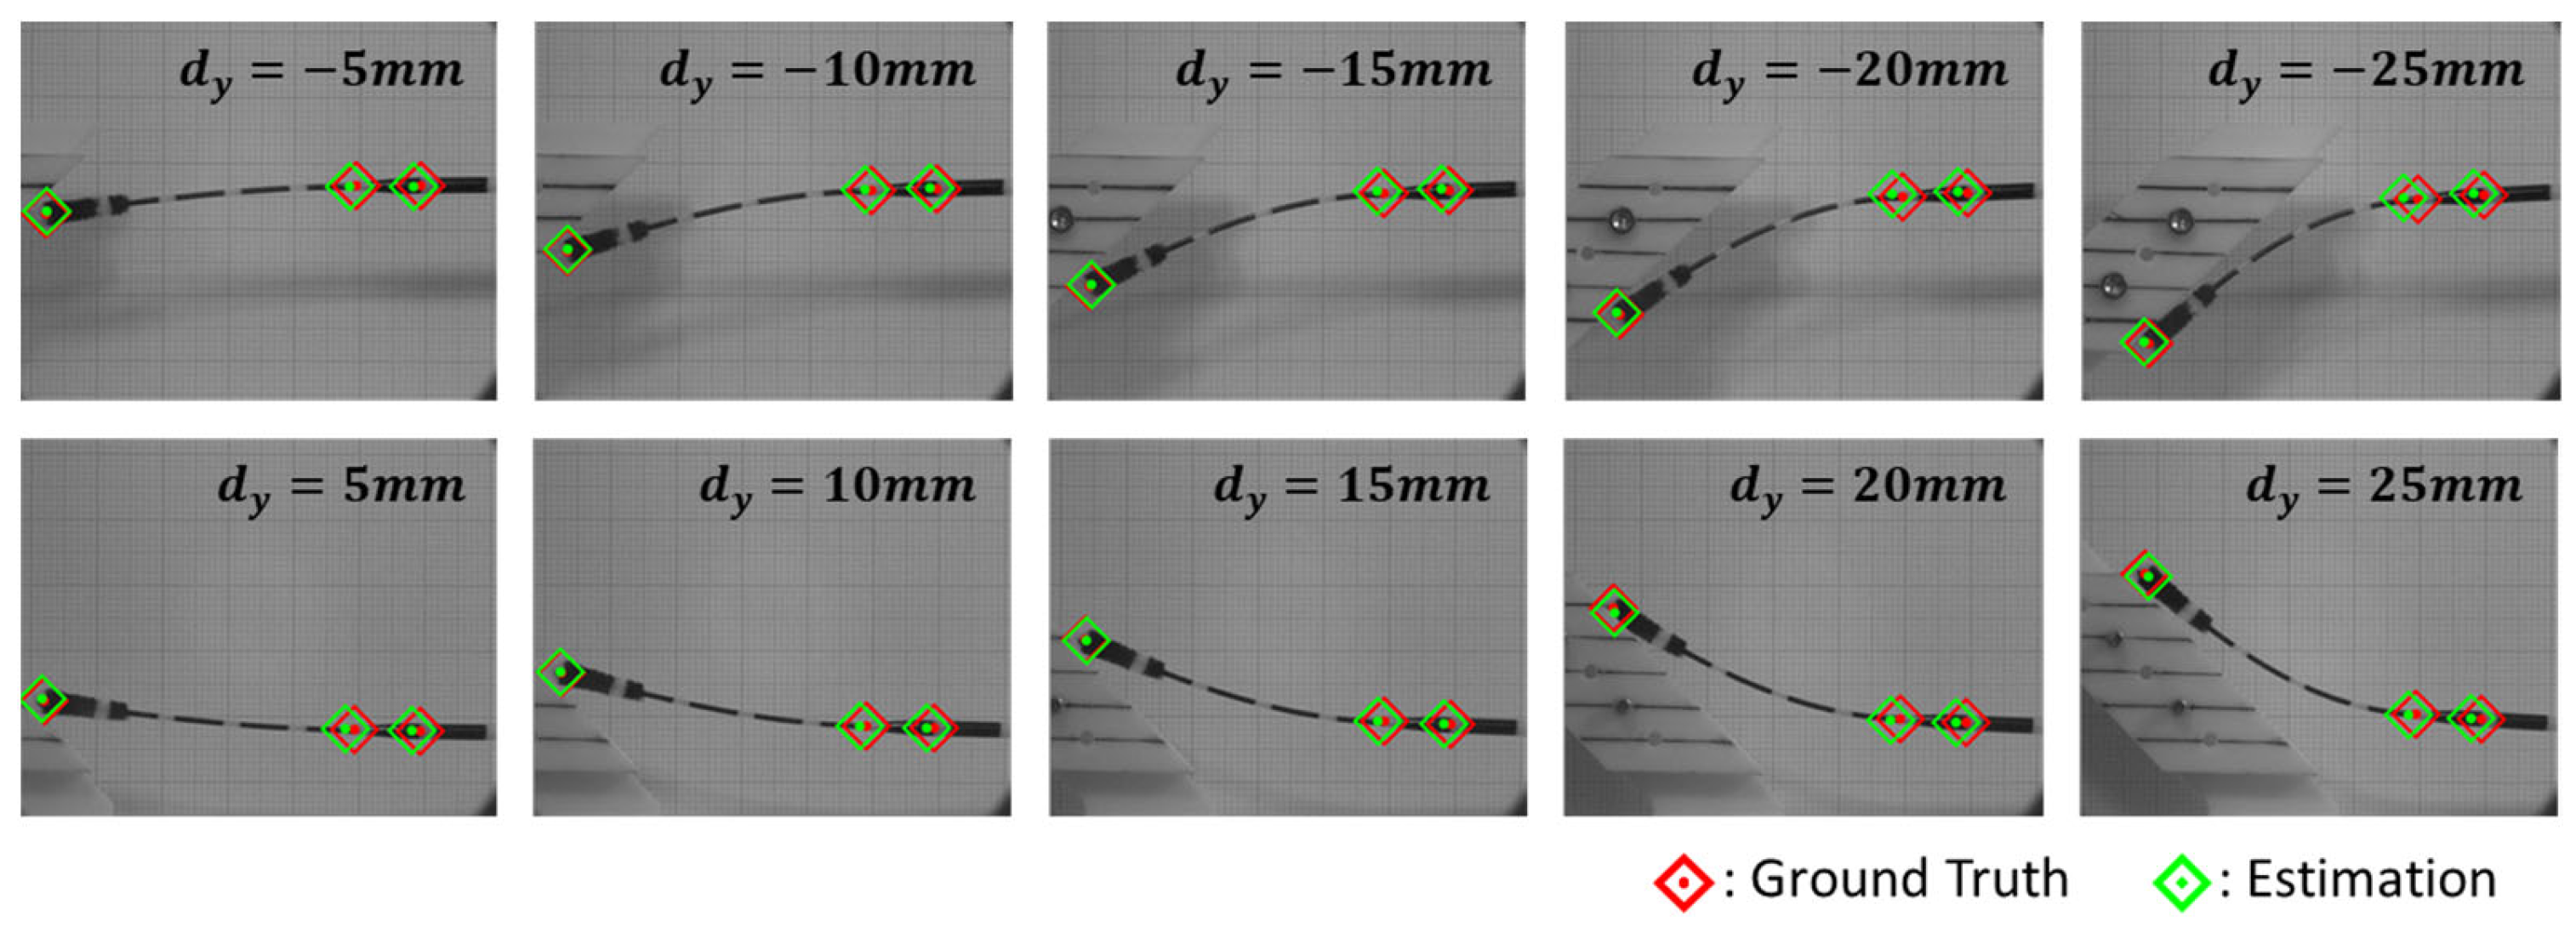
4.2. Validation of Accuracy and Performance of Estimation System
5. Discussion and Conclusions
Author Contributions
Funding
Institutional Review Board Statement
Informed Consent Statement
Data Availability Statement
Conflicts of Interest
Abbreviations
References
- World Health Organization. Critical Preparedness, Readiness and Response Actions for COVID-19: Interim Guidance, 22 March 2020 (No. WHO/2019-nCoV/Community_Actions/2020.3); World Health Organization: Geneva, Switzerland, 2020. [Google Scholar]
- World Health Organization. Laboratory Testing for Coronavirus Disease 2019 (COVID-19) in Suspected Human Cases: Interim Guidance, 2 March 2020 (No. WHO/COVID-19/laboratory/2020.4); World Health Organization: Geneva, Switzerland, 2020. [Google Scholar]
- Lammers, M.J.; Lea, J.; Westerberg, B.D. Guidance for otolaryngology health care workers performing aerosol generating medical procedures during the COVID-19 pandemic. J. Otolaryngol. Head. Neck Surg. 2020, 49, 36. [Google Scholar] [CrossRef]
- Bartoszko, J.J.; Farooqi, M.A.M.; Alhazzani, W.; Loeb, M. Medical masks vs. N95 respirators for preventing COVID-19 in healthcare workers: A systematic review and meta-analysis of randomized trials. Influenza Other Respir. Viruses 2020, 14, 365–373. [Google Scholar] [CrossRef]
- Wang, S.; Wang, K.; Tang, R.; Qiao, J.; Liu, H.; Hou, Z.G. Design of a low-cost miniature robot to assist the COVID-19 na-sopharyngeal swab sampling. IEEE Trans. Med. Robot. Bionics. 2020, 3, 289–293. [Google Scholar] [CrossRef] [PubMed]
- Li, C.; Gu, X.; Xiao, X.; Lim, C.M.; Duan, X.; Ren, H. A flexible transoral robot towards COVID-19 swab sampling. Front. Robot. AI 2021, 8, 612167. [Google Scholar] [CrossRef]
- Maeng, C.Y.; Yoon, J.; Kim, D.Y.; Lee, J.; Kim, Y.J. Development of an inherently safe nasopharyngeal swab sampling robot using a force restriction mechanism. IEEE Robot. Automat. Lett. 2022, 7, 11150–11157. [Google Scholar] [CrossRef]
- Seo, J.; Shim, S.; Park, H.; Baek, J.; Cho, J.H.; Kim, N.H. Development of robot-assisted untact swab sampling system for upper respiratory disease. Appl. Sci. 2020, 10, 7707. [Google Scholar] [CrossRef]
- Chen, W.; Zhou, J.; Cheng, S.S.; Lu, Y.; Zhong, F.; Gao, Y.; Wang, Y.; Xue, L.; Tong, M.C.; Liu, Y.H. Tele-Operated Oropharyngeal Swab (TOOS) Robot Enabled by TSS Soft Hand for Safe and EffectiveCOVID-19 OP Sampling. arXiv 2021, arXiv:2109.09403. [Google Scholar] [CrossRef]
- Chen, Y.; Wang, Q.; Chi, C.; Wang, C.; Gao, Q.; Zhang, H.; Li, Z.; Mu, Z.; Xu, R.; Sun, Z.; et al. A collaborative robot for COVID-19 oropharyngeal swabbing. Robot. Auton. Syst. 2022, 148, 103917. [Google Scholar] [CrossRef]
- Li, S.Q.; Guo, W.L.; Liu, H.; Wang, T.; Zhou, Y.Y.; Yu, T.; Wang, C.Y.; Yang, Y.M.; Zhong, N.S.; Zhang, N.F.; et al. Clinical application of an intelligent oropharyngeal swab robot: Implication for the COVID-19 pandemic. Eur. Respir. J. 2020, 56, 2001912. [Google Scholar] [CrossRef]
- Hiebert, N.M.; Chen, B.A.; Sowerby, L.J. Variability in instructions for performance of nasopharyngeal swabs across Canada in the era of COVID-19–what type of swab is actually being performed? J. Otolaryngol. Head. Neck Surg. 2021, 50, 5. [Google Scholar] [CrossRef]
- Liu, Y.; Yiu, C.; Song, Z.; Huang, Y.; Yao, K.; Wong, T.; Zhou, J.; Zhao, L.; Huang, X.; Nejad, S.K.; et al. Electronic skin as wireless human-machine interfaces for robotic VR. Sci. Adv. 2022, 8, eabl6700. [Google Scholar] [CrossRef]
- Ku, J.; Chen, C.Y.; Ku, J.; Chang, H.K.; Wu, J.C.; Yen, Y.S. Iatrogenic cerebrospinal fluid leak after repeated nasal swab tests for COVID-19: Illustrative case. J. Neurosurg. Case Lessons 2021, 2. [Google Scholar] [CrossRef] [PubMed]
- Mistry, S.G.; Walker, W.; Earnshaw, J.; Cervin, A. COVID-19 swab-related skull base injury. Med. J. Aust. 2021, 214, 457–459. [Google Scholar] [CrossRef] [PubMed]
- Lu, S.; Liu, M.; Yin, L.; Yin, Z.; Liu, X.; Zheng, W. The multi-modal fusion in visual question answering: A review of attention mechanisms. PeerJ Comput. Sci. 2023, 9, e1400. [Google Scholar] [CrossRef] [PubMed]
- Zhang, X.; Zhang, F.; Xu, C. Reducing Vision-Answer biases for Multiple-choice VQA. IEEE Trans. Image Process. 2023, 32, 4621–4634. [Google Scholar] [CrossRef]
- Hu, M.; Zhong, Y.; Xie, S.; Lv, H.; Lv, Z. Fuzzy system based medical image processing for brain disease prediction. Front. Neurosci. 2021, 15, 714318. [Google Scholar] [CrossRef]
- Kleesiek, J.; Urban, G.; Hubert, A.; Schwarz, D.; Maier-Hein, K.; Bendszus, M.; Biller, A. Deep MRI brain extraction: A 3D convolutional neural network for skull stripping. NeuroImage 2016, 129, 460–469. [Google Scholar] [CrossRef]
- Azizi, S.; Mustafa, B.; Ryan, F.; Beaver, Z.; Freyberg, J.; Deaton, J.; Loh, A.; Karthikesalingam, A.; Kornblith, S.; Chen, T.; et al. Big self-supervised models advance medical image classification. In Proceedings of the IEEE/CVF International Conference on Computer Vision, Montreal, QC, Canada, 10–17 October 2021; pp. 3478–3488. [Google Scholar] [CrossRef]
- Cao, H.; Wang, Y.; Chen, J.; Jiang, D.; Zhang, X.; Tian, Q.; Wang, M. SwinUnet: Unet-like pure transformer for medical image segmentation. arXiv 2021, arXiv:2105.05537. [Google Scholar]
- Hou, Y.; Ma, L.; Zhu, R.; Chen, X.; Zhang, J. A low-cost iPhone-assisted augmented reality solution for the localization of intracranial lesions. PLoS ONE 2016, 11, e0159185. [Google Scholar] [CrossRef]
- Spijkerboer, K.G.; Fitski, M.; Siepel, F.J.; van de Ven, C.P.; van der Steeg, A.F. Augmented reality-guided localization of a chest wall tumor in a pediatric patient. Eur. J. Can. 2022, 170, 103–105. [Google Scholar] [CrossRef]
- Park, B.J.; Hunt, S.J.; Nadolski, G.J.; Gade, T.P. Augmented reality improves procedural efficiency and reduces radiation dose for CT-guided lesion targeting: A phantom study using HoloLens 2. Sci. Rep. 2020, 10, 18620. [Google Scholar] [CrossRef]
- Uppot, R.N.; Laguna, B.; McCarthy, C.J.; De Novi, G.; Phelps, A.; Siegel, E.; Courtier, J. Implementing virtual and augmented reality tools for radiology education and training, communication, and clinical care. Radiology 2019, 291, 570–580. [Google Scholar] [CrossRef]
- Lee, K. Large deflections of cantilever beams of non-linear elastic material under a combined loading. Int. J. Non-Linear Mech. 2002, 37, 439–443. [Google Scholar] [CrossRef]
- Chen, L. An integral approach for large deflection cantilever beams. Int. J. Non-Linear Mech. 2010, 45, 301–305. [Google Scholar] [CrossRef]
- Islam, M.Z.; Islam, M.M.; Asraf, A. A combined deep CNN-LSTM network for the detection of novel coronavirus (COVID-19) using X-ray images. Inform. Med. Unlocked 2020, 20, 100412. [Google Scholar] [CrossRef]
- Zou, S.; Lyu, Y.; Qi, J.; Ma, G.; Guo, Y. A deep neural network approach for accurate 3D shape estimation of soft manipulator with vision correction. Sensor Actuat. Phys. 2022, 344, 113692. [Google Scholar] [CrossRef]
- Li, X.; Tiong, A.M.H.; Cao, L.; Lai, W.; Phan, P.T.; Phee, S.J. Deep learning for haptic feedback of flexible endoscopic robot without prior knowledge on sheath configuration. Int. J. Mech. Sci. 2019, 163, 105129. [Google Scholar] [CrossRef]
- Su, H.; Mariani, A.; Ovur, S.E.; Menciassi, A.; Ferrigno, G.; De Momi, E. Toward teaching by demonstration for robot-assisted minimally invasive surgery. IEEE Trans. Automat. Sci. Eng. 2021, 18, 484–494. [Google Scholar] [CrossRef]
- Kiranyaz, S.; Avci, O.; Abdeljaber, O.; Ince, T.; Gabbouj, M.; Inman, D.J. 1D convolutional neural networks and applications: A survey. Mech. Syst. Signal Process. 2021, 151, 107398. [Google Scholar] [CrossRef]
- Farhani, G.; Zhou, Y.; Danielson, P.; Trejos, A.L. Implementing machine learning algorithms to classify postures and forecast motions when using a dynamic chair. Sensors 2022, 22, 400. [Google Scholar] [CrossRef]
- Roh, J.; Park, H.J.; Lee, K.J.; Hyeong, J.; Kim, S.; Lee, B. Sitting posture monitoring system based on a low-cost load cell using machine learning. Sensors 2018, 18, 208. [Google Scholar] [CrossRef] [PubMed]


| Mean of Error (mm) | Standard Deviation (mm) | |||||||||||
|---|---|---|---|---|---|---|---|---|---|---|---|---|
| y Diff (mm) | ||||||||||||
| 25 | 0.522 | −0.410 | −1.191 | −0.046 | −1.506 | 0.064 | 0.164 | 0.334 | 0.035 | 0.056 | 0.015 | 0.036 |
| 20 | 0.202 | −0.728 | −1.435 | −0.101 | −1.646 | 0.007 | 0.086 | 0.155 | 0.019 | 0.028 | 0.014 | 0.038 |
| 15 | 0.198 | −0.251 | −1.269 | 0.024 | −1.397 | 0.106 | 0.064 | 0.363 | 0.015 | 0.042 | 0.012 | 0.040 |
| 10 | −0.125 | 0.236 | −1.331 | −0.059 | −1.405 | −0.036 | 0.055 | 0.111 | 0.017 | 0.032 | 0.008 | 0.031 |
| 5 | −0.313 | 0.303 | −1.350 | −0.065 | −1.391 | −0.009 | 0.046 | 0.069 | 0.024 | 0.034 | 0.021 | 0.038 |
| −5 | 0.066 | 0.473 | −1.356 | 0.187 | −1.550 | 0.151 | 0.109 | 0.233 | 0.032 | 0.043 | 0.010 | 0.028 |
| −10 | 0.054 | 1.289 | −1.406 | 0.200 | −1.585 | 0.170 | 0.041 | 0.169 | 0.017 | 0.026 | 0.010 | 0.020 |
| −15 | −0.244 | 2.610 | −1.456 | 0.363 | −1.666 | 0.339 | 0.150 | 0.269 | 0.014 | 0.050 | 0.013 | 0.038 |
| −20 | −0.519 | 3.180 | −1.552 | 0.408 | −1.415 | 0.238 | 0.092 | 0.178 | 0.010 | 0.029 | 0.014 | 0.039 |
| −25 | −0.590 | 2.451 | −1.821 | 0.250 | −1.341 | 0.142 | 0.256 | 0.327 | 0.186 | 0.116 | 0.034 | 0.101 |
Disclaimer/Publisher’s Note: The statements, opinions and data contained in all publications are solely those of the individual author(s) and contributor(s) and not of MDPI and/or the editor(s). MDPI and/or the editor(s) disclaim responsibility for any injury to people or property resulting from any ideas, methods, instructions or products referred to in the content. |
© 2023 by the authors. Licensee MDPI, Basel, Switzerland. This article is an open access article distributed under the terms and conditions of the Creative Commons Attribution (CC BY) license (https://creativecommons.org/licenses/by/4.0/).
Share and Cite
Jung, S.; Moon, Y.; Kim, J.; Kim, K. Deep Neural Network-Based Visual Feedback System for Nasopharyngeal Swab Sampling. Sensors 2023, 23, 8443. https://doi.org/10.3390/s23208443
Jung S, Moon Y, Kim J, Kim K. Deep Neural Network-Based Visual Feedback System for Nasopharyngeal Swab Sampling. Sensors. 2023; 23(20):8443. https://doi.org/10.3390/s23208443
Chicago/Turabian StyleJung, Suhun, Yonghwan Moon, Jeongryul Kim, and Keri Kim. 2023. "Deep Neural Network-Based Visual Feedback System for Nasopharyngeal Swab Sampling" Sensors 23, no. 20: 8443. https://doi.org/10.3390/s23208443