
Objective Measurement of Subjective Pain Perception with Autonomic Body Reactions in Healthy Subjects and Chronic Back Pain Patients: An Experimental Heat Pain Study
 , , , , and
Abstract
:1. Introduction
2. Materials and Methods
2.1. Study Design and General Information
2.2. Participants
2.3. Outcome Measures
2.4. Study Procedure
2.5. Machine Learning Analyses
2.5.1. Segmentation
2.5.2. Feature Extraction
2.5.3. Classification and Evaluation
3. Results
3.1. Characteristics of Participants
3.2. Machine Learning
3.3. Autonomic Responses and Heat Pain Intensities
4. Discussion
Limitations
5. Conclusions
Author Contributions
Funding
Institutional Review Board Statement
Informed Consent Statement
Data Availability Statement
Acknowledgments
Conflicts of Interest
Abbreviations
| ANS | Autonomic Nervous System |
| BVDB | BioVid Heat Pain Database |
| BVP | Blood Volume Pulse |
| CBPPs | Chronic Back Pain Patients |
| CoVAS | Computerized Visual Analogue Scale |
| CV | Cross-Validation |
| DL | Deep Learning |
| DT | Decision Tree |
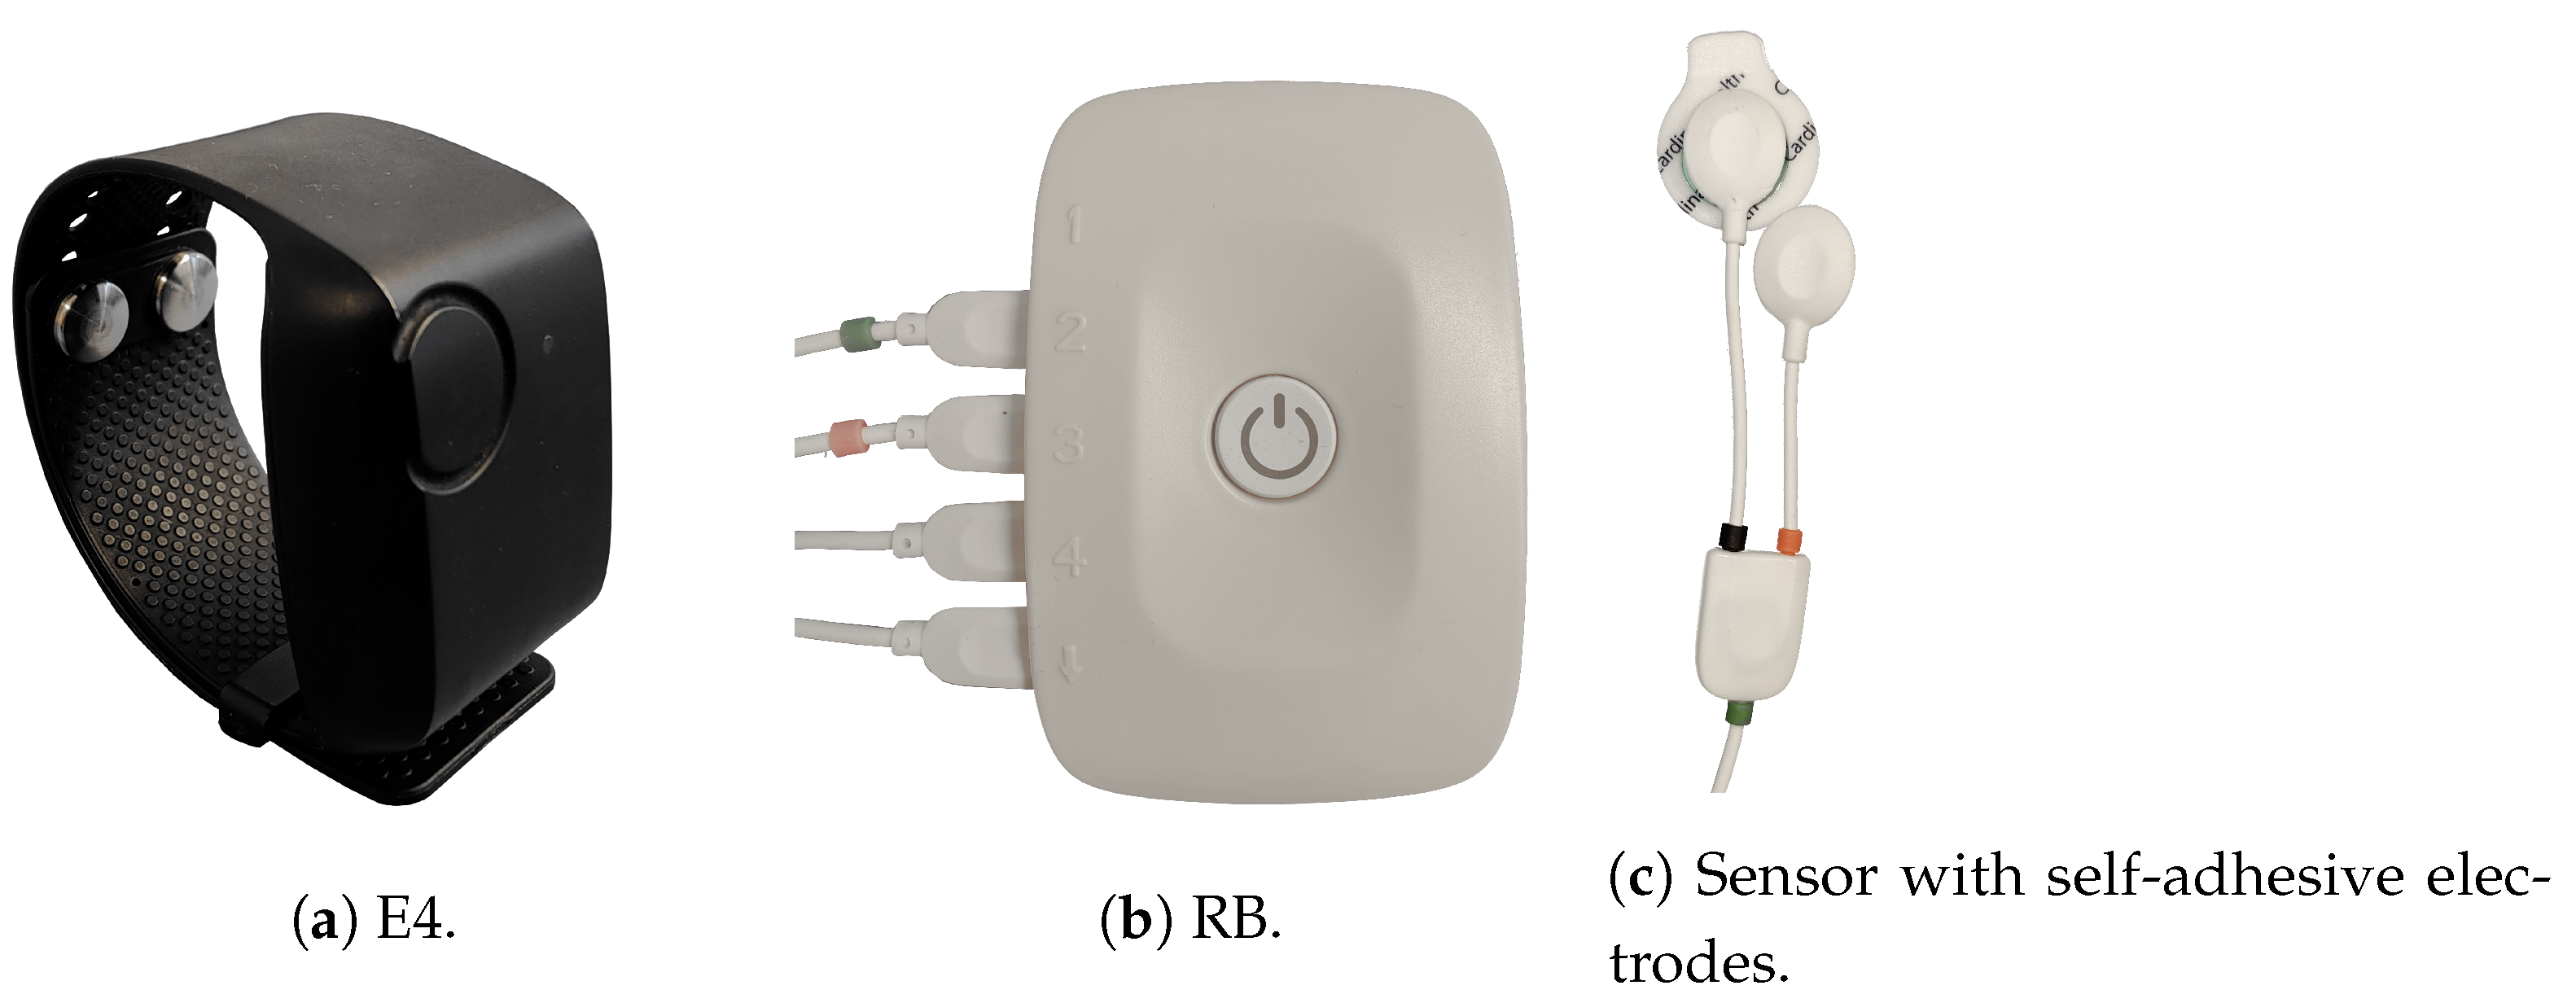
| E4 | Empatica E4 |
| ECG | Electrocardiogram |
| EDA | Electrodermal Activity |
| EEG | Electroencephalography |
| EMG | Electromyogram |
| EOG | Electrooculogram |
| GSR | Galvanic Skin Response |
| HCF | Hand-Crafted Features |
| HR | Heart Rate |
| HRV | Heart Rate Variability |
| HSs | Healthy Subjects |
| IASP | International Association for the Study of Pain |
| IBI | Inter-Beats Interval |
| LOSO | Leave-One-Subject-Out |
| LR | Linear Regression |
| LSTM | Long Short-Term Memory |
| ML | Machine Learning |
| MLP | Multi-Layer Perceptron |
| MSE | Mean Squared Error |
| NCS | Nociception Coma Scale |
| NN | Neural Network |
| NRS | Numerical Rating Scale |
| PMDB | PainMonit Database |
| PCS | Pain Catastrophizing Scale |
| PET | Position Emission Tomography |
| PHQ-9 | Pain Health Questionnaire |
| PPG | Photoplethysmography |
| PT | Pain Tolerance |
| PTT | Pain Tolerance Threshold |
| PVAQ | Pain Vigilance Awareness Questionnaire |
| RB | respiBAN Professional |
| RF | Random Forest |
| RFE | Recursive Feature Elimination |
| RMS | Root Mean Square |
| RMSE | Root Mean Square Error |
| RMSSD | Root Mean Square of the Successive Differences |
| SC | Skin Conductance |
| SCL | Skin Conductance Level |
| SCR | Skin Conductance Response |
| SDNN | Standard deviations of the IBIs |
| sEMG | surface Electromyogram |
| SVM | Support Vector Machine |
| VAR | Variance |
| VAS | Visual Analogue Scale |
References
- Moseley, G.; Butler, D.; Butler, D. Explain Pain Supercharged: The Clinician’s Manual; The Clinician’s Handbook; Noigroup Publications: New York, NY, USA, 2017. [Google Scholar]
- Raja, S.N.; Carr, D.B.; Cohen, M.; Finnerup, N.B.; Flor, H.; Gibson, S.; Keefe, F.; Mogil, J.S.; Ringkamp, M.; Sluka, K.A.; et al. The revised IASP definition of pain: Concepts, challenges, and compromises. Pain 2020, 161, 1976. [Google Scholar] [CrossRef] [PubMed]
- Benarroch, E. Pain-autonomic interactions. Neurol. Sci. 2006, 27, s130–s133. [Google Scholar] [CrossRef] [PubMed]
- Loggia, M.L.; Juneau, M.; Bushnell, M.C. Autonomic responses to heat pain: Heart rate, skin conductance, and their relation to verbal ratings and stimulus intensity. Pain 2011, 152, 592–598. [Google Scholar] [CrossRef]
- Karemaker, J.M. An introduction into autonomic nervous function. Physiol. Meas. 2017, 38, R89. [Google Scholar] [CrossRef] [PubMed]
- Hohenschurz-Schmidt, D.J.; Calcagnini, G.; Dipasquale, O.; Jackson, J.B.; Medina, S.; O’Daly, O.; O’Muircheartaigh, J.; de Lara Rubio, A.; Williams, S.C.; McMahon, S.B.; et al. Linking pain sensation to the autonomic nervous system: The role of the anterior cingulate and periaqueductal gray resting-state networks. Front. Neurosci. 2020, 14, 147. [Google Scholar] [CrossRef]
- Tracey, I.; Woolf, C.J.; Andrews, N.A. Composite pain biomarker signatures for objective assessment and effective treatment. Neuron 2019, 101, 783–800. [Google Scholar] [CrossRef]
- Kyle, B.N.; McNeil, D.W. Autonomic arousal and experimentally induced pain: A critical review of the literature. Pain Res. Manag. 2014, 19, 159–167. [Google Scholar] [CrossRef]
- Koenig, J.; Jarczok, M.; Ellis, R.; Hillecke, T.; Thayer, J.F. Heart rate variability and experimentally induced pain in healthy adults: A systematic review. Eur. J. Pain 2014, 18, 301–314. [Google Scholar] [CrossRef]
- Jafari, H.; Courtois, I.; Van den Bergh, O.; Vlaeyen, J.W.; Van Diest, I. Pain and respiration: A systematic review. Pain 2017, 158, 995–1006. [Google Scholar] [CrossRef]
- Hu, J.; Harrison, D.; Harrold, J.; Squires, J.; Modanloo, S. Validating skin conductance for measuring acute pain in mechanically ventilated infants. J. Pain 2021, 22, 607. [Google Scholar] [CrossRef]
- Ledowski, T.; Bromilow, J.; Wu, J.; Paech, M.; Storm, H.; Schug, S. The assessment of postoperative pain by monitoring skin conductance: Results of a prospective study. Anaesthesia 2007, 62, 989–993. [Google Scholar] [CrossRef] [PubMed]
- Storm, H. Changes in skin conductance as a tool to monitor nociceptive stimulation and pain. Curr. Opin. Anesthesiol. 2008, 21, 796–804. [Google Scholar] [CrossRef] [PubMed]
- Schlereth, T.; Birklein, F. The sympathetic nervous system and pain. Neuromolecular Med. 2008, 10, 141–147. [Google Scholar] [CrossRef]
- Nahman-Averbuch, H.; Coghill, R.C. Pain-autonomic relationships: Implications for experimental design and the search for an “objective marker” for pain. Pain 2017, 158, 2064–2065. [Google Scholar] [CrossRef] [PubMed]
- Hawker, G.A.; Mian, S.; Kendzerska, T.; French, M. Measures of adult pain: Visual analog scale for pain (vas pain), numeric rating scale for pain (nrs pain), mcgill pain questionnaire (mpq), short-form mcgill pain questionnaire (sf-mpq), chronic pain grade scale (cpgs), short form-36 bodily pain scale (sf-36 bps), and measure of intermittent and constant osteoarthritis pain (icoap). Arthritis Care Res. 2011, 63, S240–S252. [Google Scholar]
- Li, W.; Gong, Y.; Liu, J.; Guo, Y.; Tang, H.; Qin, S.; Zhao, Y.; Wang, S.; Xu, Z.; Chen, B. Peripheral and central pathological mechanisms of chronic low back pain: A narrative review. J. Pain Res. 2021, 14, 1483–1494. [Google Scholar] [CrossRef] [PubMed]
- Treede, R.D.; Rief, W.; Barke, A.; Aziz, Q.; Bennett, M.I.; Benoliel, R.; Cohen, M.; Evers, S.; Finnerup, N.B.; First, M.B.; et al. Chronic pain as a symptom or a disease: The IASP Classification of Chronic Pain for the International Classification of Diseases (ICD-11). Pain 2019, 160, 19–27. [Google Scholar] [CrossRef]
- International Association for the Study of Pain. Terminology|International Association for the Study of Pain. 13 August 2021. Available online: https://www.iasp-pain.org/resources/terminology/ (accessed on 29 August 2021).
- Tracy, L.M.; Ioannou, L.; Baker, K.S.; Gibson, S.J.; Georgiou-Karistianis, N.; Giummarra, M.J. Meta-analytic evidence for decreased heart rate variability in chronic pain implicating parasympathetic nervous system dysregulation. Pain 2016, 157, 7–29. [Google Scholar] [CrossRef]
- Del Paso, G.A.R.; Garrido, S.; Pulgar, A.; Martín-Vázquez, M.; Duschek, S. Aberrances in autonomic cardiovascular regulation in fibromyalgia syndrome and their relevance for clinical pain reports. Psychosom. Med. 2010, 72, 462–470. [Google Scholar] [CrossRef]
- Koenig, J.; Loerbroks, A.; Jarczok, M.N.; Fischer, J.E.; Thayer, J.F. Chronic pain and heart rate variability in a cross-sectional occupational sample. Clin. J. Pain 2016, 32, 218–225. [Google Scholar] [CrossRef]
- Von Elm, E.; Altman, D.G.; Egger, M.; Pocock, S.J.; Gøtzsche, P.C.; Vandenbroucke, J.P. The Strengthening the Reporting of Observational Studies in Epidemiology (STROBE) statement: Guidelines for reporting observational studies. Lancet 2007, 370, 1453–1457. [Google Scholar] [CrossRef]
- Gouverneur, P.; Li, F.; Adamczyk, W.M.; Szikszay, T.M.; Luedtke, K.; Grzegorzek, M. Comparison of feature extraction methods for physiological signals for heat-based pain recognition. Sensors 2021, 21, 4838. [Google Scholar] [CrossRef]
- Cowen, R.; Stasiowska, M.K.; Laycock, H.; Bantel, C. Assessing pain objectively: The use of physiological markers. Anaesthesia 2015, 70, 828–847. [Google Scholar] [CrossRef]
- Walter, S.; Gruss, S.; Ehleiter, H.; Tan, J.; Traue, H.C.; Werner, P.; Al-Hamadi, A.; Crawcour, S.; Andrade, A.O.; da Silva, G.M. The biovid heat pain database data for the advancement and systematic validation of an automated pain recognition system. In Proceedings of the 2013 IEEE international conference on cybernetics (CYBCO), Lausanne, Switzerland, 13–15 June 2013; pp. 128–131. [Google Scholar]
- Lopez-Martinez, D.; Picard, R. Multi-task neural networks for personalized pain recognition from physiological signals. In Proceedings of the 2017 Seventh International Conference on Affective Computing and Intelligent Interaction Workshops and Demos (ACIIW), San Antonio, TX, USA, 23–26 October 2017; pp. 181–184. [Google Scholar]
- Chu, Y.; Zhao, X.; Han, J.; Su, Y. Physiological signal-based method for measurement of pain intensity. Front. Neurosci. 2017, 11, 279. [Google Scholar] [CrossRef] [PubMed]
- Lopez-Martinez, D.; Picard, R. Continuous pain intensity estimation from autonomic signals with recurrent neural networks. In Proceedings of the 2018 40th Annual International Conference of the IEEE Engineering in Medicine and Biology Society (EMBC), Honolulu, HI, USA, 18–21 July 2018; pp. 5624–5627. [Google Scholar]
- Kächele, M.; Thiam, P.; Amirian, M.; Schwenker, F.; Palm, G. Methods for person-centered continuous pain intensity assessment from bio-physiological channels. IEEE J. Sel. Top. Signal Process. 2016, 10, 854–864. [Google Scholar] [CrossRef]
- Thiam, P.; Bellmann, P.; Kestler, H.A.; Schwenker, F. Exploring deep physiological models for nociceptive pain recognition. Sensors 2019, 19, 4503. [Google Scholar] [CrossRef]
- Posada-Quintero, H.F.; Kong, Y.; Nguyen, K.; Tran, C.; Beardslee, L.; Chen, L.; Guo, T.; Cong, X.; Feng, B.; Chon, K.H. Using electrodermal activity to validate multilevel pain stimulation in healthy volunteers evoked by thermal grills. Am. J. -Physiol.-Regul. Integr. Comparative Physiol. 2020, 319, R366–R375. [Google Scholar] [CrossRef]
- Kong, Y.; Posada-Quintero, H.F.; Chon, K.H. Sensitive physiological indices of pain based on differential characteristics of electrodermal activity. IEEE Trans. Biomed. Eng. 2021, 68, 3122–3130. [Google Scholar] [CrossRef]
- Werner, P.; Al-Hamadi, A.; Niese, R.; Walter, S.; Gruss, S.; Traue, H.C. Automatic pain recognition from video and biomedical signals. In Proceedings of the 2014 22nd International Conference on Pattern Recognition, Stockholm, Sweden, 24–28 August 2014; pp. 4582–4587. [Google Scholar]
- Lim, H.; Kim, B.; Noh, G.J.; Yoo, S.K. A deep neural network-based pain classifier using a photoplethysmography signal. Sensors 2019, 19, 384. [Google Scholar] [CrossRef] [PubMed]
- Hinduja, S.; Canavan, S.; Kaur, G. Multimodal fusion of physiological signals and facial action units for pain recognition. In Proceedings of the 2020 15th IEEE International Conference on Automatic Face and Gesture Recognition (FG 2020), Buenos Aires, Argentina, 16–20 November 2020; pp. 577–581. [Google Scholar]
- Gouverneur, P.; Li, F.; M. Szikszay, T.; M. Adamczyk, W.; Luedtke, K.; Grzegorzek, M. Classification of Heat-Induced Pain Using Physiological Signals. In Information Technology in Biomedicine; Springer: Berlin/Heidelberg, Germany, 2021; pp. 239–251. [Google Scholar]
- Kunz, M.; Capito, E.; Horn-Hofmann, C.; Baum, C.; Scheel, J.; Karmann, A.; Priebe, J.; Lautenbacher, S. Psychometric properties of the German version of the Pain Vigilance and Awareness Questionnaire (PVAQ) in pain-free samples and samples with acute and chronic pain. Int. J. Behav. Med. 2017, 24, 260–271. [Google Scholar] [CrossRef]
- Meyer, K.; Sprott, H.; Mannion, A.F. Cross-cultural adaptation, reliability, and validity of the German version of the Pain Catastrophizing Scale. J. Psychosom. Res. 2008, 64, 469–478. [Google Scholar] [CrossRef]
- Reich, H.; Rief, W.; Brähler, E.; Mewes, R. Cross-cultural validation of the German and Turkish versions of the PHQ-9: An IRT approach. BMC Psychol. 2018, 6, 26. [Google Scholar] [CrossRef] [PubMed]
- Breiman, L. Random forests. Mach. Learn. 2001, 45, 5–32. [Google Scholar] [CrossRef]
- Gouverneur, P.; Li, F.; Shirahama, K.; Luebke, L.; Adamczyk, W.M.; Szikszay, T.M.; Luedtke, K.; Grzegorzek, M. Explainable artificial intelligence (XAI) in pain research: Understanding the role of electrodermal activity for automated pain recognition. Sensors 2023, 23, 1959. [Google Scholar] [CrossRef]
- Islam, S.M.; Sylvester, A.; Orpilla, G.; Lubecke, V.M. Respiratory feature extraction for radar-based continuous identity authentication. In Proceedings of the 2020 IEEE Radio and Wireless Symposium (RWS), San Antonio, TX, USA, 26–29 January 2020; pp. 119–122. [Google Scholar]
- Makowski, D.; Pham, T.; Lau, Z.J.; Brammer, J.C.; Lespinasse, F.; Pham, H.; Schölzel, C.; Chen, S.A. NeuroKit2: A Python toolbox for neurophysiological signal processing. Behav. Res. Methods 2021, 53, 1689–1696. [Google Scholar] [CrossRef]
- Shoukry, N.; Elkilany, O.; Thiam, P.; Kessler, V.; Schwenker, F. Subject-independent Pain Recognition using Physiological Signals and Para-linguistic Vocalizations. In Proceedings of the ICPRAM, Valletta, Malta, 22–24 February 2020; pp. 142–150. [Google Scholar]
- Criminisi, A.; Shotton, J. Decision Forests for Computer Vision and Medical Image Analysis; Advances in Computer Vision and Pattern Recognition; Springer: London, UK, 2013. [Google Scholar]
- Li, F.; Yang, Y. Analysis of recursive feature elimination methods. In Proceedings of the 28th Annual International ACM SIGIR Conference on Research and Development in Information Retrieval, Salvador, Brazil, 15–19 August 2005; pp. 633–634. [Google Scholar]
- Dauda, K.A.; Pradhan, B.; Shankar, B.U.; Mitra, S. Decision tree for modeling survival data with competing risks. Biocybern. Biomed. Eng. 2019, 39, 697–708. [Google Scholar] [CrossRef]
- Walter, S.; Gruss, S.; Limbrecht-Ecklundt, K.; Traue, H.C.; Werner, P.; Al-Hamadi, A.; Diniz, N.; Silva, G.M.d.; Andrade, A.O. Automatic pain quantification using autonomic parameters. Psychol. Neurosci. 2014, 7, 363–380. [Google Scholar] [CrossRef]
- Bari, D.S.; Yacoob Aldosky, H.Y.; Martinsen, Ø.G. Simultaneous measurement of electrodermal activity components correlated with age-related differences. J. Biol. Phys. 2020, 46, 177–188. [Google Scholar] [CrossRef] [PubMed]
- Anderson, B.E.; Bliven, K.C.H. The use of breathing exercises in the treatment of chronic, nonspecific low back pain. J. Sport Rehabil. 2017, 26, 452–458. [Google Scholar] [CrossRef] [PubMed]
- Carriere, J.S.; Martel, M.O.; Meints, S.M.; Cornelius, M.C.; Edwards, R.R. What do you expect? Catastrophizing mediates associations between expectancies and pain-facilitatory processes. Eur. J. Pain 2019, 23, 800–811. [Google Scholar] [CrossRef] [PubMed]
- Meints, S.M.; Mawla, I.; Napadow, V.; Kong, J.; Gerber, J.; Chan, S.T.; Wasan, A.D.; Kaptchuk, T.J.; McDonnell, C.; Carriere, J.; et al. The relationship between catastrophizing and altered pain sensitivity in patients with chronic low back pain. Pain 2019, 160, 833. [Google Scholar] [CrossRef] [PubMed]
- Mischkowski, D.; Palacios-Barrios, E.E.; Banker, L.; Dildine, T.C.; Atlas, L.Y. Pain or nociception? Subjective experience mediates the effects of acute noxious heat on autonomic responses-corrected and republished. Pain 2019, 160, 1469. [Google Scholar] [CrossRef] [PubMed]
- Adamczyk, W.M.; Buglewicz, E.; Szikszay, T.M.; Luedtke, K.; Bąbel, P. Reward for pain: Hyperalgesia and allodynia induced by operant conditioning: Systematic review and meta-analysis. J. Pain 2019, 20, 861–875. [Google Scholar] [CrossRef] [PubMed]
- Wei, H.; Zhou, L.; Zhang, H.; Chen, J.; Lu, X.; Hu, L. The influence of expectation on nondeceptive placebo and nocebo effects. Pain Res. Manag. 2018, 2018, 8459429. [Google Scholar] [CrossRef] [PubMed]
- Aslaksen, P.M.; Myrbakk, I.N.; Høifødt, R.S.; Flaten, M.A. The effect of experimenter gender on autonomic and subjective responses to pain stimuli. Pain 2007, 129, 260–268. [Google Scholar] [CrossRef] [PubMed]
- Breimhorst, M.; Hondrich, M.; Rebhorn, C.; May, A.; Birklein, F. Sensory and sympathetic correlates of heat pain sensitization and habituation in men and women. Eur. J. Pain 2012, 16, 1281–1292. [Google Scholar] [CrossRef]
- Ndayisaba, J.P.; Fanciulli, A.; Granata, R.; Duerr, S.; Hintringer, F.; Goebel, G.; Krismer, F.; Wenning, G.K. Sex and age effects on cardiovascular autonomic function in healthy adults. Clin. Auton. Res. 2015, 25, 317–326. [Google Scholar] [CrossRef]
- Drummond, P.D. Sensory–autonomic interactions in health and disease. Handb. Clin. Neurol. 2013, 117, 309–319. [Google Scholar]
- Leroux, A.; Rzasa-Lynn, R.; Crainiceanu, C.; Sharma, T. Wearable devices: Current status and opportunities in pain assessment and management. Digit. Biomarkers 2021, 5, 89–102. [Google Scholar] [CrossRef]


| Characteristics | HSs (n = 52) | CBPPs (n = 20) | p |
|---|---|---|---|
| Age (Years), Mean (SD) | 27.4 (6.6) | 40.9 (14.4) | <0.001 |
| Female, n (%) | 35 (67.3) | 15 (75) | 0.534 |
| BMI, Mean (SD) | 23.4 (3.28) | 24.7 (3.33) | 0.106 |
| PCS, Median (IQR) | 14.0 (10.0) | 12.0 (17.3) | 0.015 |
| PHQ-9, Median (IQR) | 4.0 (2.3) | 7.5 (7.0) | 0.005 |
| PVAQ, Median (IQR) | 34.0 (10.0) | 41.5 (18.8) | 0.006 |
| Sensor | B vs. NP | B vs. | B vs. | B vs. | B vs. |
|---|---|---|---|---|---|
| Bvp | 53.49 | 52.52 | 50.45 | 50.72 | 53.52 |
| Ecg | 52.16 | 45.79 | 51.63 | 54.33 | 61.63 |
| Eda_E4 | 55.65 | 56.49 | 60.63 | 66.71 | 72.28 |
| Eda_RB | 50.84 | 61.78 | 68.11 | 78.12 | 91.70 |
| Emg | 50.36 | 52.28 | 49.21 | 48.20 | 52.02 |
| Resp | 51.08 | 48.32 | 52.80 | 53.12 | 54.82 |
| All | 52.64 | 62.26 | 67.24 | 77.76 | 89.90 |
| Sensor | B vs. NP | B vs. | B vs. | B vs. | B vs. |
|---|---|---|---|---|---|
| Bvp | 47.32 | 49.11 | 55.95 | 50.89 | 57.74 |
| Ecg | 55.65 | 49.40 | 52.98 | 54.76 | 54.17 |
| Eda_E4 | 49.70 | 50.60 | 56.25 | 58.93 | 74.40 |
| Eda_RB | 52.68 | 54.17 | 69.05 | 76.19 | 89.58 |
| Emg | 44.64 | 48.51 | 47.92 | 51.19 | 54.76 |
| Resp | 47.02 | 52.98 | 54.17 | 48.21 | 51.19 |
| All | 51.19 | 55.95 | 67.56 | 74.70 | 88.39 |
| Sensor | B vs. NP | B vs. | B vs. | B vs. | B vs. |
|---|---|---|---|---|---|
| Bvp | 52.68 | 49.40 | 47.02 | 53.27 | 57.14 |
| Ecg | 50.30 | 53.27 | 48.81 | 43.75 | 53.27 |
| Eda_E4 | 52.68 | 54.17 | 59.82 | 68.15 | 75.00 |
| Eda_RB | 53.87 | 56.25 | 66.96 | 77.98 | 87.80 |
| Emg | 51.49 | 51.19 | 47.62 | 48.81 | 46.73 |
| Resp | 49.11 | 53.57 | 55.65 | 48.21 | 56.25 |
| All | 51.79 | 58.33 | 65.48 | 76.19 | 88.10 |
| Dataset | # Features | Accuracy | Feature Set |
|---|---|---|---|
| CBPPs | 31 | 91.67 | ’Bvp_Rate_Max_nk’, ’Bvp_Rate_Min_nk’, ’Bvp_Rate_SD_nk’, ’Eda_E4_diff_start_end’, ’Eda_E4_range_tonic’, ’Eda_E4_mean_rise_times’, ’Eda_E4_mean_offsets’, ’Eda_E4_norm_mean’, ’Eda_E4_dPhEDA_3’, ’Eda_E4_dPhEDA_10’, ’Eda_E4_TVSymp_6’, ’Eda_E4_TVSymp_7’, ’Eda_E4_SCR_RecoveryTime_nk’, ’Eda_RB_range’, ’Eda_RB_mean_abs_2_diff’, ’Eda_RB_argmax’, ’Eda_RB_argmin’, ’Eda_RB_diff_start_end’, ’Eda_RB_range_tonic’, ’Eda_RB_dPhEDA_3’, ’Eda_RB_dPhEDA_8’, ’Eda_RB_dPhEDA_9’, ’Eda_RB_dPhEDA_13’, ’Eda_RB_dPhEDA_14’, ’Eda_RB_dPhEDA_15’, ’Eda_RB_TVSymp_1’, ’Eda_RB_MTVSymp_1’, ’Eda_RB_SCR_RecoveryTime_nk’, ’Ecg_Rate_Baseline_nk’, ’Emg_mean_abs_1_diff’, ’Emg_SM3’ |
| HSs | 15 | 93.62 | ’Eda_E4_range_tonic’, ’Resp_min’, ’Resp_mean_in’, ’Eda_RB_max’, ’Eda_RB_min’, ’Eda_RB_iqr’, ’Eda_RB_argmax’, ’Eda_RB_argmin’, ’Eda_RB_diff_start_end’, ’Eda_RB_std_tonic’, ’Eda_RB_dPhEDA_3’, ’Eda_RB_dPhEDA_4’, ’Eda_RB_dPhEDA_6’, ’Eda_RB_dPhEDA_16’, ’Eda_RB_TVSymp_5’ |
Disclaimer/Publisher’s Note: The statements, opinions and data contained in all publications are solely those of the individual author(s) and contributor(s) and not of MDPI and/or the editor(s). MDPI and/or the editor(s) disclaim responsibility for any injury to people or property resulting from any ideas, methods, instructions or products referred to in the content. |
© 2023 by the authors. Licensee MDPI, Basel, Switzerland. This article is an open access article distributed under the terms and conditions of the Creative Commons Attribution (CC BY) license (https://creativecommons.org/licenses/by/4.0/).
Share and Cite
Luebke, L.; Gouverneur, P.; Szikszay, T.M.; Adamczyk, W.M.; Luedtke, K.; Grzegorzek, M. Objective Measurement of Subjective Pain Perception with Autonomic Body Reactions in Healthy Subjects and Chronic Back Pain Patients: An Experimental Heat Pain Study. Sensors 2023, 23, 8231. https://doi.org/10.3390/s23198231
Luebke L, Gouverneur P, Szikszay TM, Adamczyk WM, Luedtke K, Grzegorzek M. Objective Measurement of Subjective Pain Perception with Autonomic Body Reactions in Healthy Subjects and Chronic Back Pain Patients: An Experimental Heat Pain Study. Sensors. 2023; 23(19):8231. https://doi.org/10.3390/s23198231
Chicago/Turabian StyleLuebke, Luisa, Philip Gouverneur, Tibor M. Szikszay, Wacław M. Adamczyk, Kerstin Luedtke, and Marcin Grzegorzek. 2023. "Objective Measurement of Subjective Pain Perception with Autonomic Body Reactions in Healthy Subjects and Chronic Back Pain Patients: An Experimental Heat Pain Study" Sensors 23, no. 19: 8231. https://doi.org/10.3390/s23198231