This section presents the results of the experiments performed in accordance with the experimental setup presented in
Section 2.4. First, we present the results on the general performance of the model-based fuzzers in comparison to the two baseline fuzzers (
Section 3.1). Then, we present the results concerning the effect of the feedback dimension and the feedback intervals (
Section 3.2 and
Section 3.3). For the additional analysis, we present the distributions of Integer values chosen by the fuzzers in
Section 3.4 and information on the throughput of the fuzzers in
Section 3.5. We discuss all these results in
Section 4. All the data necessary to produce the figures showed in this section as well as additional figures and data have been published (
https://github.com/anneborcherding/Smarter-Evolution).
3.1. General Performance
First, we present the general performance of the different fuzzers in terms of the number of vulnerabilities triggered, compared to our two baselines (see
Section 2.2.2 and
Section 2.4.1, respectively). For these experiments, we used the default configurations, which are represented by the underlined values in
Table 1. To reiterate, we use three model-based fuzzers,
A_DT,
A_NN, and
A_SVM, which are based on a DT, NN, and SVM, respectively. For
A_DT and
A_NN, the model is used for selection and to guide the mutations. In contrast, the SVM is only used for the selection of test cases. As baseline, we use two different approaches:
A_BASELINE and
A_RANDOM.
A_BASELINE corresponds to an approach that strictly selects the test cases which lead to the highest number of crashing test cases and does not change the mutation strategy.
A_RANDOM uses an approach where test cases are selected at random. The mutation strategy is not changed. In total, 25 vulnerabilities are present in VulnDuT for our experiments (see
Table 2).
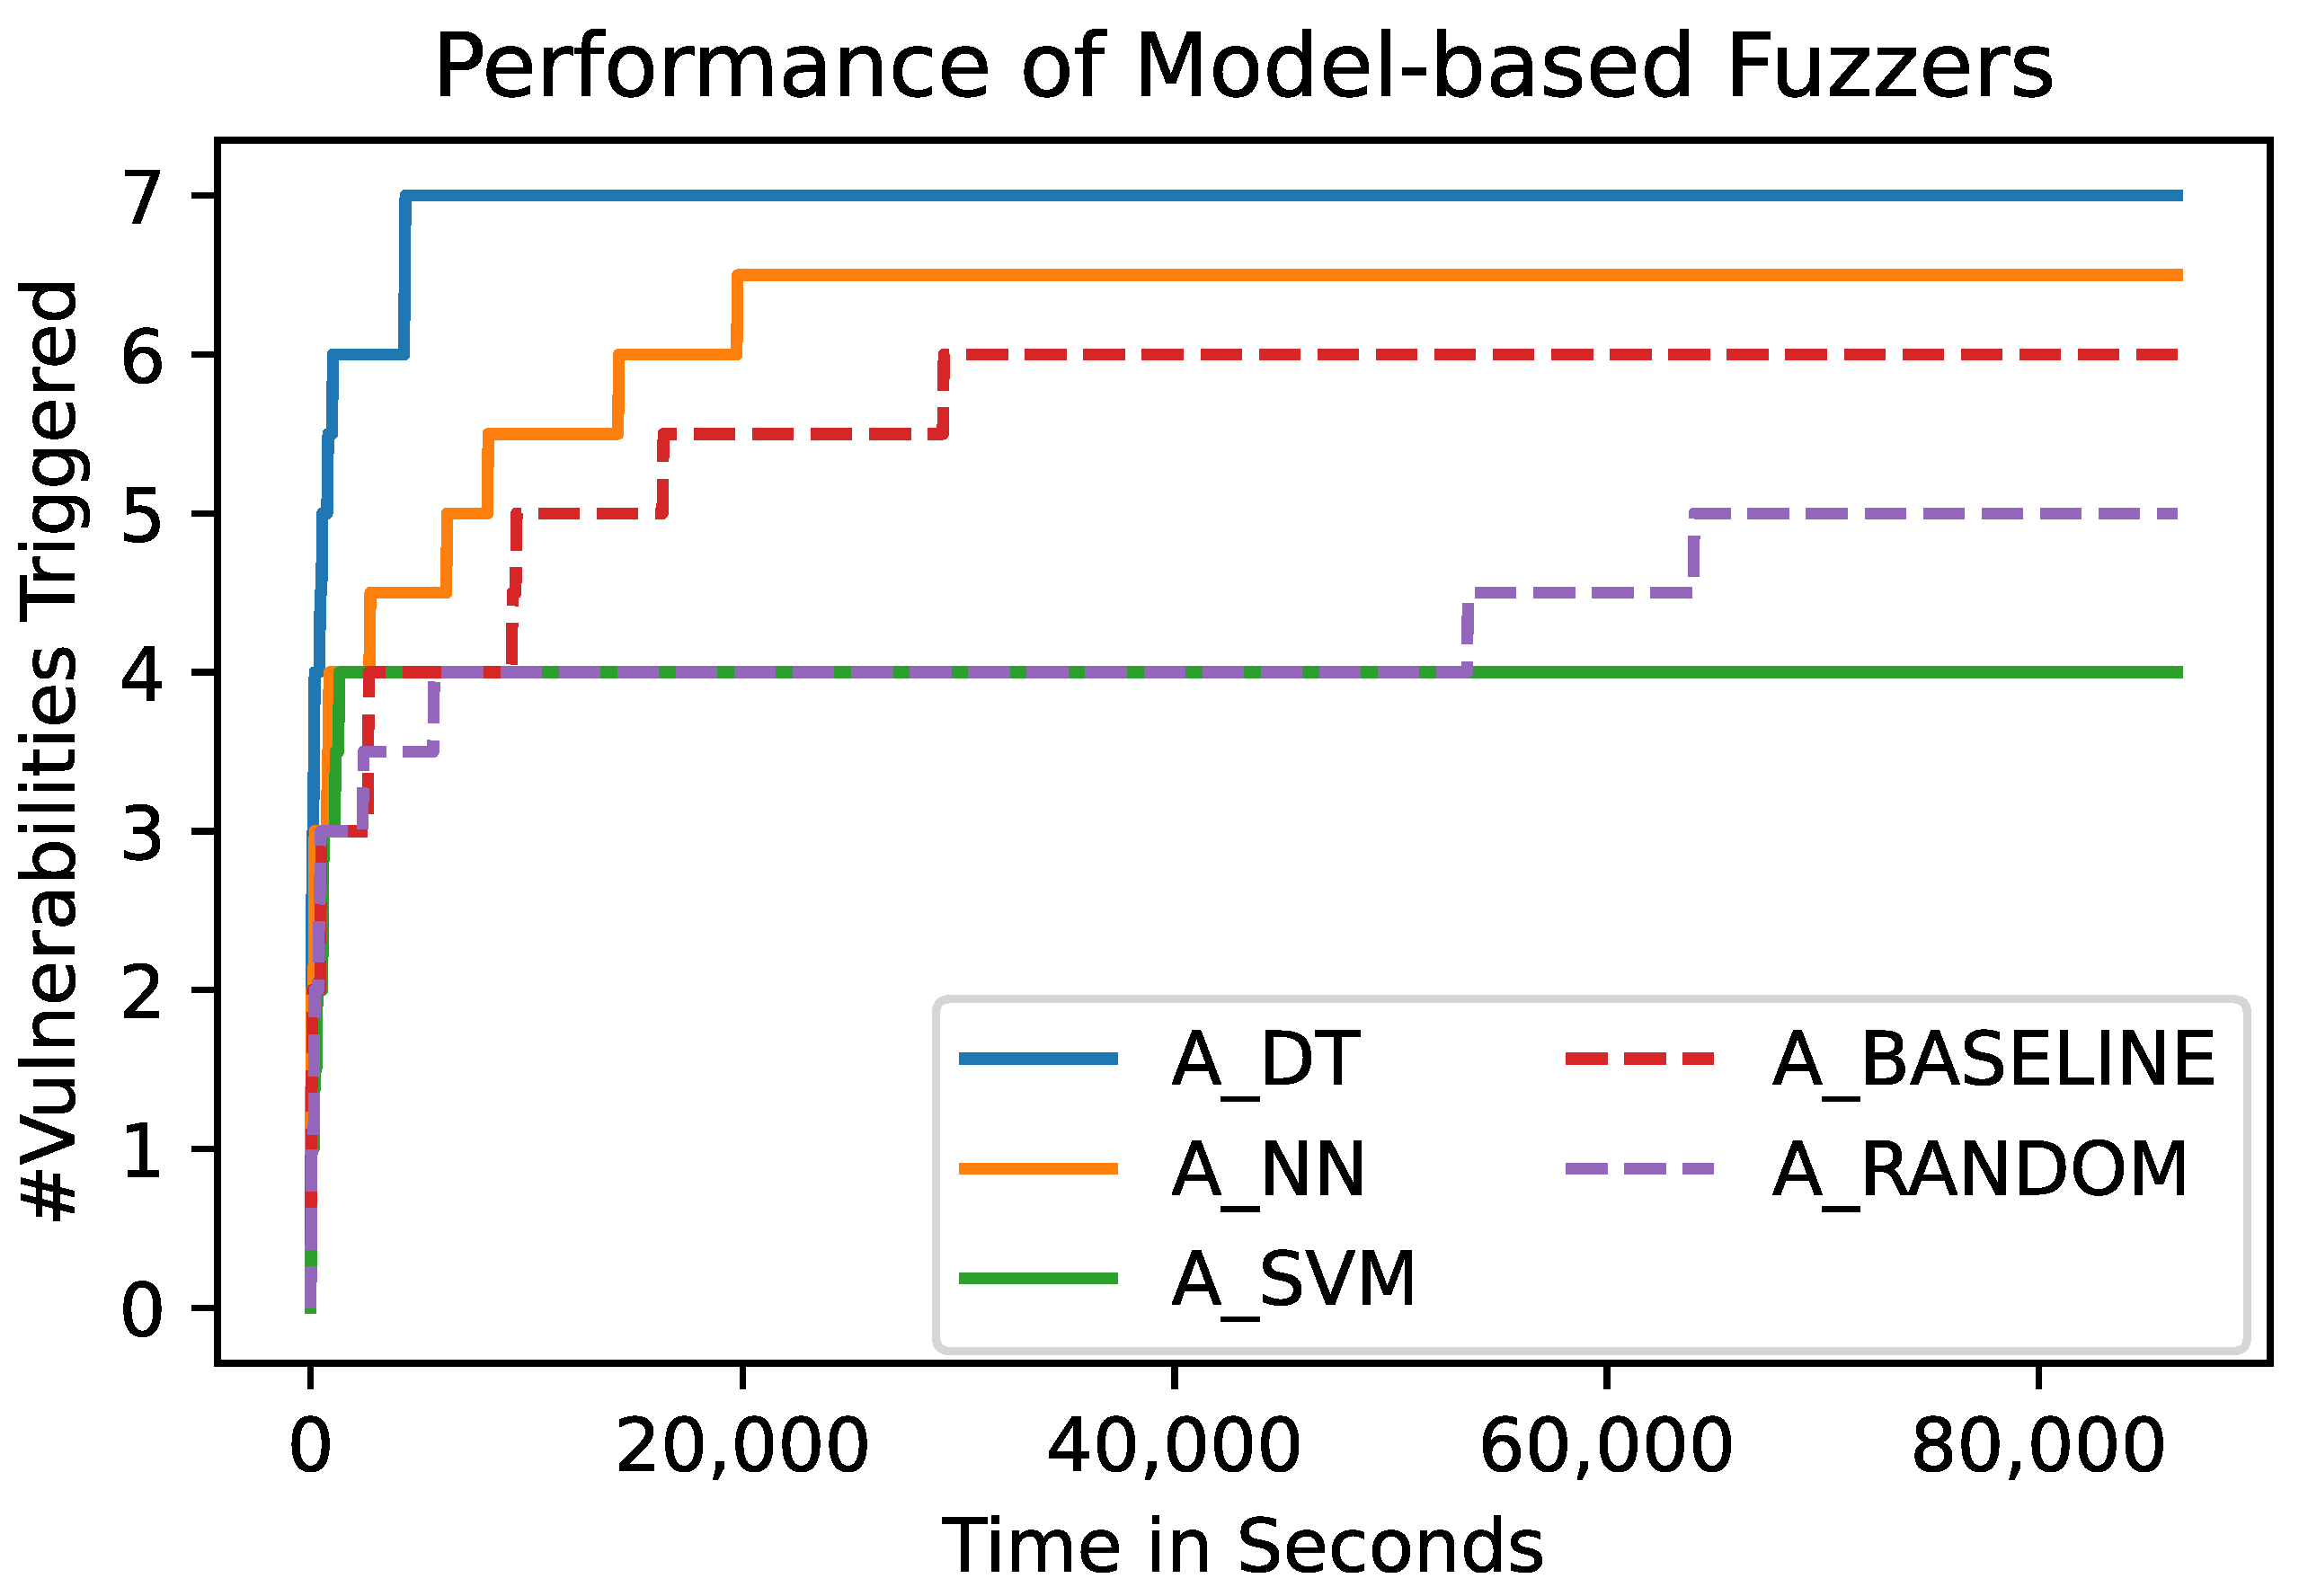
Figure 5 and
Figure 6 show the absolute number of unique vulnerabilities that have been triggered by the different fuzzers over time, and over the test cases the fuzzers chose to be sent to the SUT, respectively.
Figure 5 shows the number of vulnerabilities that have been triggered by the different fuzzers over the time of the fuzzing process. Each of the shown lines represents the mean of 10 runs of a fuzzer using the respective algorithm. This graph shows that
A_DT and
A_NN outperform
A_BASELINE and
A_RANDOM. In turn, the latter two outperform
A_SVM with regard to the final number of triggered vulnerabilities. However,
A_SVM is able to find new bugs earlier in time.
To analyze the relative performance of the fuzzers, we conduct a statistical test on the number of triggered vulnerabilities. The results of this statistical test are presented in
Table 3 and in
Figure 7.
Table 3 shows the pairwise
p-values calculated using a Mann–Whitney
U Test based on the final number of unique vulnerabilities the 10 runs of each of the fuzzers triggered. Values suggesting that two distributions of the final number of vulnerabilities are distinguishable (
p-value
) are highlighted in gray. This shows that
A_DT outperforms both baseline fuzzers (
A_RANDOM and
A_BASELINE) significantly. Furthermore, it shows that
A_SVM performs significantly worse than
A_RANDOM and
A_BASELINE. The final number of vulnerabilities triggered by
A_DT and
A_NN are not distinguishable.
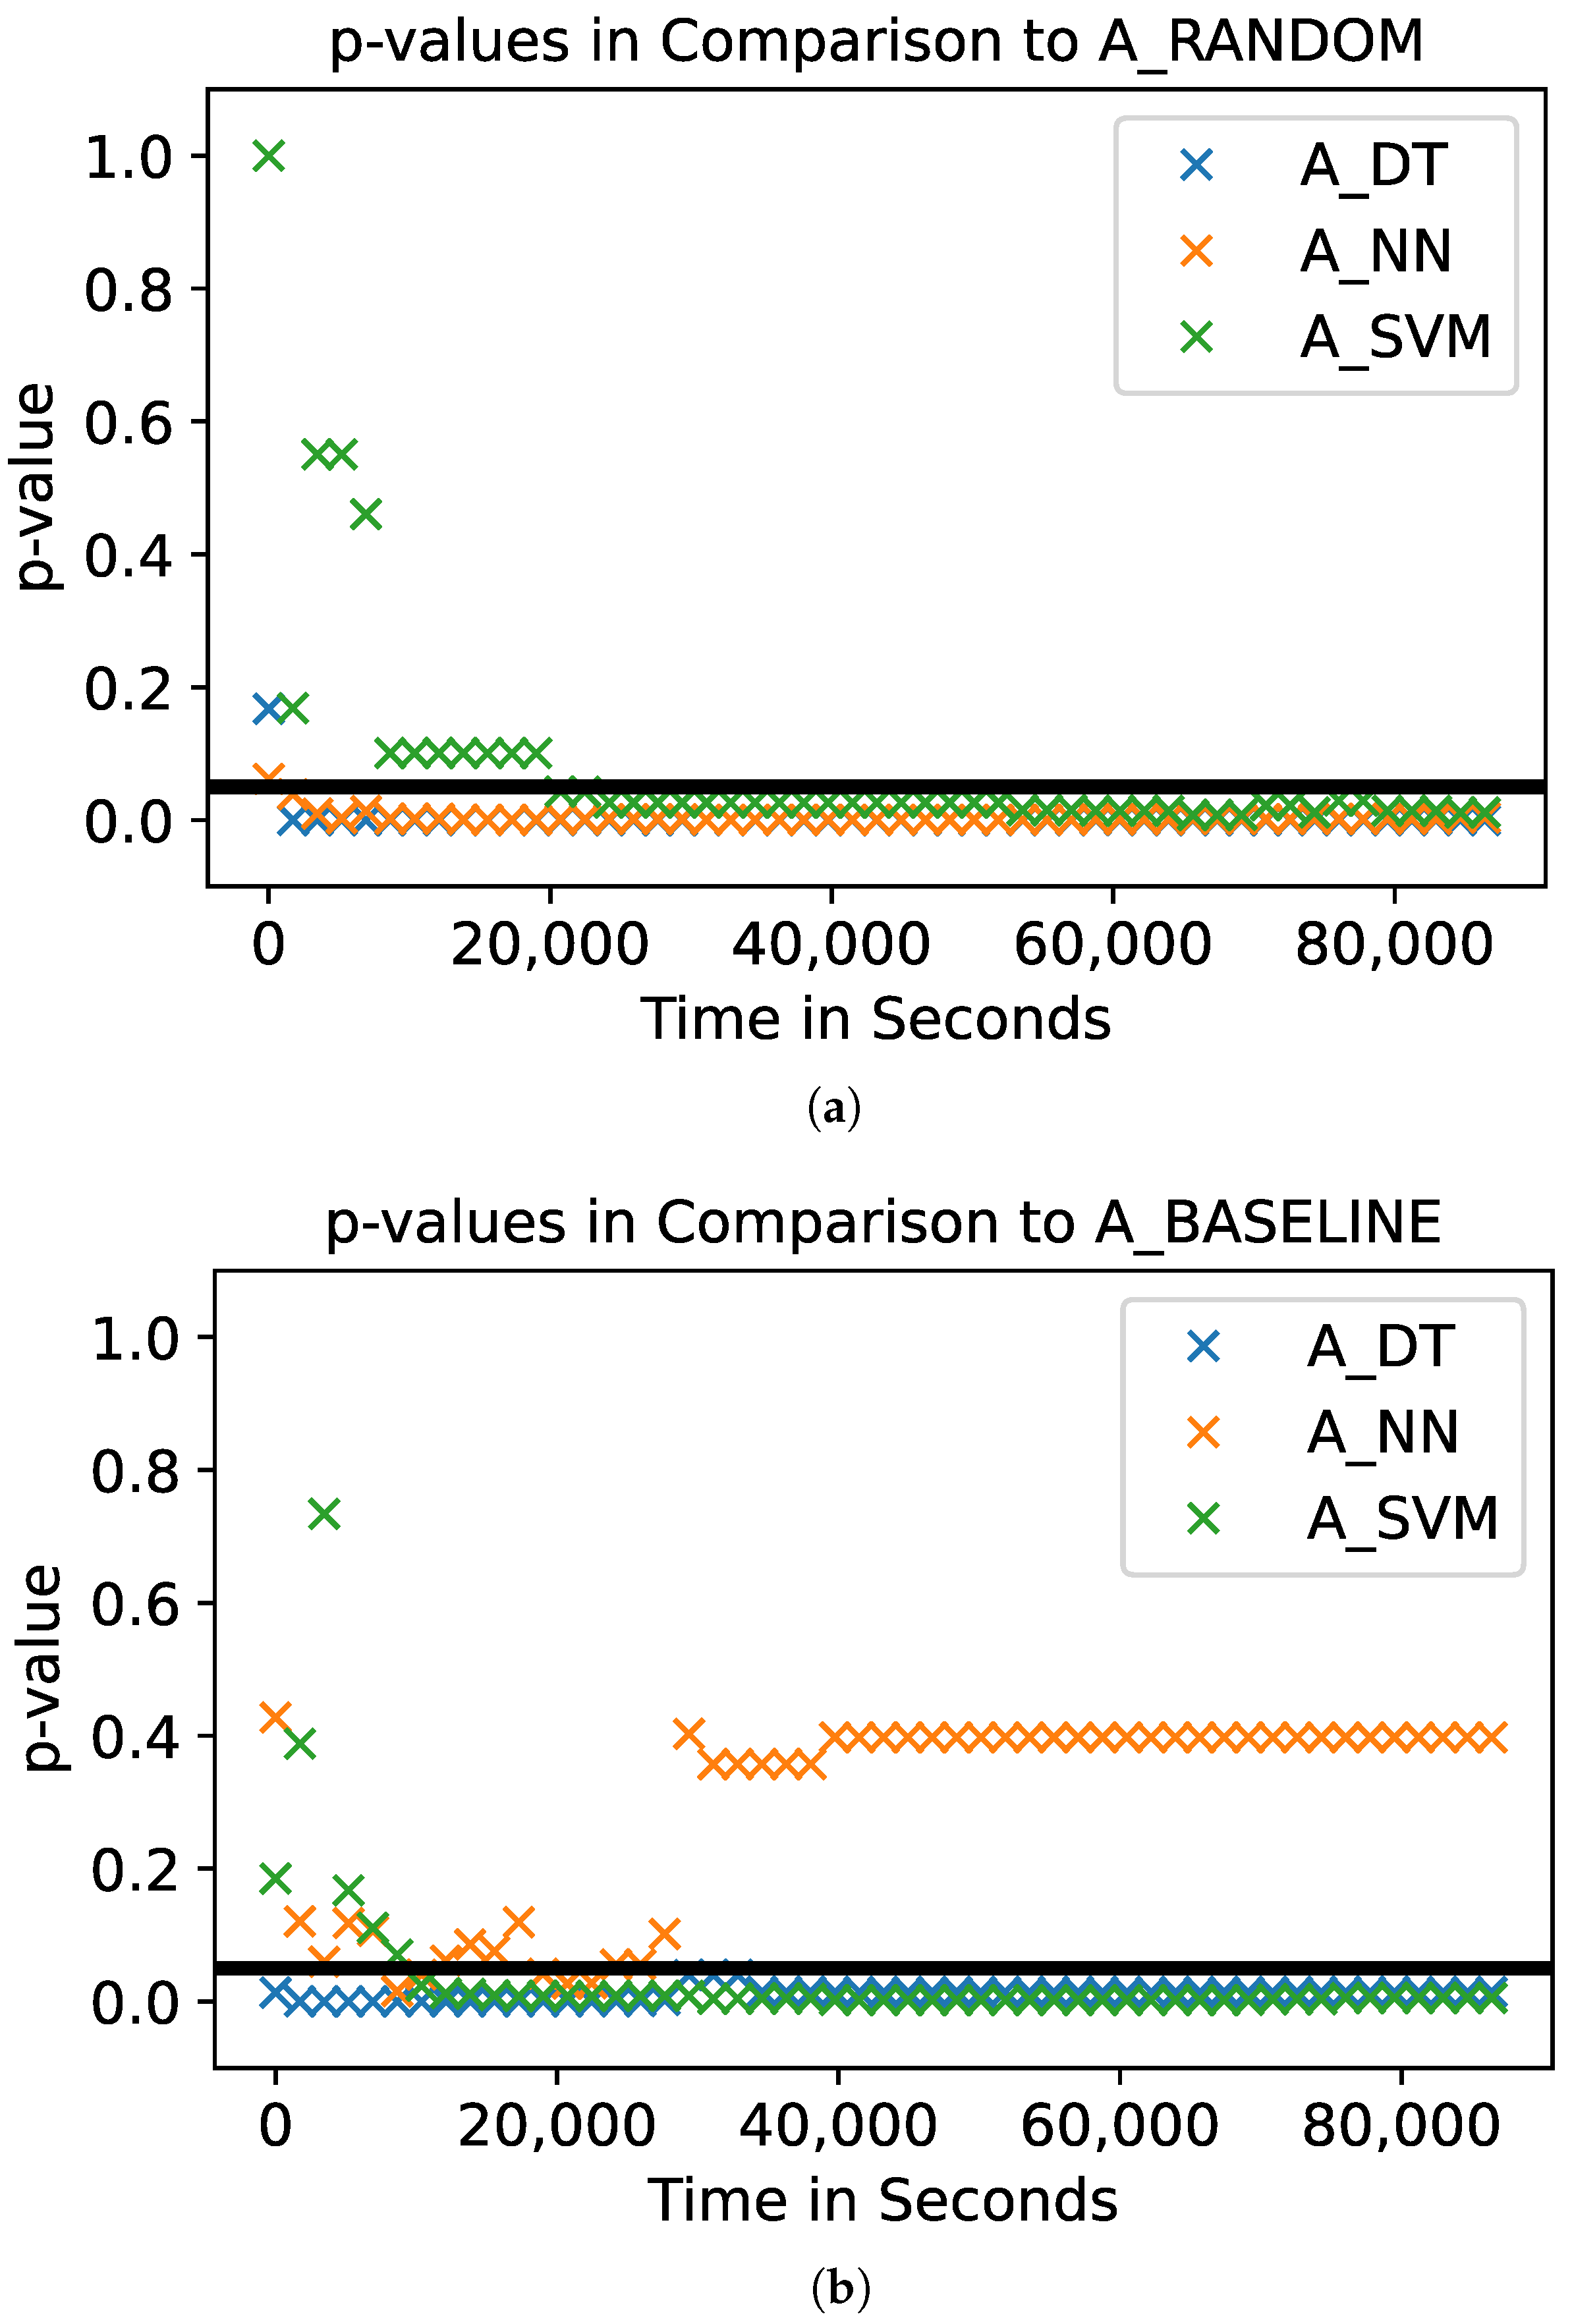
In addition to the statistical analysis regarding the final value of triggered vulnerabilities, we statistically analyze the number of vulnerabilities the fuzzers trigger over time.
Figure 7a,b shows the
p-values regarding the number of triggered vulnerabilities over time, comparing the model-based fuzzers to
A_RANDOM and
A_BASELINE, respectively. The black horizontal line represents the significance level of
. Compared to
A_RANDOM, all three model-based fuzzers lead to significantly different numbers of vulnerabilities after around 20,000 s in the fuzzing campaign (
Figure 7a). Note that
A_SVM performs significantly differently, but triggers fewer vulnerabilities than
A_RANDOM (see, for example,
Figure 5). Compared to
A_BASELINE,
A_DT performs significantly better during the whole fuzzing campaign (
Figure 7a).
A_NN is only able to produce significantly better results for a few moments in time. Nevertheless, the mean number of final vulnerabilities is higher for
A_NN than for
A_BASELINE (see
Figure 5).
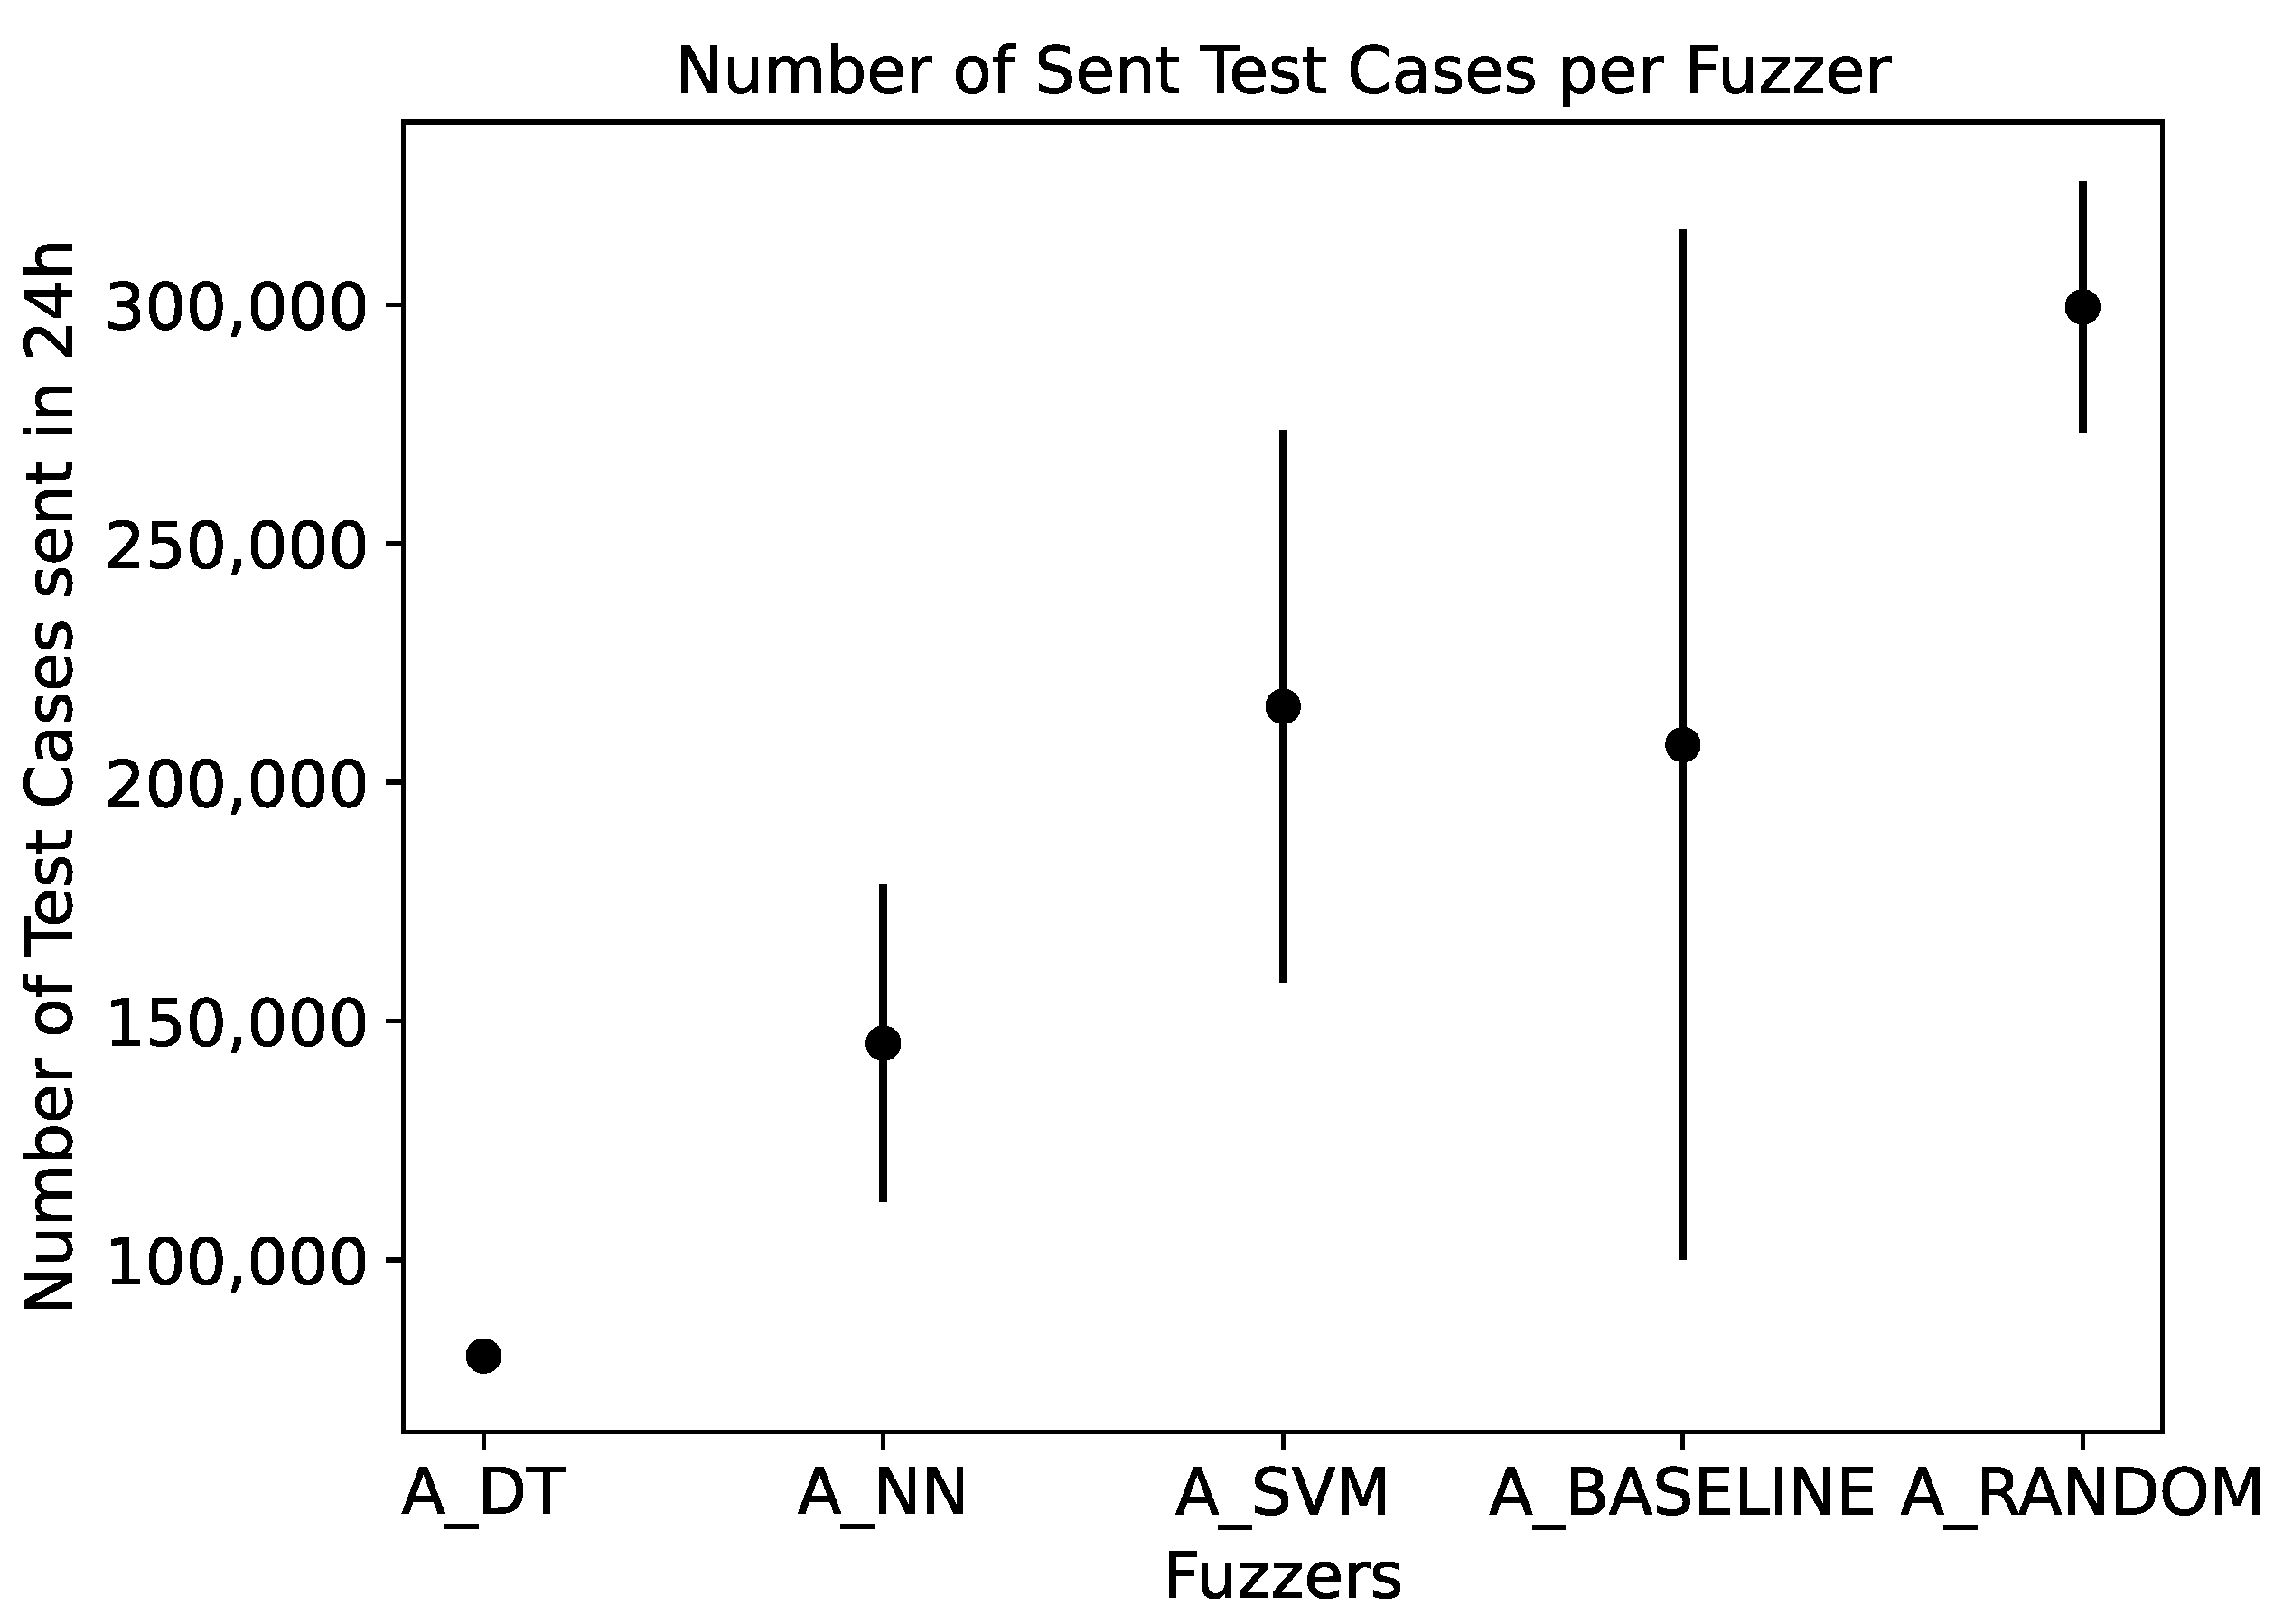
Figure 6 shows the same configurations as
Figure 5, but shows the triggered vulnerabilities over the number of test cases instead of time. This representation accounts for the overhead the model-based approaches introduce. As a result,
Figure 6 focuses on the efficiency and effectivity of the fuzzers’ test case choices, regardless of the duration of the underlying calculations. It shows that the relative performance of the fuzzers is the same as in the previously presented analysis, which was based on the time. Furthermore, it shows that
A_RANDOM is able to generate more test cases in the fixed fuzzing time of 24 h than the other fuzzers. We present details on the throughput of the different fuzzers in
Section 3.5.
Next to the accumulated number of vulnerabilities, we analyze the individual vulnerabilities the fuzzers were able to trigger.
Table 4 shows this data in detail. The rows of
Table 4 correspond to the vulnerabilities that we implemented in VulnDuT (see
Section 2.4.1). Each entry corresponds to the number of runs in which a certain vulnerability was triggered by a certain fuzzer (out of 10 runs).
A_SVM,
A_BASELINE, and
A_RANDOM focus on the String value and find at least two linked vulnerabilities.
A_NN and
A_DT, however, also focus on the signed and unsigned Integer value. All the fuzzers find the first vulnerability of the three linked String vulnerabilities, except for one run of
A_NN.
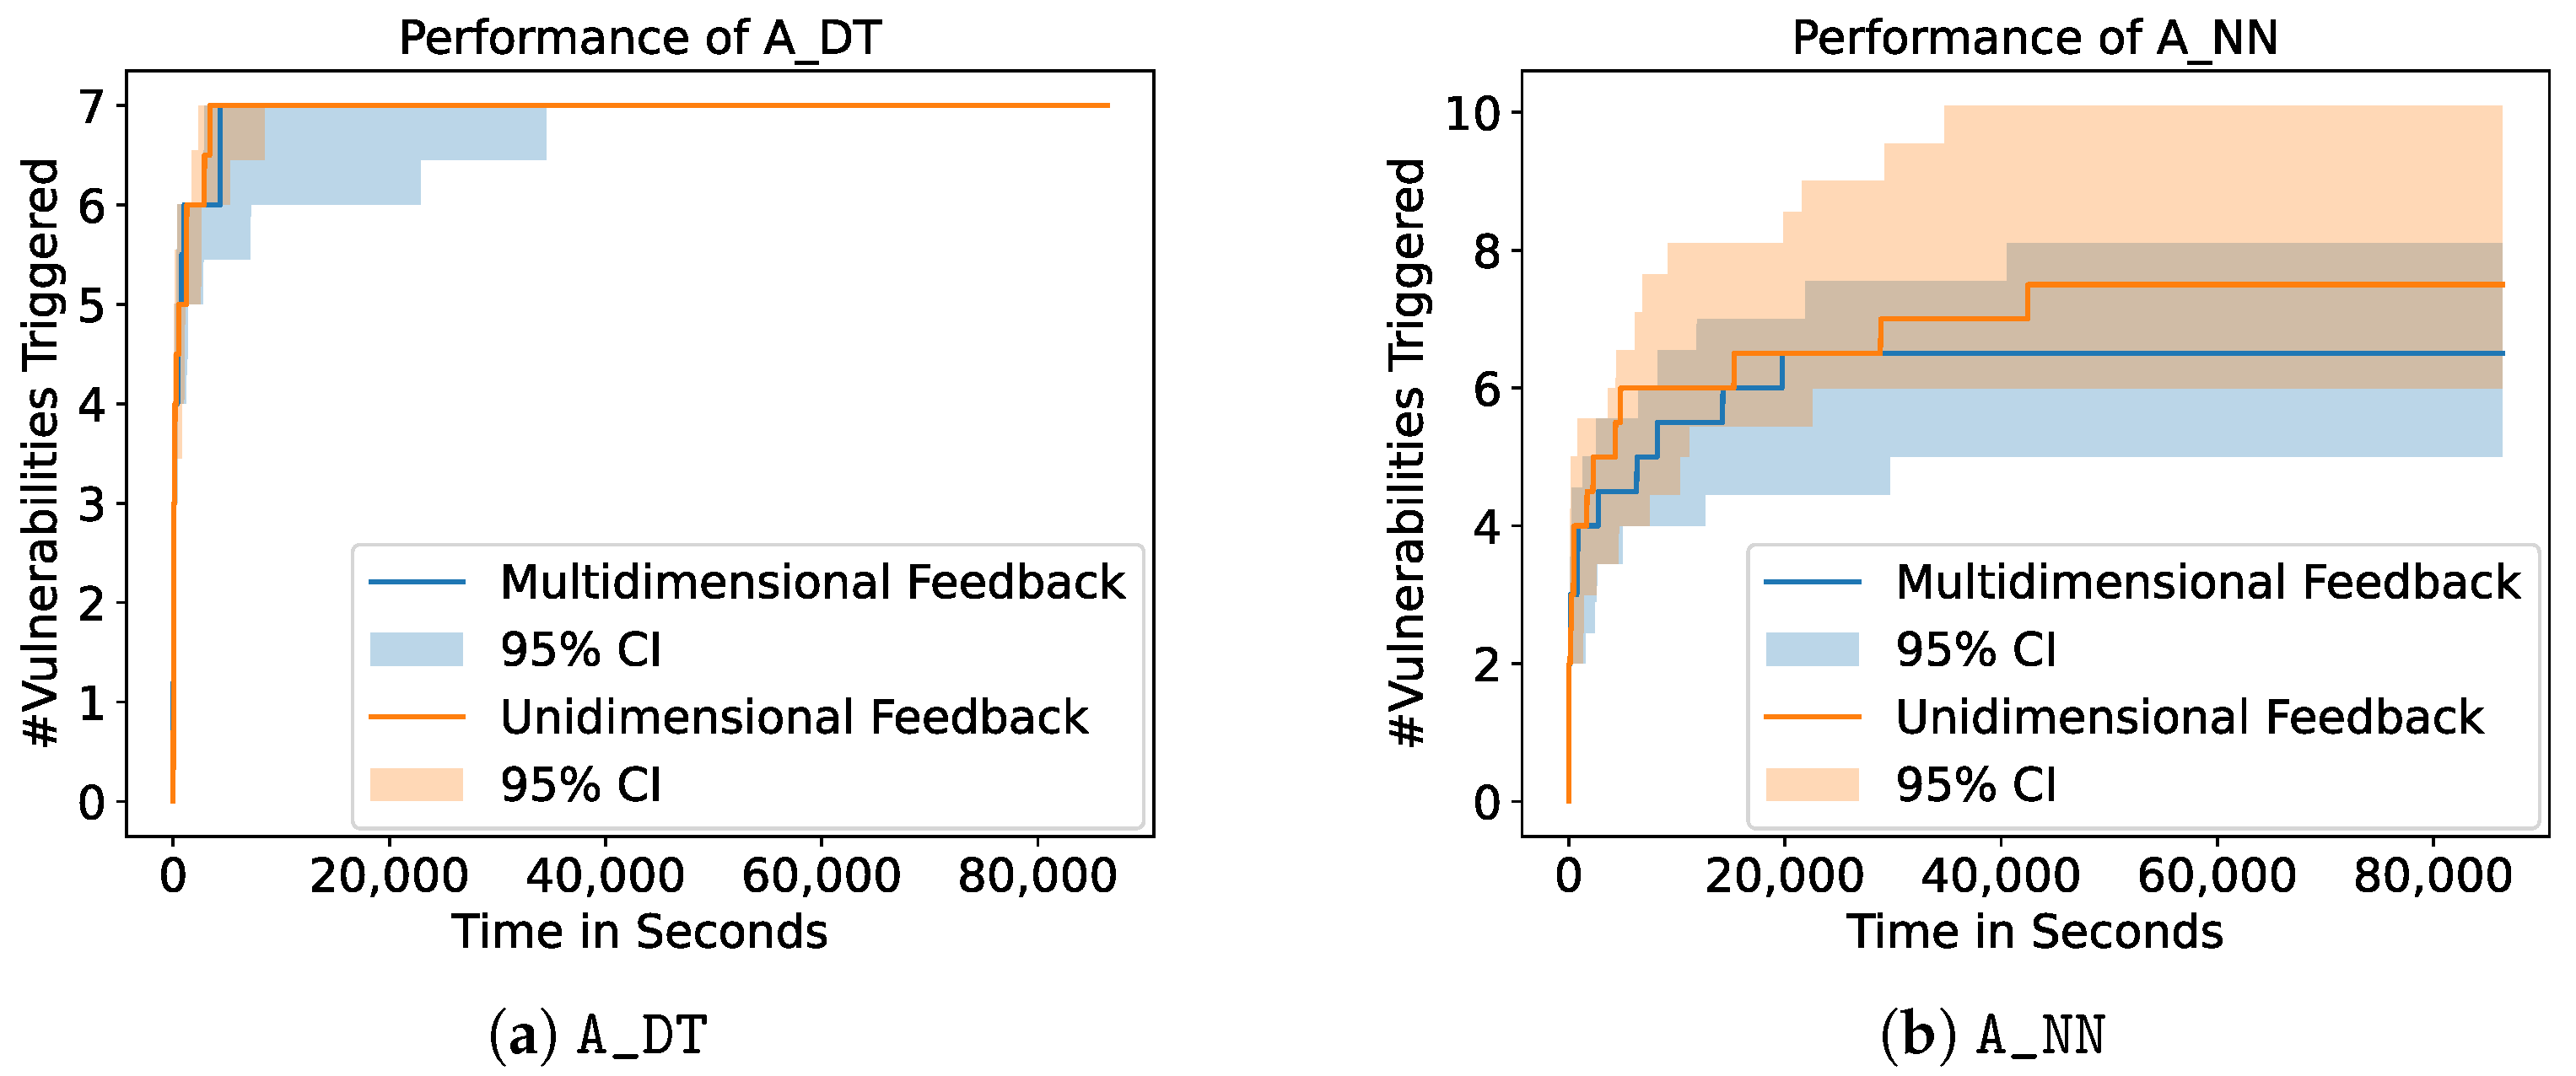
3.2. Choice of Feedback Dimension
Figure 8 shows the influence of the choice of the feedback dimension on
A_DT and
A_NN. We show the mean of 10 runs as well as the
confidence interval and restrict the plots to the results of
A_DT and
A_NN since all other fuzzers lead to similar results. For our experiments, we choose two configurations: (I) unidimensional feedback, where only the information whether one or more services crashed was returned, and (II) multidimensional feedback, where information on each single service was given. In the latter case, the fuzzers receive feedback with a dimension of five, one dimension for each of the services the VulnDuT provides.
Figure 8 shows that the resulting number of triggered vulnerabilities does not differ significantly between fuzzers with unidimensional feedback and fuzzers with multidimensional feedback. For
A_DT,
A_NN,
A_SVM, and
A_RANDOM, the types of triggered vulnerabilities also stay the same. However,
A_BASELINE shows different results if unidimensional feedback is provided. If
A_BASELINE receives multidimensional feedback, the fuzzer is able to trigger all the vulnerabilities of the first set of linked String vulnerabilities (see
Table 4). With unidimensional feedback,
A_BASELINE is only able to trigger three of the five vulnerabilities in this set. Out of 10 runs, 10 were able to trigger the first two vulnerabilities and 3 were able to trigger the third vulnerability. This means that
A_BASELINE is able to trigger more linked vulnerabilities if it receives multidimensional feedback.
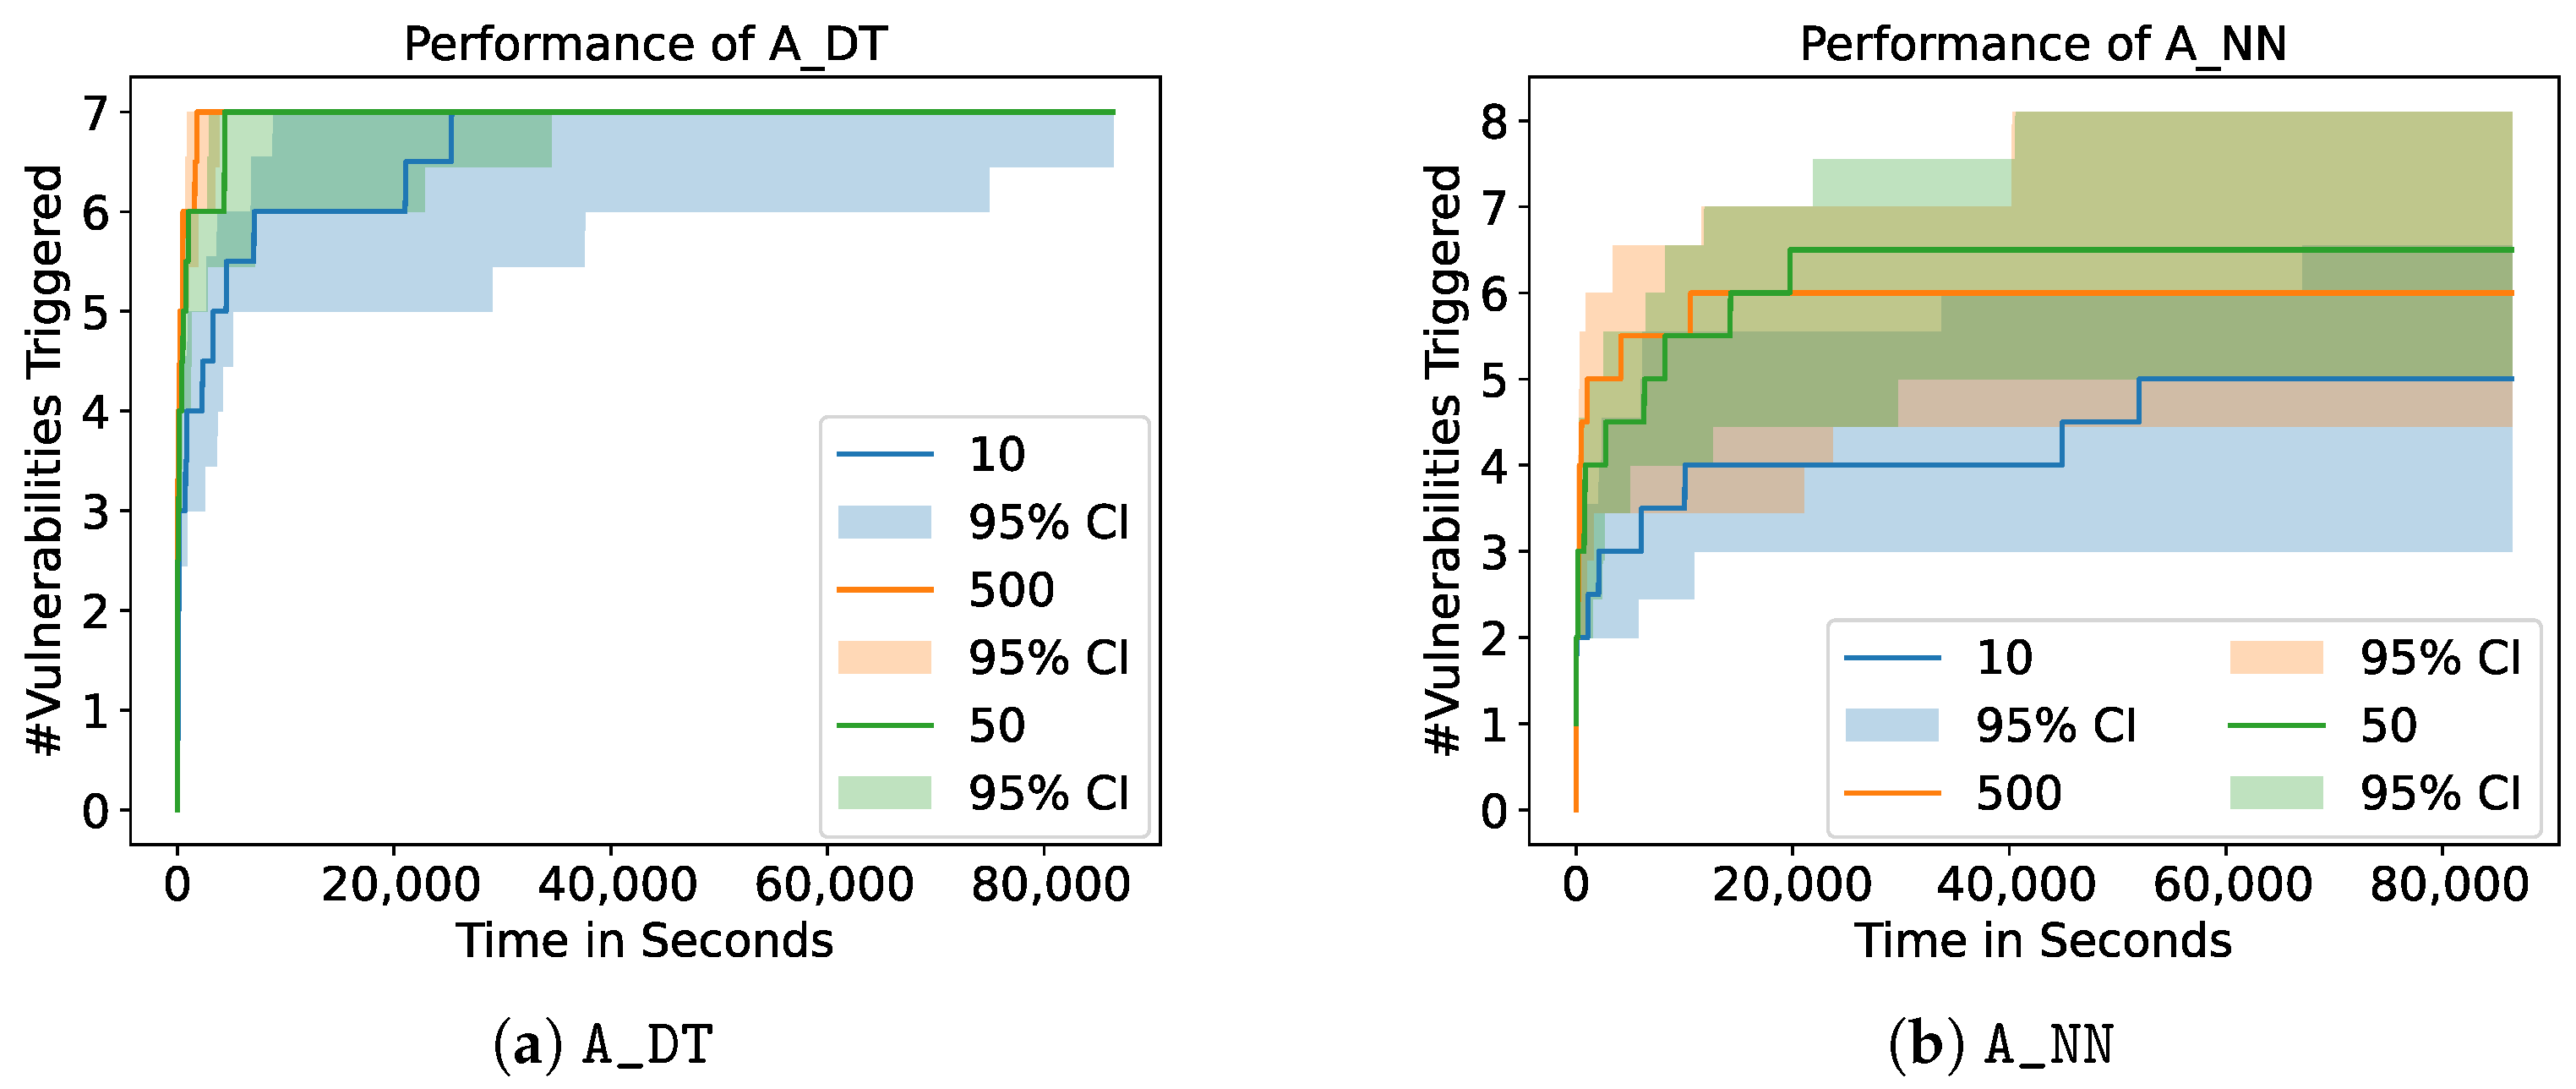
3.3. Choice of Feedback Interval
In addition to the feedback dimension, we analyze the impact of the feedback interval (see
Section 2.4.4). For a feedback interval of
x, the fuzzer receives information on the crashed services of the SUT after every
x test cases. Consequently, the higher the feedback interval, the lower the resolution of the feedback the fuzzer receives.
Figure 9 shows the corresponding results for
A_DT and
A_NN. Both figures show that the choice of the feedback interval has no significant impact on the performance of the model-based fuzzers. However, similar to the impact of the feedback dimension, the feedback interval does impact the performance of
A_BASELINE. This shows that the performance of the
A_BASELINE fuzzer with a feedback interval of 500 triggers significantly more vulnerabilities than the performance of the
A_BASELINE fuzzer with a feedback interval of 10 (
p-value:
).
3.4. Distribution of Integer Values
We analyze the distribution of the Integer values the fuzzers choose during the fuzzing, in order to understand how the fuzzers perform their search for vulnerabilities.
Figure 10 shows the distribution of the signed Integer values chosen by the different fuzzers. We present representative runs for each of the fuzzers, while only showing one run for
A_SVM,
A_BASELINE, and
A_RANDOM for the sake of visibility. Note that the y-axis shows the full value range of a signed Integer. High resolution figures of these results were too big to be handled by most PDF readers, but can be generated using the code that accompanies the publication of our data.
Figure 10a,b shows that both
A_DT and
A_NN choose the signed Integer values in a strategic way, while
A_SVM,
A_BASELINE, and
A_RANDOM show a more random behavior (
Figure 10c–e).
A_DT still shows a quite high distribution of values, while
A_NN focuses on one region of values. Our additional evaluation of the distributions of the unsigned Integer value shows that these distributions are similar to the distributions of the signed Integer values, which is why we do not show these results graphically. Nevertheless, the code accompanying the publication of our data includes these figures.


