

Fusing Self-Attention and CoordConv to Improve the YOLOv5s Algorithm for Infrared Weak Target Detection

Abstract
:1. Introduction
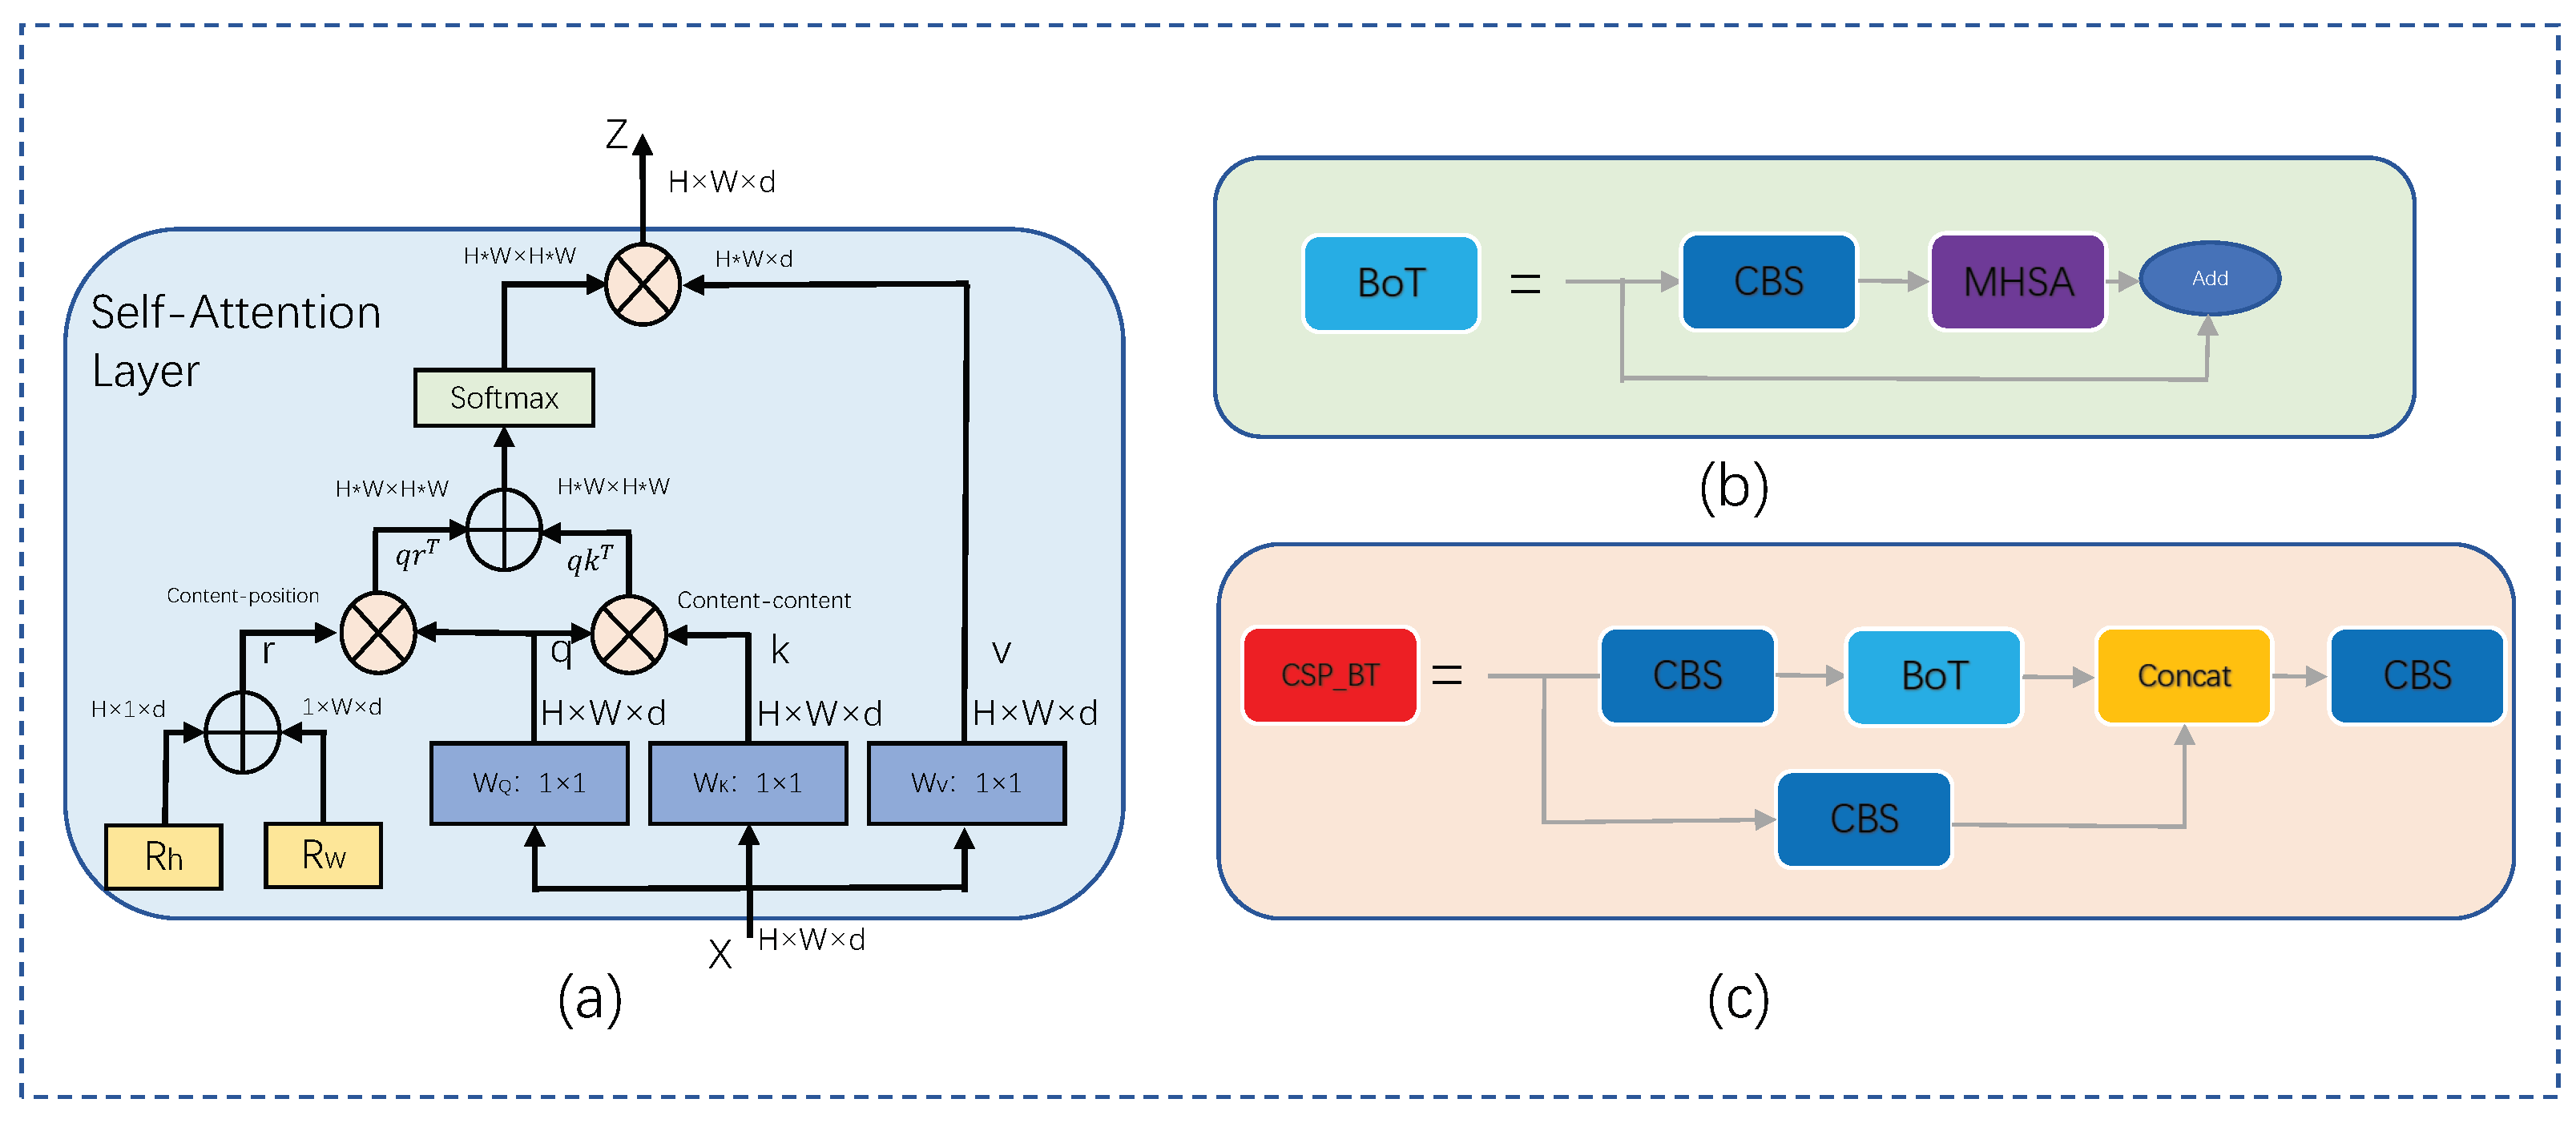
- Introducing the Bottleneck Transformer module in the backbone section of YOLOv5s using a multi-head self-attention mechanism to enhance the global modeling capabilities of detection networks;
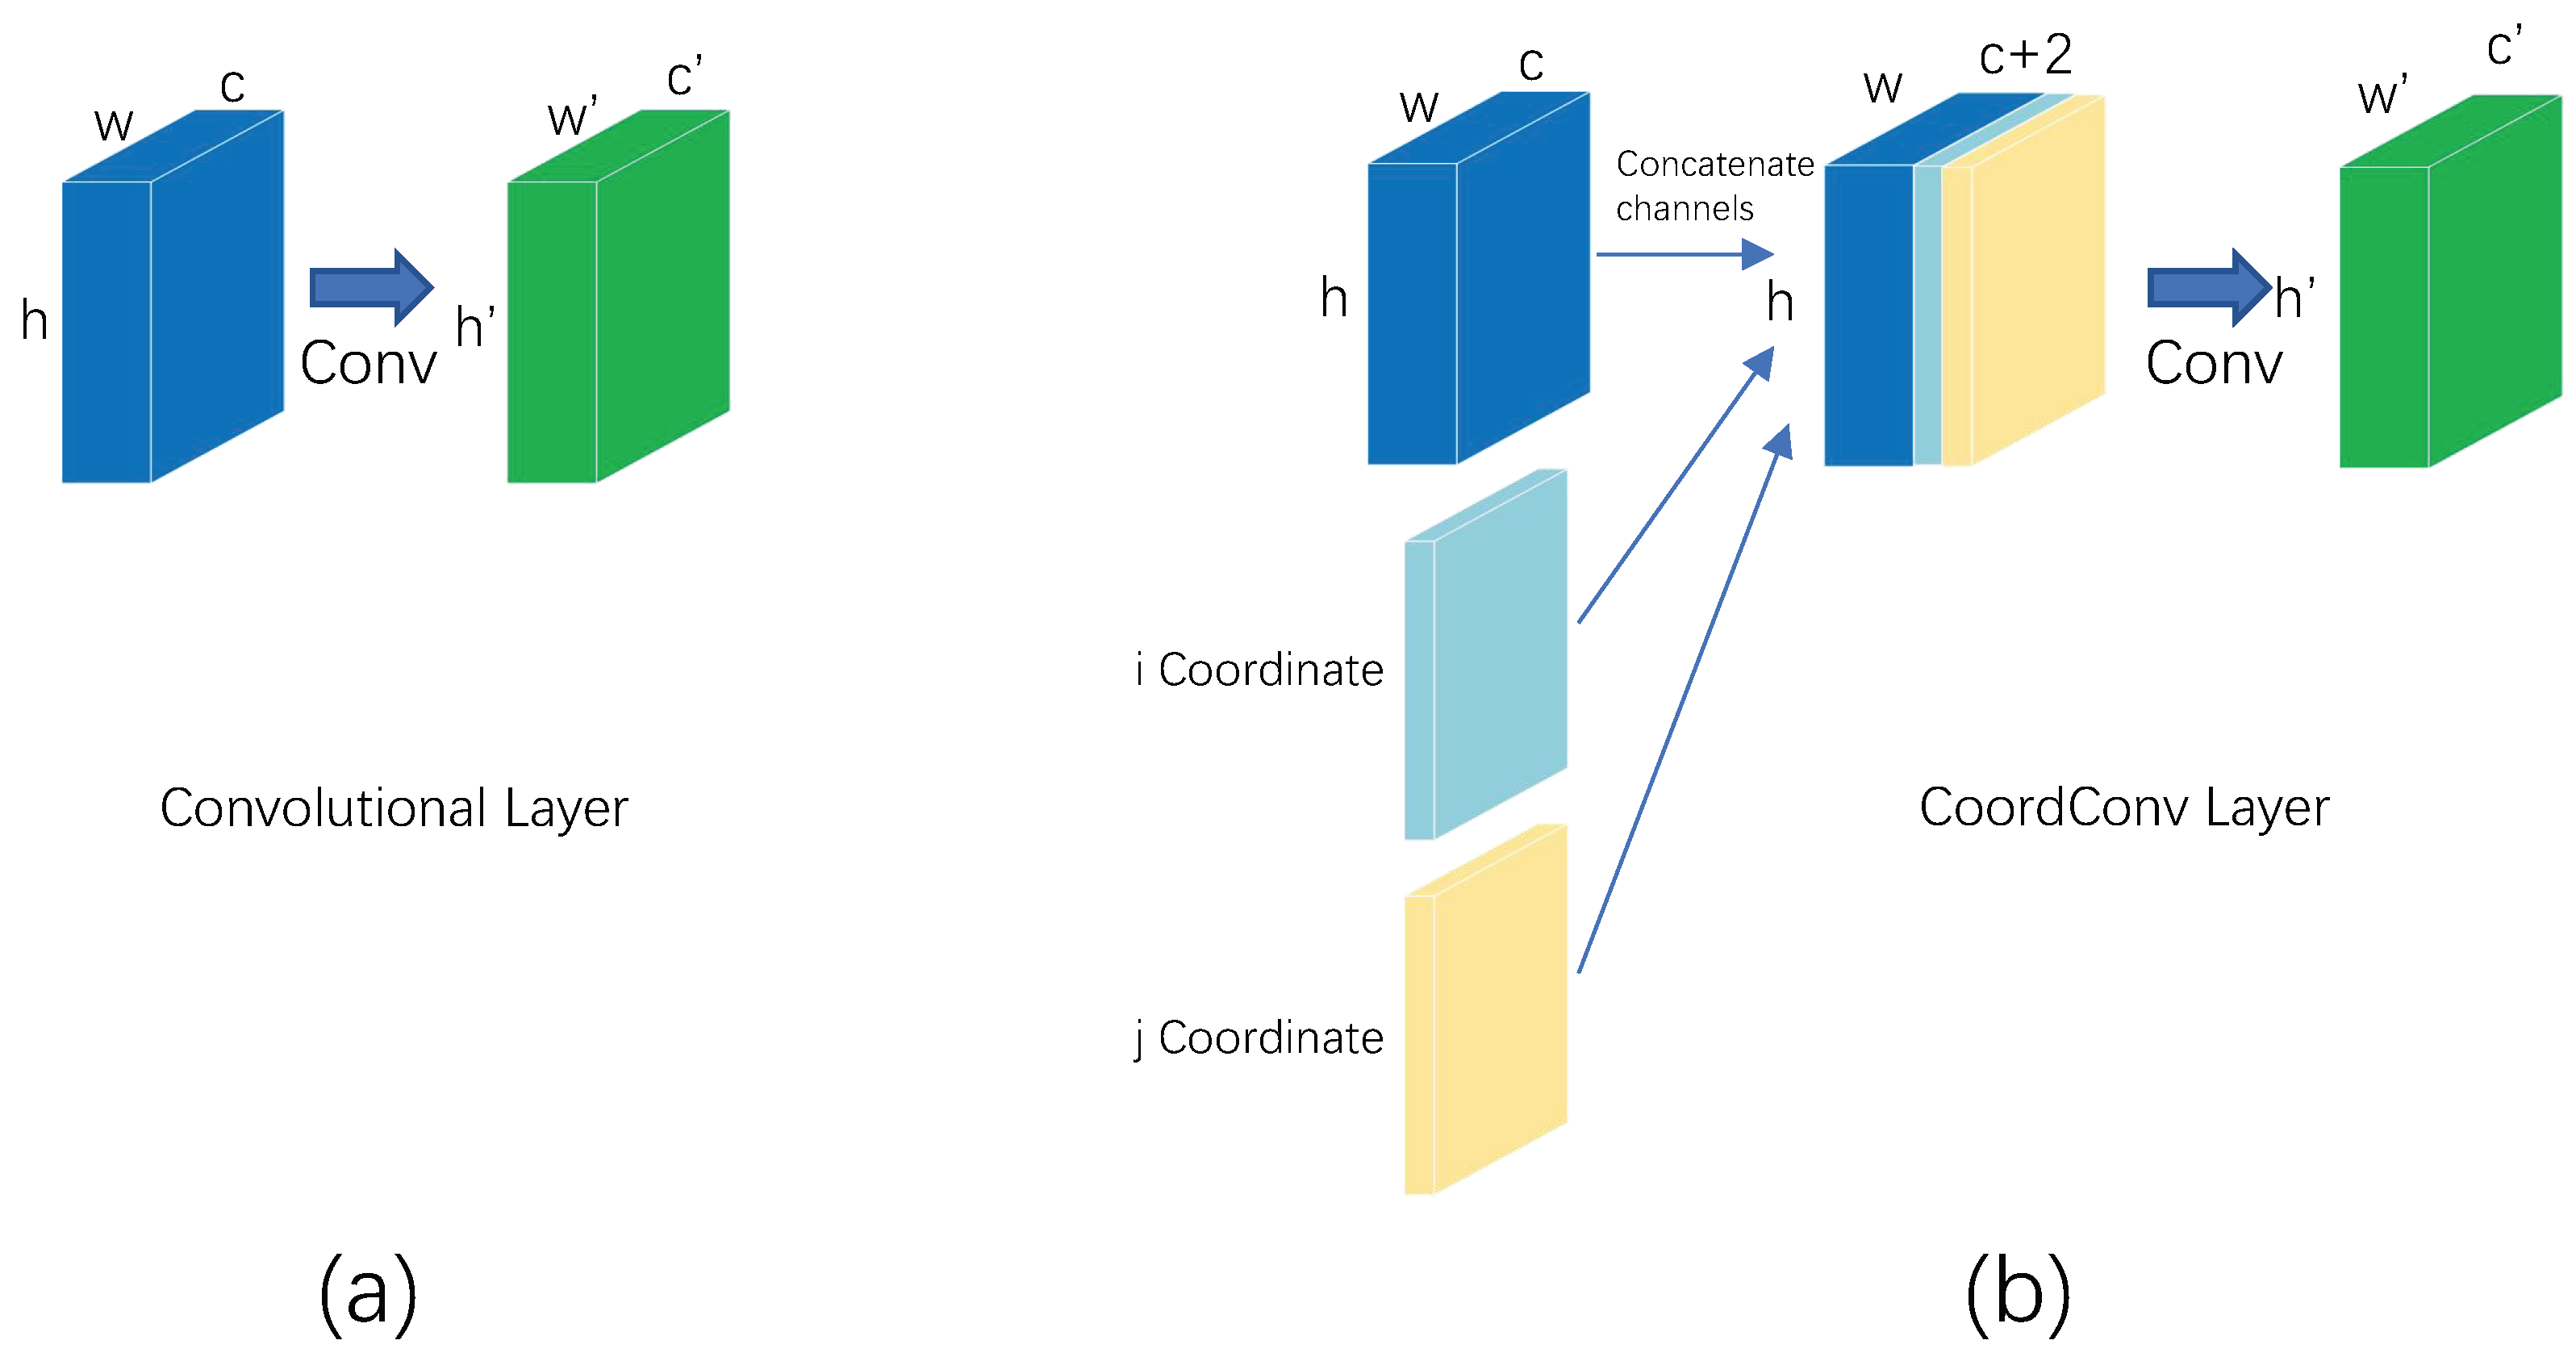
- Adding CoordConv to the Neck section of YOLOv5s using the coordinate channel allows the convolution to perceive the coordinates to some extent during the learning process, improving detection accuracy;
- Creating a two-dimensional Gaussian distribution in the target box to represent the importance of the pixel points using the normalized Gaussian Wasserstein distance instead of the CIOU as the similarity measure between the prediction frame and the true frame, effectively enhancing the weak target detection capability;
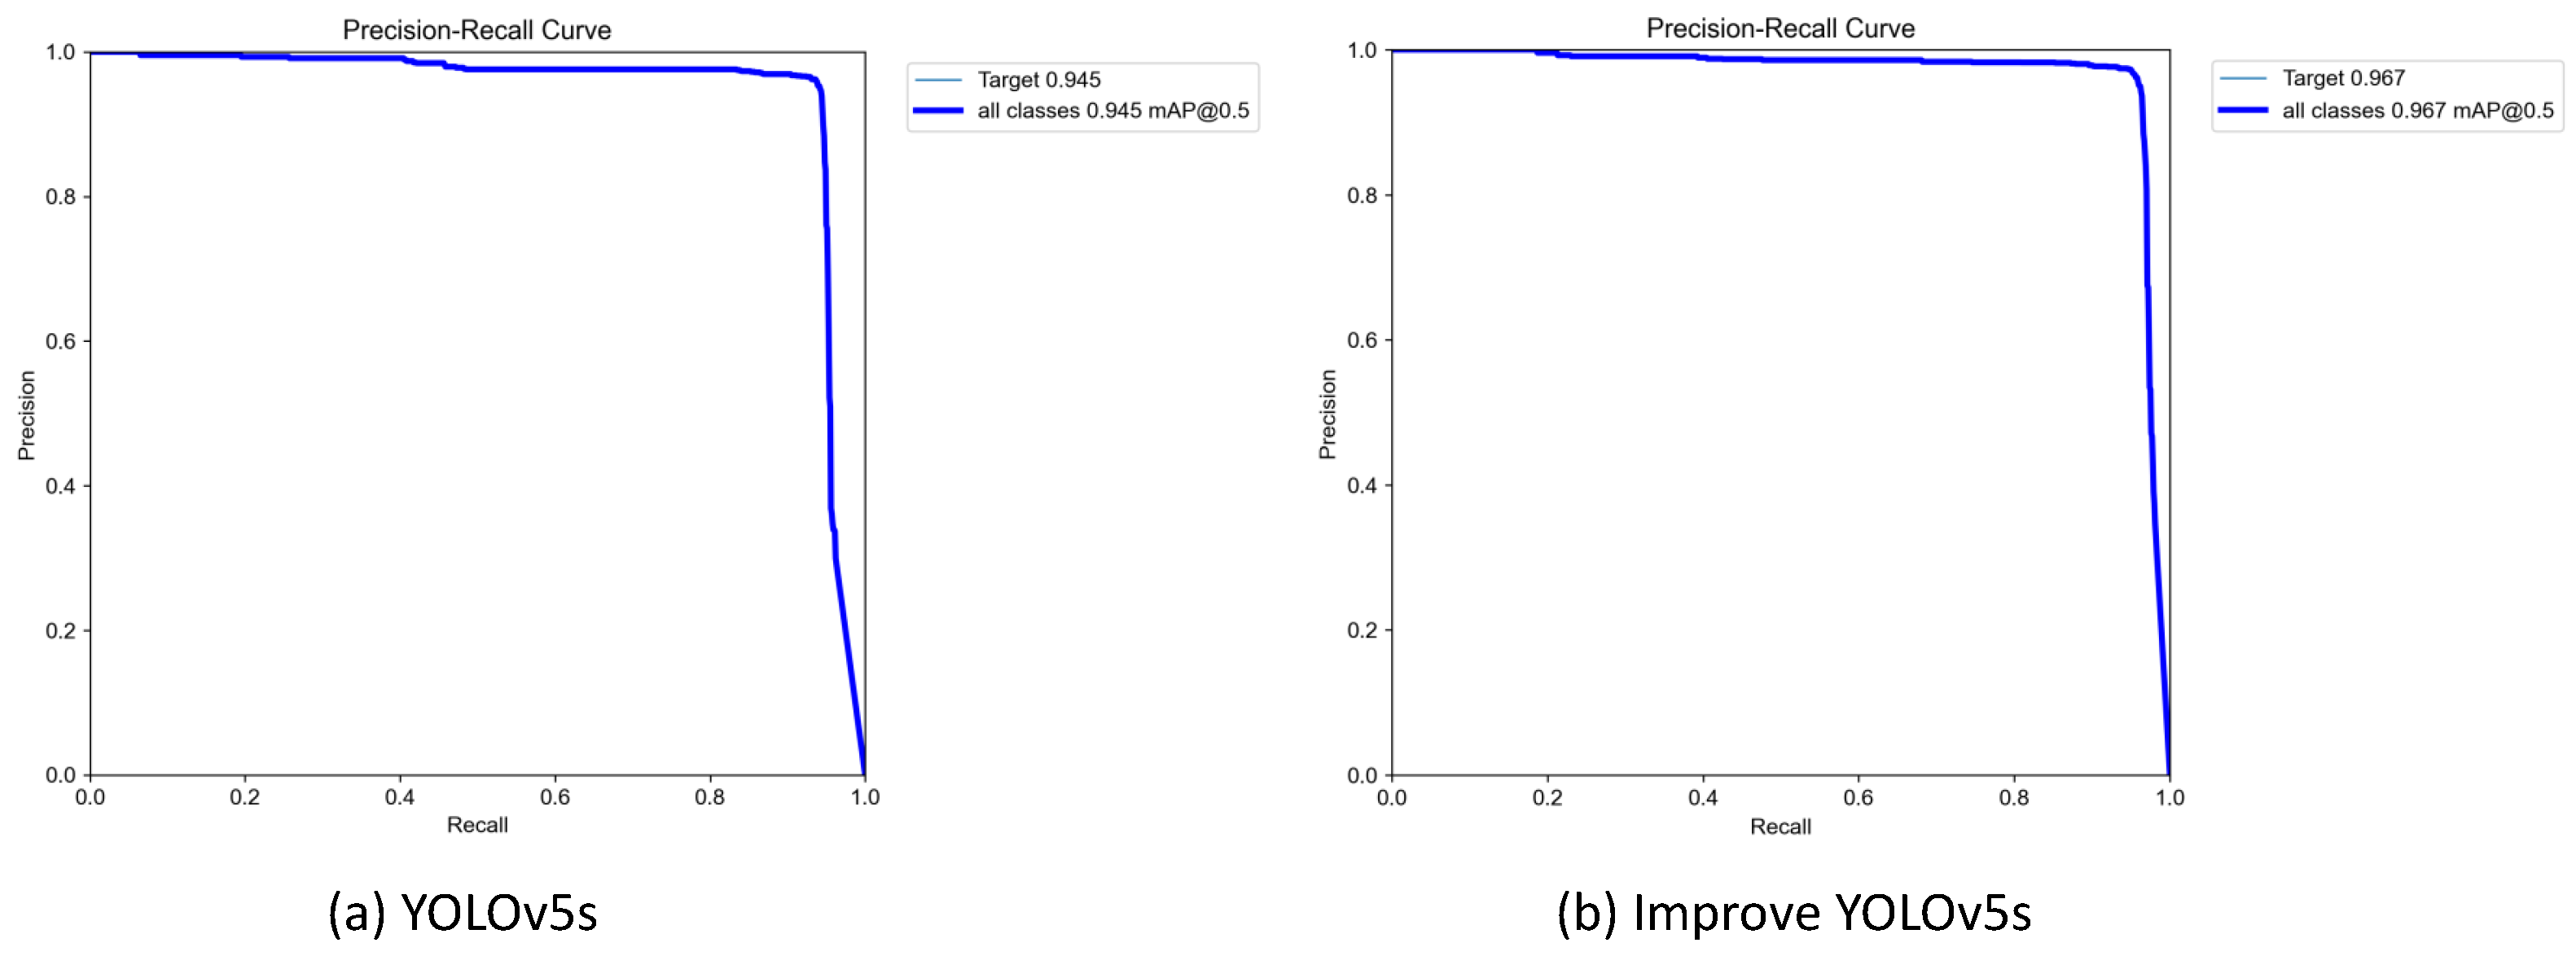
- In this paper, the improved YOLOv5s algorithm is experimentally compared with the lightweight algorithms YOLOv3-tiny, YOLOv4-tiny, YOLOv4s, PP-YOLOEs, YOLOv7-tiny, the algorithm in this paper performs better in terms of detection accuracy, with an mAP reaching 0.967.
2. Materials and Methods
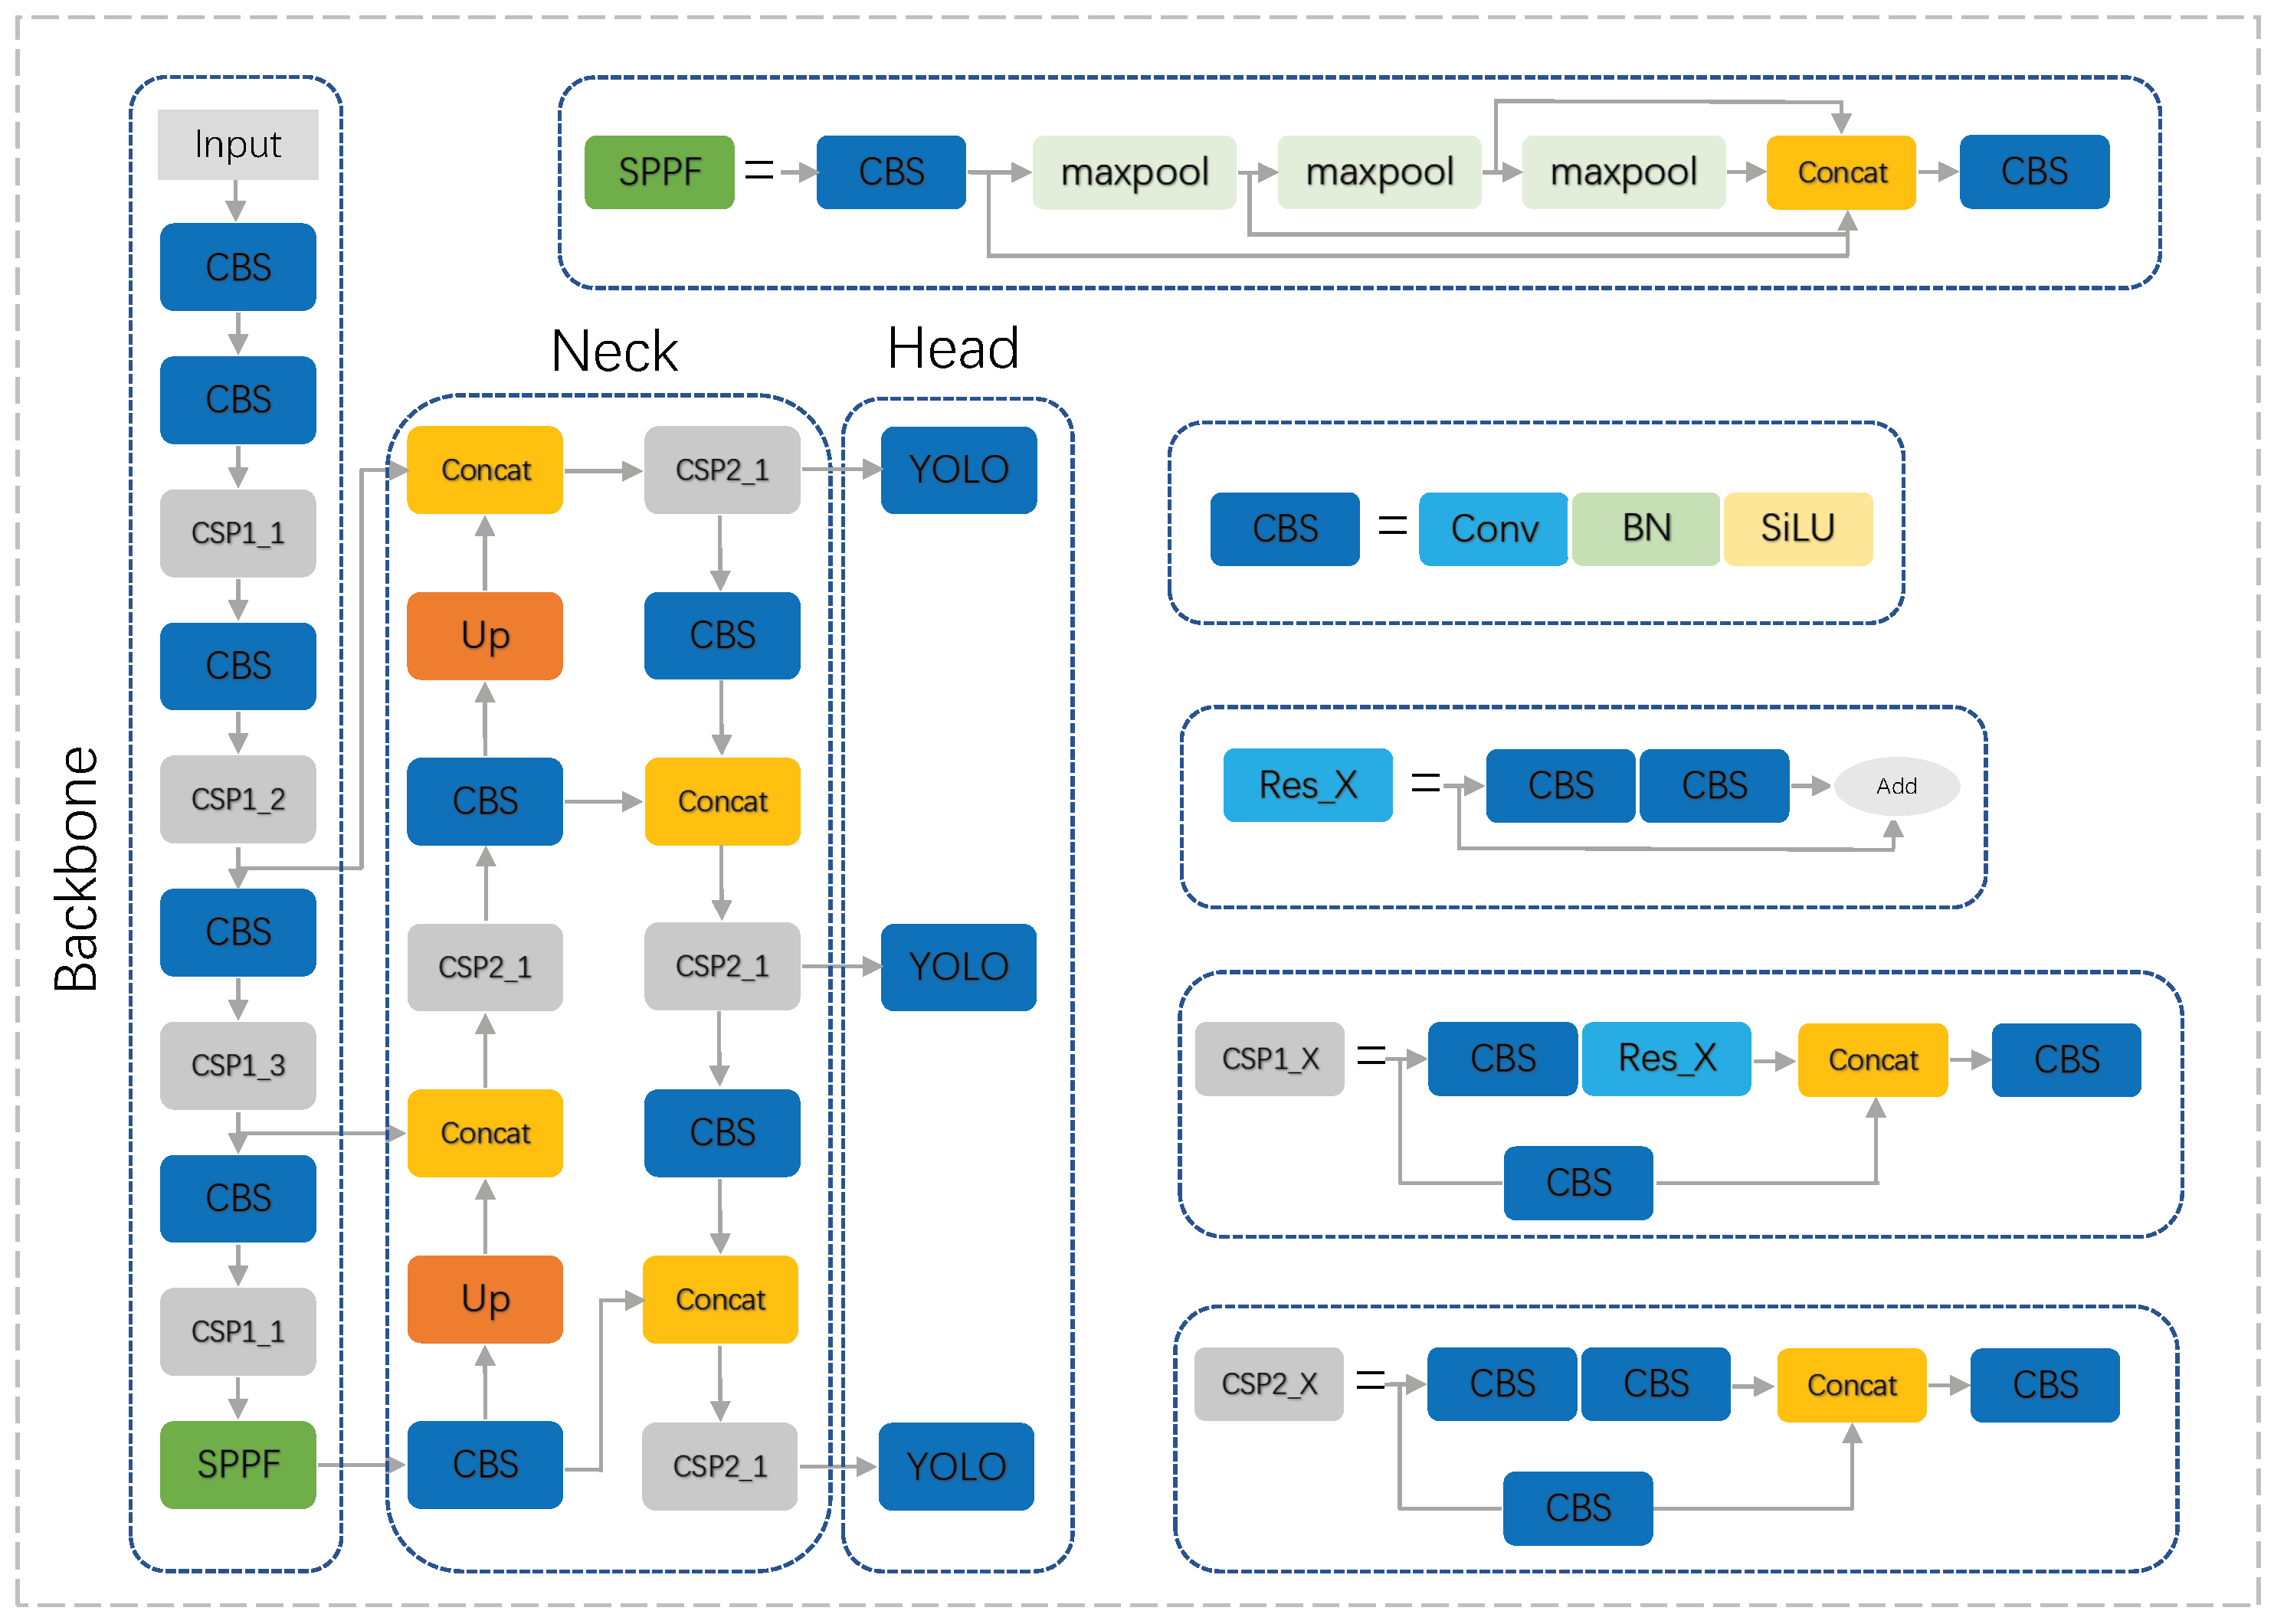
2.1. Yolov5 Target Detection Algorithm
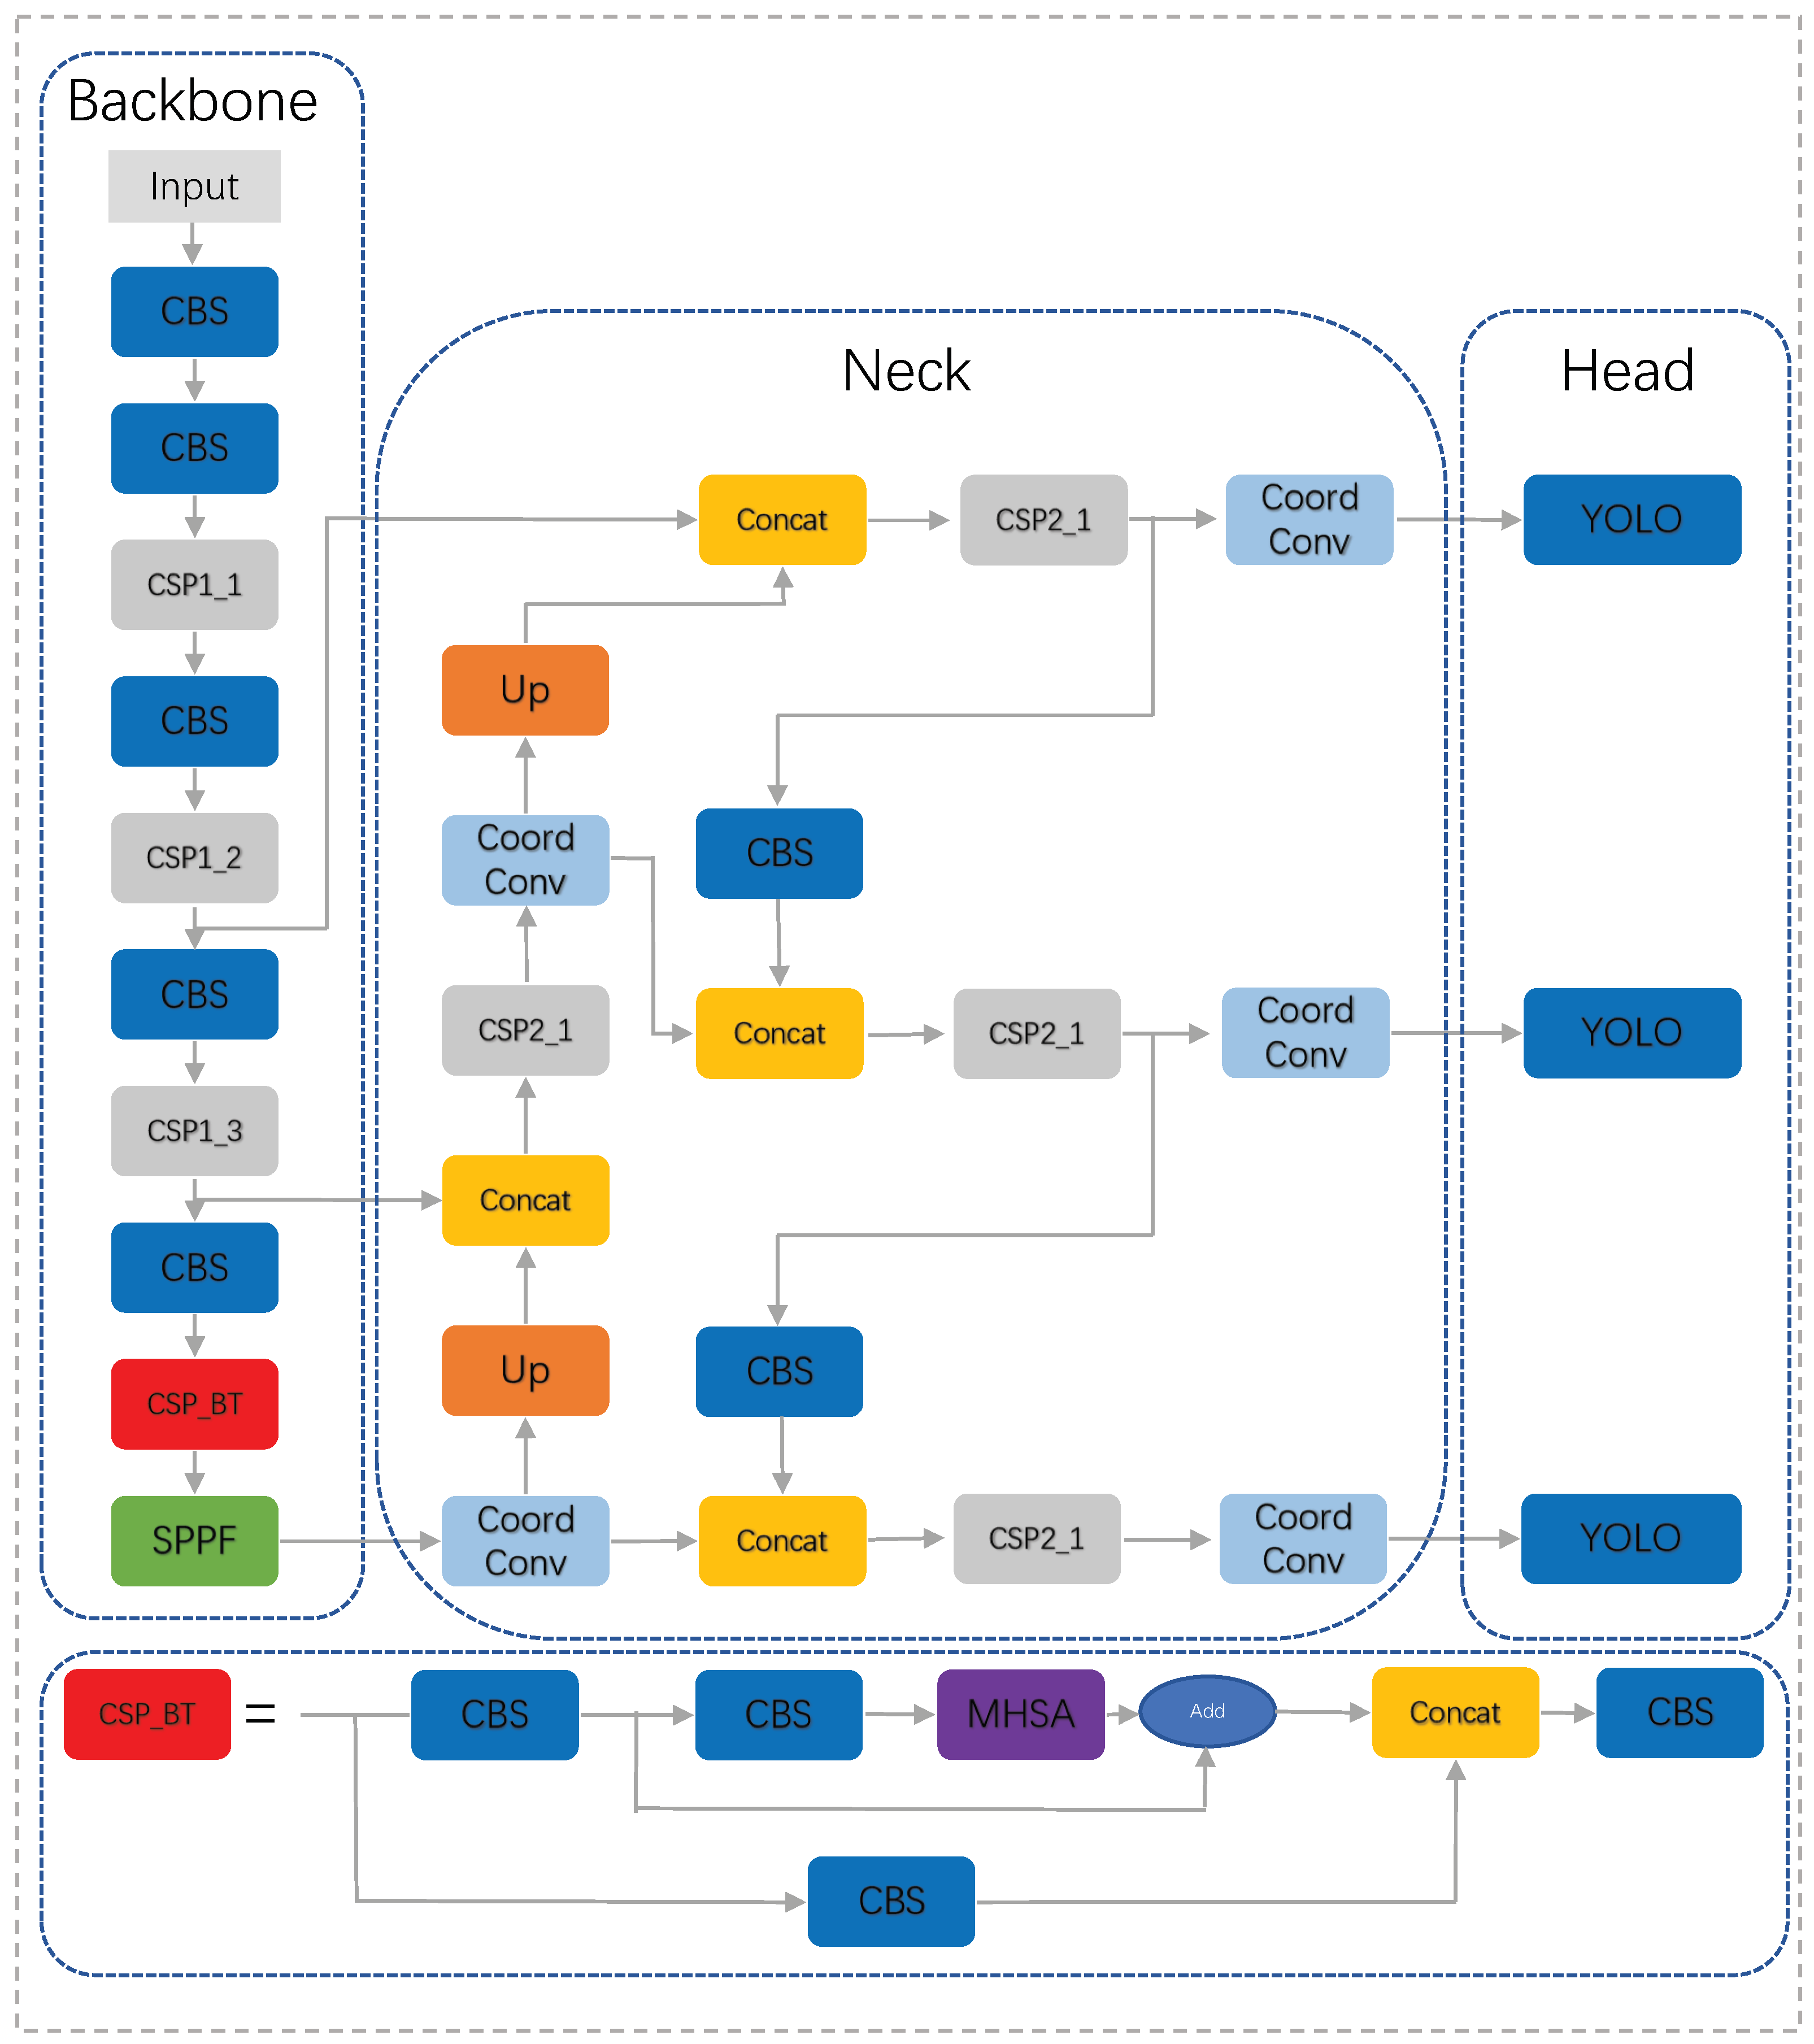
2.2. Improve Yolov5s
2.2.1. Bottleneck Transformer
2.2.2. CoordConv
2.2.3. Normalized Gaussian Wasserstein Distance
3. Results
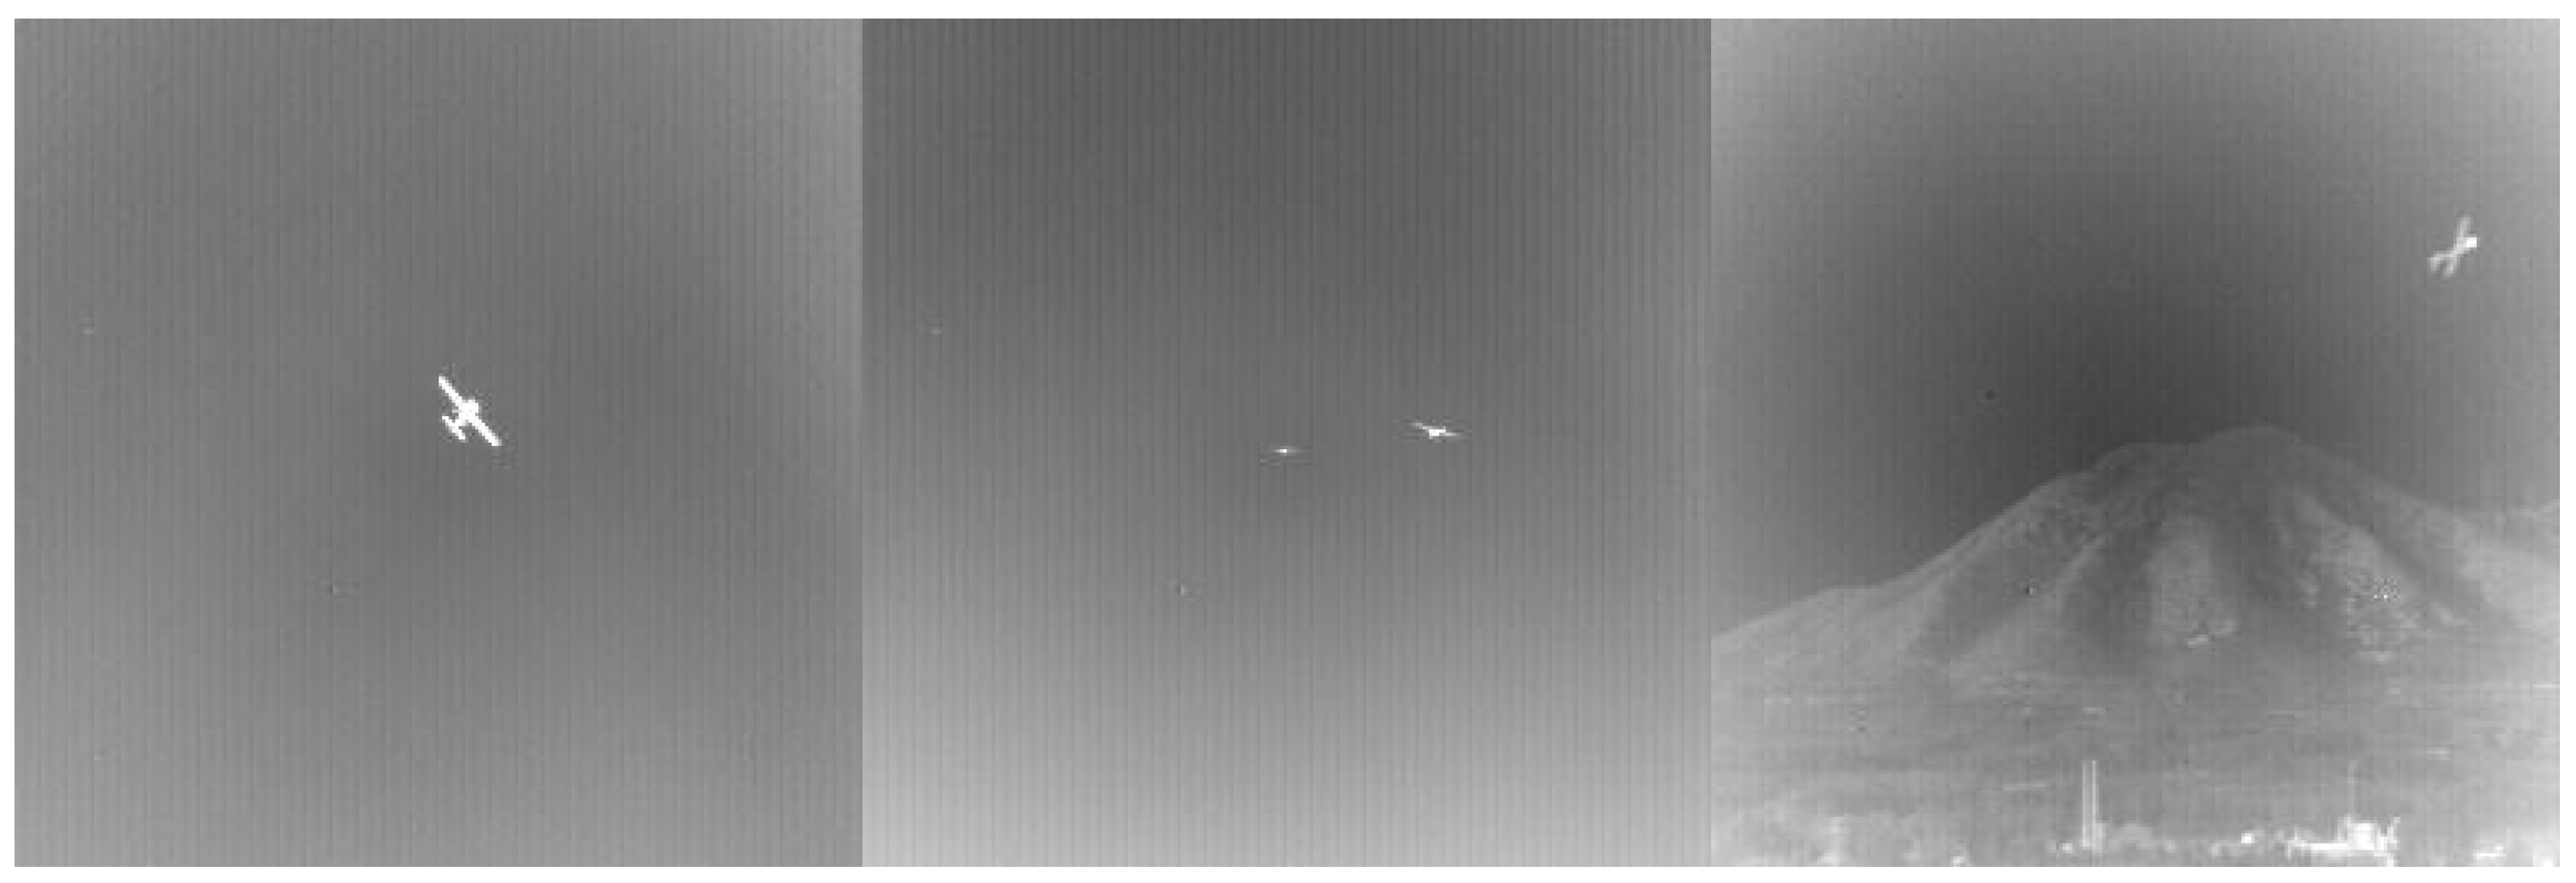
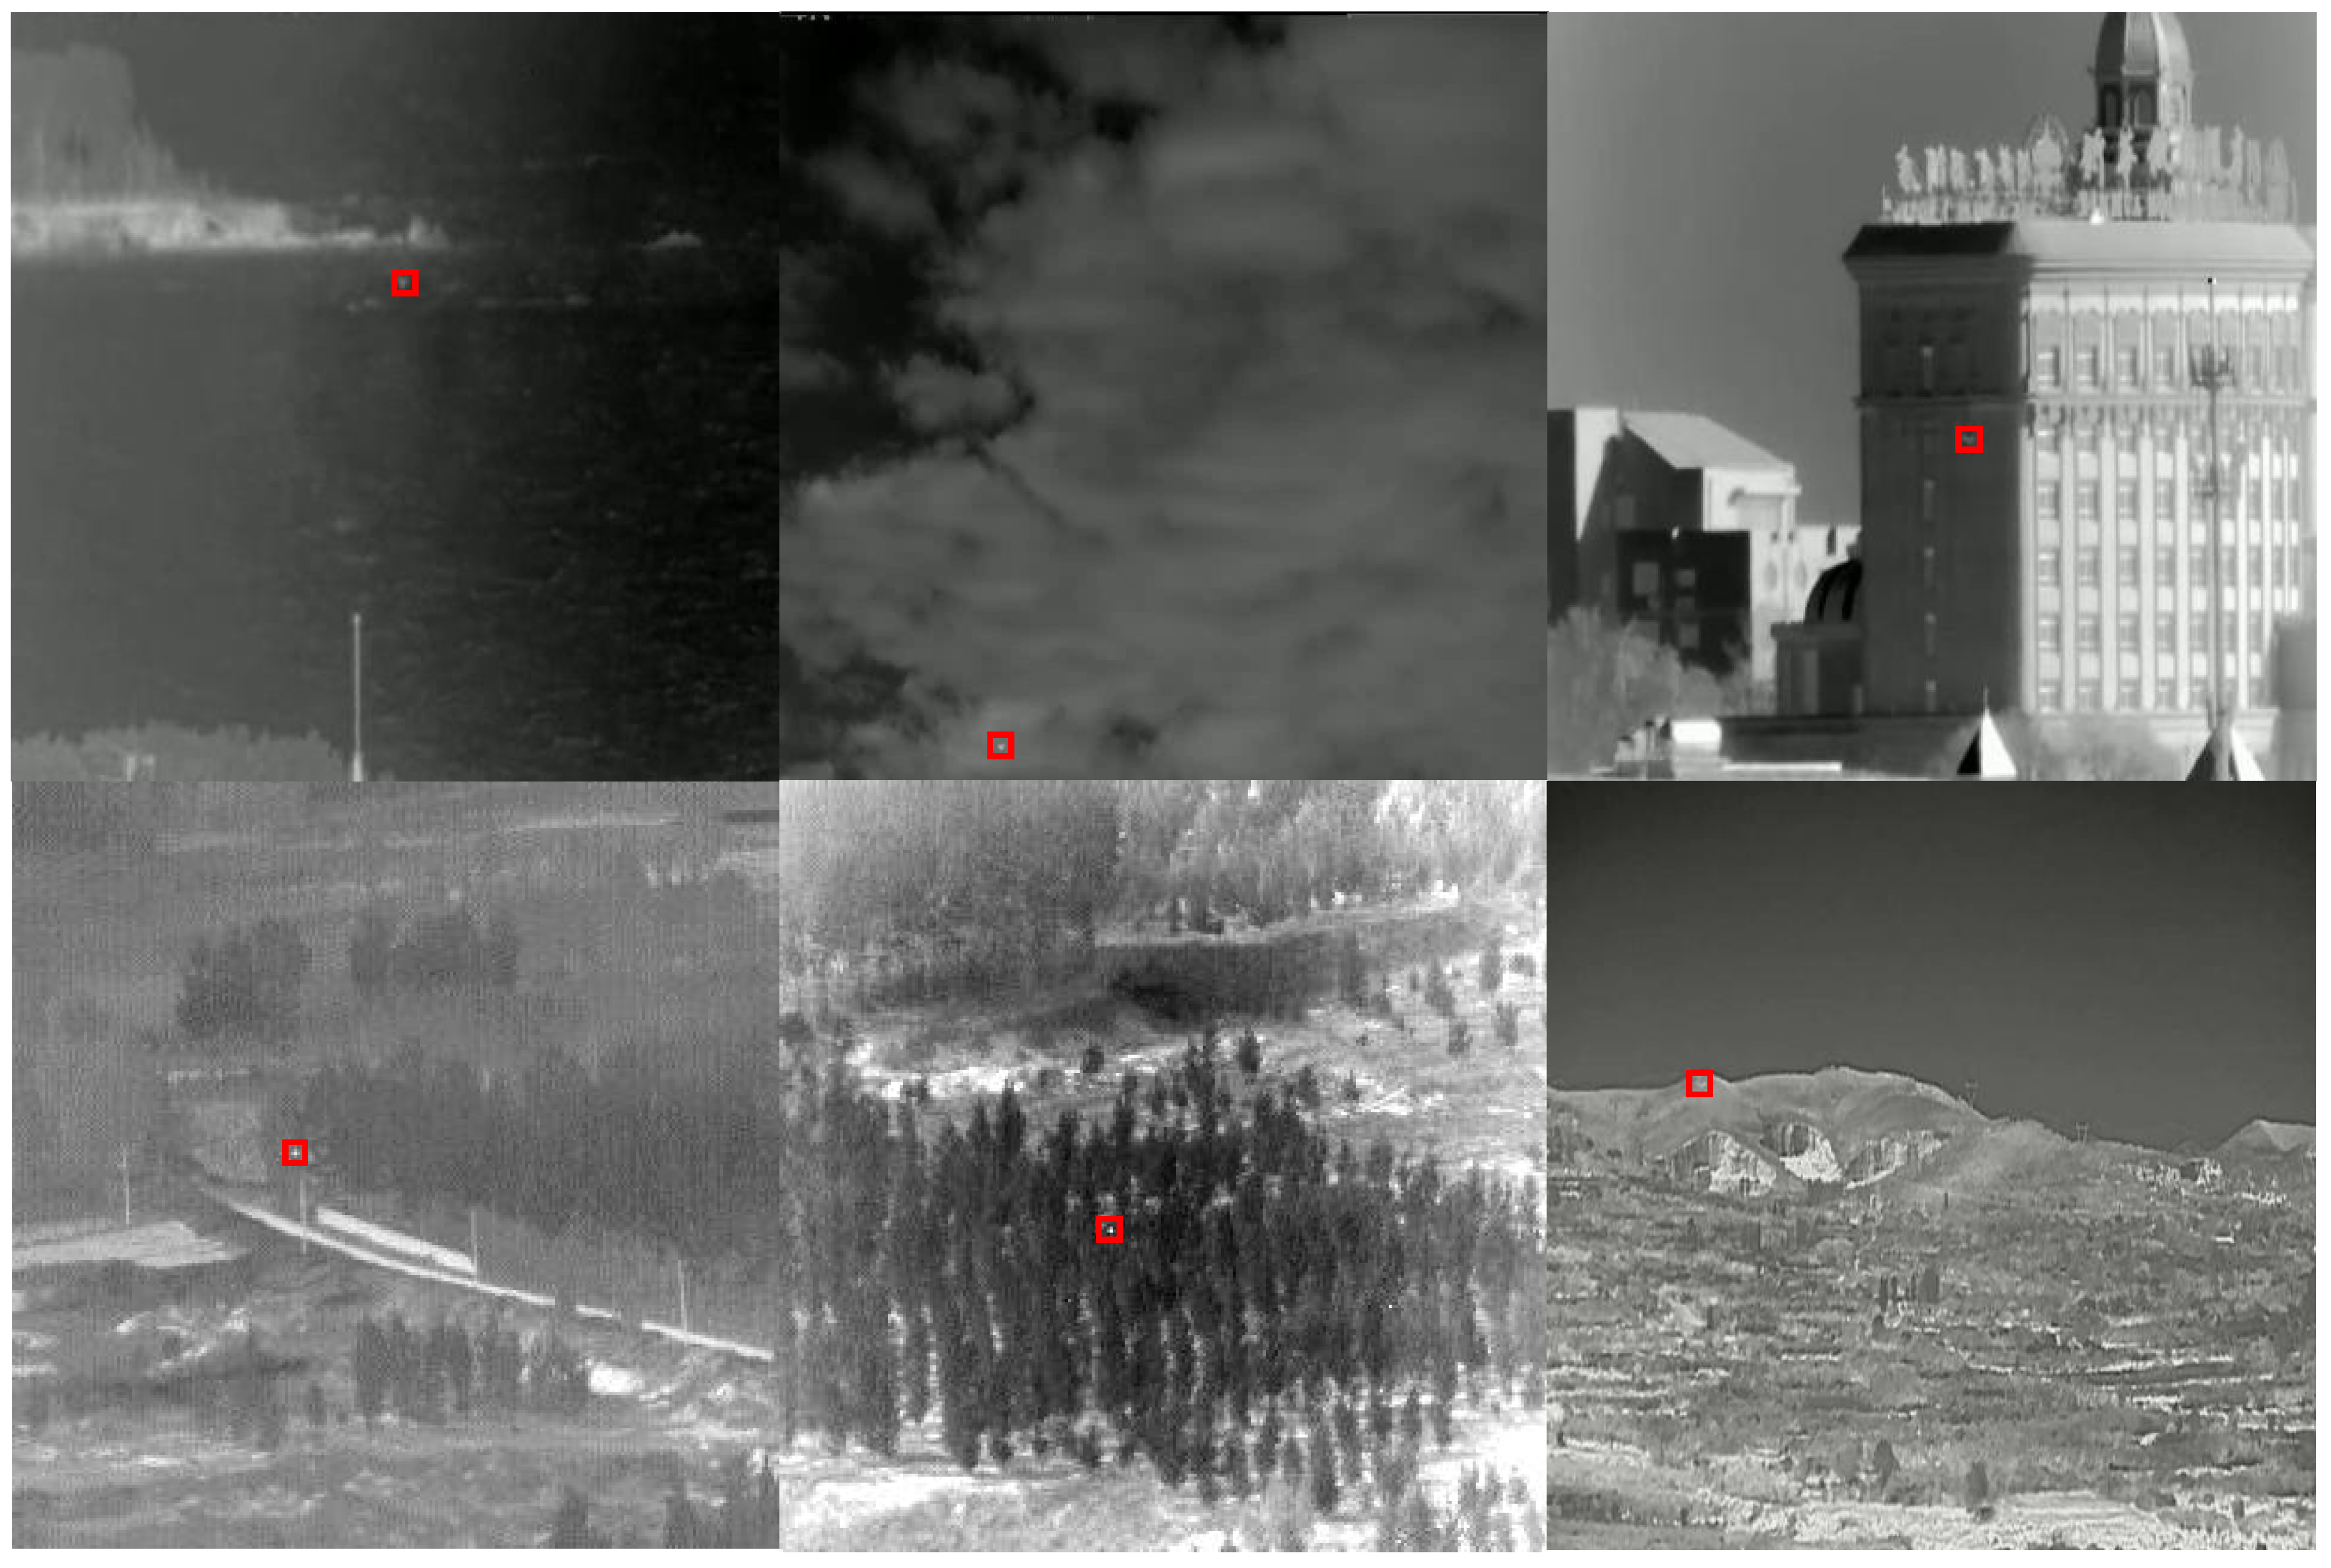
3.1. Dataset
3.2. Experimental Environment
3.3. Evaluation Metrics
3.4. Analysis of Results
3.4.1. Comparison of Different Algorithms
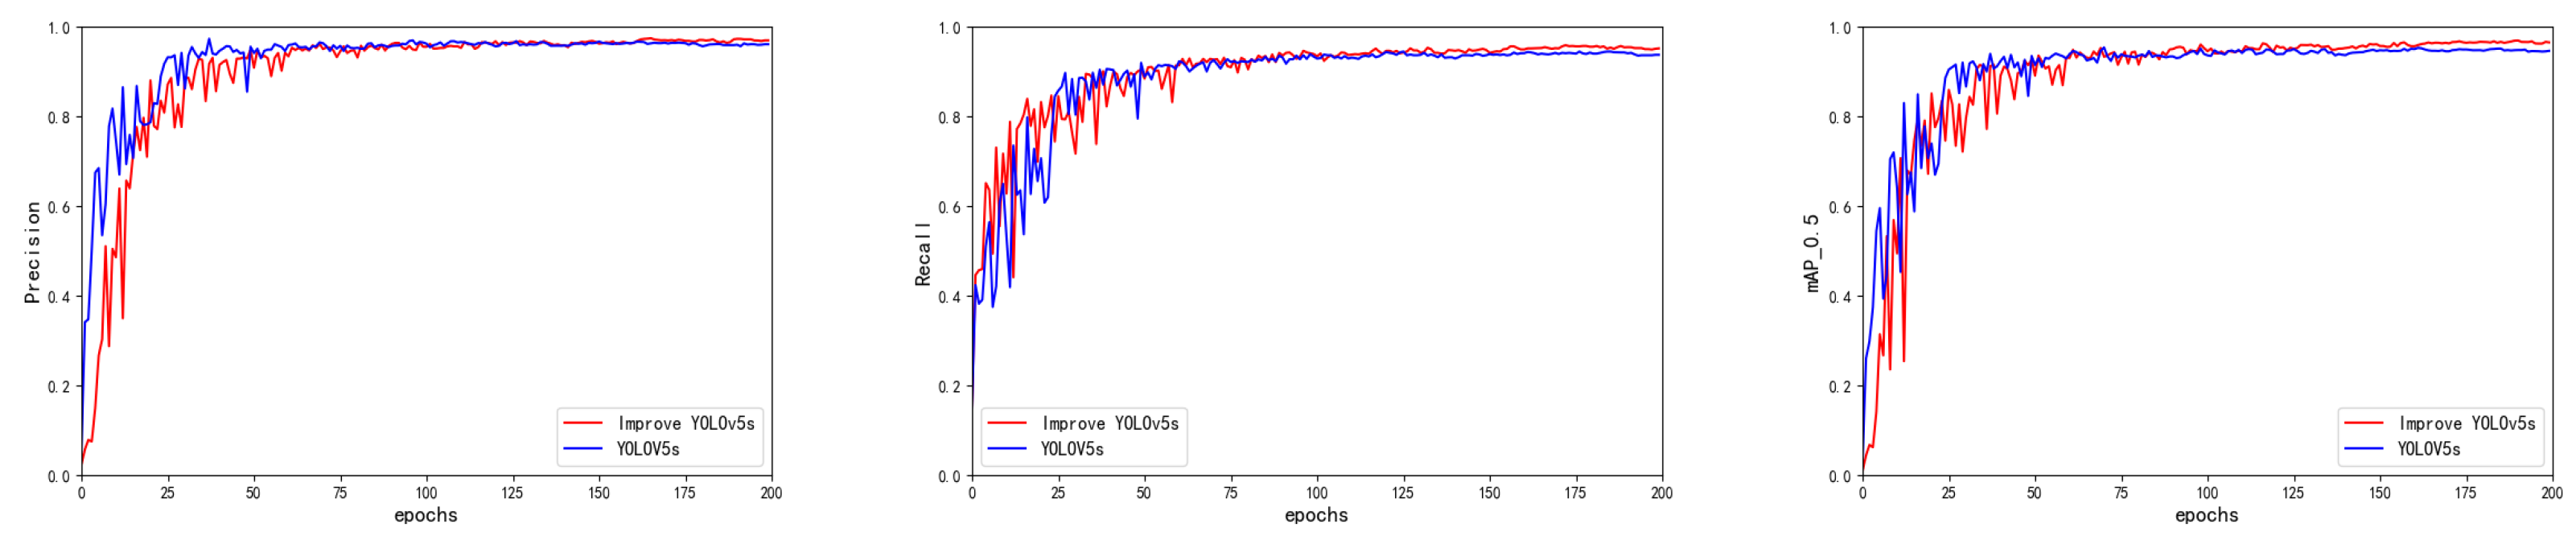
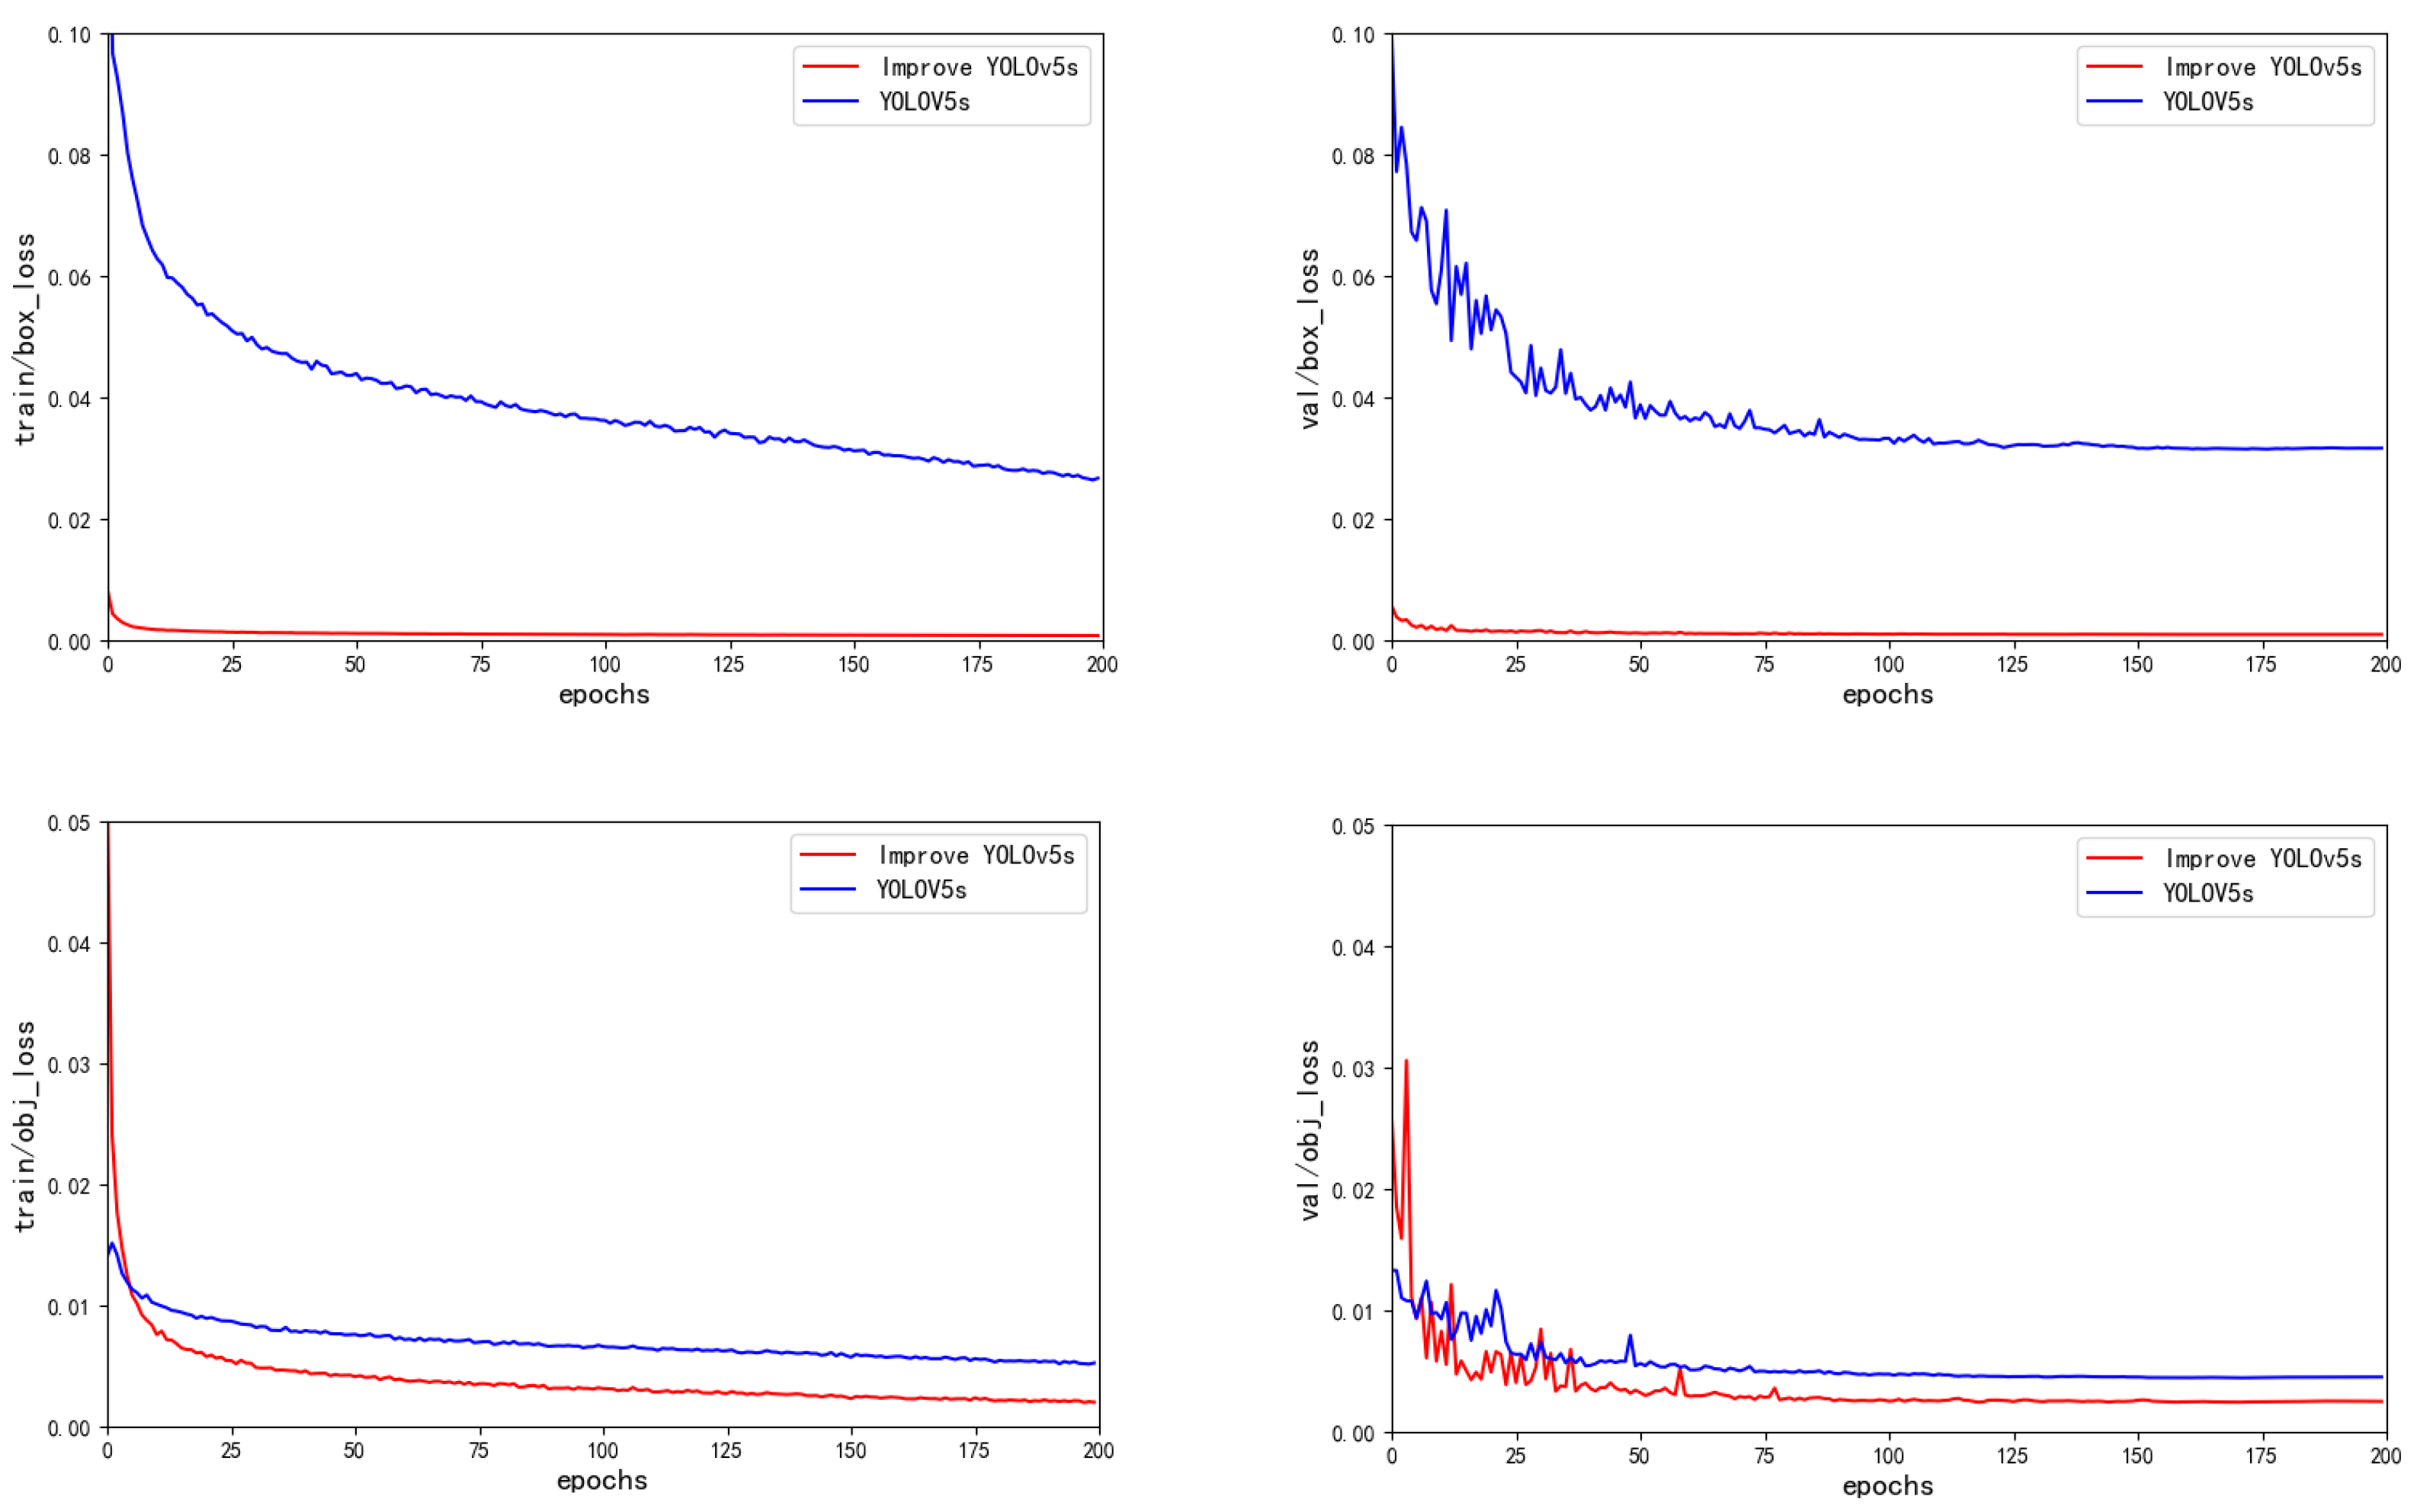
3.4.2. Performance Comparison
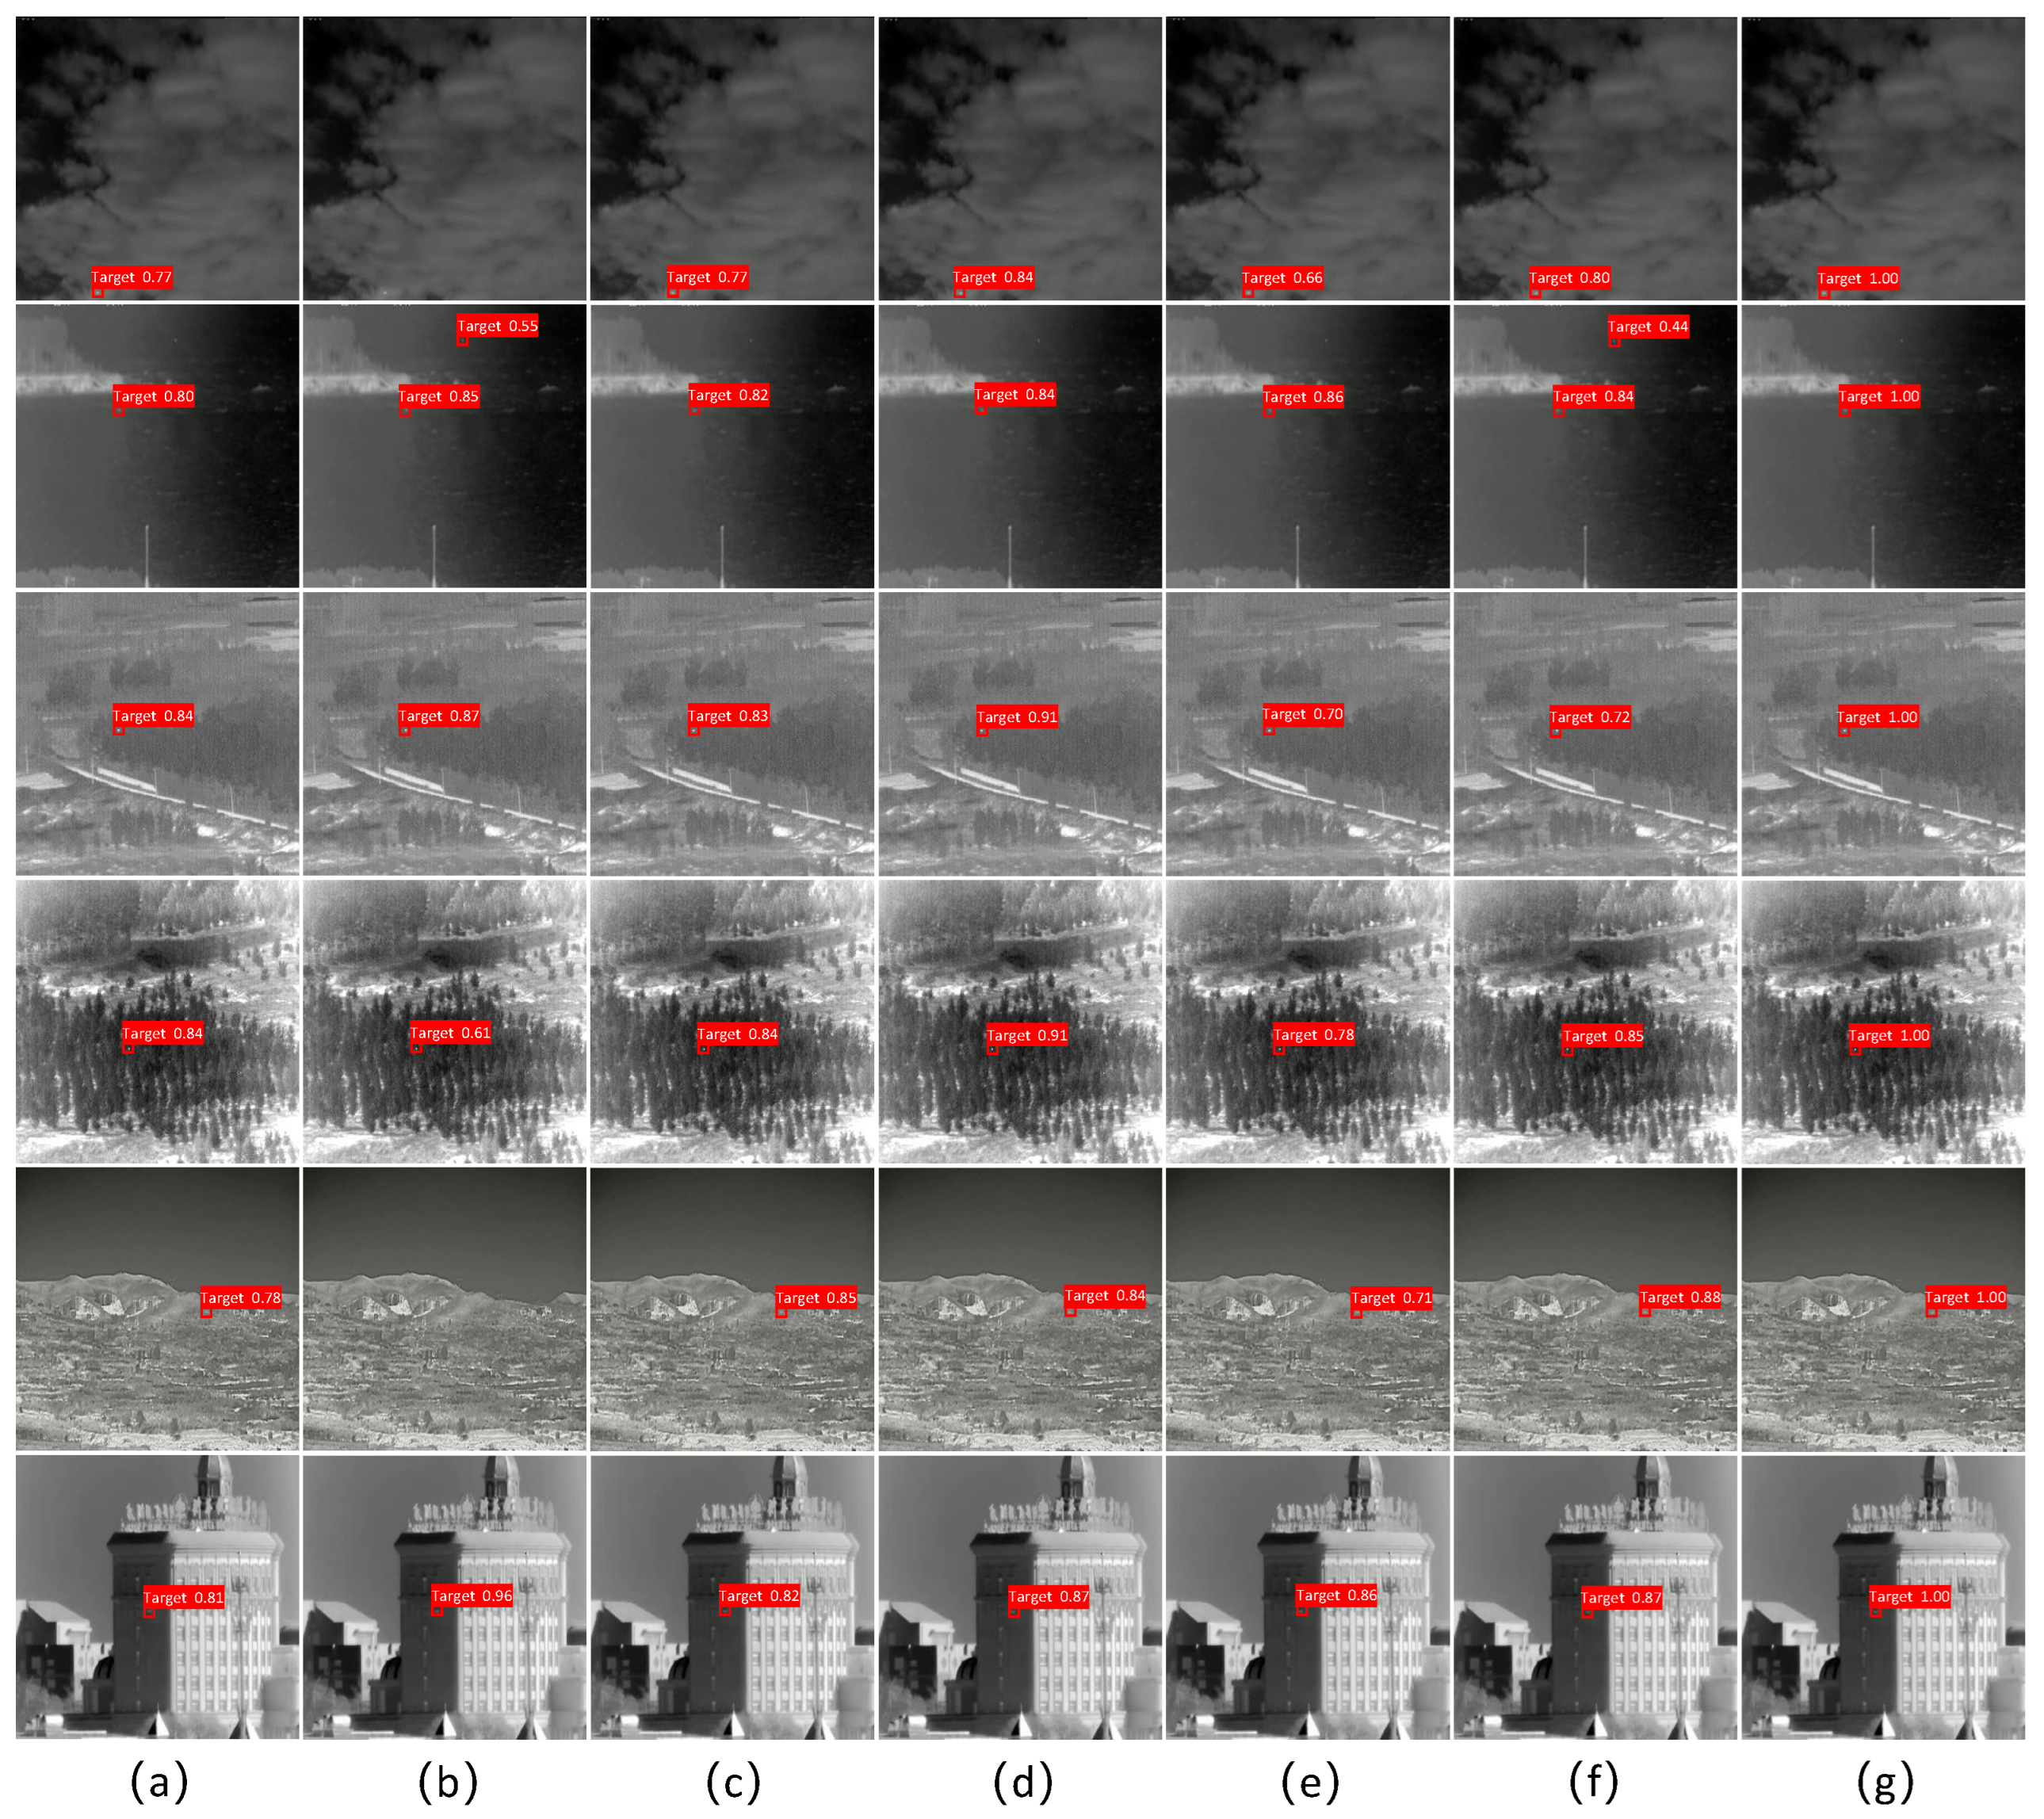
3.4.3. Comparison of Test Results
4. Conclusions
Author Contributions
Funding
Institutional Review Board Statement
Informed Consent Statement
Data Availability Statement
Conflicts of Interest
Abbreviations
| CSP | Cross-stage partial connection |
| NWD | Normalized Gaussian Wasserstein distance |
| MHSA | Multi-head self-attention |
| P-R | Precision-recall |
| mAP | Mean average precision |
References
- Liu, Y. Infrared Weak Target Detection Technology Research. Ph.D. Thesis, Northwestern Polytechnic University, Xi’an, China, 2006. [Google Scholar]
- Liu, D.; Huang, D. Infrared detection technology for military applications. Infrared Technol. 2003, 2, 1–3. [Google Scholar]
- Bae, T.W.; Zhang, F.; Kweon, I.S. Edge directional 2D LMS filter for infrared small target detection. Infrared Phys. Technol. 2012, 55, 137–145. [Google Scholar] [CrossRef]
- Deng, L.; Zhu, H.; Zhou, Q.; Li, Y. Adaptive top-hat filter based on quantum genetic algorithm for infrared small target detection. Multimed. Tools Appl. 2018, 77, 10539–10551. [Google Scholar] [CrossRef]
- Chen, C.P.; Li, H.; Wei, Y.; Xia, T.; Tang, Y.Y. A local contrast method for small infrared target detection. IEEE Trans. Geosci. Remote Sens. 2013, 52, 574–581. [Google Scholar] [CrossRef]
- Ren, X.; Wang, J.; Ma, T.; Zhu, X.; Bai, K.; Wang, J. Review on Infrared Dim and Small Target Detection Technology. J. Zhengzhou Univ. Nat. Sci. Ed. 2020, 52, 1–21. [Google Scholar]
- Xiong, Y.; Peng, J.X.; Ding, M.Y.; Xue, D.H. An extended track-before-detect algorithm for infrared target detection. IEEE Trans. Aerosp. Electron. Syst. 1997, 33, 1087–1092. [Google Scholar] [CrossRef]
- Guo, Q.; Li, Z.; Song, W.; Fu, W. Parallel computing based dynamic programming algorithm of track-before-detect. Symmetry 2018, 11, 29. [Google Scholar] [CrossRef] [Green Version]
- Li, M.; Liu, X.; Zhang, F.; Zhai, P. Multi target detection and tracking algorithm based on particle filtering and background subtraction. Appl. Res. Comput. 2018, 35, 2506–2509. [Google Scholar]
- Henghui, W.; Cao, D.; Zhao, Y.; Yang, Y. Survey of infrared dim and small target detection algorithm based on deep learning. Laser Infrared 2022, 52, 1274–1279. [Google Scholar]
- Girshick, R. Fast R-CNN. In Proceedings of the IEEE International Conference on Computer Vision, Santiago, Chile, 7–13 December 2015; pp. 1440–1448. [Google Scholar]
- Ren, S.; He, K.; Girshick, R.; Sun, J. Faster R-CNN: Towards Real-Time Object Detection with Region Proposal Networks. IEEE Trans. Pattern Anal. Mach. Intell. 2017, 39, 1137–1149. [Google Scholar] [CrossRef] [Green Version]
- Liu, W.; Anguelov, D.; Erhan, D.; Szegedy, C.; Reed, S.; Fu, C.Y.; Berg, A.C. SSD: Single shot multibox detector. In Proceedings of the Computer Vision–ECCV 2016: 14th European Conference, Amsterdam, The Netherlands, 11–14 October 2016; Proceedings, Part I 14. Springer: Berlin/Heidelberg, Germany, 2016; pp. 21–37. [Google Scholar]
- Redmon, J.; Divvala, S.; Girshick, R.; Farhadi, A. You only look once: Unified, real-time object detection. In Proceedings of the IEEE Conference on Computer Vision and Pattern Recognition, Las Vegas, NV, USA, 27–30 June 2016; pp. 779–788. [Google Scholar]
- Xu, X.; Zhang, X.; Zhang, T. Lite-yolov5: A lightweight deep learning detector for on-board ship detection in large-scene sentinel-1 sar images. Remote Sens. 2022, 14, 1018. [Google Scholar] [CrossRef]
- Hu, J.; Zhi, X.; Shi, T.; Zhang, W.; Cui, Y.; Zhao, S. PAG-YOLO: A portable attention-guided YOLO network for small ship detection. Remote Sens. 2021, 13, 3059. [Google Scholar] [CrossRef]
- Kim, M.; Jeong, J.; Kim, S. ECAP-YOLO: Efficient channel attention pyramid YOLO for small object detection in aerial image. Remote Sens. 2021, 13, 4851. [Google Scholar] [CrossRef]
- Ye, J.; Yuan, Z.; Qian, C.; Li, X. Caa-yolo: Combined-attention-augmented yolo for infrared ocean ships detection. Sensors 2022, 22, 3782. [Google Scholar] [CrossRef]
- Liu, Z.; Gao, Y.; Du, Q.; Chen, M.; Lv, W. YOLO-Extract: Improved YOLOv5 for Aircraft Object Detection in Remote Sensing Images. IEEE Access 2023, 11, 1742–1751. [Google Scholar] [CrossRef]
- Zhou, X.; Jiang, L.; Hu, C.; Lei, S.; Zhang, T.; Mou, X. YOLO-SASE: An Improved YOLO Algorithm for the Small Targets Detection in Complex Backgrounds. Sensors 2022, 22, 4600. [Google Scholar] [CrossRef]
- Mou, X.; Lei, S.; Zhou, X. YOLO-FR: A YOLOv5 Infrared Small Target Detection Algorithm Based on Feature Reassembly Sampling Method. Sensors 2023, 23, 2710. [Google Scholar] [CrossRef]
- Dai, J.; Zhao, X.; Li, L.; Liu, W.; Chu, X. Improve YOLOv5-based Infrared Dim-small Target Detection under Complex Background. Infrared Technol. 2022, 44, 504–512. [Google Scholar]
- Srinivas, A.; Lin, T.Y.; Parmar, N.; Shlens, J.; Abbeel, P.; Vaswani, A. Bottleneck transformers for visual recognition. In Proceedings of the IEEE/CVF Conference on Computer Vision and Pattern Recognition, Nashville, TN, USA, 20–25 June 2021; pp. 16519–16529. [Google Scholar]
- Liu, R.; Lehman, J.; Molino, P.; Petroski Such, F.; Frank, E.; Sergeev, A.; Yosinski, J. An intriguing failing of convolutional neural networks and the coordconv solution. Adv. Neural Inf. Process. Syst. 2018, 31, 9628–9639. [Google Scholar]
- Wang, J.; Xu, C.; Yang, W.; Yu, L. A normalized Gaussian Wasserstein distance for tiny object detection. arXiv 2021, arXiv:2110.13389. [Google Scholar]
- Hui, B.; Song, Z.; Fan, H.; Zhong, P.; Hu, W.; Zhang, X.; Ling, J.; Su, H.; Jin, W.; Zhang, Y.; et al. A dataset for infrared detection and tracking of dim-small aircraft targets under ground/air background. China Sci. Data 2020, 5, 291–302. [Google Scholar]


| Background | Woodland | Mountain | Sea | Sky | Roads | Architecture |
|---|---|---|---|---|---|---|
| Quantity | 1351 | 1439 | 427 | 348 | 823 | 970 |
| Platform | Configuration |
|---|---|
| Integrated development environment | PyCharm |
| Scripting language | Python3.9 |
| Operating system | Windows11 |
| CPU | I5-12400F |
| GPU | NVIDIA GeForce RTX3060 |
| Memory | 16G |
| CUDA | 11.7 |
| Parameter | Configuration |
|---|---|
| Optimizer | SGD |
| Learning rate | 0.01 |
| Momentum | 0.937 |
| Decay | 0.0005 |
| Epochs | 200 |
| Batch size | 32 |
| Methods | Precision | Recall | mAP0.5 | F1 | FPS | Parameters | GFLOPs |
|---|---|---|---|---|---|---|---|
| YOLO3-tiny | 0.948 | 0.912 | 0.93 | 0.93 | 204 | 8,666,692 | 12.9 |
| YOLOv4-tiny | 0.74 | 0.5 | 0.55 | 0.59 | 190 | 6,056,606 | 16.4 |
| YOLOv4s | 0.938 | 0.879 | 0.919 | 0.91 | 127 | 9,110,630 | 20.6 |
| YOLOv5s | 0.961 | 0.936 | 0.945 | 0.95 | 149 | 7,012,822 | 15.8 |
| PP-YOLOEs | 0.942 | 0.849 | 0.902 | 0.89 | 106 | 8,352,038 | 13.9 |
| YOLOv7-tiny | 0.941 | 0.86 | 0.905 | 0.9 | 163 | 6,007,596 | 13.0 |
| Our Method | 0.965 | 0.956 | 0.967 | 0.96 | 131 | 9,800,278 | 21.2 |
Disclaimer/Publisher’s Note: The statements, opinions and data contained in all publications are solely those of the individual author(s) and contributor(s) and not of MDPI and/or the editor(s). MDPI and/or the editor(s) disclaim responsibility for any injury to people or property resulting from any ideas, methods, instructions or products referred to in the content. |
© 2023 by the authors. Licensee MDPI, Basel, Switzerland. This article is an open access article distributed under the terms and conditions of the Creative Commons Attribution (CC BY) license (https://creativecommons.org/licenses/by/4.0/).
Share and Cite
Fan, X.; Ding, W.; Qin, W.; Xiao, D.; Min, L.; Yuan, H. Fusing Self-Attention and CoordConv to Improve the YOLOv5s Algorithm for Infrared Weak Target Detection. Sensors 2023, 23, 6755. https://doi.org/10.3390/s23156755
Fan X, Ding W, Qin W, Xiao D, Min L, Yuan H. Fusing Self-Attention and CoordConv to Improve the YOLOv5s Algorithm for Infrared Weak Target Detection. Sensors. 2023; 23(15):6755. https://doi.org/10.3390/s23156755
Chicago/Turabian StyleFan, Xiangsuo, Wentao Ding, Wenlin Qin, Dachuan Xiao, Lei Min, and Haohao Yuan. 2023. "Fusing Self-Attention and CoordConv to Improve the YOLOv5s Algorithm for Infrared Weak Target Detection" Sensors 23, no. 15: 6755. https://doi.org/10.3390/s23156755