
IoT Traffic Analyzer Tool with Automated and Holistic Feature Extraction Capability


Abstract
:1. Introduction
- Proposed a real-time and comprehensive network traffic generation framework for gathering and analyzing four IoT devices in a smart home environment. Such framework is comprehensive in the sense that it covers all different scenarios of collecting the IoT traffic that goes from the IoT device to its cloud server or/and from the IoT device to other IoT device/s within the same domain and vice versa.
- Built an innovative multi-task IoT traffic analyzer tool that holistically analyzes pre-collected IoT network traffic both on flow and pact levels and extracts all possible IoT network features, including statistical and header feature sets from different network layers.
- Classified and group the extracted features into three different CSV files, then explain each feature’s importance, usage, and usefulness. For example, features that identify: the behavior or profiling of the IoT device, or if there is any interaction between the human and the IoT device, between the IoT device and its cloud, or between the IoT device and other IoT device/s, or identify the attack as well as the attack type.
2. Literature Review
2.1. Extracting Features Methodology

| Paper Name | Objectives | Method of Implementation | Features |
|---|---|---|---|
| 1—Device Identification Based on Communication Analysis for the Internet of Things [15] | Developed a method of device identification that identifies the type and model of devices on the basis of general communication information. It determines the type and model of devices by calculating the similarity of features extracted from their network packets. | (1) Acquisition of communication information: extract header information from the
communication packet, which expresses characteristics of devices (2) Extraction of communication features: By adding an element of time, single header information becomes more effective for device identification and intercept of the primary approximate curve within each certain period. The maximum, minimum, and average values express the existence or absence of the burst of the communication packet transmitted and received. (3) calculation of similarity by communication Features: If a device has connected to the network at least once, its communication features are stored in the database. If no type or model has a similarity higher than the certain threshold, the device identifier determines that the target device is a new device in the network. | 1—packet length 2—TCP port 3—element of time Within each certain period: 4—the maximum value 5—the minimum value 6—the average value 7—the slope Network layer: 8—packet length 9—time to live (TTL) Transport layer: 10—TCP window size Application layer: 11—HTTP header |
| 2—Behavioral fingerprinting of Internet-of-Things devices [16] | Profiles a device based on information available about the device, generates a robust, verifiable, and unique identity for the device, and establishes some guidelines regarding the device’s operations. | (1) In the first step, the fingerprinting device or tool is strategically placed to capture the relevant information required to fingerprint
a device (2) In the second step, the relevant features essential to represent the device fingerprint are either recorded from the information or inferred with the help of transformations like FFT (3) in the fingerprint generation/registration, the fingerprint generation step encodes the features from the previous step and records them against the device’s identifier. Depending on the type of fingerprint recognition algorithm used, this step stores the identified fingerprints differently. (4) Final step, the fingerprint recognition algorithm validates or “reidentifies” a device’s run-time fingerprint against the stored fingerprints with the help of a similarity measurement technique. | 1—flow volume, 2—flow duration, 3—average flow rate, 4—device sleep time, 5—number of server ports visited, 6—number of distinct DNS queries, 7—number of NTP queries 8—number of SSL/TLS cipher suites used. |
| 3—ProfilIoT: A Machine Learning Approach for IoT Device Identification Based on Network Traffic Analysis [14] | for accurate identification of IoT devices connected to a network. The goal is to determine whether the traffic belongs to a PC, a smartphone, or a specific (known) IoT device. | (1) The TCP packets were first converted by the feature extractor tool [4] to sessions. (2) Then, each session was represented by a vector of features from the network, transport, and application layers. | 1—source and destination IP addresses 2—port numbers from SYN to FIN). |
| 4—Automated IoT Device Identification using Network Traffic [17] | To automatically classify the IoT devices using TCP/IP packets. | the IoT devices using TCP/IP packets ML algorithms (DT, K48, OneR, PART) to classify device type GA to determine the most unique features from the network, transport, and application layer | |
| 5-Detection of Unauthorized IoT Devices Using Machine Learning Techniques [18] | To identify IoT device types from the whitelist. | 1—ttl_min: TCP packet 2—time-to-live, minimum 3—ttl_B_min: TCP packet time-to-live sent by server 4—ttl_firstQ: TCP packet time-to-live, quartile 1 5—ttl_avg: TCP packet time-to-live, average 6—ttl_B_thirdQ: TCP packet time-to-live sent by server, quartile 3 7—ttl_B_median: TCP packet time-to-live sent by server, median 8—ttl_B_firstQ: TCP packet time-to-live sent by server, quartile 1 9—ssl_dom_server_name_alexaRank: Alexa Rank of dominated SSL server 10—bytes_A_B_ratio: Ratio between the number of bytes sent and received 11—reset: Total packets with RST flag 12—http_dom_host_alexaRank: Dominated host Alexa rank 13—ttl_thirdQ: TCP packet time-to-live, quartile 3 14—ttl_max: TCP packet time-to-live, maximum 15—ttl_B_var: TCP packet time-to-live sent by server, variance | |
| 6—Classifying IoT Devices in Smart Environments Using Network Traffic Characteristics [20] | 1—flow volume, 2—flow duration, 3—average flow rate, 4—device sleep time, 5—server port numbers, 6—DNS queries, 7—NTP queries 8—cipher suites | ||
| 7—Automated IoT Device Identification Based on Full Packet Information Using Real-Time Network Traffic [19] | To identify the device using device profiling | header information, sensor measurements, and statistical features Packet headers were captured using Pyshark, and the nominated header features have been stored in header-DB. | A—Network layer: 1—‘length’ 2—‘time_to_live’ B—Transport layer: 1—‘source_port’ 2—‘stream_index’ 3—‘length’ 4—‘sequence_number’ 5—next_sequence_number’ 6—‘header_length’ 7—‘window_size_value’ 8—‘window_size’ 9—window_size_scalefactor’ 10—‘options’ 11—‘analysis_initial_rtt’ 12—‘analysis_bytes_in_flight’ 13—‘analysis_push_bytes_sent’ 14—‘time_relative’ 15—‘time_delta’ C- Application layer: ‘content-length’ D—Statistics: 1—Flow duration 2—Inter-arrival time |
2.2. Dataset Collection
3. Methodology
3.1. Framework Environment
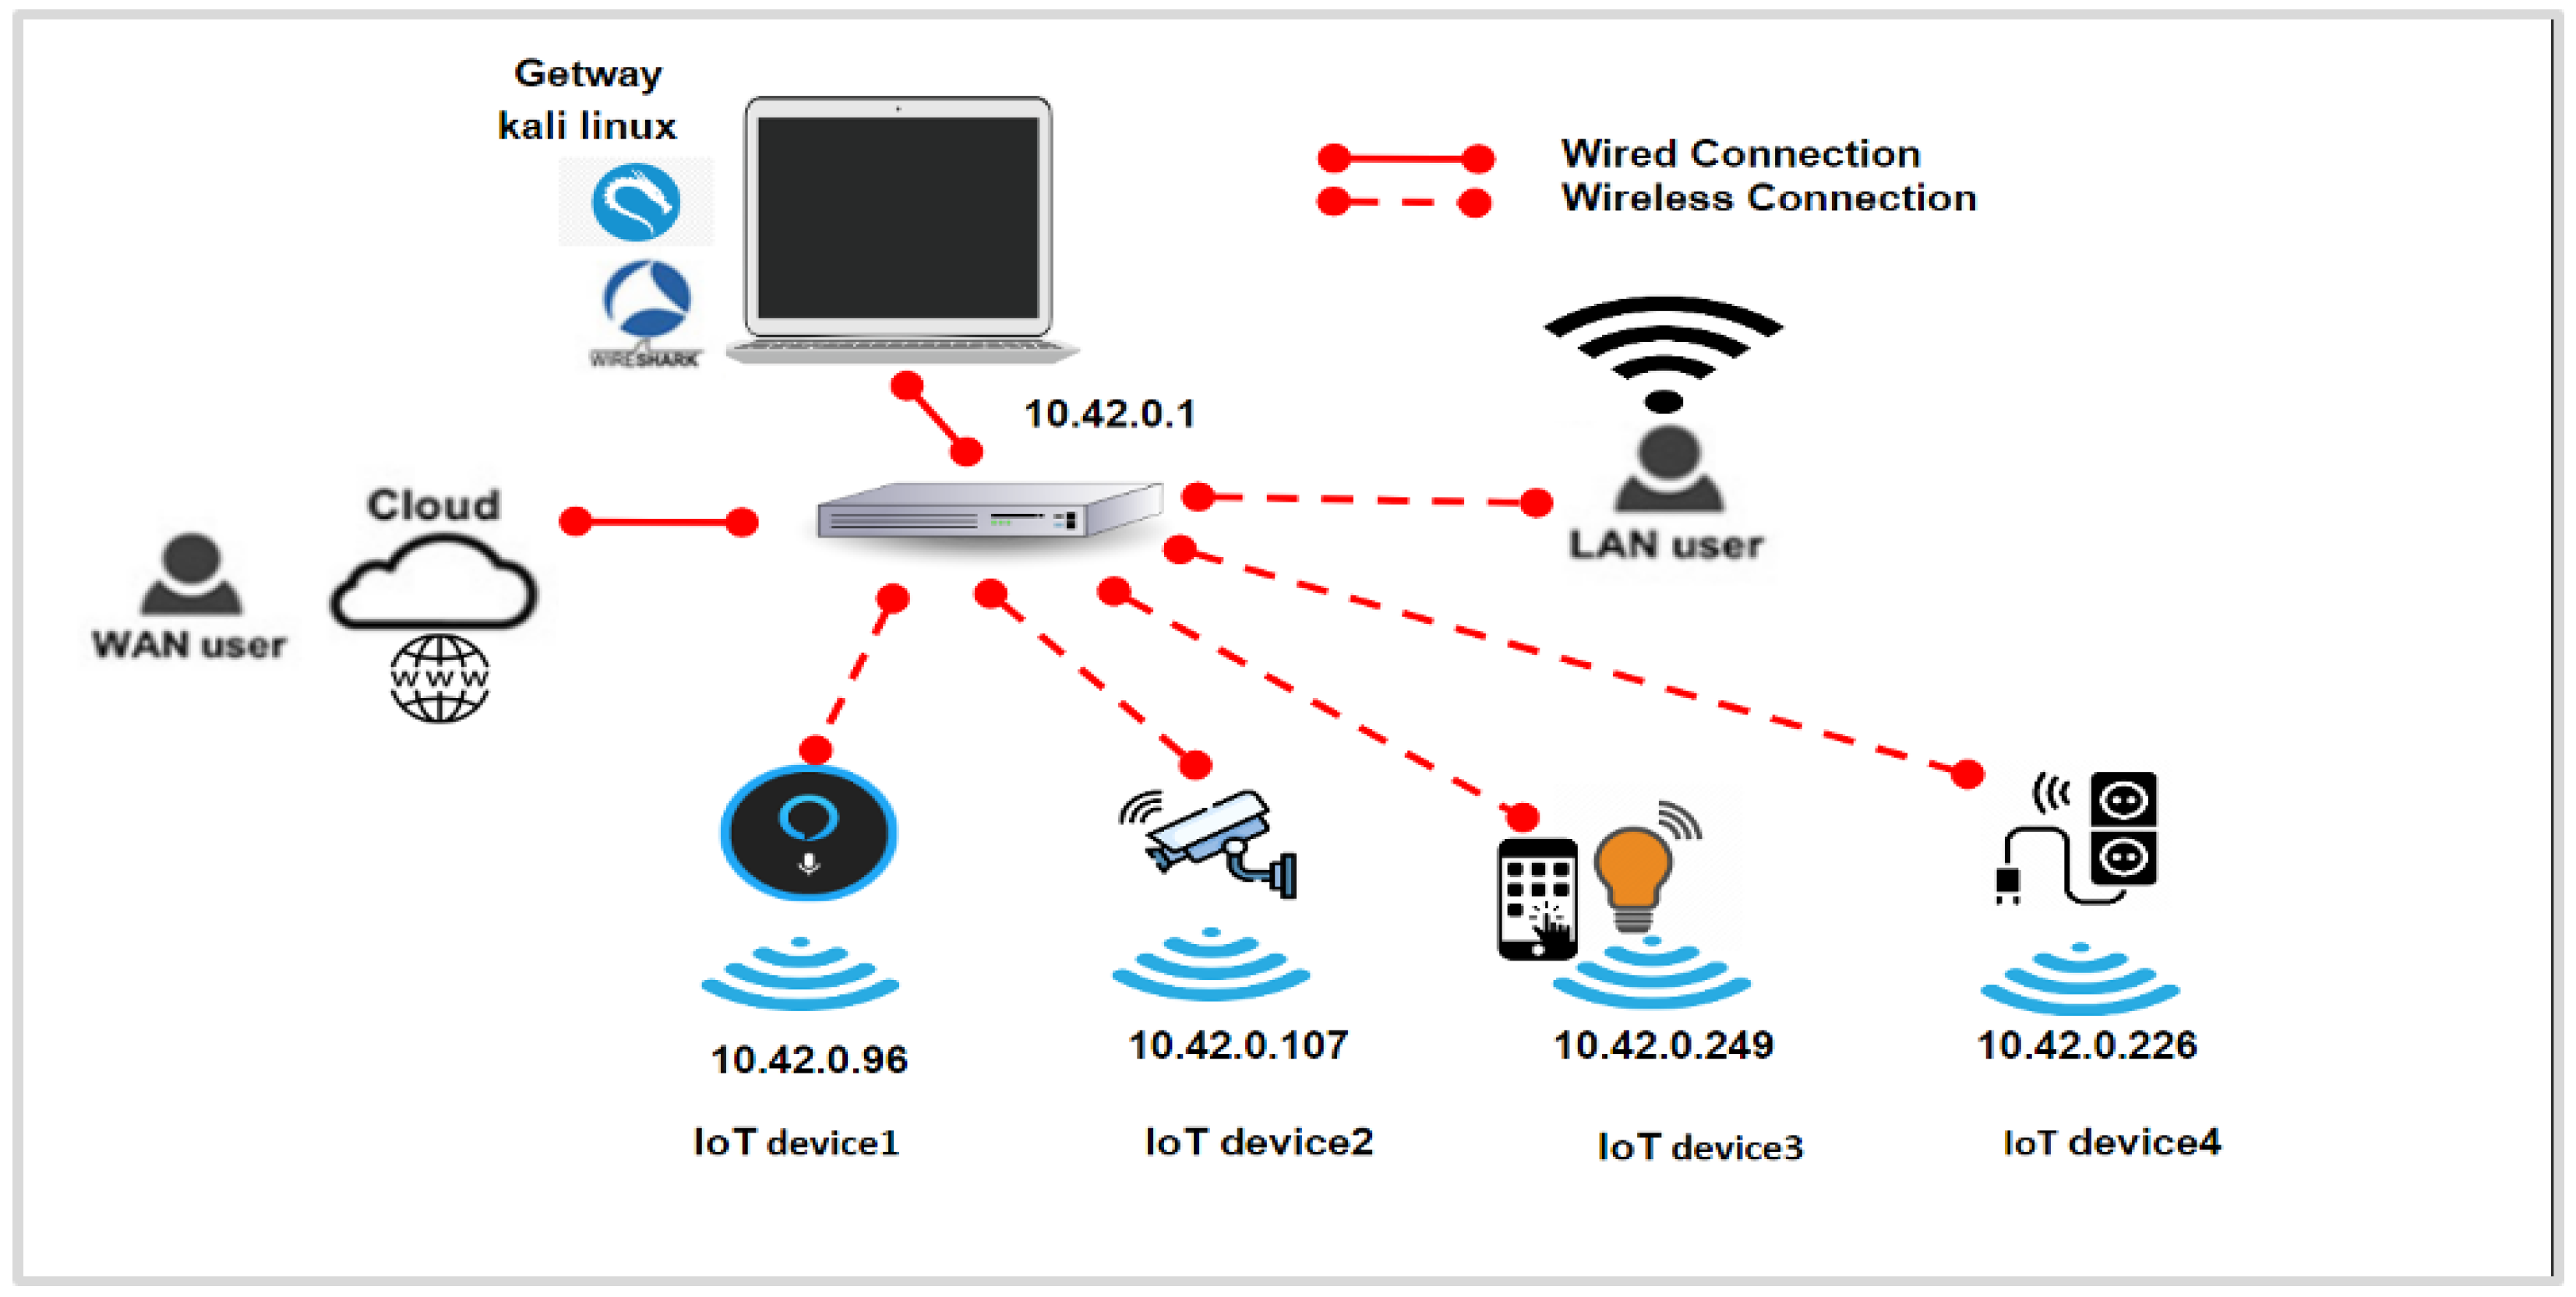
3.1.1. Network Configuration
3.1.2. Smart home IoT devices
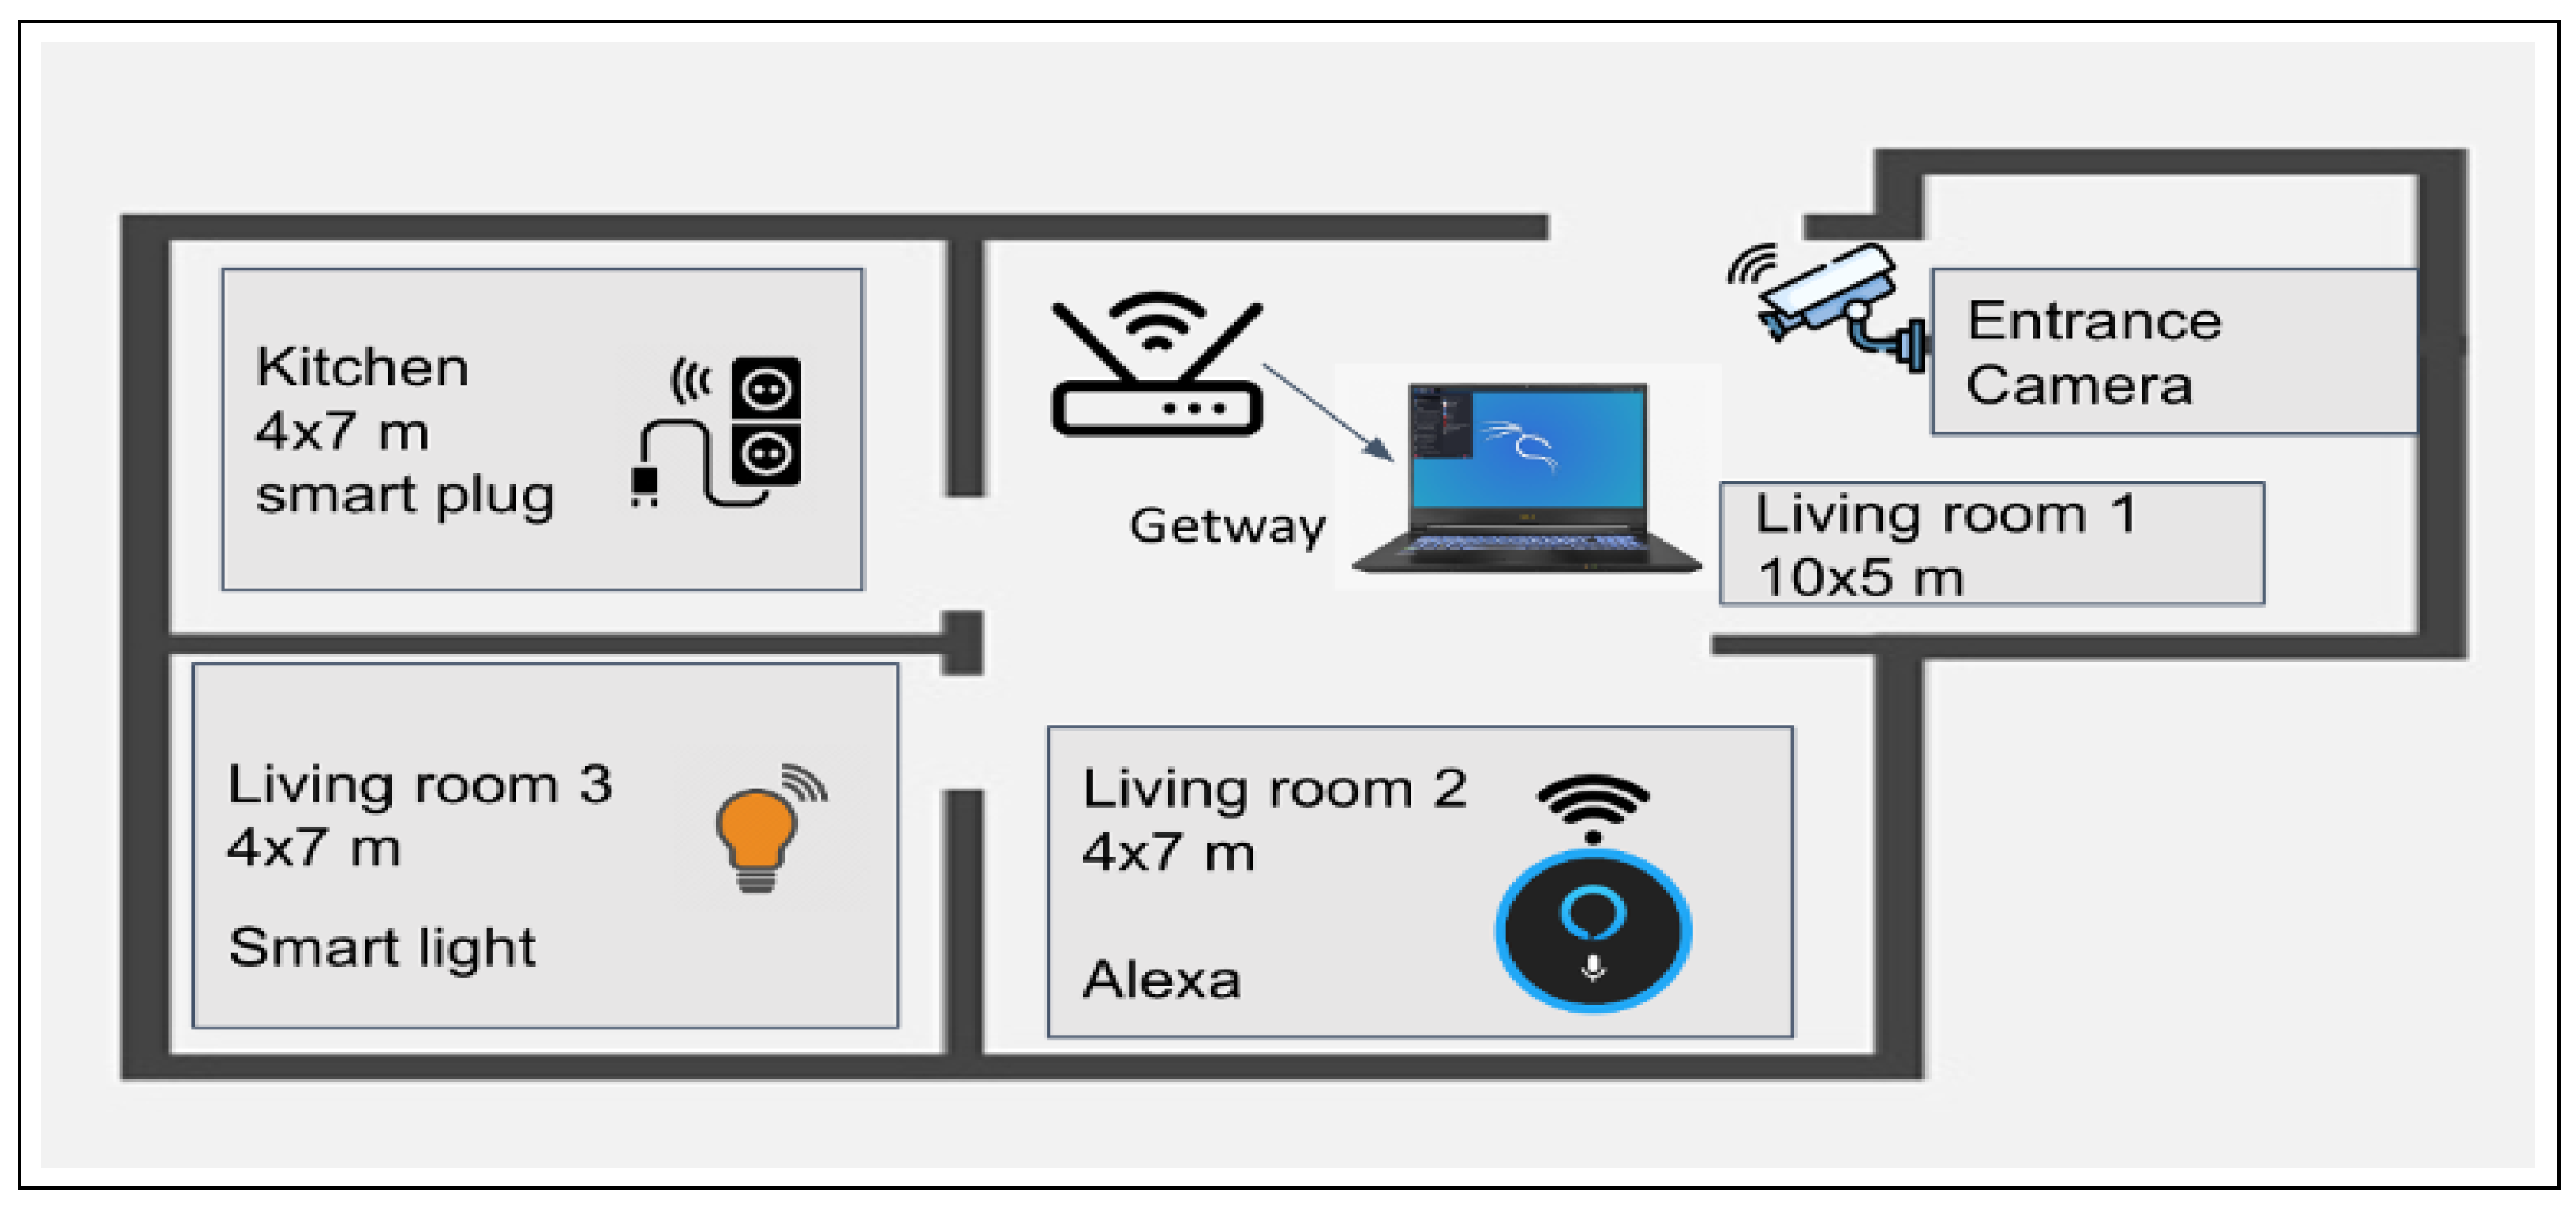
3.1.3. Installation Description
- The home entrance contains a smart camera with a motion sensor to detect movement.
- The living room1 (10 × 5) contains the gateway, providing the Internet to all IoT devices.
- The living room2 (4 × 7) contains Amazon Alexa Eco, which controls the other IoT devices.
- The living room3 (4 × 7) contains the smart light.
- The kitchen (4 × 7) contains a smart plug connected to a boiler.

3.2. Smart-Home Traffic Data Collection
3.2.1. Scenarios for Collecting Benign Traffic
- Power is on (true/false): In this experiment, we capture the network traffic of the IoT device in two states, i.e., when the device is powered on and when the device is powered off. In addition, we capture the traffic while the user alters between power on and off the device simultaneously. The whole network communications were captured throughout the day.
- Application is on (true/false): In this experiment, we capture the network traffic of the app that controls the IoT device in two states, i.e., when the app is active (i.e., open) and when the app is inactive (i.e., closed).
- Device/Application Idle (true/false): In this experiment, we captured the network traffic from the IoT device or the IoT application when it’s either on for a long period as well as no human interactions are involved, which we call idle time. Otherwise, the device or the IoT application is not idle, i.e., human interactions are involved. However, if the IoT device or application was switched off, we call it not applicable (NA).
- User interaction with the IoT app (true/false): In this experiment, we perform all possible interactions with the IoT device functionality through its app (the app is open and not in an idle state) to generate network traffic. The network activity for each functionality was captured either passively or actively.
- Play music (true/false): In this experiment, we command Alexa to search for particular music and then play it.
- Connect to a website (true/false): This experiment is an audio search command. We asked Alexa to answer particular questions like what the weather is, what the news is, what is the capital of a country, etc.
- Connect to other IoT devices (true/false): a smart plug, smart camera, and smart lamp) to control them. For example, we command Alexa to switch on/off the smart plug.
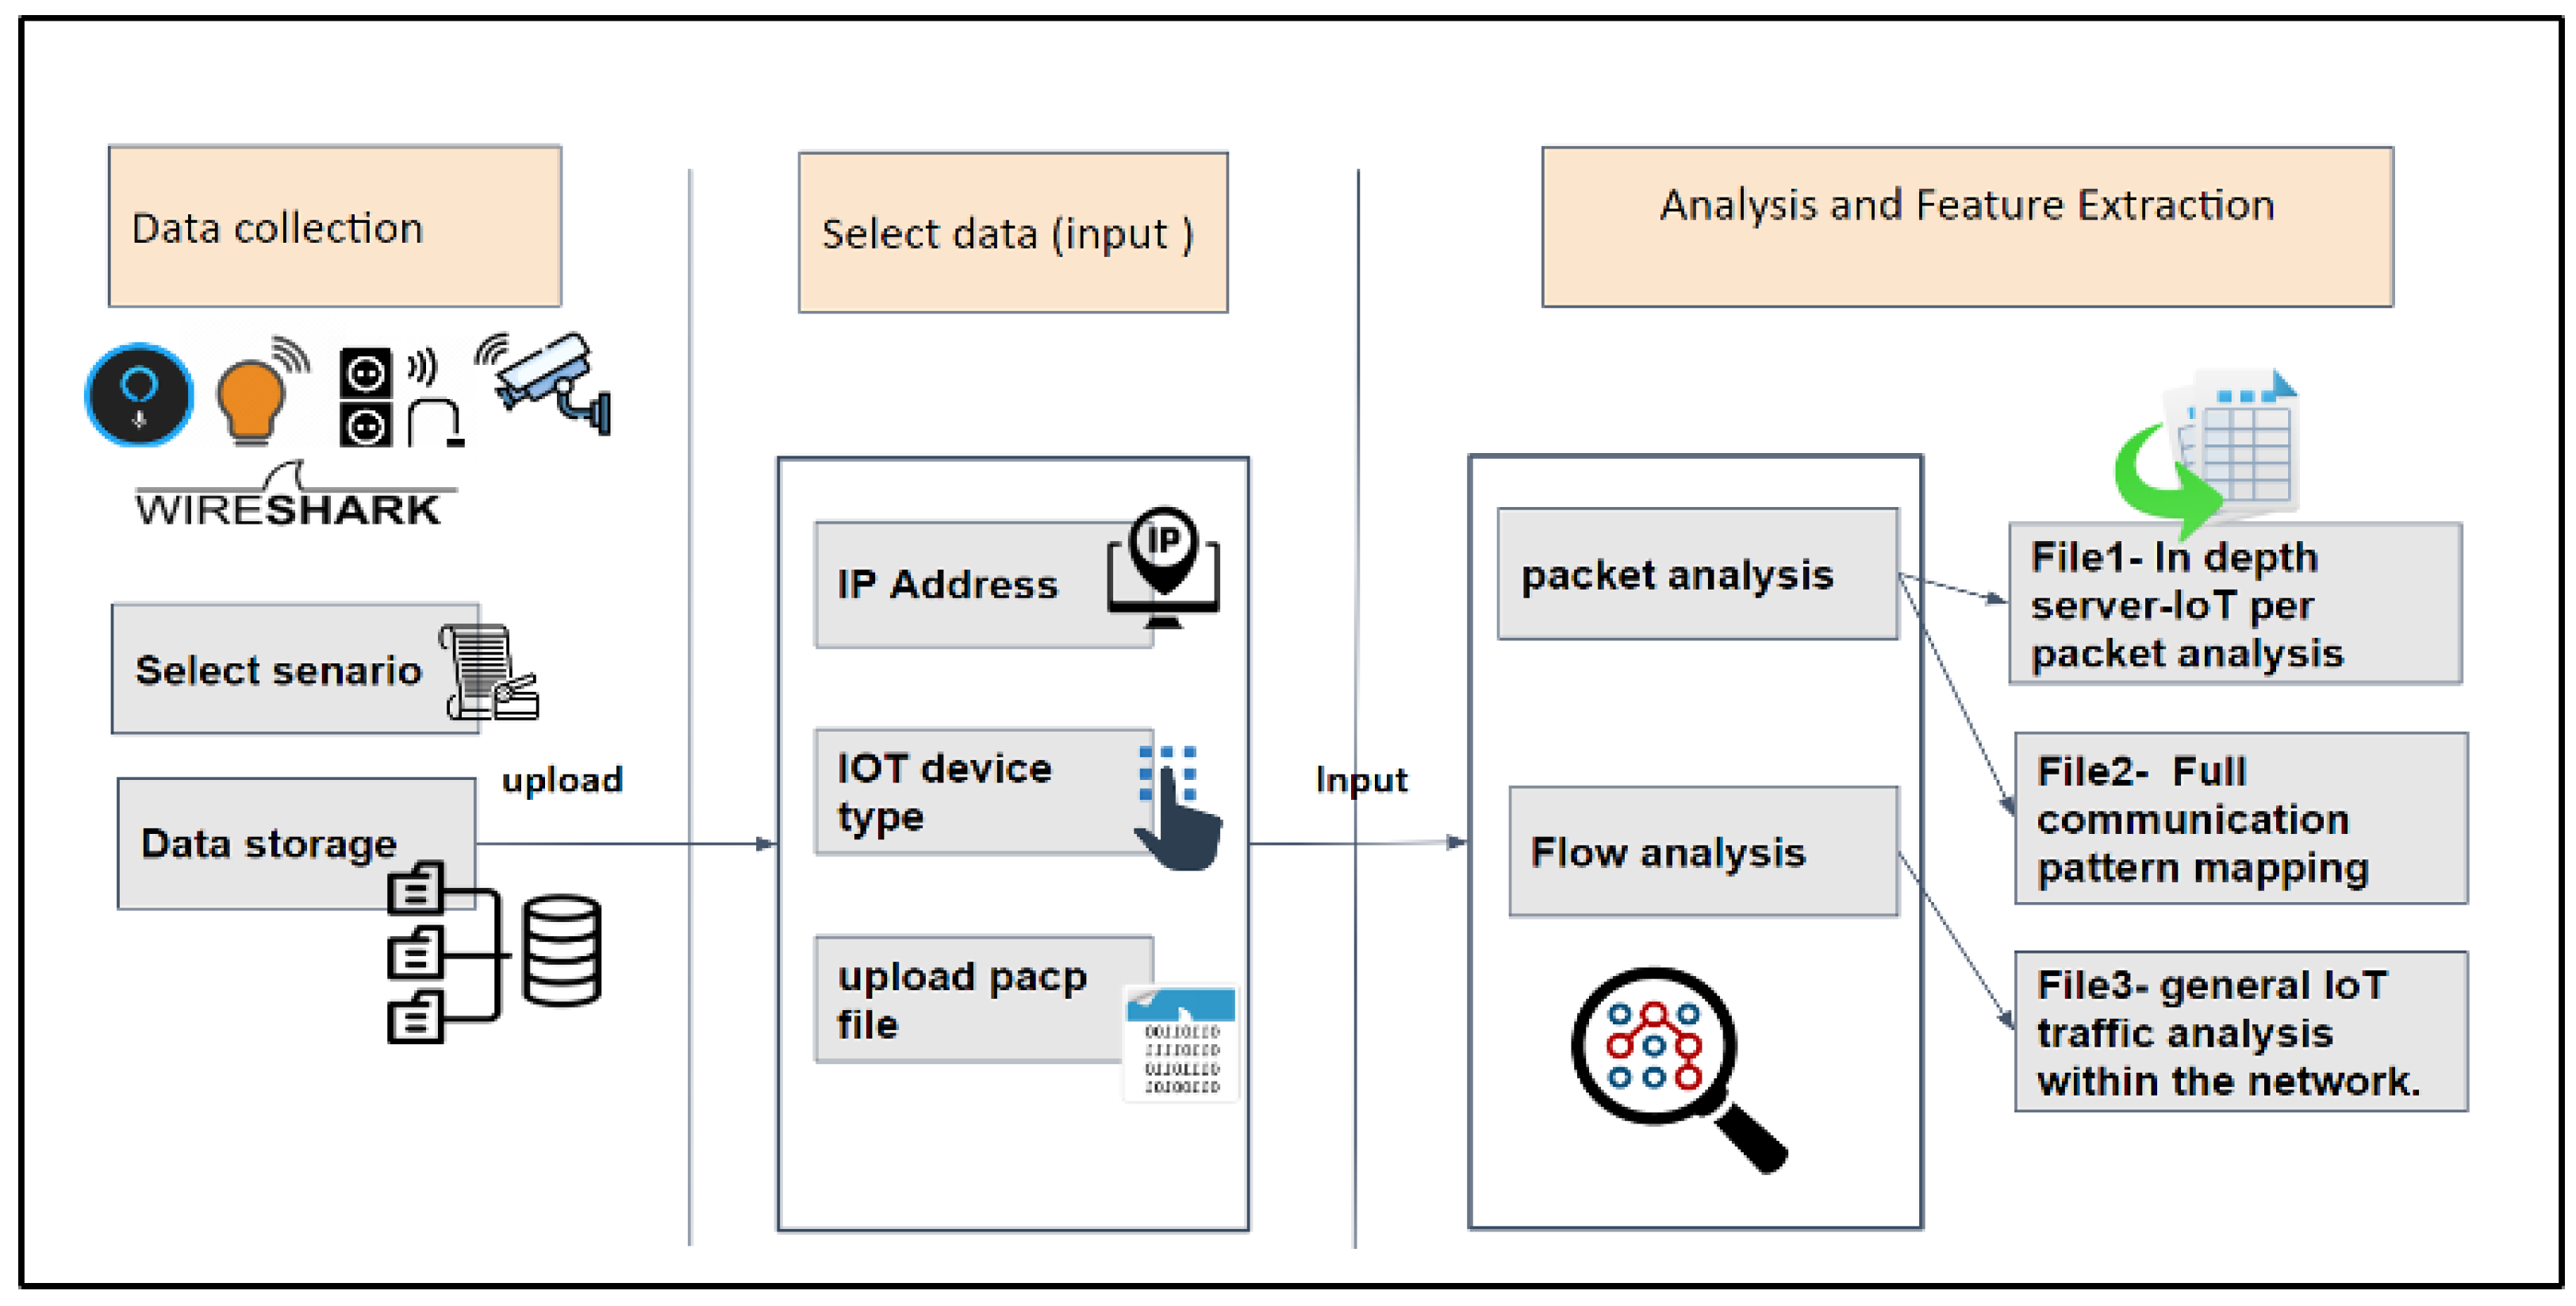
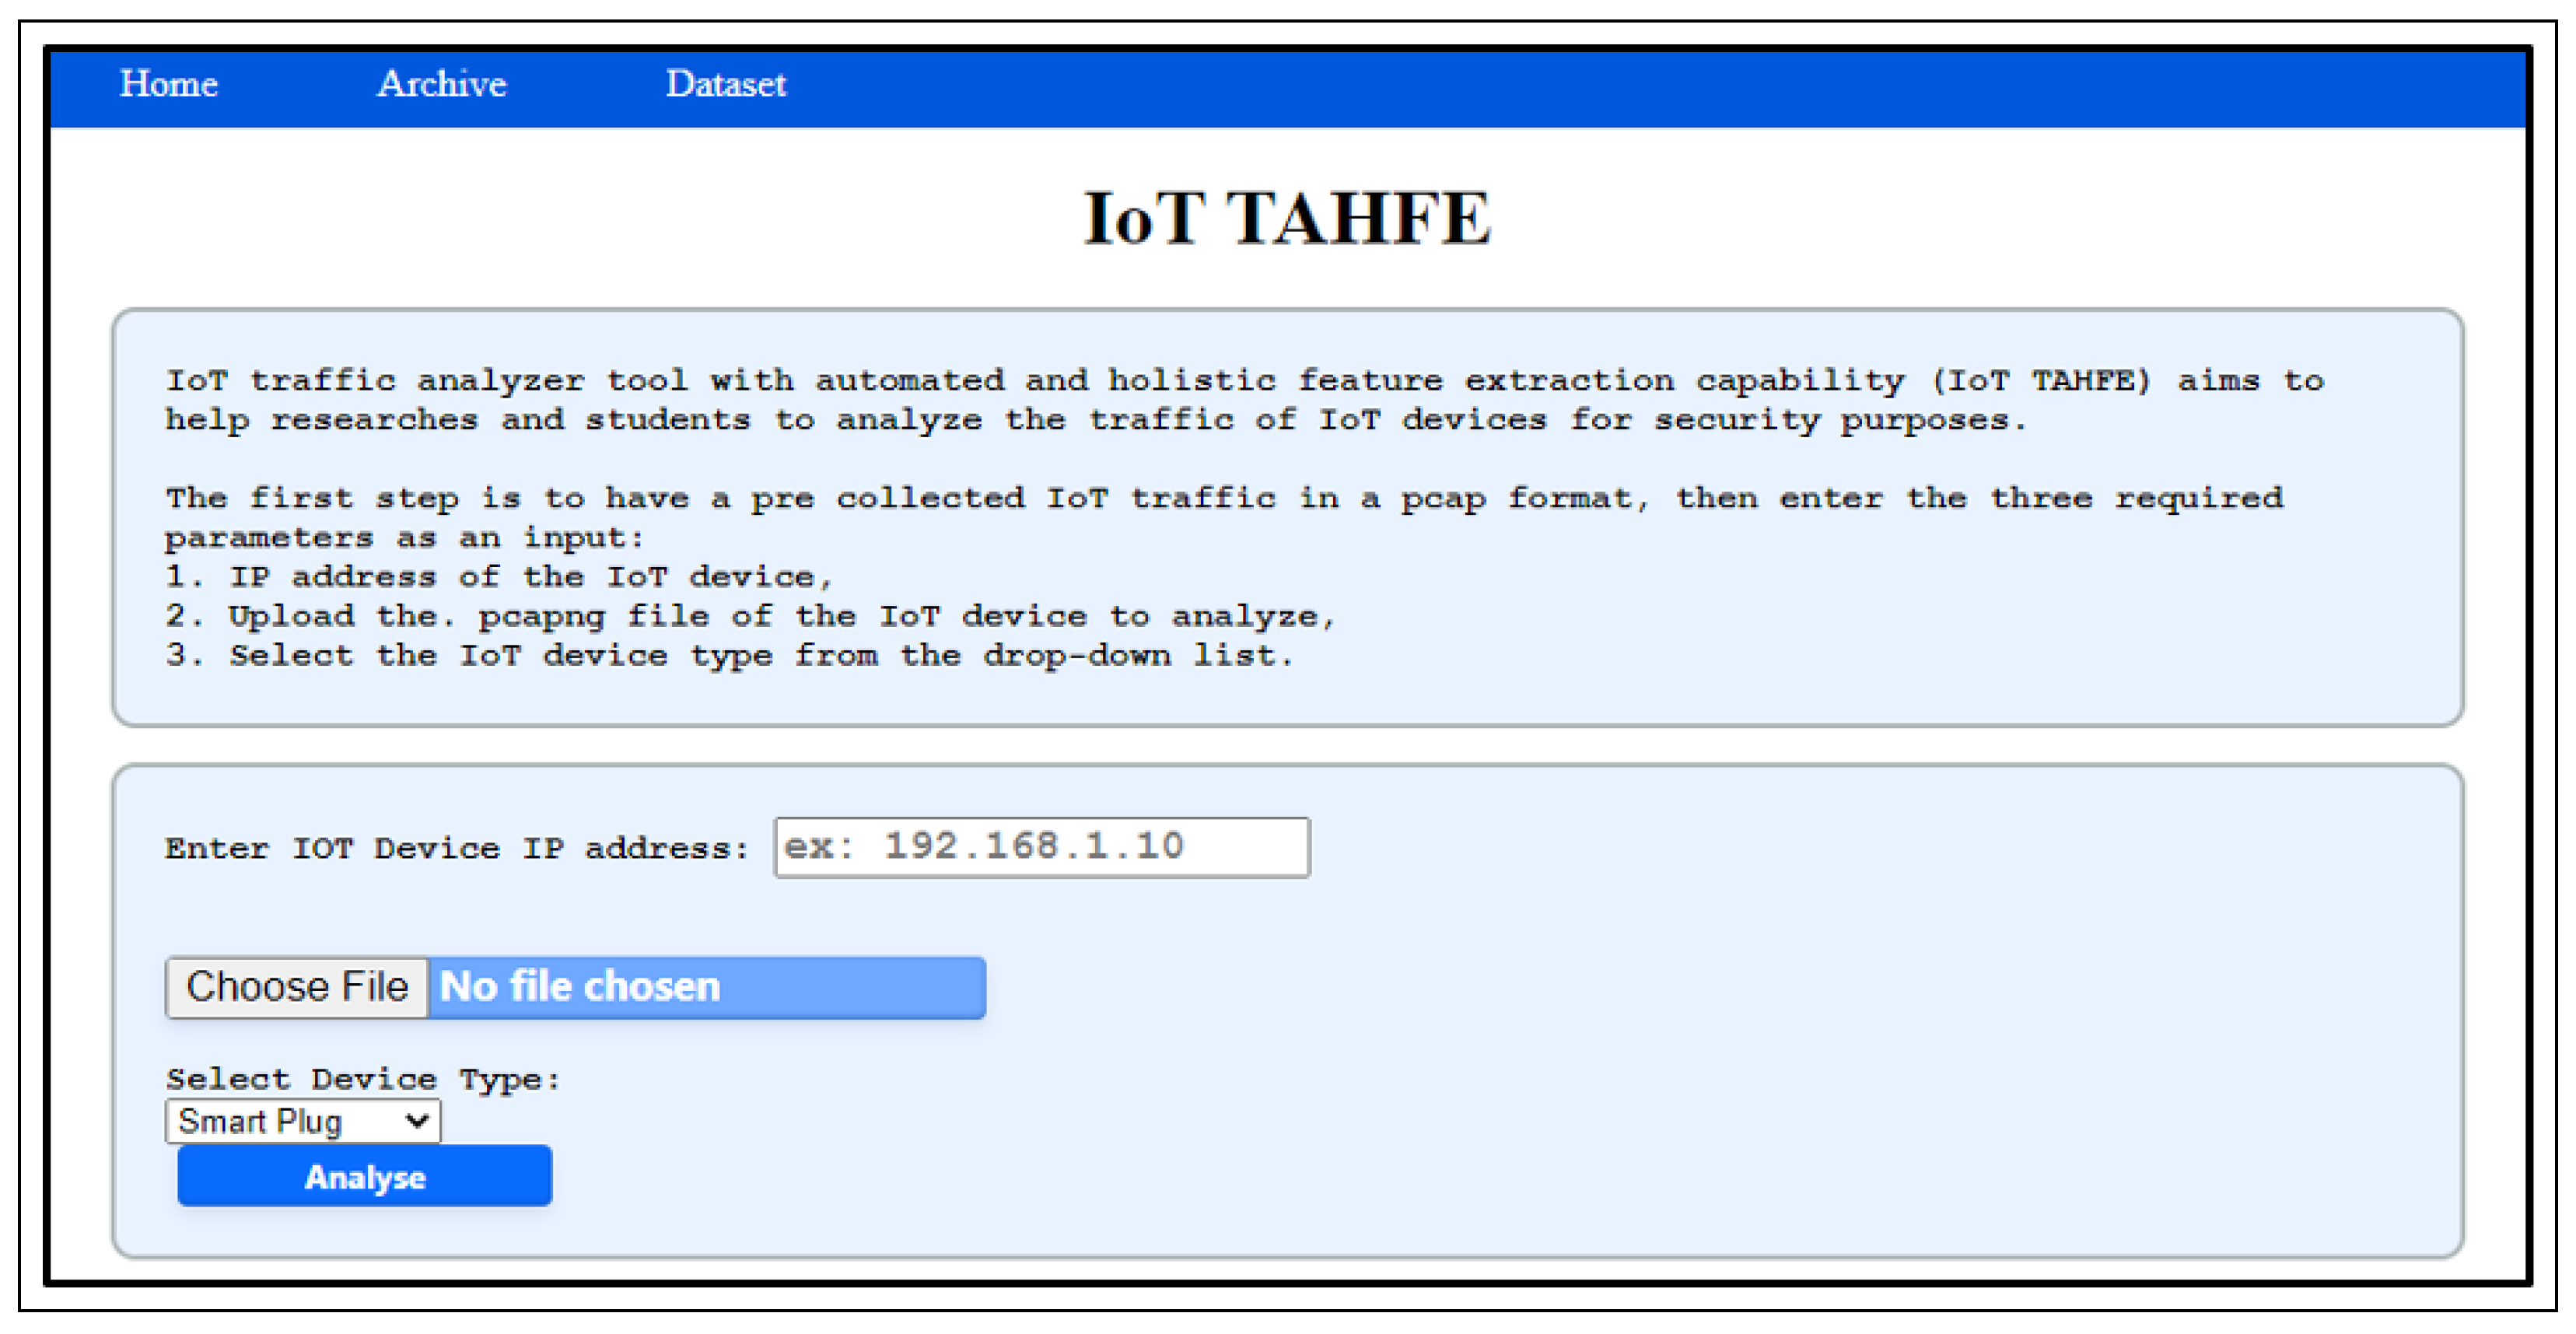
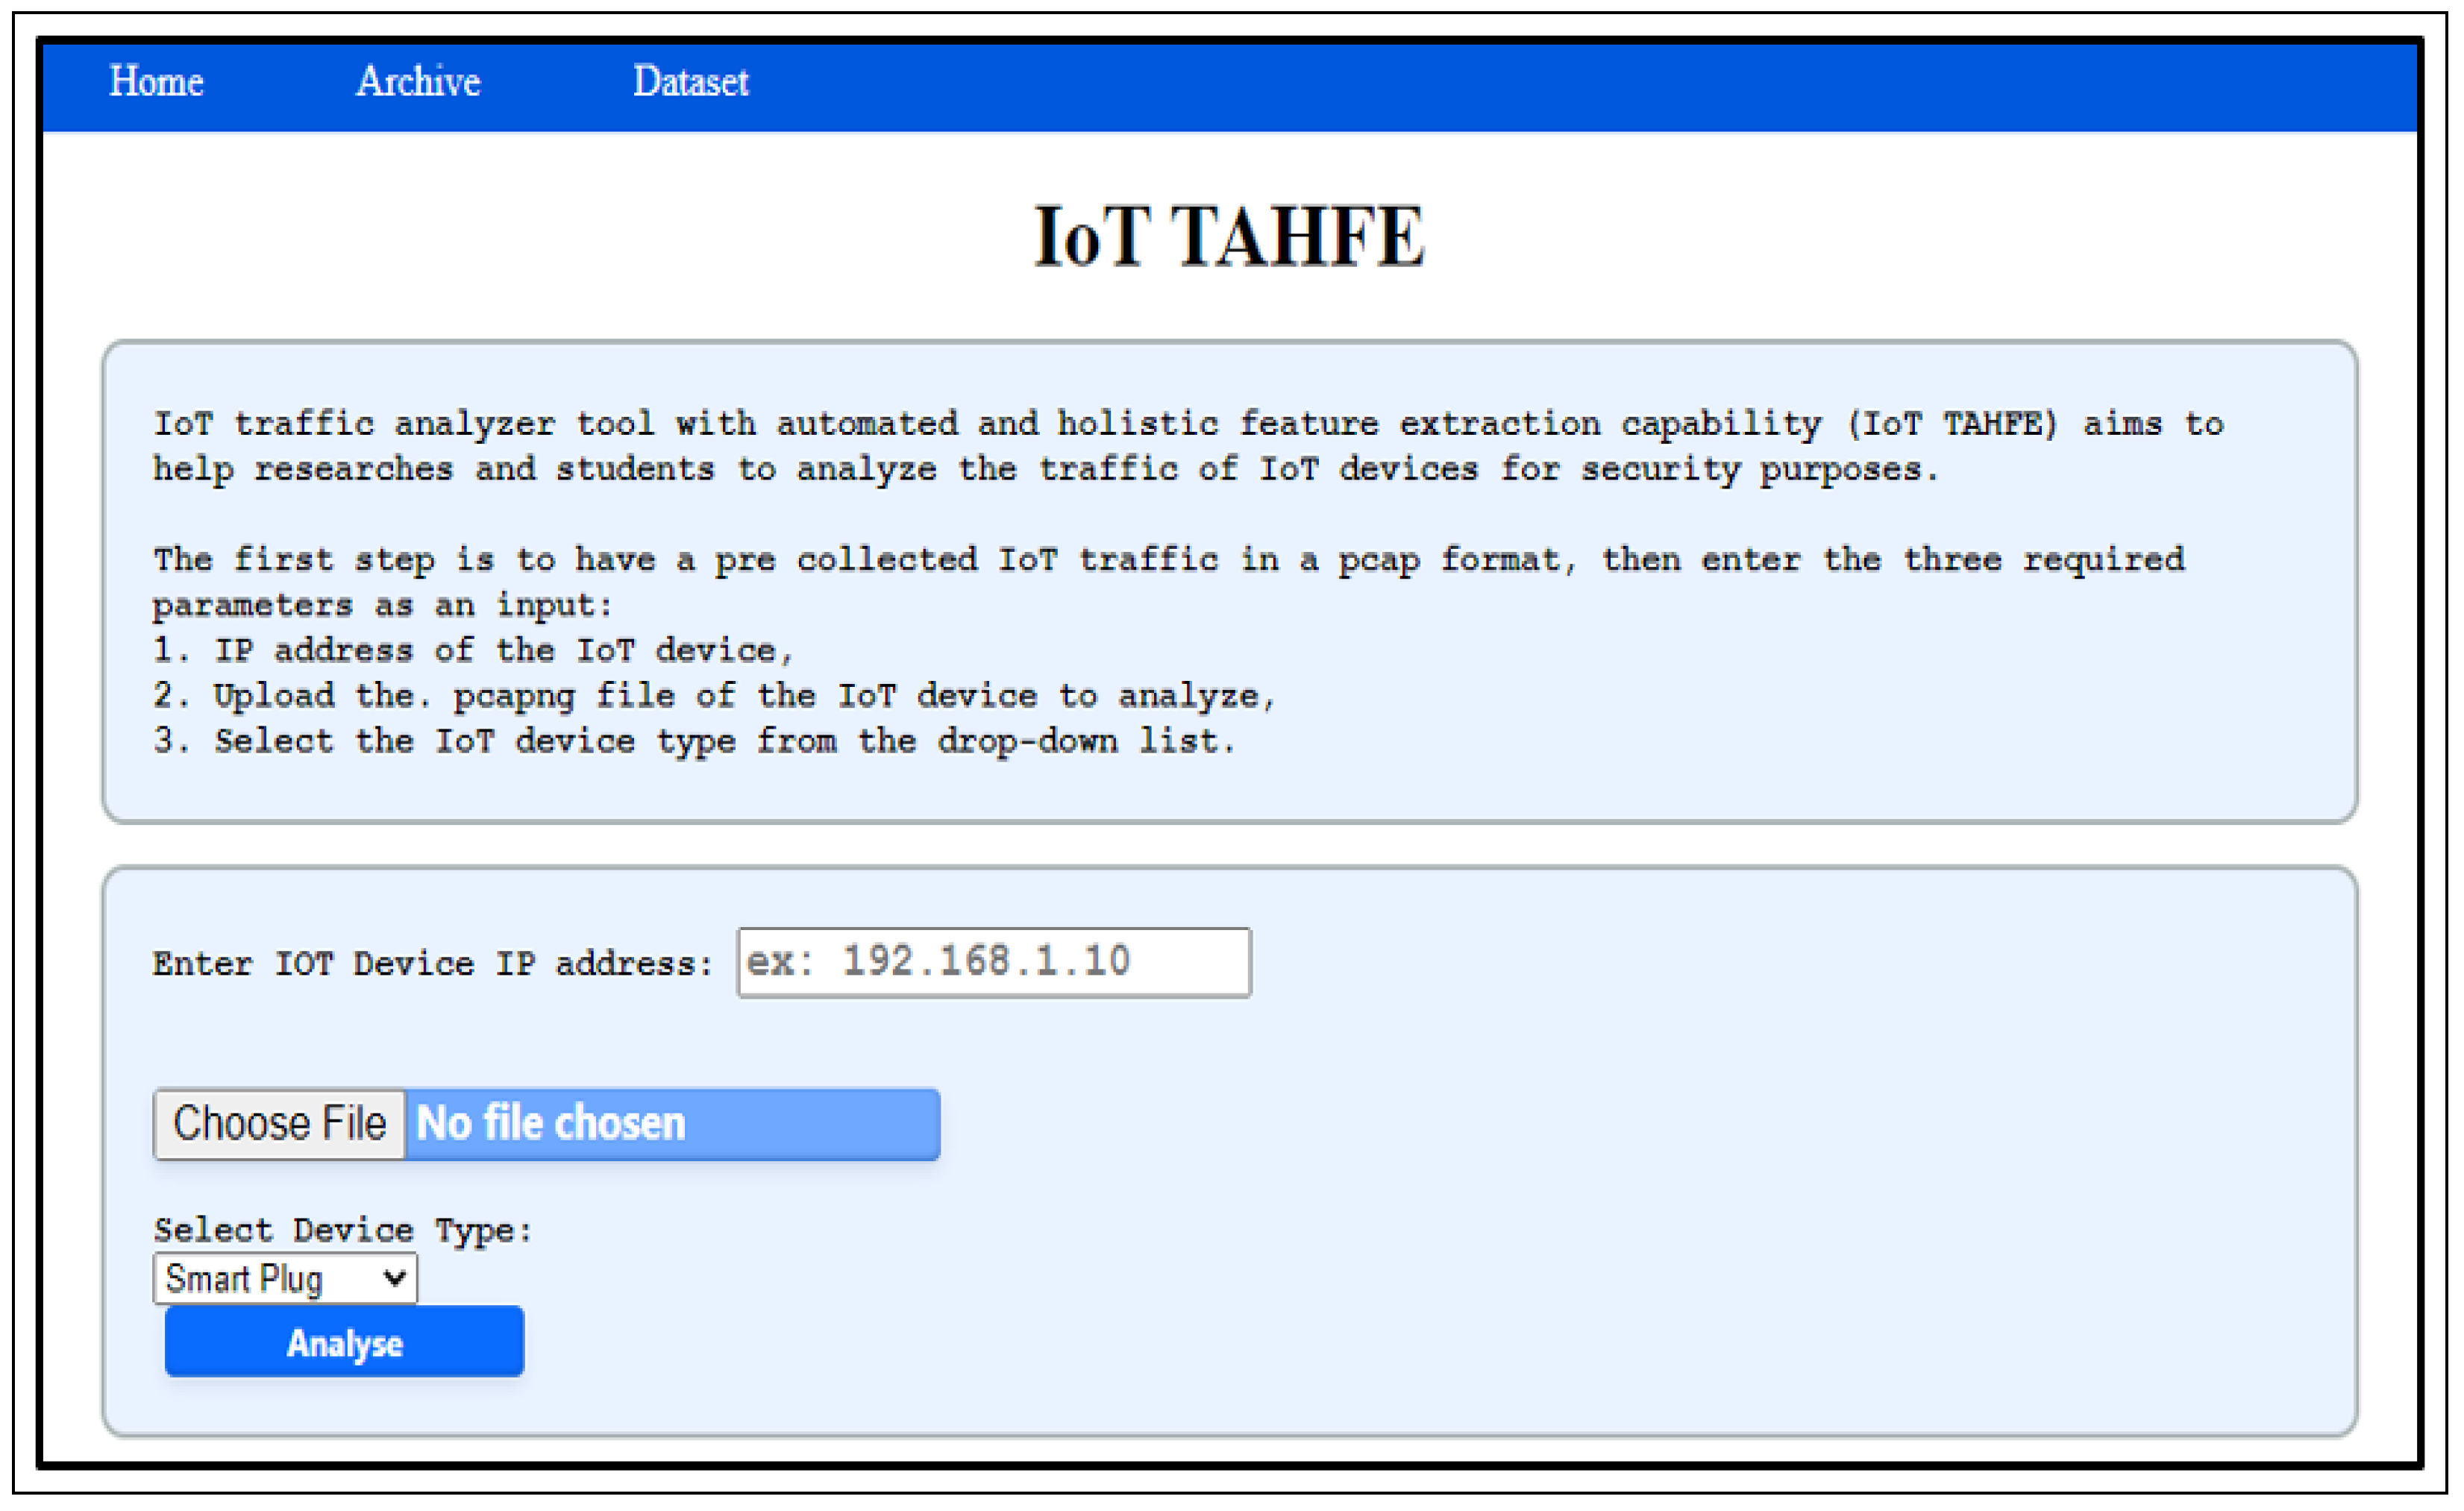
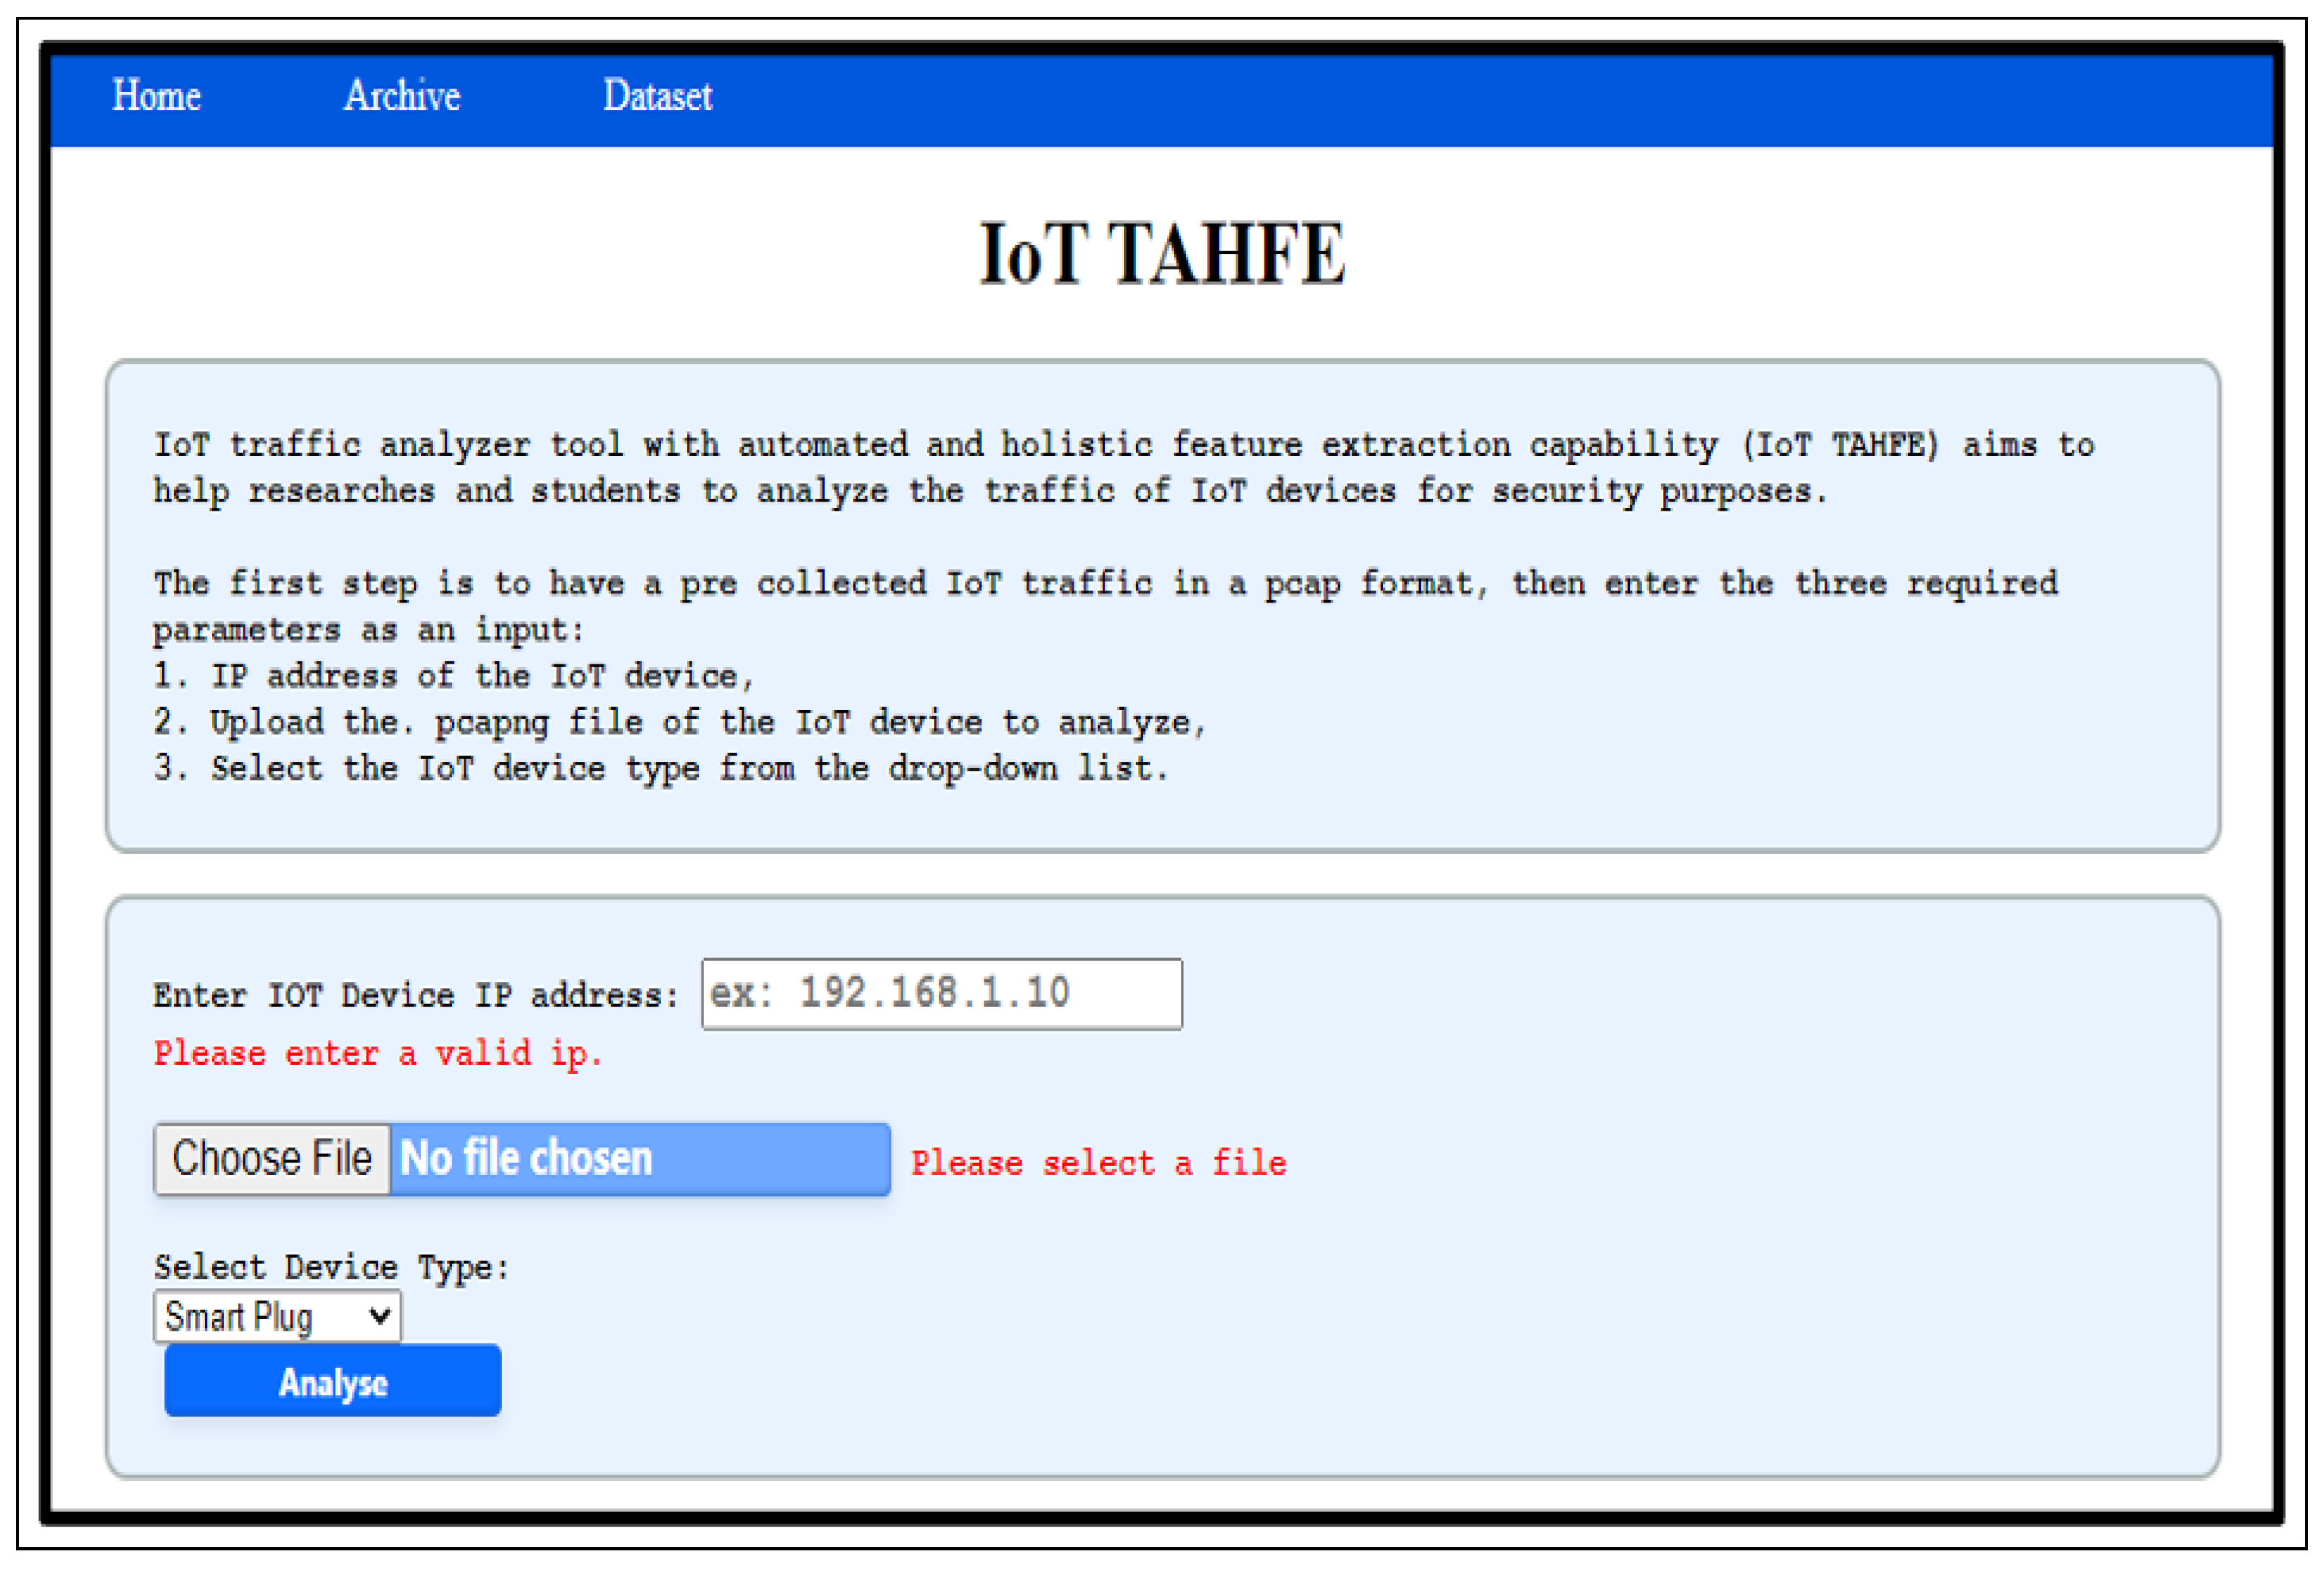
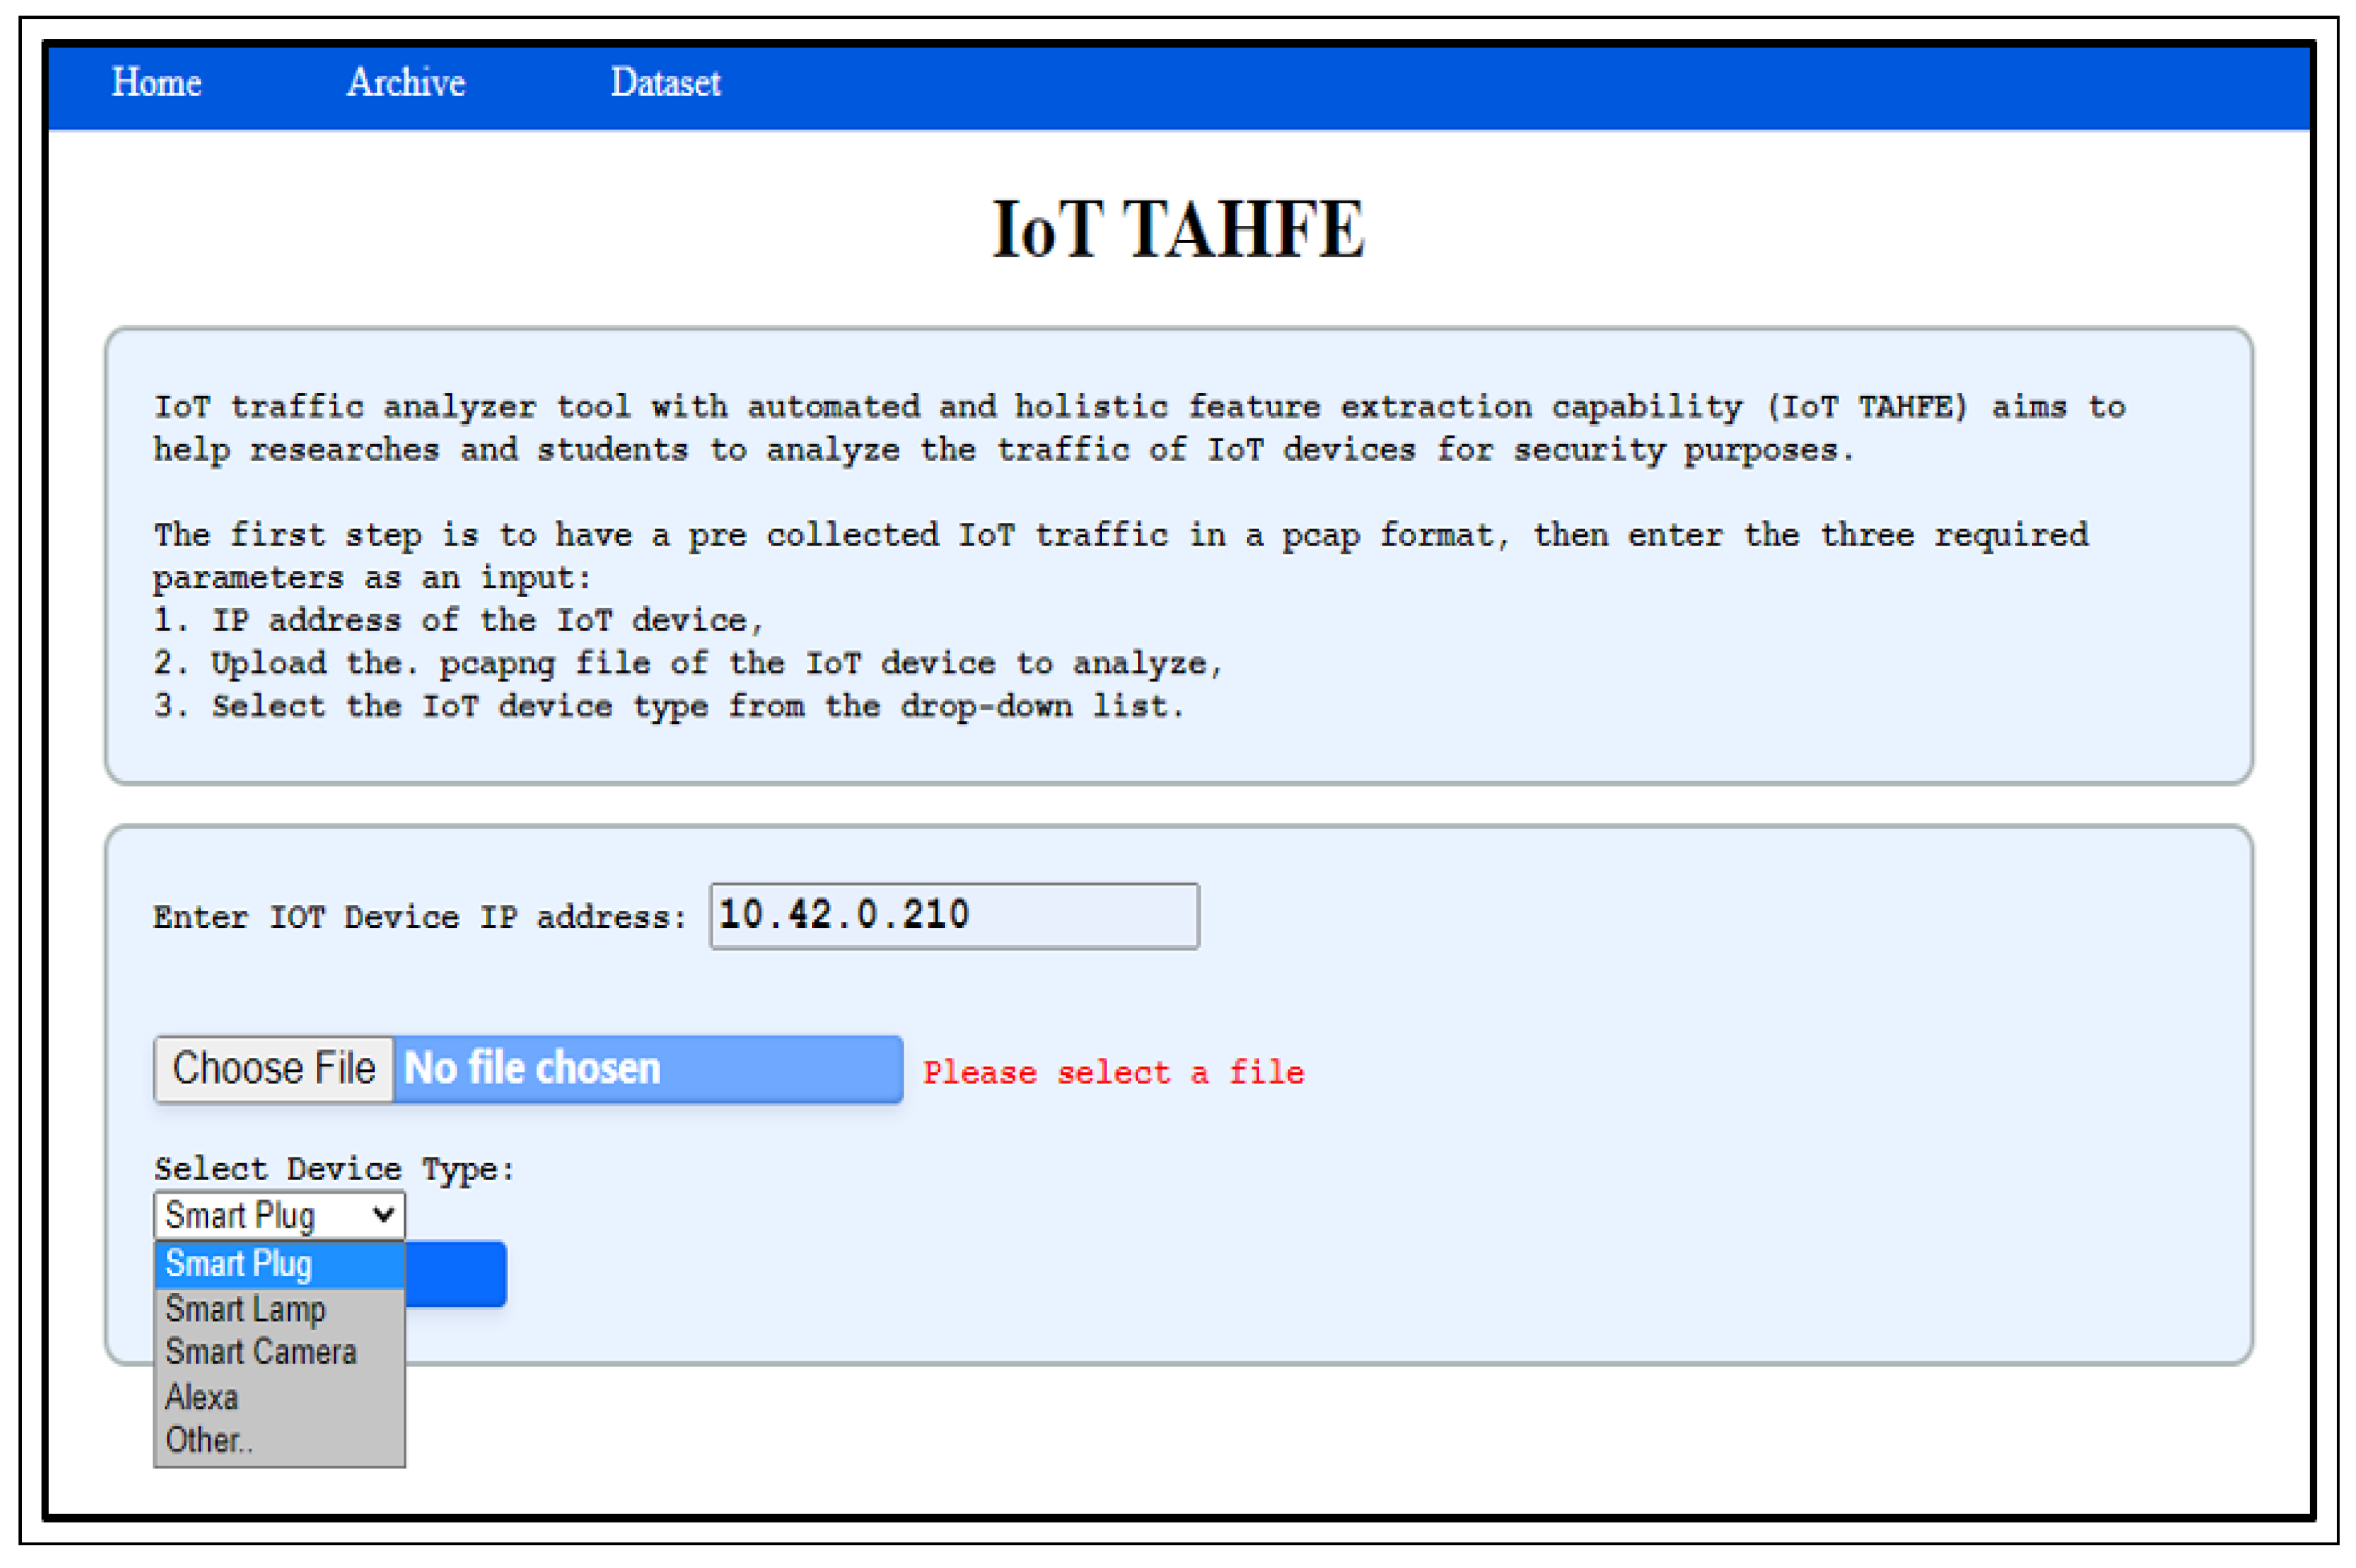
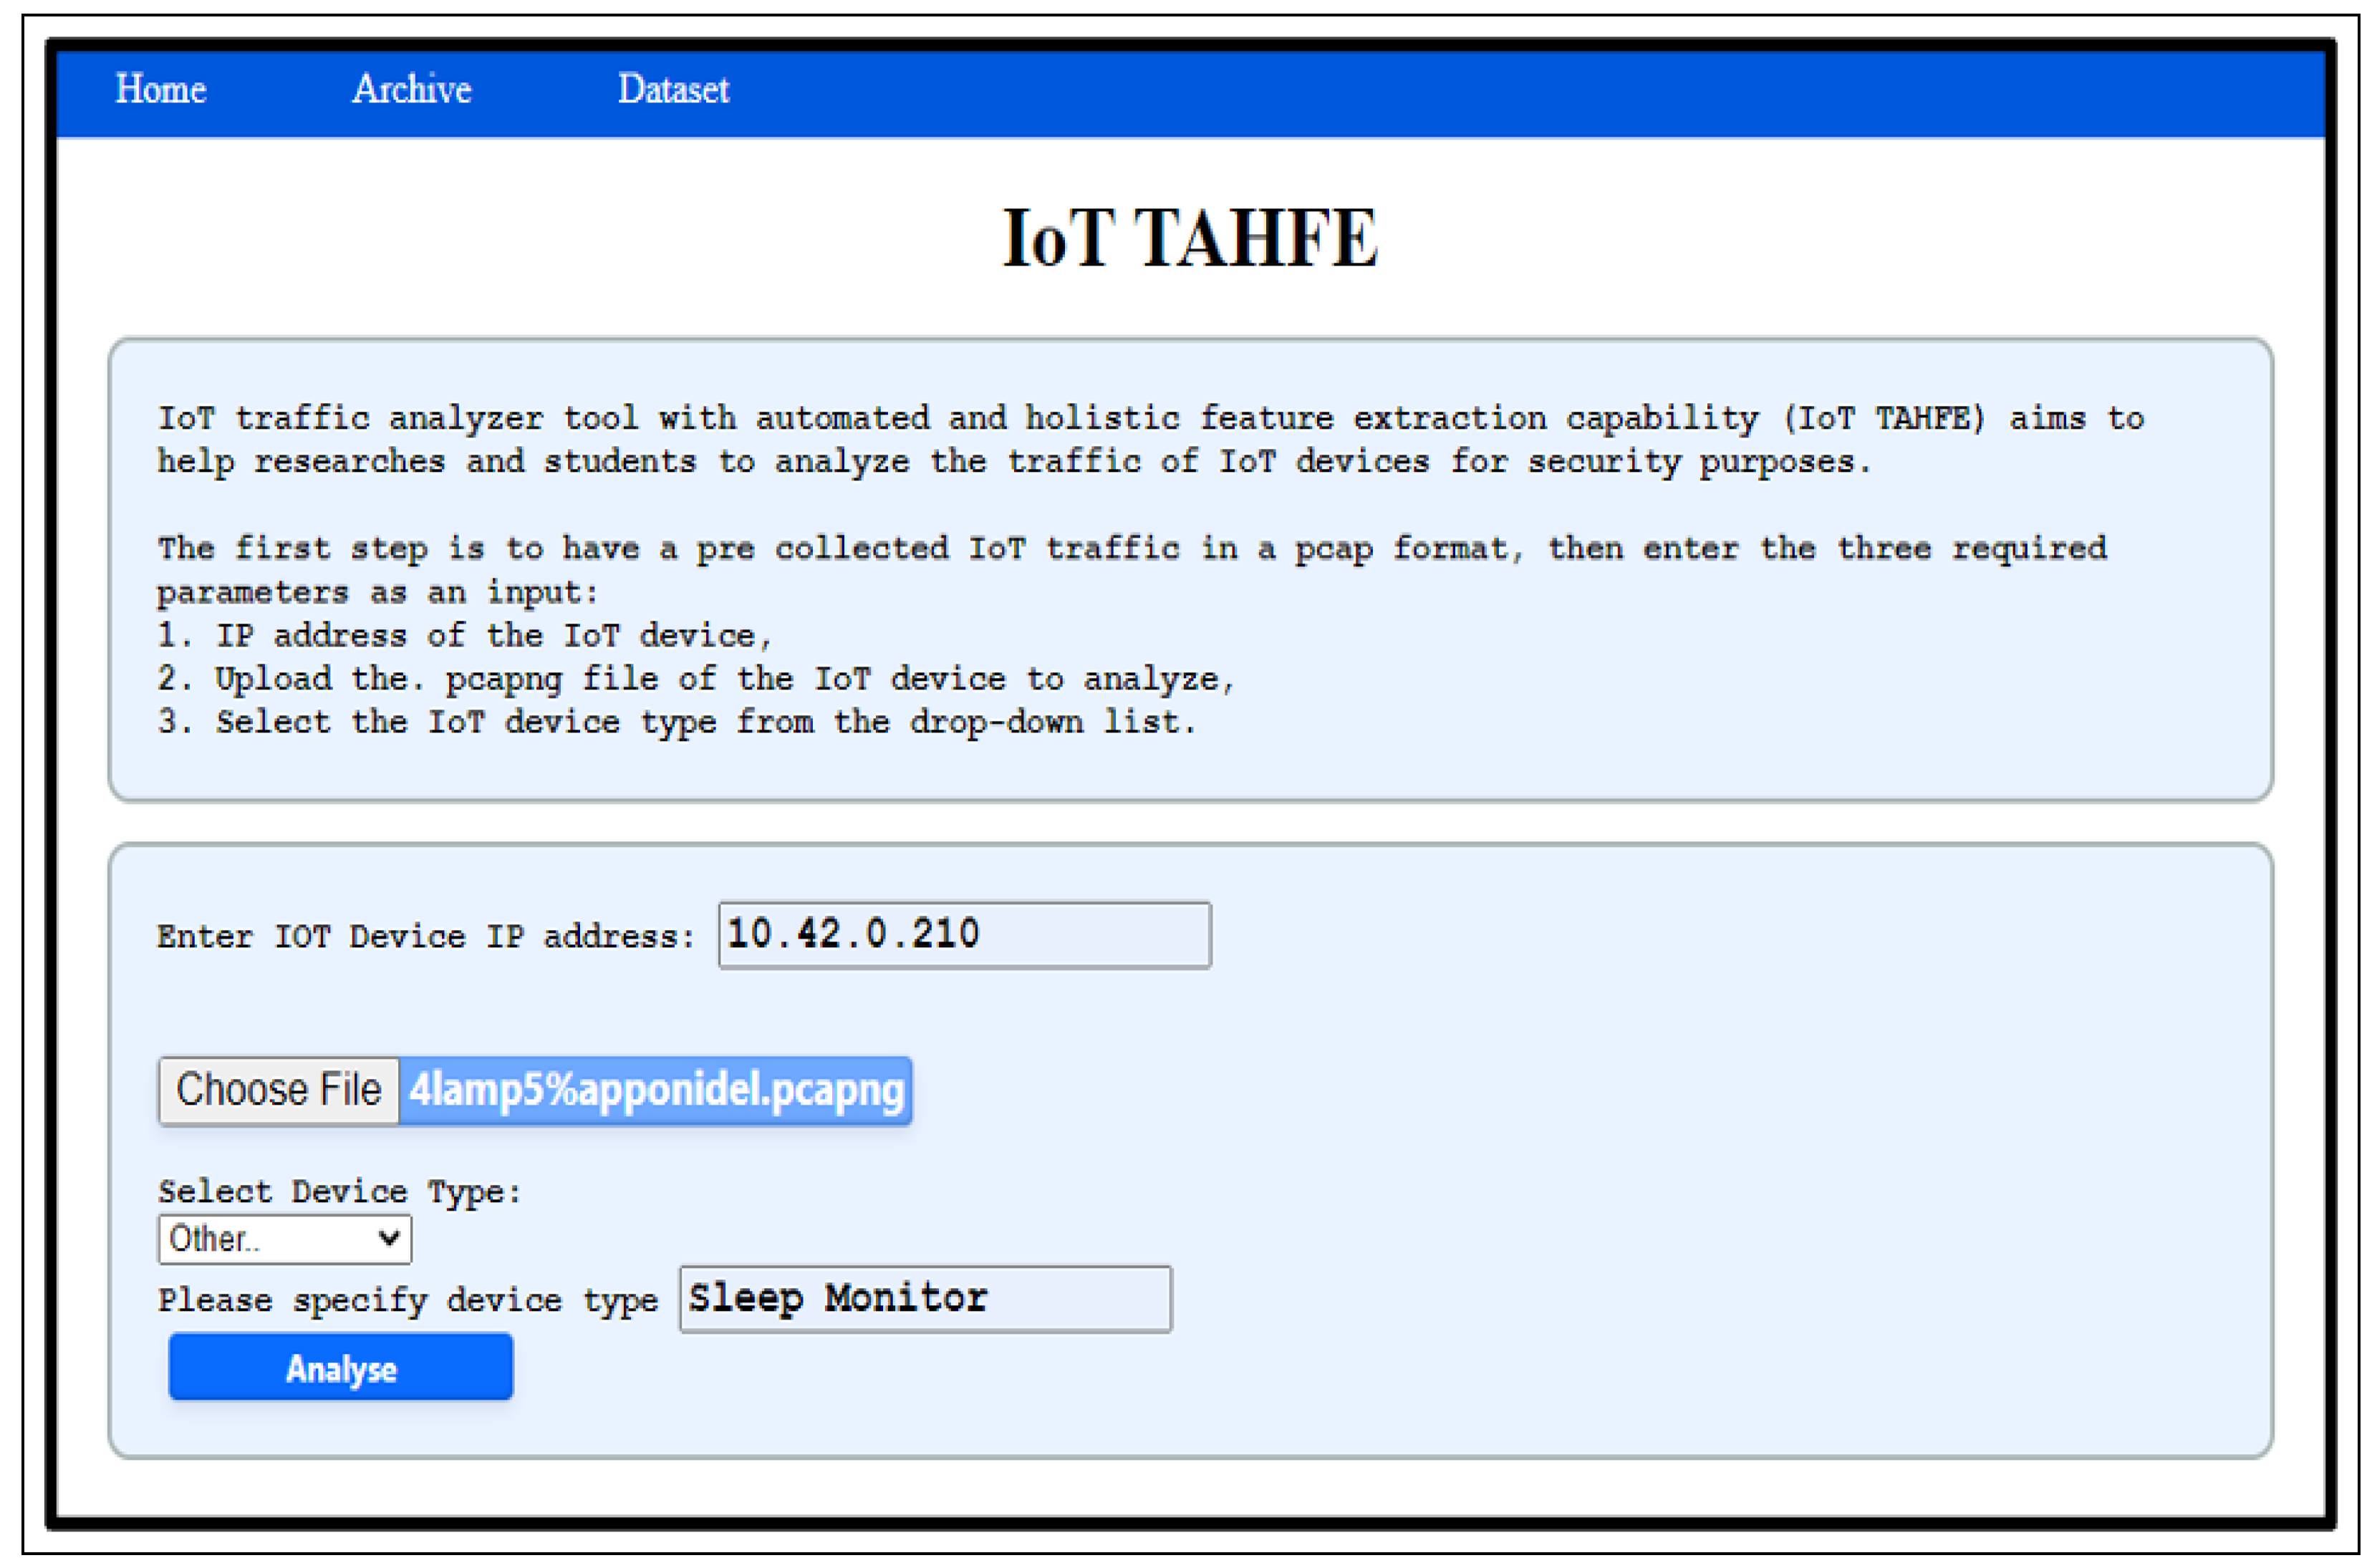
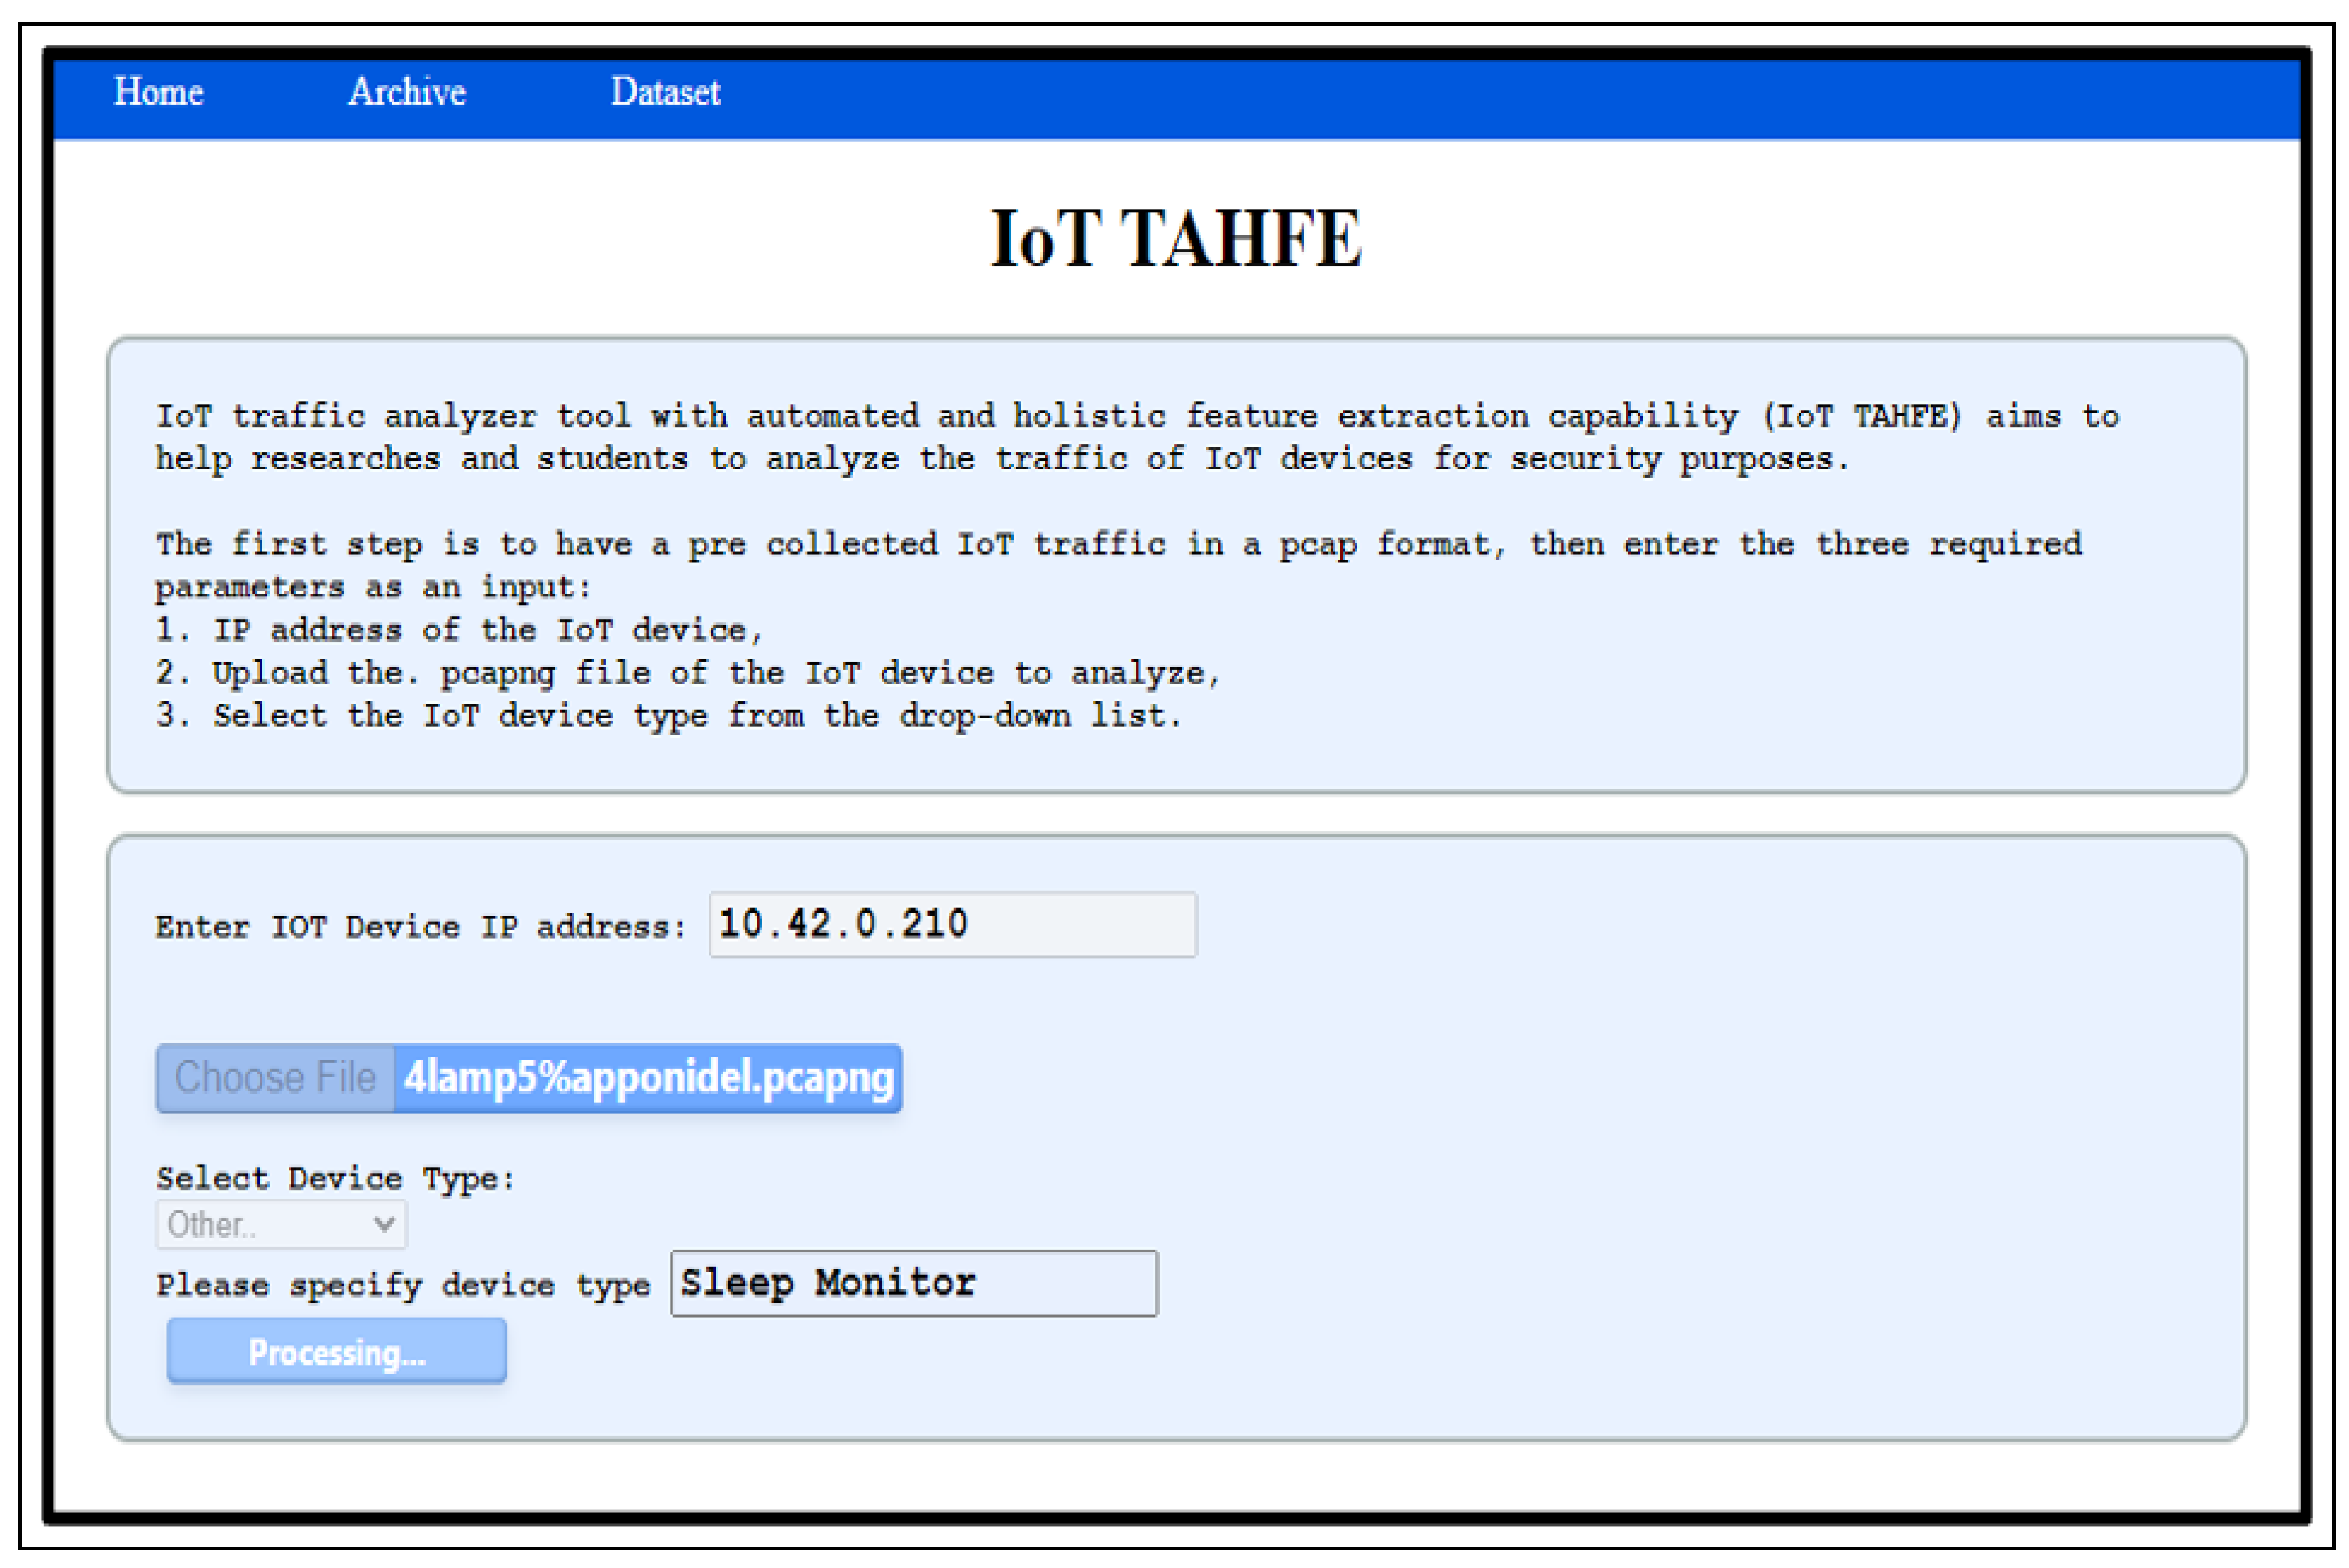
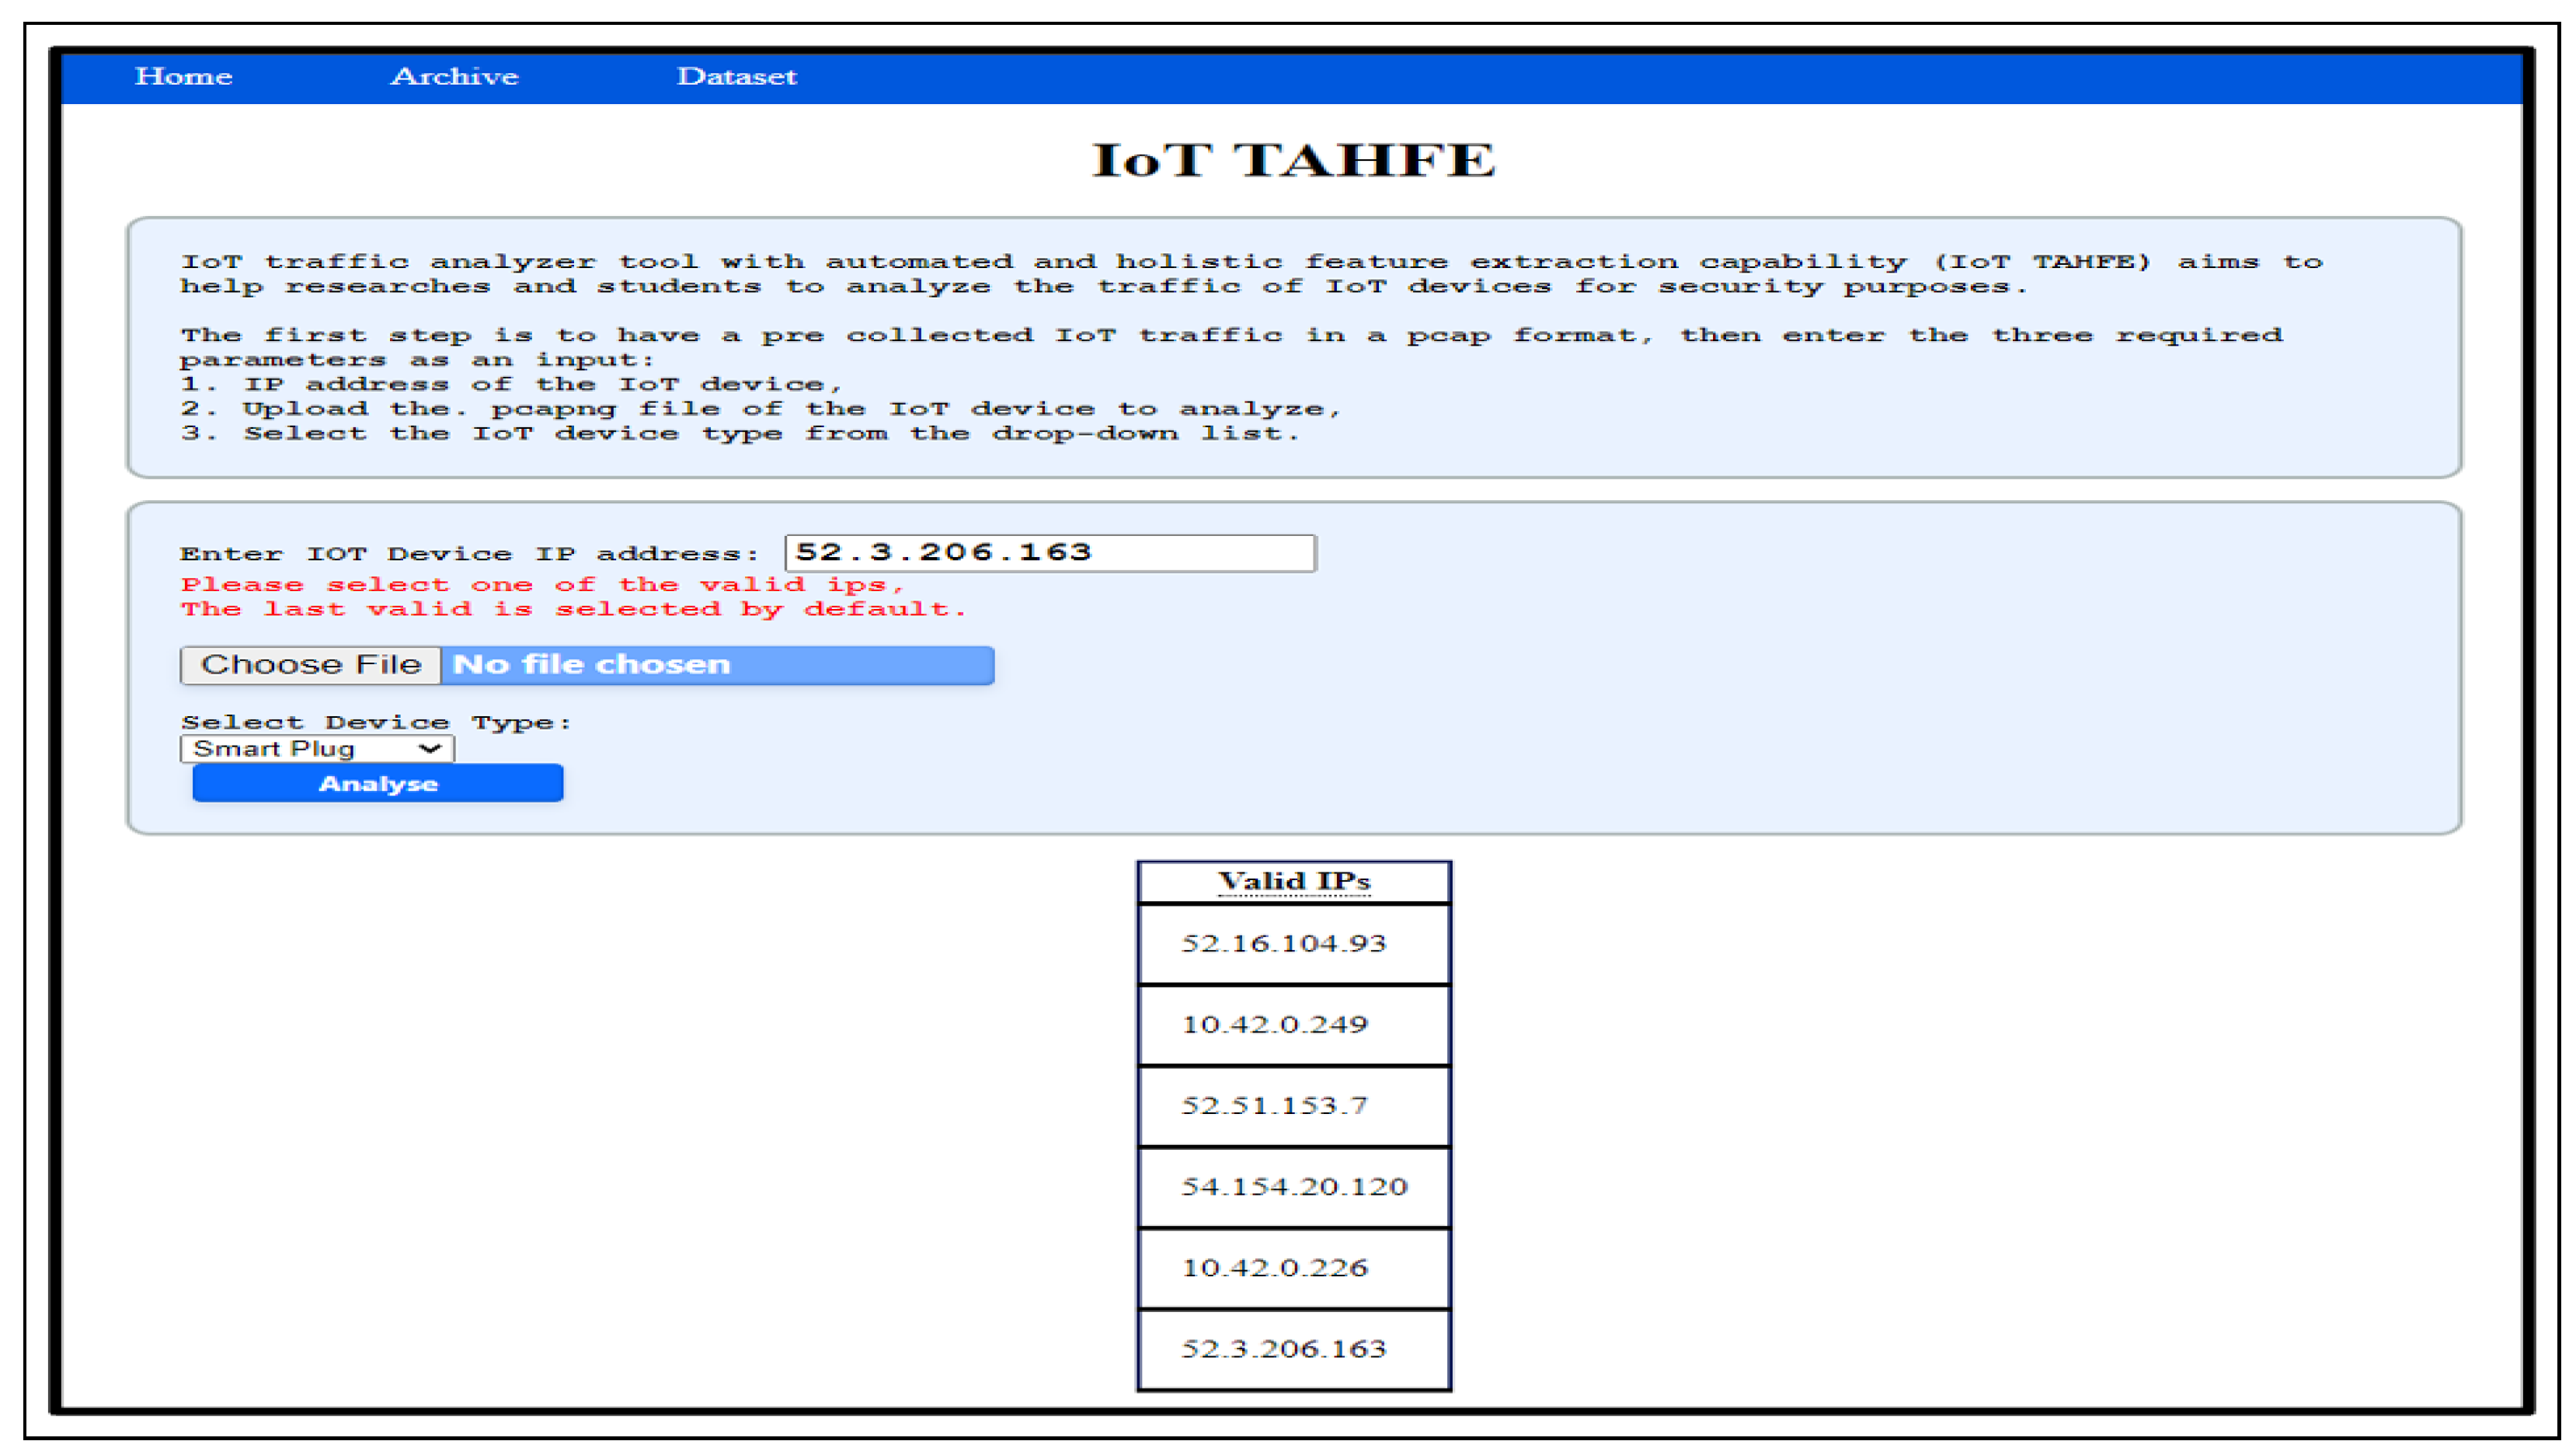
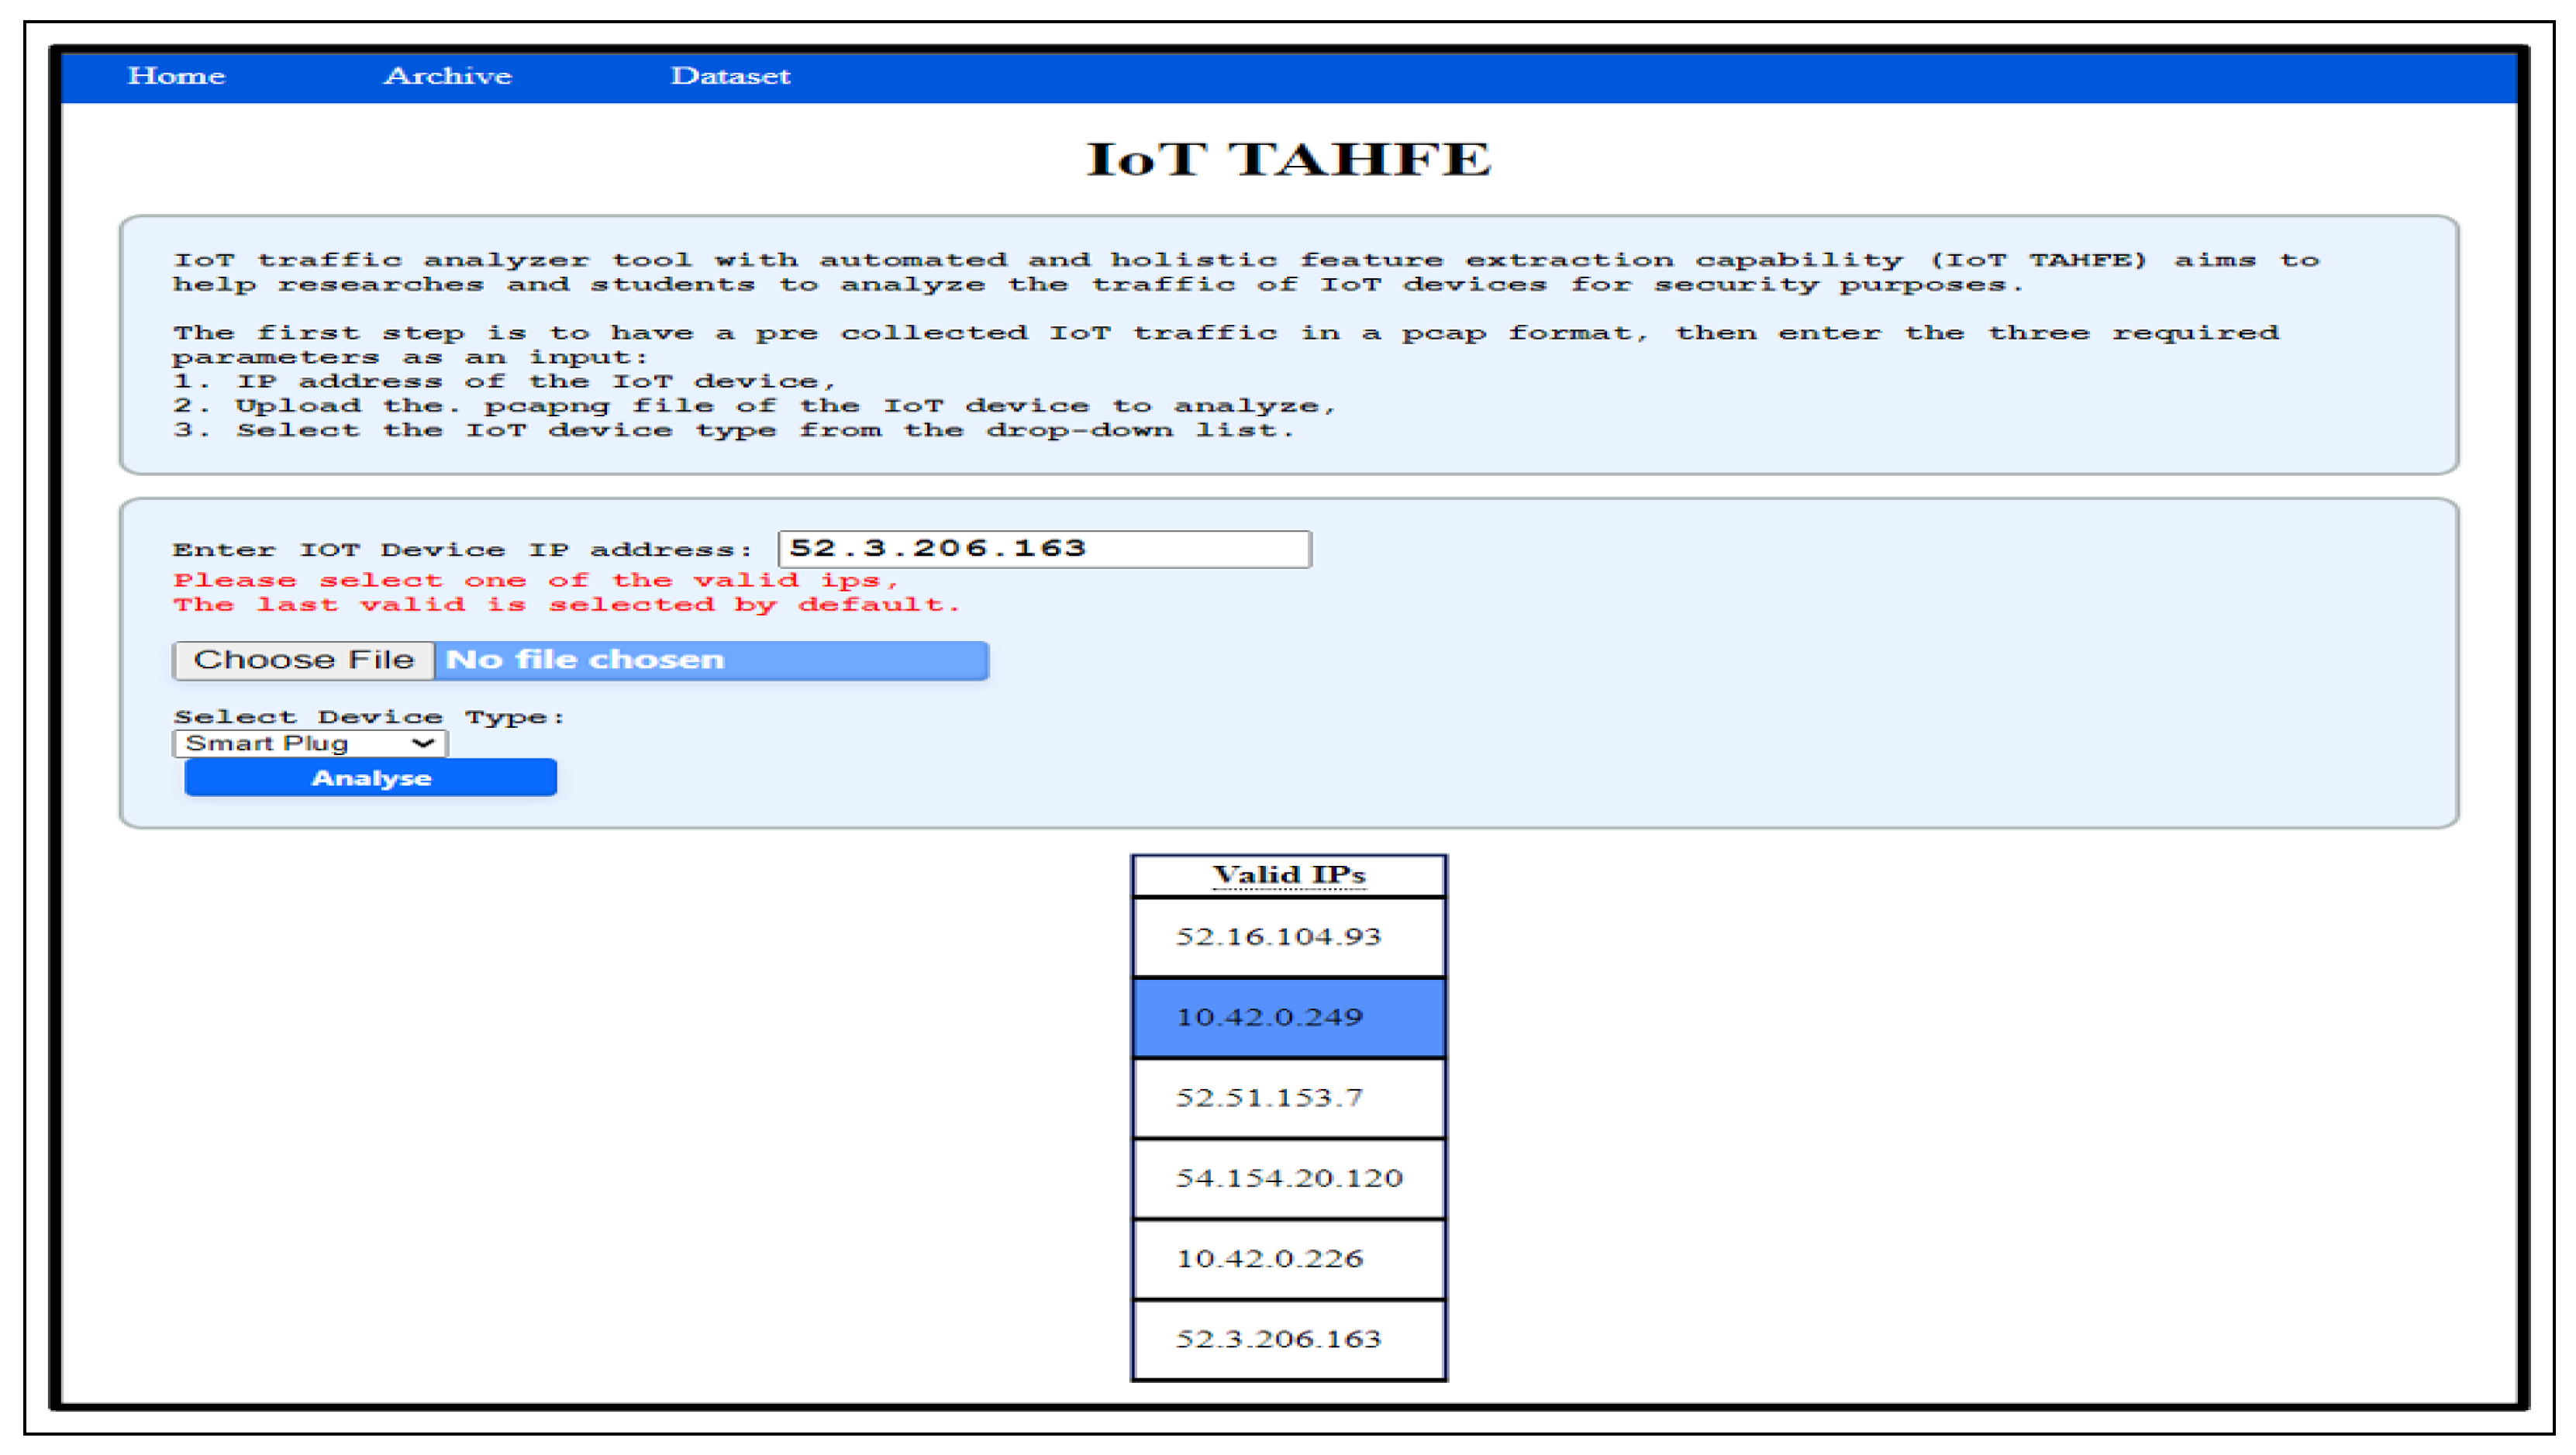
3.2.2. The Proposed Tool (IoT TAHFE)
- Provide the IP address of the IoT device for deep analysis.
- Select the IoT device type from a drop-down list (i.e., smart camera, smart plug, etc.).
- Upload the pcap file of the IoT device.
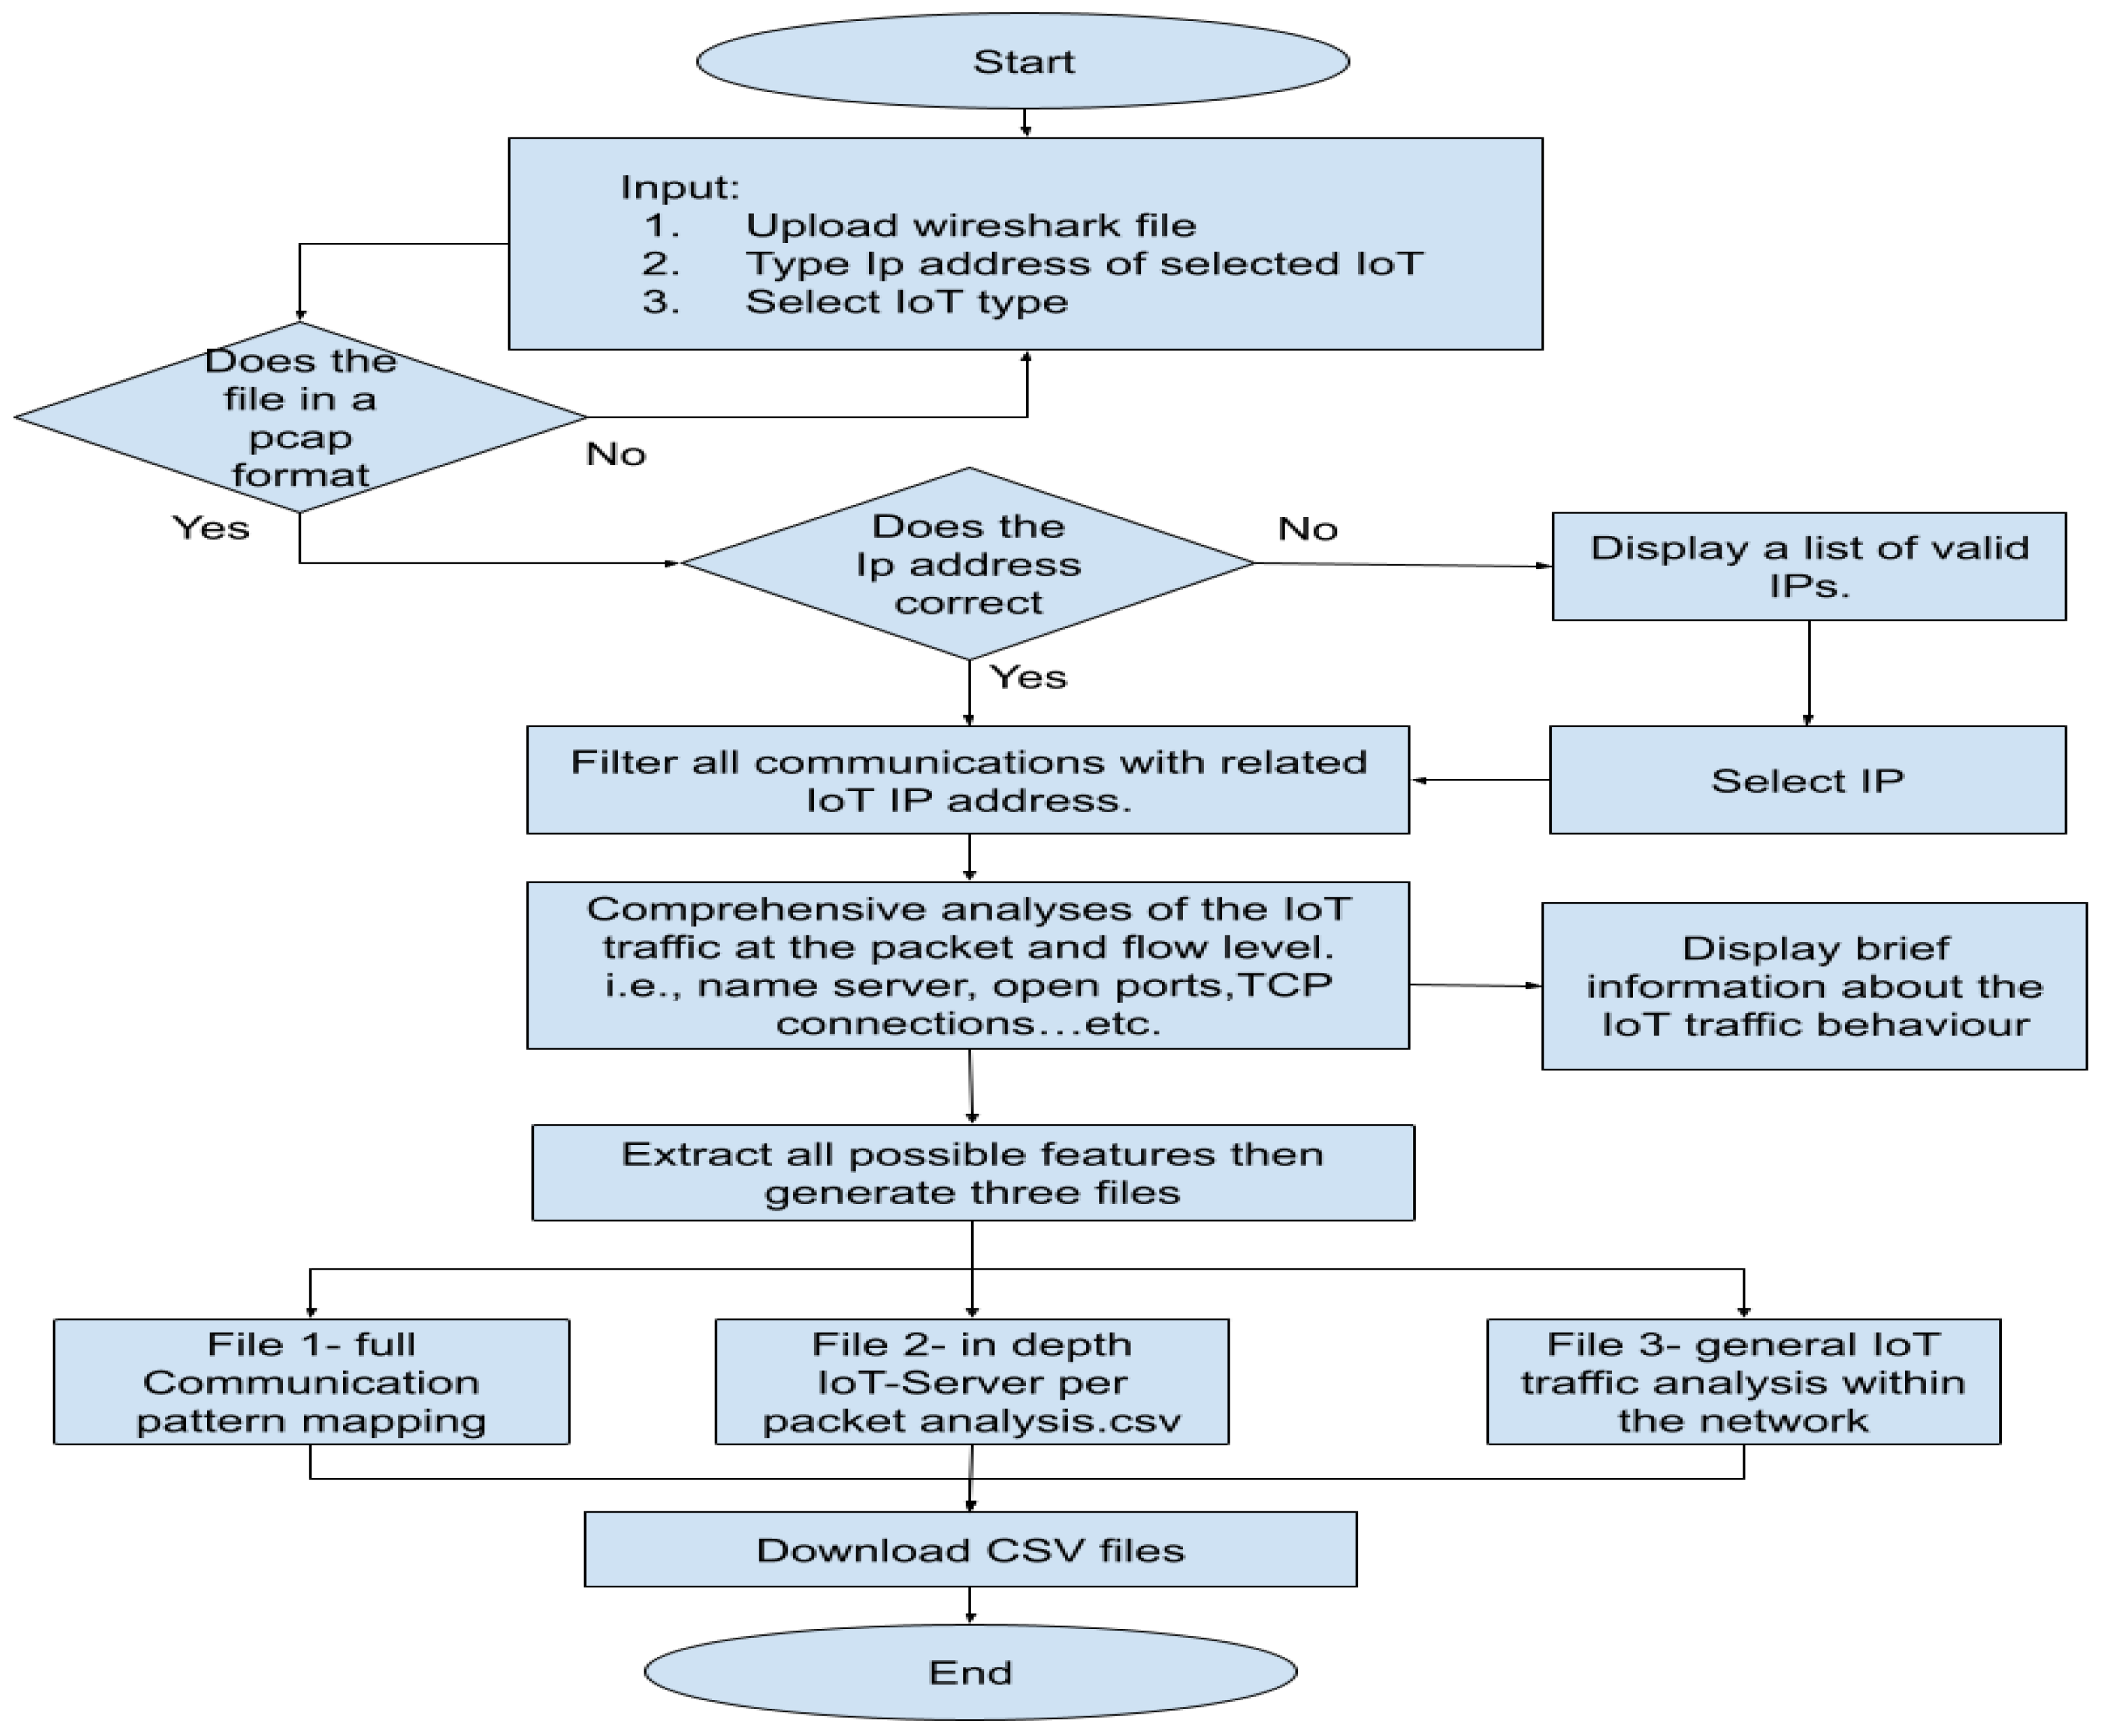
- check whether the uploaded file is in pcap file format or not. Otherwise, it will give an error message to upload the correct file format.
- check whether the IP address is typed correctly; otherwise, an error message appears to inform the user to enter the correct IP format.


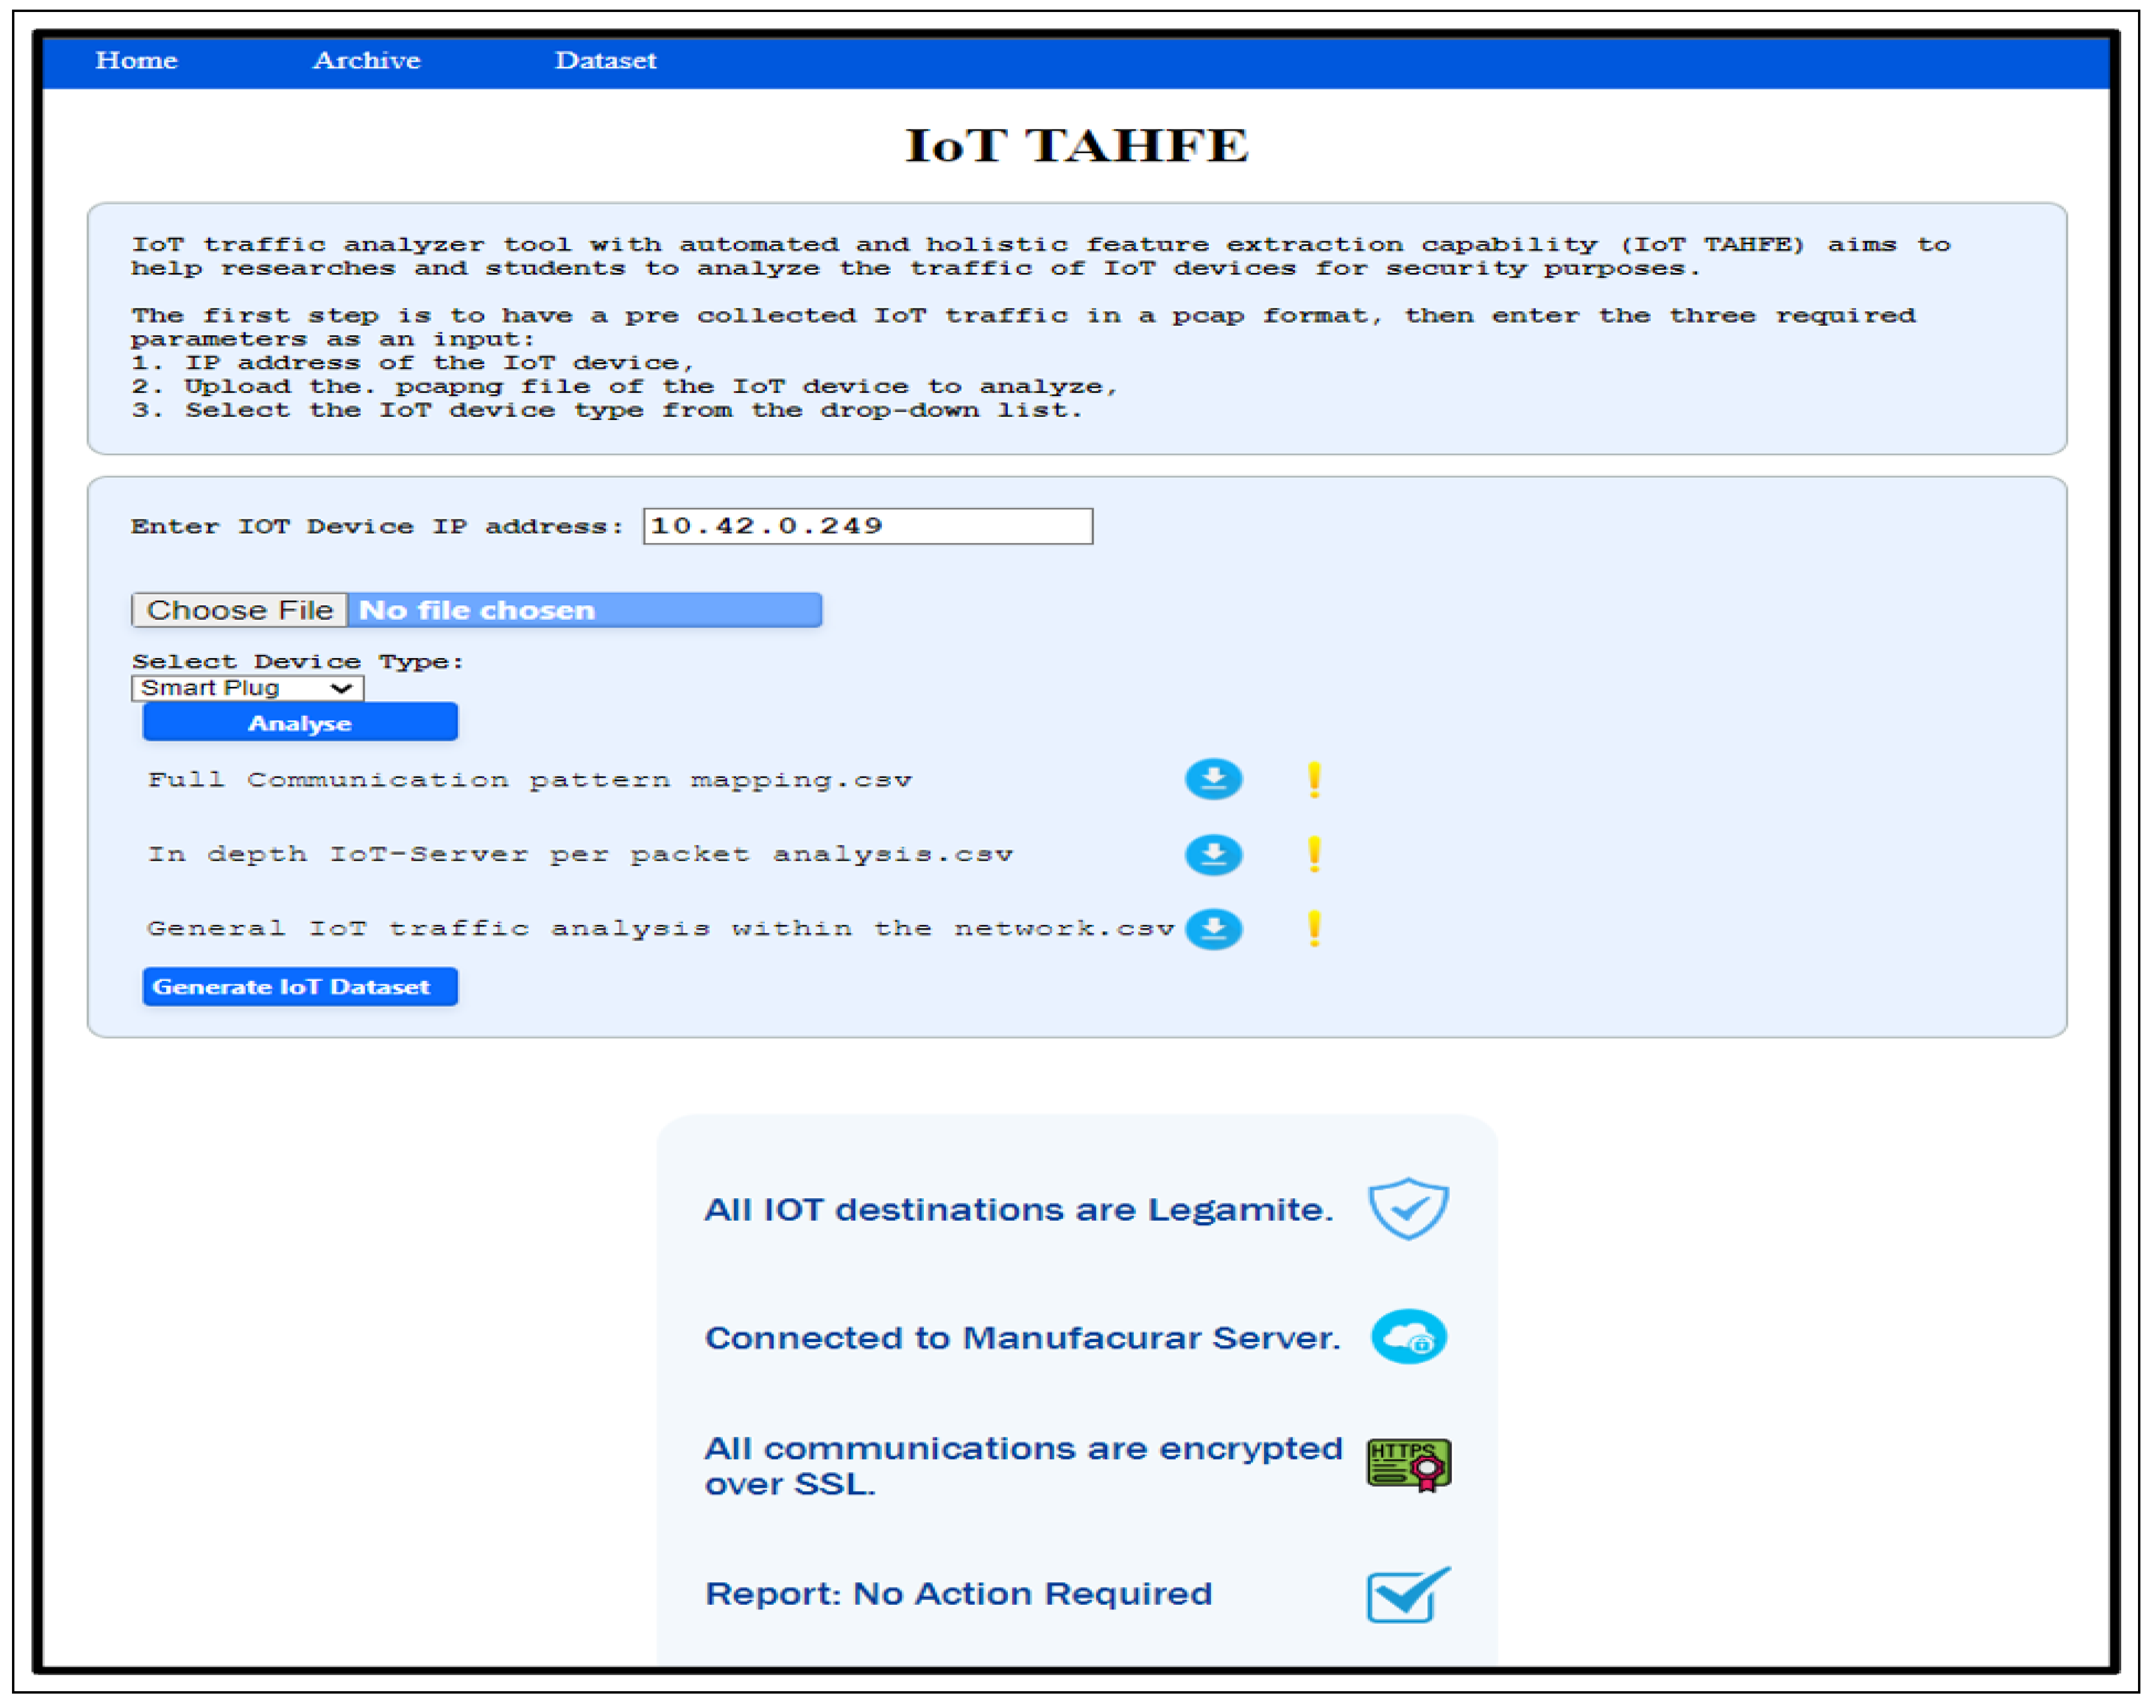
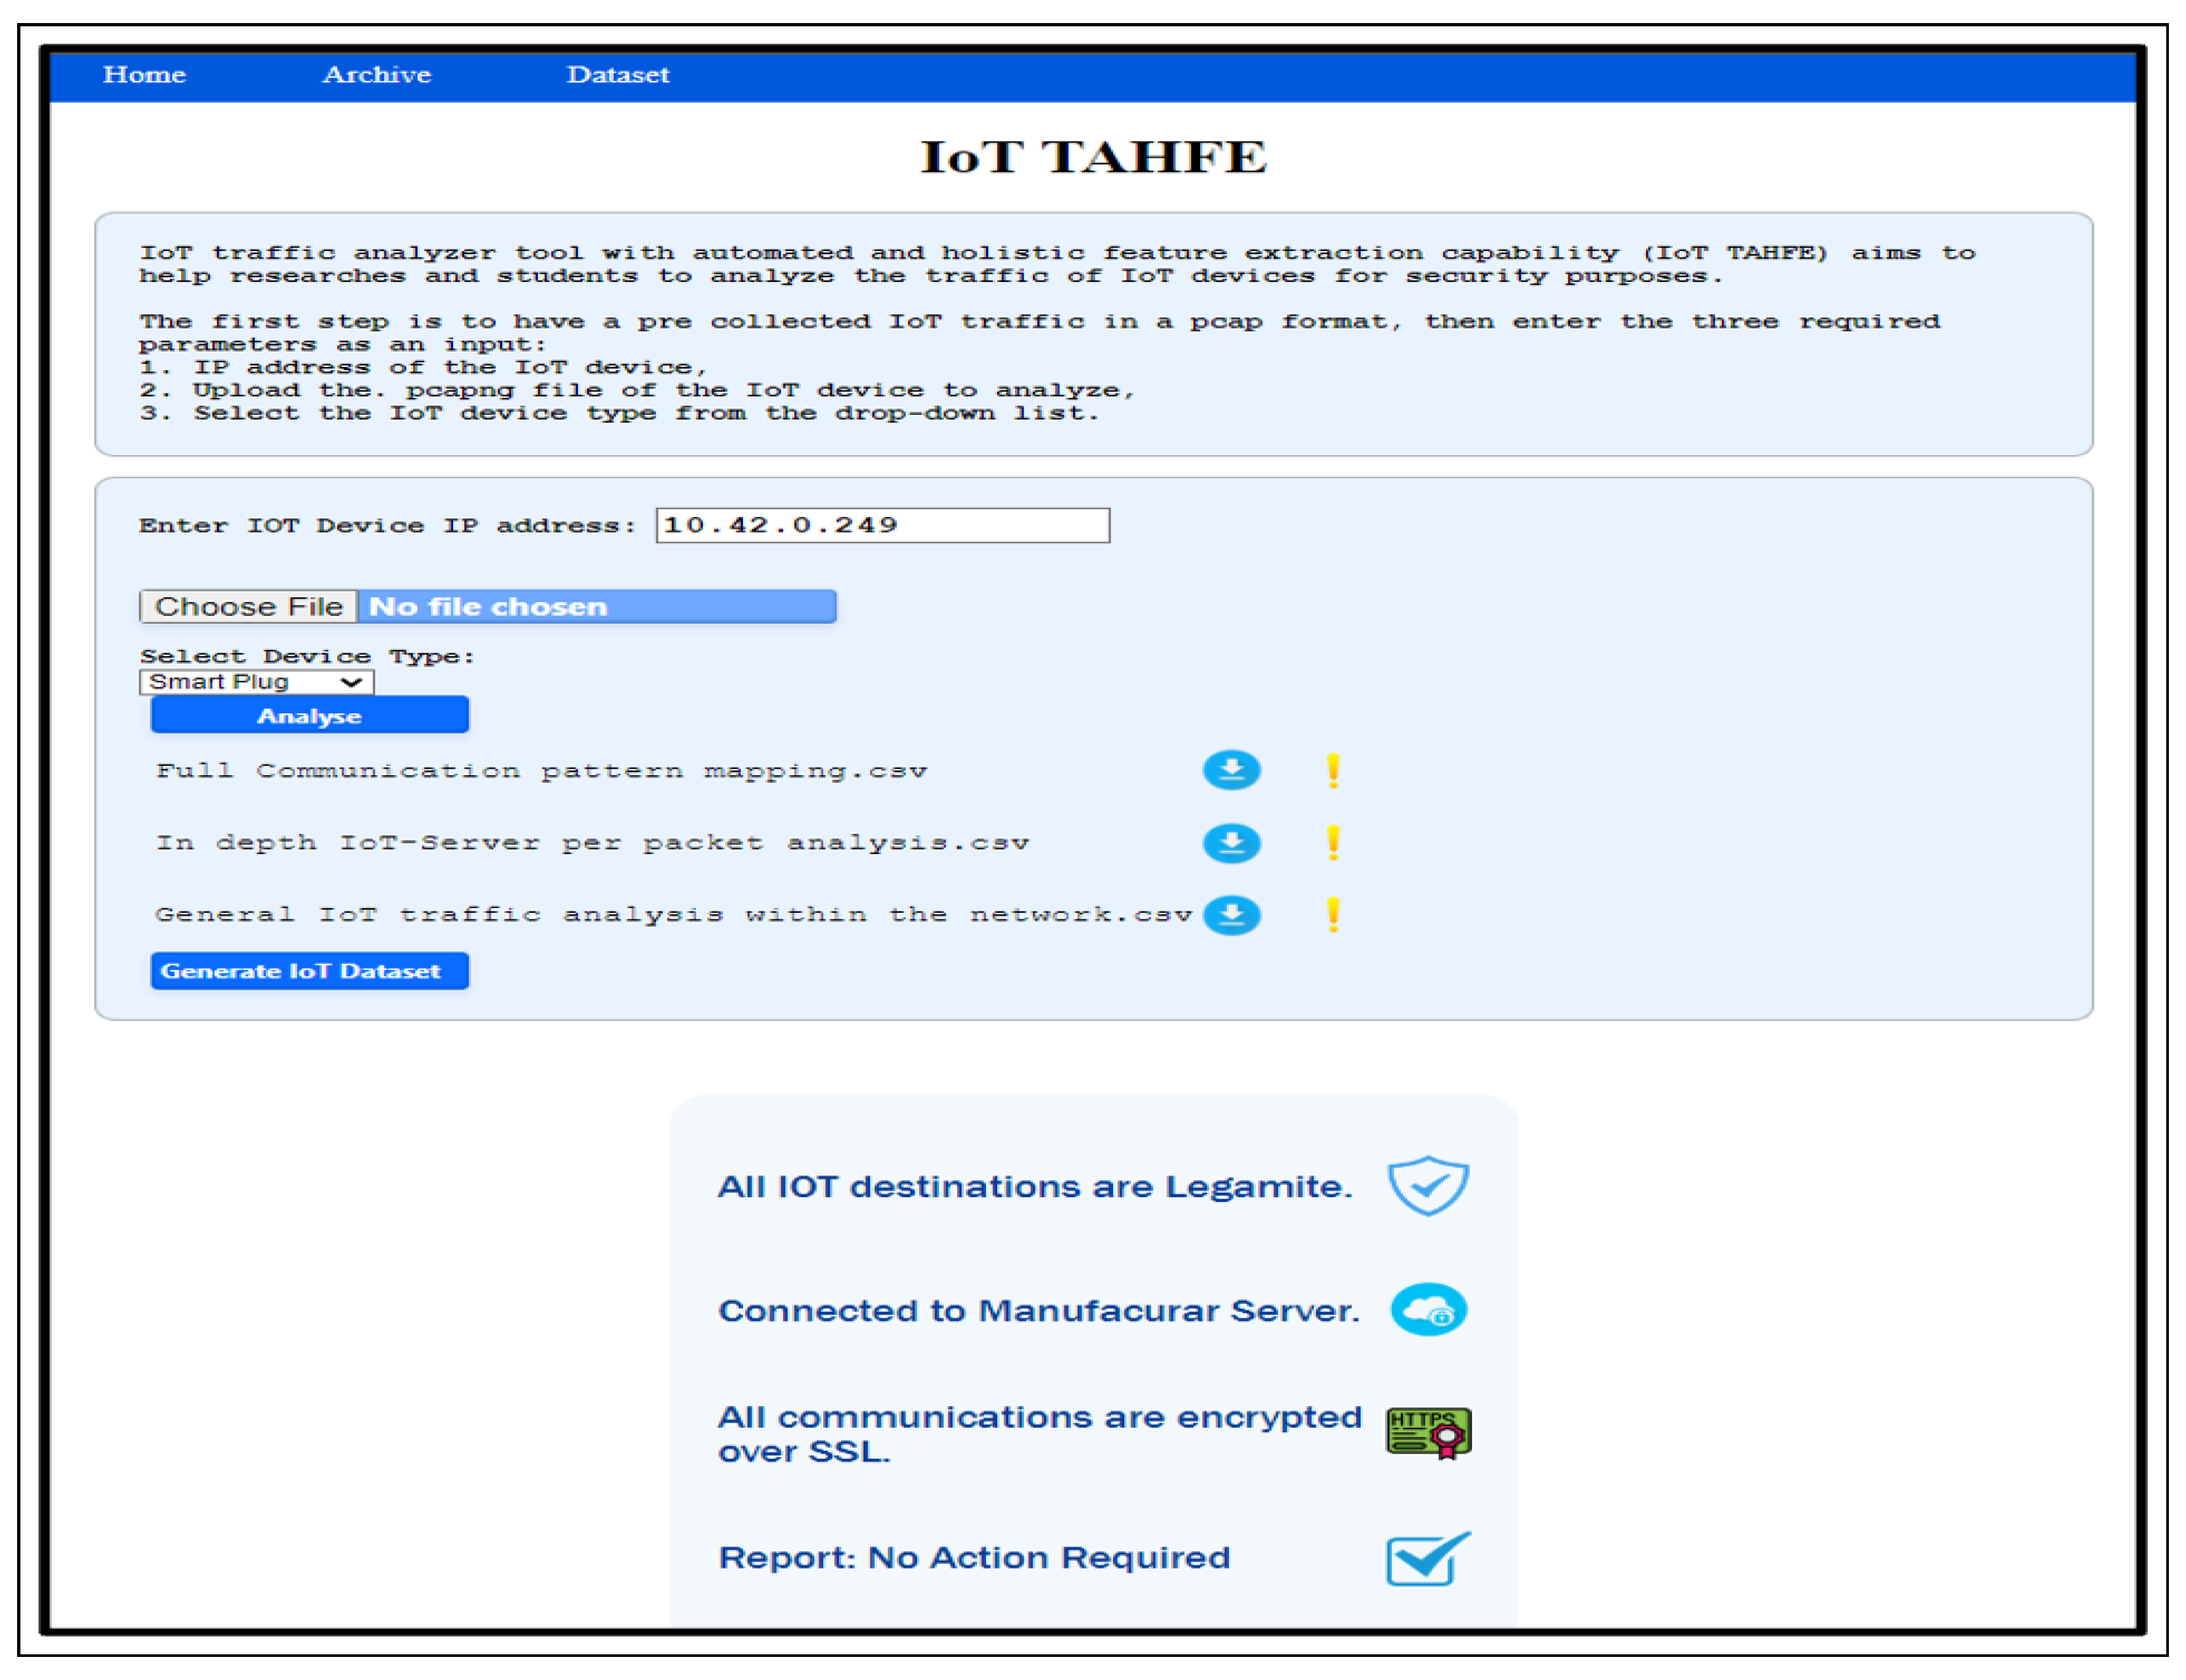
4. Result and Discussion
- The IoT device type, i.e., smart light, smart camera, etc.
- The IoT device behavior, i.e., whether the device is on, of, or idle.
- Human interaction type, i.e., determine the type of interaction between the user and the IoT device or the IoT app. For example, if the user is using the IoT app to switch on or off the smart plug.
- IoT behavior within the network, i.e., if the IoT interacts with other IoT or non-IoT devices that are connected to the same network.
- Abnormal behavior, i.e., attacks such as MITM detection or IP address spoofing detection.
4.1. Phase One: Packet Analysis Level
- First column “Feature”: list all the feature’s name.
- Second column “Description”: describe the purpose of the feature and its role in the packet network.
- Third column “Usage”: explain the objectives behind using such a feature.
- Fourth column “Importance”: explain the importance of using this feature or, in other words, why it is important in terms of the research.
- Fifth column “Network layer”: specify which OSI (Open Systems Interconnection) layer belongs to such a feature.
| No. | Feature | Description | Usage | Importance | OSI Layer |
|---|---|---|---|---|---|
| 1 | Dest_IP | destination IP addresses that communicate with the IoT device. | Each IoT connects with a fixed set of IPs that rarely change except for streaming devices. | Identify the IoT device type. | Transport layer and IP Layer. |
| 2 | Dest_port_ no | determines the port number of the destination IP address communication. | There is a usual range of communications ports for each device. | Identify the IoT device type | Transport layer. TCP/UDP Layer. |
| 3 | IoT_port_no | Determine the port number on the IoT device that communicates with the destination IP address.e.g., port 9999 | There is a usual range of communications ports for each device. | 1. Identify the IoT device type 2. Identify the IoT device behavior | Transport layer. TCP/UDP Layer. |
| 4 | Protocol | The application protocol of the communication. For example DNS & FTP & HTTP & IMAP & etc. | For each destination IP address & determine the protocol of the communication with the IoT device. | 1. Identify the IoT device type 2. Identify the IoT device behavior | Transport layer. IP Layer. |
| 5 | Send_ receive_ ratio | Calculating the ratio of the number of packets sent from the IoT device divided by the number of packets received from the server per minute in bytes | represents a pattern of sending to receiving | 1. Identify the IoT device type 2. Identify the IoT device behavior 3. Identify human interaction type 4. Identify abnormal behavior | Transport layer. TCP/UDP Layer. |
| 6 | No_of_ received_ packets_per_ minutes | Calculating the number of packets received by the IoT device per minute. | In normal usage & the number of received packets is in a specific range. | 1. Identify the IoT device type 2. Identify the IoT device behavior 3. Identify human interaction type 4. Identify abnormal behavior | Transport layer. TCP/UDP Layer. |
| 7 | No_of_sent_ packets_per_ minutes | Number of packets sent from the IoT device per minute | In normal usage & the number of sent packets is in a specific range. | 1. Identify the IoT device type 2. Identify the IoT device behavior 3. Identify human interaction type 4. Identify abnormal behavior | Transport layer. TCP/UDP Layer. |
| 8 | Avg TTL | Calculating the average of the maximum hops needed by a message to reach the server from the IoT device. | Each server usually has a const number of TTL. | Identify abnormal behavior | Data Link layer. IP Layer. |
| 9 | Flow volume | Calculating the total of download and upload bytes | Used to calculate the flow rate. | 1. Identify the IoT device behavior 2. Identify human interaction type | Transport layer. TCP/UDP Layer. |
| 10 | Flow duration | Calculating the time (in minutes) between the first packet and the last packet in a flow. | Used to calculate the flow duration. | 1. Identify the IoT device behavior 2. Identify human interaction type | Data Link layer. IP Layer. |
| 11 | Dest_ip_avg _packet _length | The average of the packet’s length, including the headers received by the destination IP from the IoT device. | IoT—API communications usually have a set of fixed packet length. | 1. Identify the IoT device type 2. Identify the IoT device behavior 3. Identify human interaction type | Network layer. IP layer. |
| 12 | Src_ip_avg _packet _length | The average of the packet’s length, including the headers sent by the destination IP to the IoT device. | IoT—API communications usually have a set of fixed packet length. | 1. Identify the IoT device type 2. Identify the IoT device behavior 3. Identify human interaction type | Network layer. IP layer. |
| 13 | Flow_rate | Calculating flow volume divided by the flow duration (in seconds) | IoT devices have a set of bandwidth values for each state. | 1. Identify the IoT device behavior | Transport layer. TCP/UDP Layer. |
| 14 | IsServer | Determine whether the destination IP address is a server or not | This feature is important to identify if the IoT device communicates with other IoT devices or with the server | 1. Identify the IoT device type | Network layer. IP layer. |
| 15 | Max_dest_ SSL_ payload | The maximum payload size of the SSL sent from the destination IP address to the IoT device. | Communication pattern recognition | 1. Identify the IoT device behavior 2. Identify the IoT device behavior 3. Identify human interaction type | Network layer. SSL - UDP - HTTP layer. |
| 16 | Min_dest_ SSL_ payload | The minimum payload size of the SSL sent from the destination IP address to the IoT device. | Communication pattern recognition | 1. Identify the IoT device behavior 2. Identify the IoT device behavior 3. Identify human interaction type | Network layer. SSL - UDP - HTTP layer. |
| 17 | Avg_dest_ SSL_ payload | Calculate the average size of the SSL payload sent from the destination IP address to the IoT device. | Communication pattern recognition | 1. Identify the IoT device behavior 2. Identify the IoT device behavior 3. Identify human interaction type | Network layer. SSL - UDP - HTTP layer. |
| 18 | Std_dest_ SSL_ payload | Calculate the standard deviation size of the SSL payload sent from the destination IP address to the IoT device. | Communication pattern recognition | 1. Identify the IoT device behavior 2. Identify the IoT device behavior 3. Identify human interaction type | Network layer. SSL - UDP - HTTP layer. |
| 19 | Max_IoT_ SSL_ payload | The maximum size of the SSL payload sent from the IoT device to the destination IP address IoT device. | Communication pattern recognition | 1. Identify the IoT device behavior 2. Identify the IoT device behavior 3. Identify human interaction type | Network layer. SSL - UDP - HTTP layer. |
| 20 | Min_IoT_SSL_ payload | The minimum size of the SSL payload sent from the IoT device to the destination IP address IoT device. | Communication pattern recognition | 1. Identify the IoT device behavior 2. Identify the IoT device behavior 3. Identify human interaction type | Network layer. SSL - UDP - HTTP layer. |
| 21 | Avg_IoT_ SSL_ payload | Calculate the average size of the SSL payload sent from the IoT device to the destination IP address. | Communication pattern recognition | 1. Identify the IoT device behavior 2. Identify the IoT device behavior 3. Identify human interaction type | Network layer. SSL - UDP - HTTP layer. |
| 22 | Std_IoT_ SSL_ payload | Calculate the standard deviation size of the SSL payload sent from the IoT device to the destination IP address. | Communication pattern recognition | 1. Identify the IoT device behavior 2. Identify the IoT device behavior 3. Identify human interaction type | Network layer. SSL - UDP - HTTP layer. |
| 23 | Dest_TCP_ Flags | The flag type of the packet in the TCP layer send from the IP destination to the IoT device | determines the flag type from SYN to ACK | 1. Identify the IoT device type 2. Identify abnormal behavior | transport layer. Layer TCP |
| 24 | IoT_TCP_ Flags | The flag type of the packet in the TCP layer sends from the IoT device to the IP destination. | determines the flag type from SYN to ACK | 1. Identify the IoT device type 2. Identify abnormal behavior | transport layer. Layer TCP |
- First column “Feature”: list all the features name of that represent one complete communication.
- Second column “Description”: describe the purpose of the feature and its role in the packet.
- Third column “Usage”: explain the objectives behind using such a feature.
- Fourth column “Importance”: explain the importance of using this feature or, in other words, why it is important in terms of the research.
| No. | Feature | Description | Usage | Importance |
|---|---|---|---|---|
| 1 | src_IP | IP of the device that initialized the communication (either the IoT or the server) | Communication Analysis. Identifies the type and model of devices. Profile the device. | Identify the IoT device type |
| 2 | src_Port | Port number of the device that initialized the communication either from the IoT device or the IoT server | Communication Analysis. Identifies the type and model of devices. Profile the device. | Identify the IoT device type |
| 3 | dst_IP | IP address of the device that received the communication either from the IoT device or the IoT server | Communication Analysis. Identifies the type and model of devices. Profile the device. | Identify the IoT device type |
| 4 | dst-port | Communication port of the device that received the communication either from the IoT device or the IoT server | Communication Analysis. Identifies the type and model of devices. Profile the device. | Identify the IoT device type |
| 5 | Protocol | communication protocol (only TCP) either from the IoT device or the IoT server | Communication Analysis. Identifes the type and model of devices. Profile the device. | Identify the IoT device type |
| 6 | req_packet_ Length | total size of the packet (including headers) of the request packet either from IoT device or IoT server | Communication Analysis. Identifies the type and model of devices. Profile the device. | 1. Identify the IoT device type
2. Identify the IoT device behavior 3. Identify human interaction type |
| 7 | res_packet_ Length | total size of the packet (including headers) of the request packet either from the IoT device or the IoT server | Communication Analysis. Identifes the type and model of devices. Profile the device. | 1. Identify the IoT device type
2. Identify the IoT device behavior 3. Identify human interaction type |
| 8 | req_Payload | The size of the actual data (excluding headers) Of the request packet either from the IoT device or the IoT server | Communication Analysis. Identifes the type and model of devices. Profile the device. | 1. Identify the IoT device type
2. Identify the IoT device behavior 3. Identify human interaction type |
| 9 | resp_packet_ Payload | The size of the actual data (excluding headers) Of the response packet either from the IoT device or the IoT server | Communication Analysis. Identifes the type and model of devices. Profile the device. | 1. Identify the IoT device type
2. Identify the IoT device behavior 3. Identify human interaction type |
| 10 | req_TTL | request Time-to-live (TTL) is a value for limiting the maximum period of time that a packet should exist on the network before being discarded. | communication pattern recognition. Each server communication usually has a single value for all communication. | Identify abnormal behavior i.e., attacks such as MITM detection or IP address spoofing detection |
| 11 | resp_time_min | minimum response time (difference between request and response time as recorded by the capturing device) for that communication pattern. | communication pattern recognition. If time is below minimum time, it is likely that the server is closer now. | Identify abnormal behavior i.e., attacks such as MITM detection or IP address spoofing detection |
| 12 | resp_time_avg | average means summing all communication responses times as defined above and dividing the sum by their count. | communication pattern recognition. Communication Analysis. | Identify abnormal behavior i.e., attacks such as MITM detection or IP address spoofing detection |
| 13 | resp_time_max | Maximum response time (difference between request and response time as recorded by the capturing device) for that communication pattern. | communication pattern recognition. If time is above maximum time, it is likely that there is slow internet detection. | Identify abnormal behavior i.e., attacks such as MITM attack have been established and data is delayed to being proceeded by a new node and passing through a longer route including the MITM device. |
| 14 | repentance | The number of times that this communication pattern repeated in the pcap file. | communication pattern recognition. The more this communication has repeated the more it is likely it represents a normal usage or an API communication. | 1. Identify the IoT device type
2. Identify the IoT device behavior 3. Identify human interaction type |
| 15 | Repentance_ per_minute | The number of times that this communication pattern repeated per minute. | communication pattern recognition. The more this communication has repeated the more it is likely it represents a normal usage or an API communication. | 1. Identify the IoT device type Identify current management status (if the device is being controlled by app). |
| 16 | IsServer | does one of the communication sides have a valid server name. | Communication Analysis. Devices from which hackers launch their attacks are very unlikely to have a valid server name as it requires payment which can be linked to the user. (some hosting sites allow untraceable payments by Bitcoin and Ethereum) | 1. Identify the IoT device type Identify current management status (if the device is being controlled by the app). |
4.2. Phase Two: Flow Analysis Level
- First column “Feature”: list all the features names that represent one complete communication.
- Second column “Description”: describe the purpose of the feature and its role in the packet.
- Third column “Usage”: explain the objectives behind using such a feature.
- Fourth column “Importance”: explain the importance of using this feature or, in other words, why it is important in terms of the research.
| No. | Feature | Description | Usage | Importance |
|---|---|---|---|---|
| 1 | Sum_of_all_ packets | calculates the total number of all sent and received packets per minute that targeted the IoT device. | to determine the total number of packets in normal communication. However, a change in number of packets may requires further inspection. | Identify abnormal behavior |
| 2 | No_TCP_ handshake | calculates the total number of TCP handshakes between the IoT device and the destination IP address in a traffic flow | to determine the total number of handshakes in normal communication. However, a change in the number of handshakes may require further inspection. | Identify abnormal behavior |
| 3 | TCP_reset | calculates the total number of rejected connections by the IoT device. | to determine the total number of packets sent by the IoT that contain a set-reset flag in normal communication. | Identify abnormal behavior, i.e., if someone is trying to implement reconnaissance against the IoT device. |
| 4 | No_of_IP_ servers | Total number of IP servers that communicate with the IoT device | to determine the total number of independent servers that communicate with the IoT; either the IoT servers or any third-party servers | Identify the IoT behavior within the network, i.e., if the IoT device communicates with other IoT devices or with the server. |
| 5 | No_of_TCP_ connection | Number of TCP connection in normal network flow | to determine the total number of TCP connections that was established with the IoT. Each IoT has max of 1 or 2 TCP connections. extra connections indicate that the device is being accessed by multiple users. | 1. Identify the IoT behavior within the network 2. Identify abnormal behavior |
| 6 | No_UDP_ connection | Number of UDP connections in normal network flow | to determine the total number of UDP connections that was established with the IoT. Each IoT has a max of 2 UDP connections except streaming connections. extra connections indicate that the device is being accessed by multiple users. | 1. Identify the IoT behavior within the network 2. Identify abnormal behavior |
| 7 | No_of_Dest_ TCP_ports | Total number of destinations TCP ports in a normal network flow | to determine the total number TCP ports, open on the remote server. Usually IoT connect to APIs on 80 and 443, new ports would require inspection. | 1. Identify the IoT behavior within the network 2. Identify abnormal behavior |
| 8 | No_IoT_TCP_ ports | Total number of open IoT TCP ports in a normal network flow | to determine the total number of open TCP ports on the IoT device. IoT has a range of ports to start TCP connections. | 1. Identify the IoT behavior within the network 2. Identify abnormal behavior 3. Identify the IoT device type |
| 9 | No_of_Dest_ UDP_ports | Total number of destinations UDP ports in a normal network flow | to determine the total number of UDP ports open on remote servers. Usually IoTs connect to time and DNS servers on 123 and 53 | 1. Identify the IoT behavior within the network 2. Identify abnormal behavior 3.Identify the IoT device type |
| 10 | No_of_IoT_ UDP_ports | Total number of open IoT UDP ports in a normal network flow | to determine the total number UDP ports open on the IoT. IoT has a range of ports to start UDP connections. | 1. Identify the IoT behavior within the network 2. Identify abnormal behavior 3. Identify the IoT device type |
| 11 | No_of_ irresponsive_ ports | Number of ports that do not respond to a connection | to determine the total number of ports that didn’t respond back to the communication attempt. Irresponsive ports are a definite indication of exploitation. | Identify abnormal behavior |
| 12 | No_of_DNS_ request | Number of DNS queries in a normal network flow | to determine the total number of DNS requests initialized by the IoT. Connections reset are usually followed by DNS requests and NTP requests which usually occur before attacks. | Identify abnormal behavior |
| 13 | No_of_DNS_ response | Number of DNS responses in a normal network flow | to determine the total number of DNS responses received by the IoT. | Identify abnormal behavior |
| 14 | No_of_NTP_ request | Number of time requests in a normal network flow | to determine the total number of NTP requests initialized by the IoT. | Identify abnormal behavior |
| 15 | No_of_NTP_ response | Number of time requests in a normal network flow | to determine the total number of NTP responses received by the IoT. | Identify abnormal behavior |
4.3. Tool Evaluation
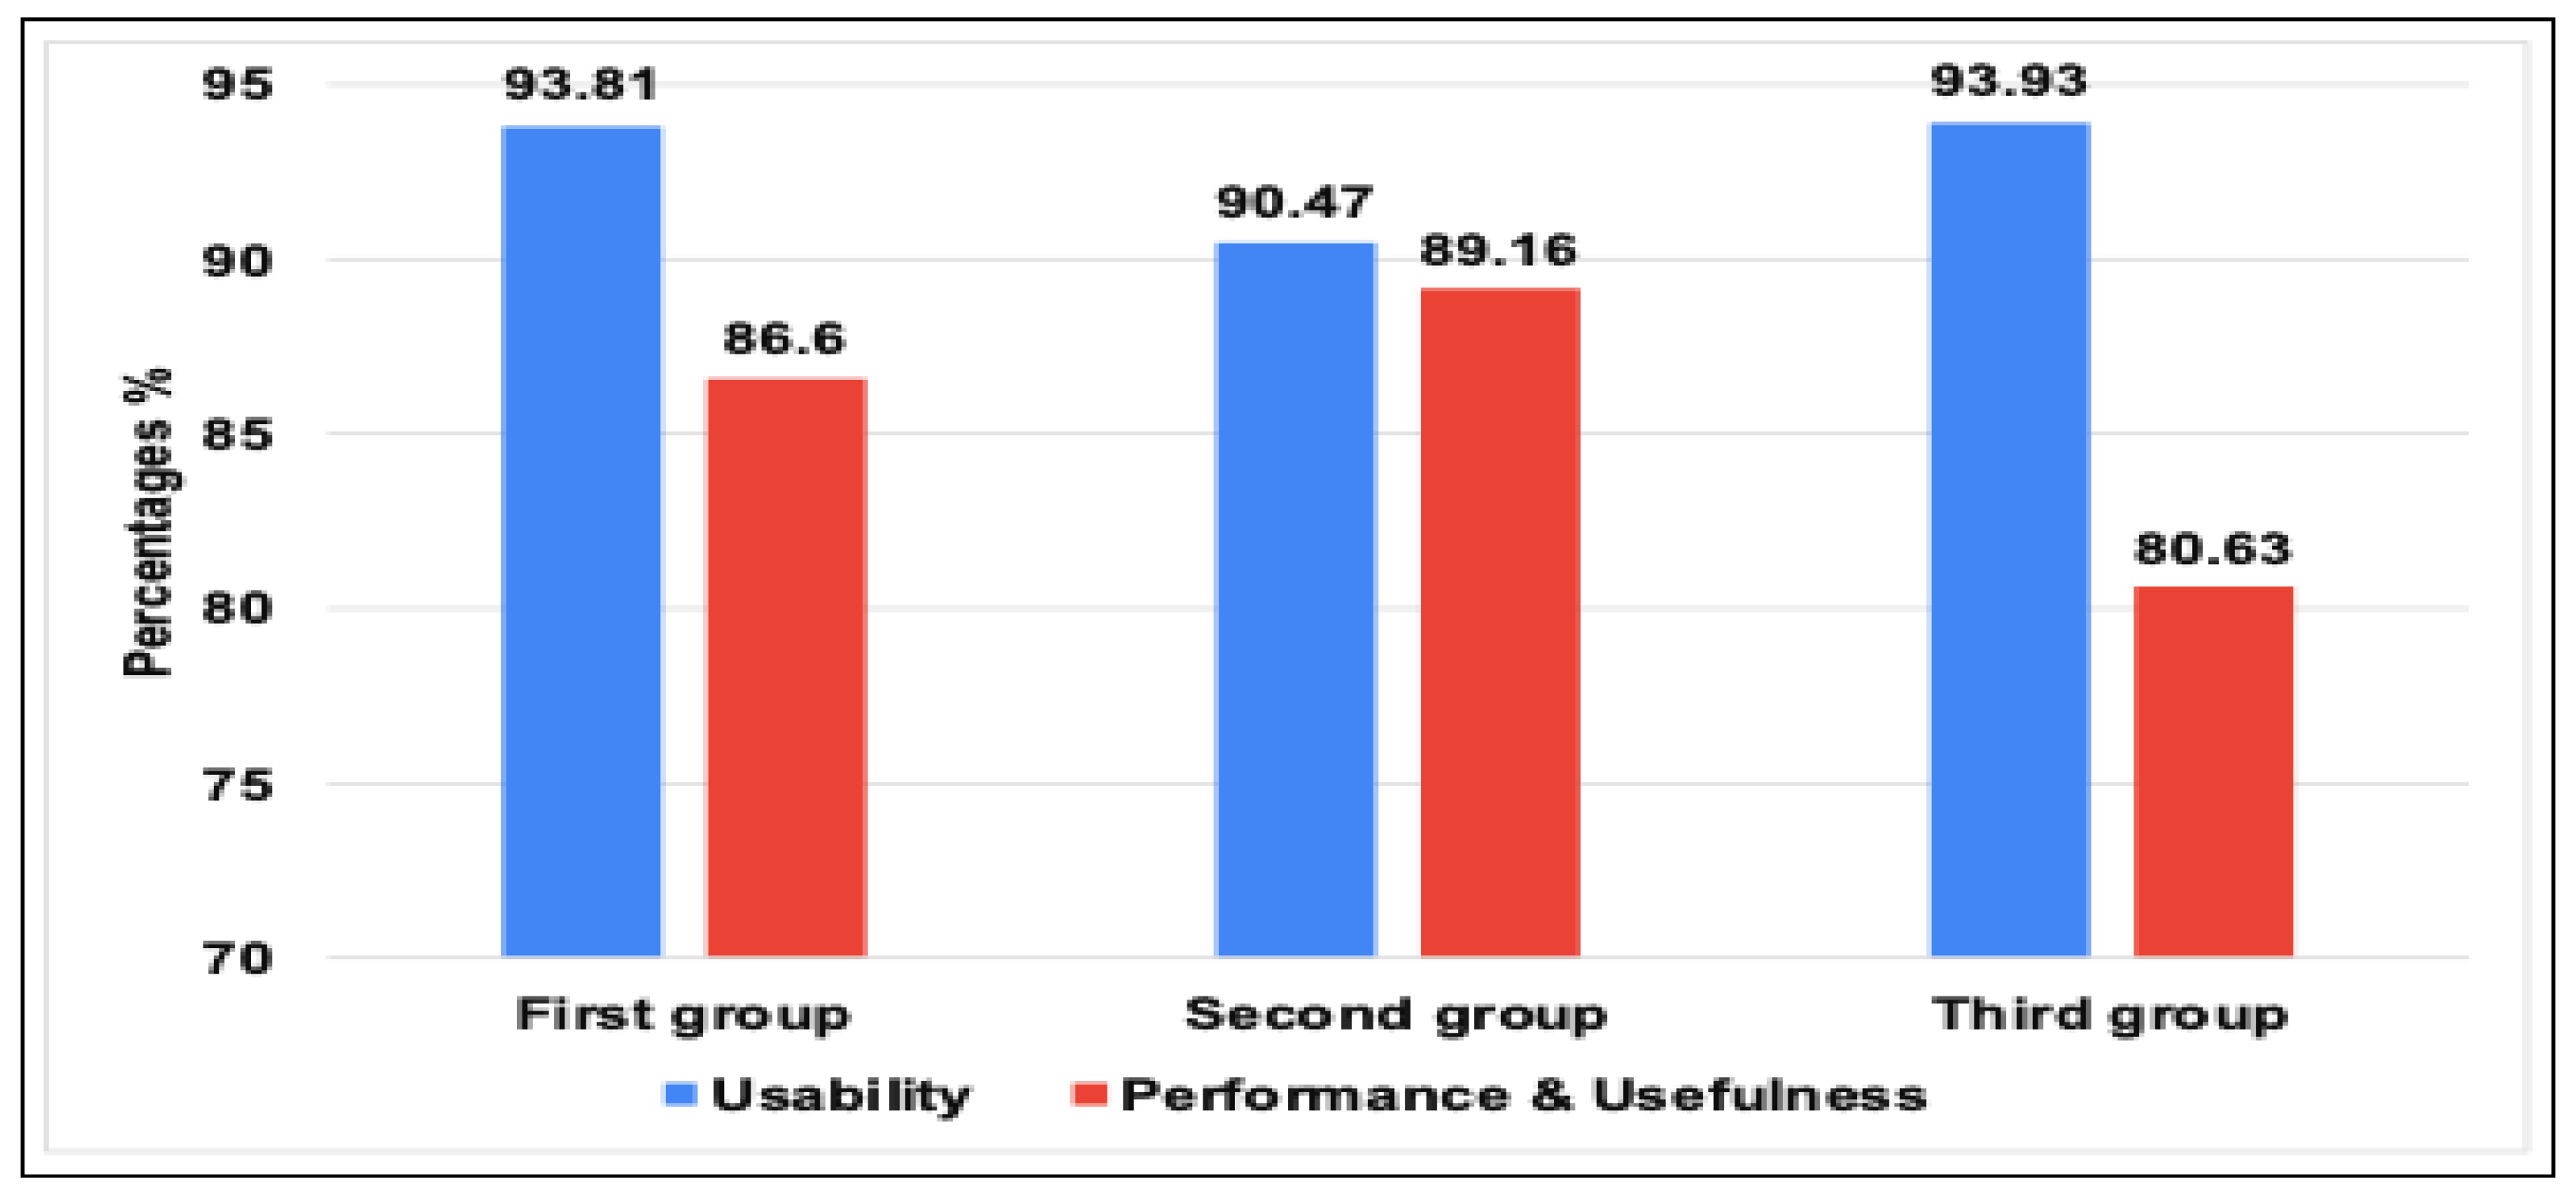
- As seen in Figure 7, all three groups of IoT researchers expressed high satisfaction levels with the tool’s interface and ease of use (usability of the tool). The first and second groups reported scores of 93.8%, while the last group had a score of 90.5%. These results indicate that users found the tool easy to use and had a positive overall experience while interacting with it.
- We assessed the tool’s performance and usefulness based on the perceptions of the three IoT researcher groups. We tested the tool’s speed of extracting all possible features from network traffic data and its usefulness in providing meaningful information that researchers can use to improve IoT systems’ security and efficiency. All three groups expressed their satisfaction with the performance and usability of the tool, with scores of 86.6%, 89.16%, and 80.36%, respectively.
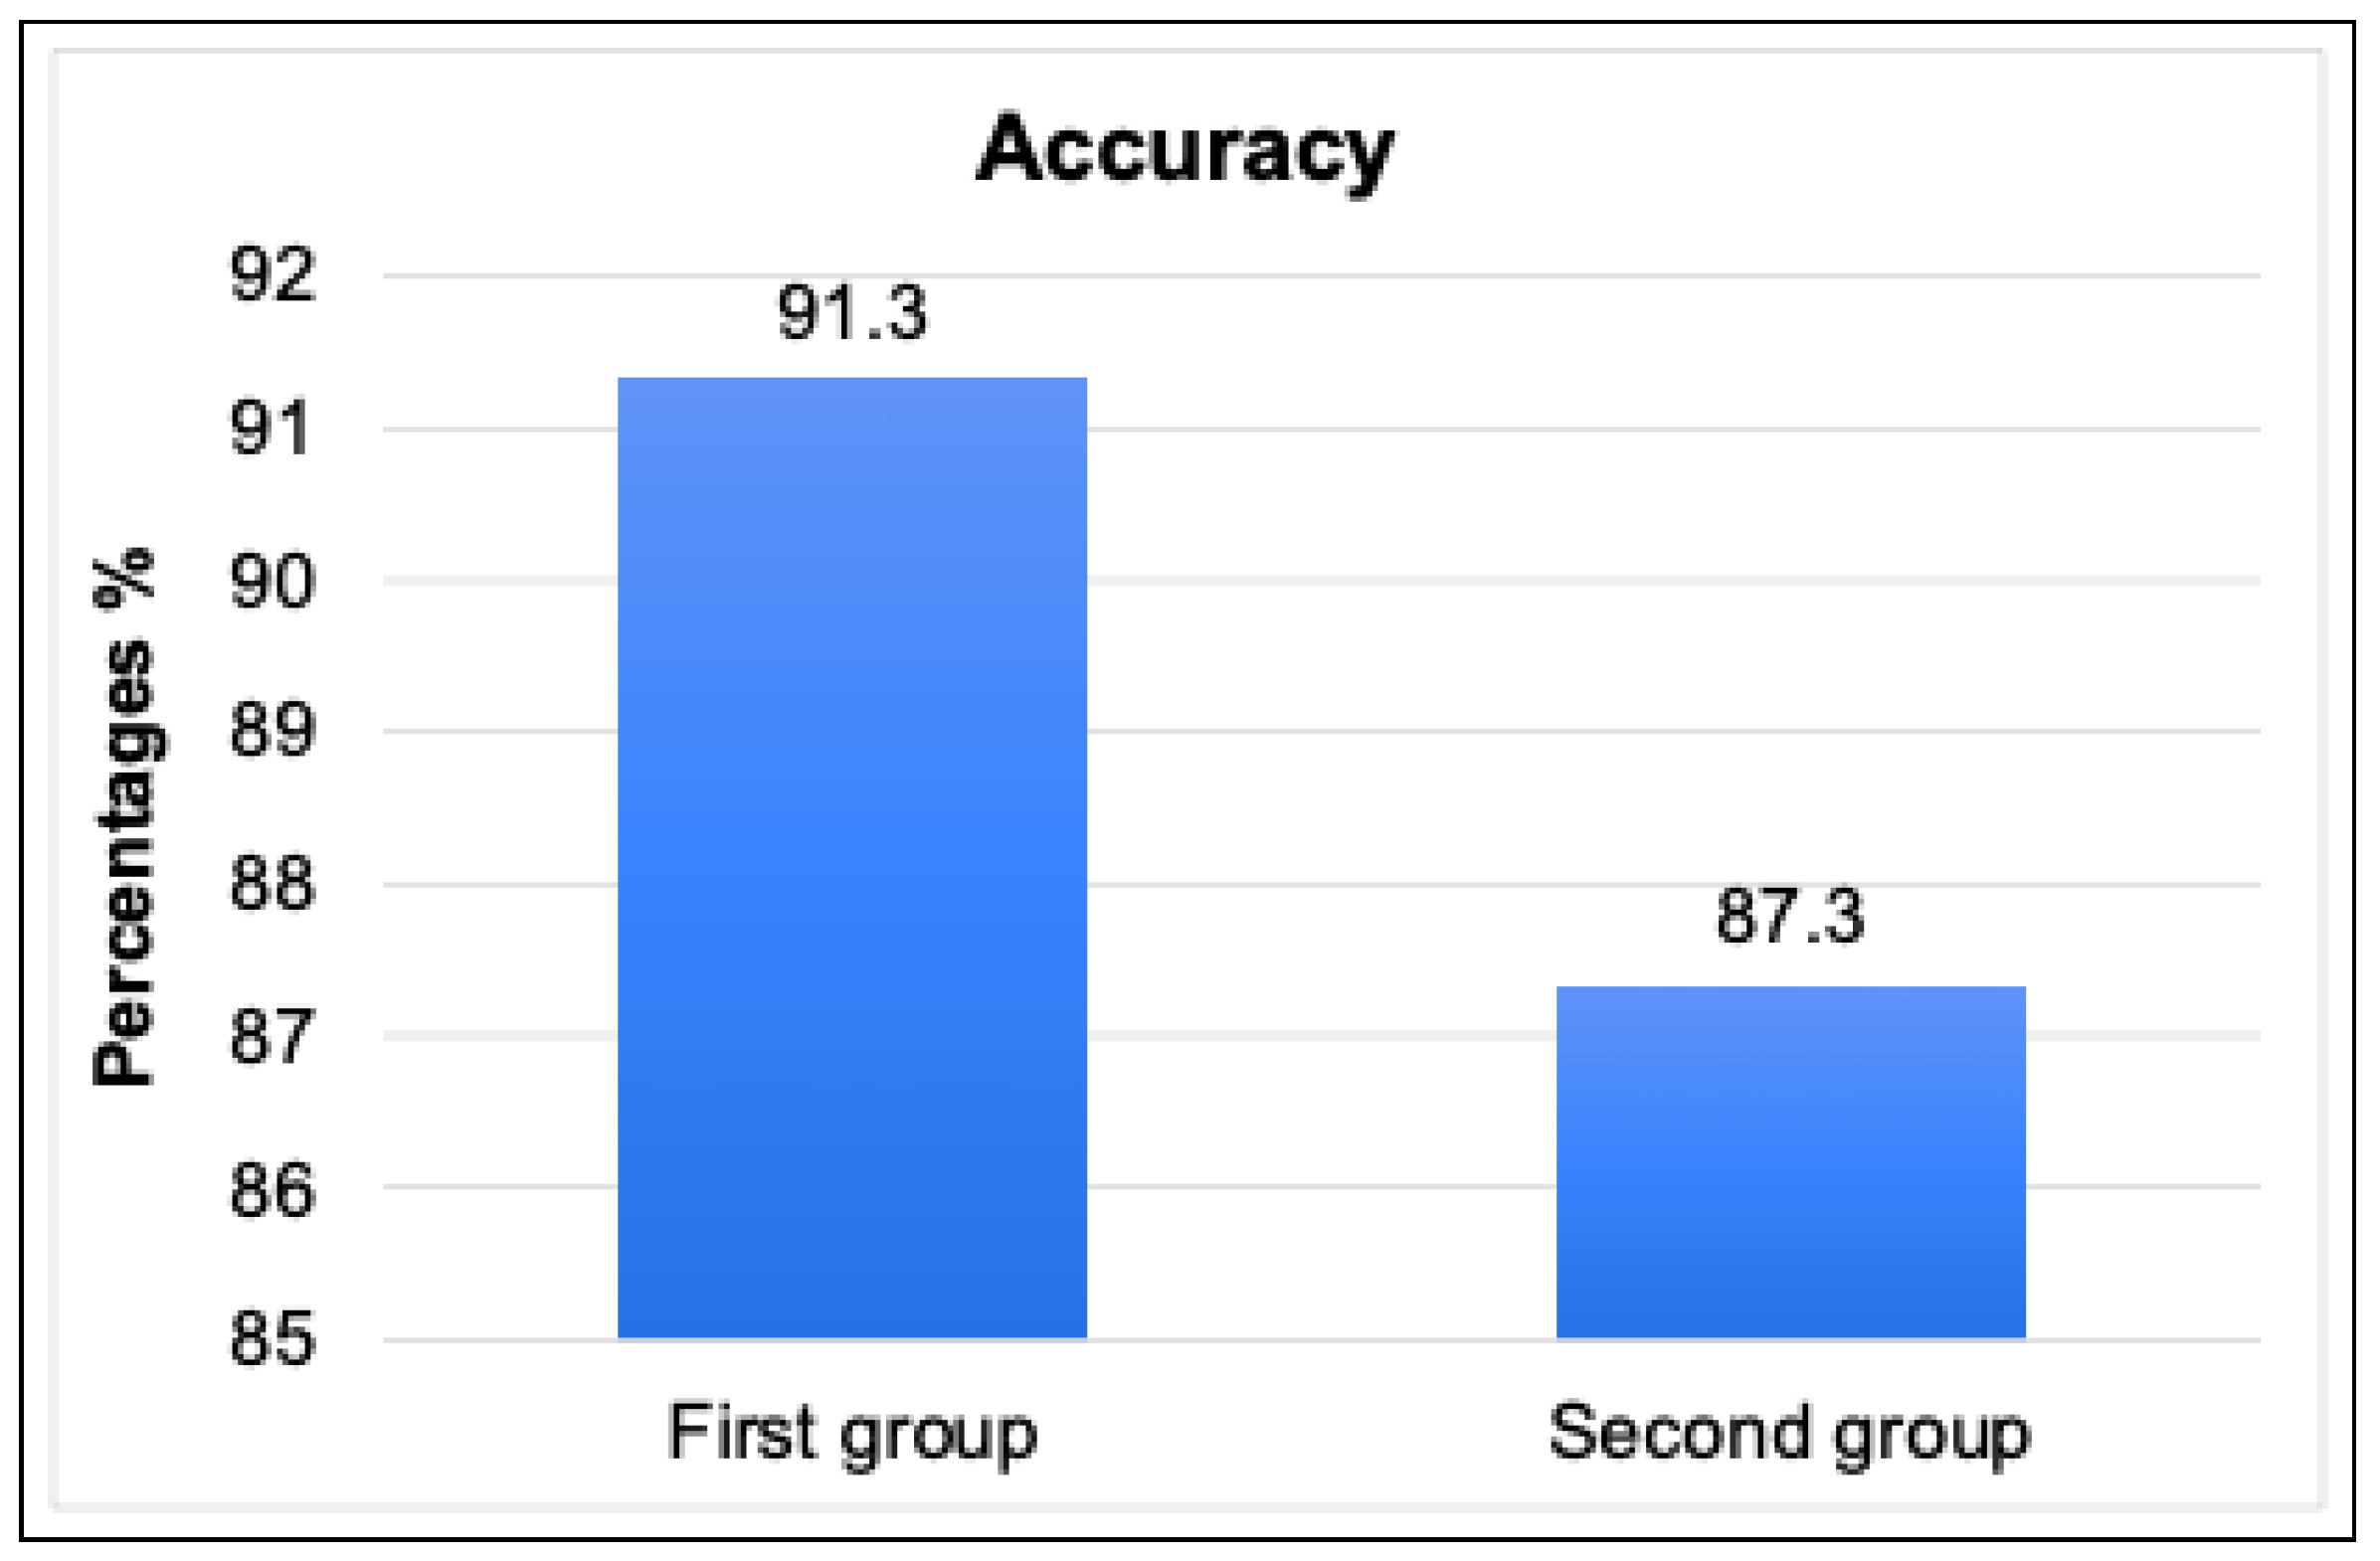
- We evaluated the accuracy and relevance of the information provided by the tool. As you can see in Figure 8, we relied on the perceptions of the first and second groups of researchers, who already had results to compare with. This involved assessing how well the tool can extract relevant information from network traffic, such as identifying IoT devices, behavior patterns, human interactions, and abnormal behavior data, and how reliable the tool is. The first group found the extracted features to be very similar to their published results, with a rate of 91.3%, while the second group rated the accuracy moderately similar with 87.3%.
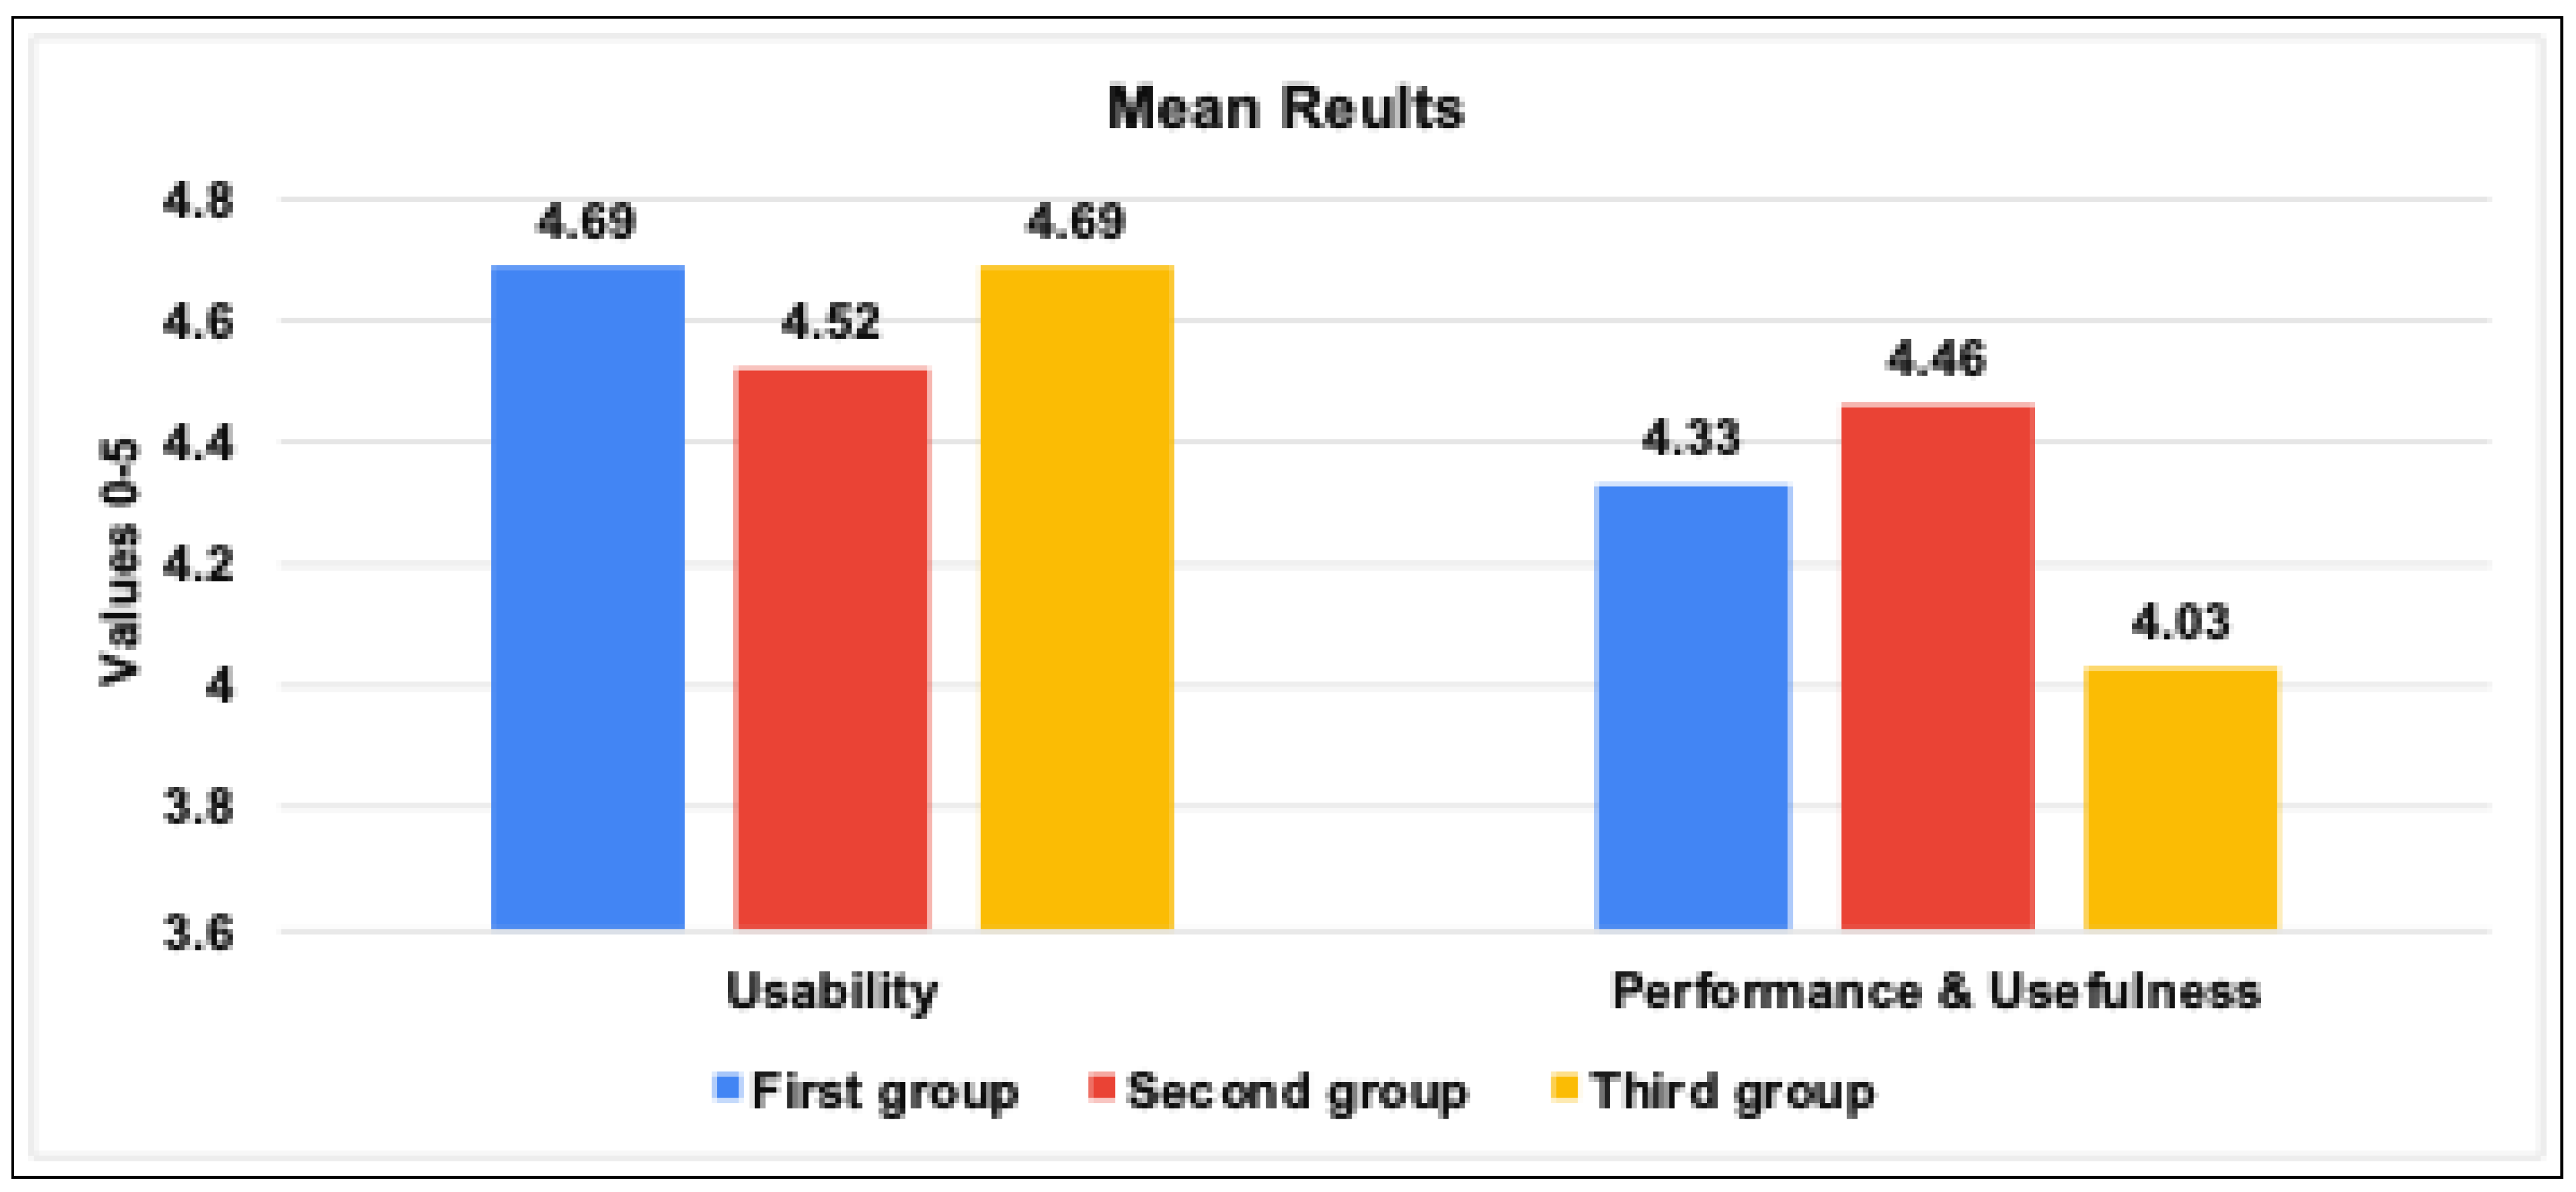
- Figure 9 demonstrates the results of the mean values for the usability, usefulness & performance of the tool among the three IoT research groups. The study found that users generally view the IoT traffic analyzer tool as highly usable, with an average score ranging from 4.52 to 4.69 across three groups of users. The first and third groups rated the tool consistently high in both usability and performance, while the second group gave slightly lower scores but still found the tool useful. Overall, the tool and benchmark framework developed are seen as valuable for measuring IoT network behavior in certain industries.
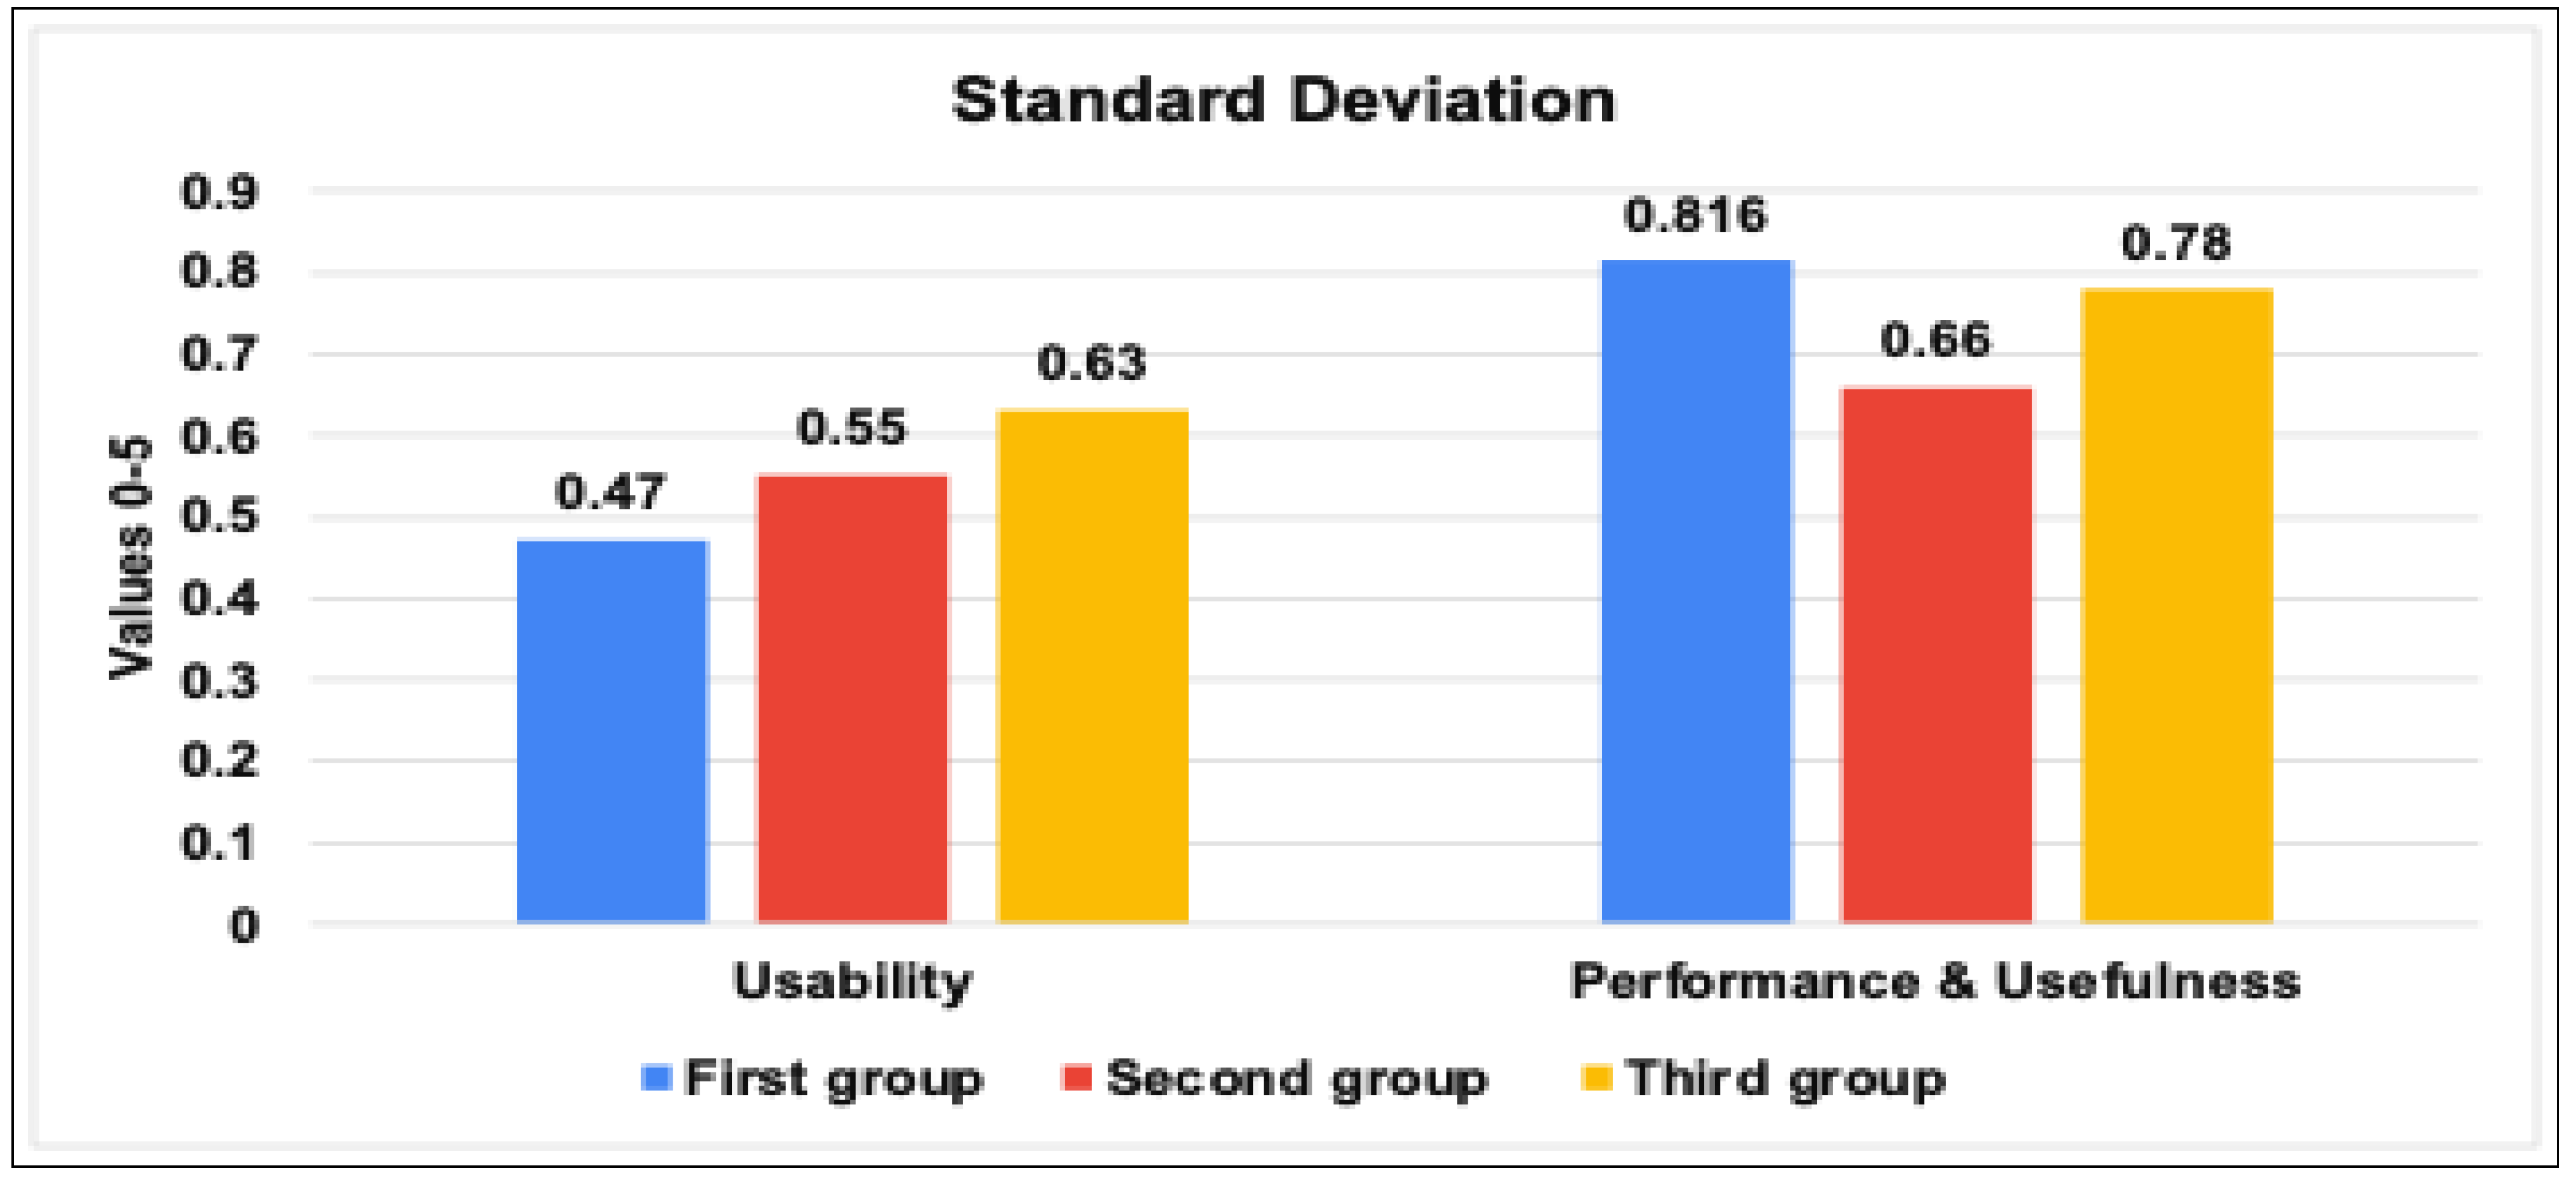
- Figure 10 demonstrates the results of the standard deviation values for the usability and performance of the tool, which provides insights into the variability of scores obtained by three groups of users. Usability has a low standard deviation range, indicating consistency across all three groups of users. Performance shows slightly higher variability, with the second group having the highest standard deviation. However, the standard deviation values suggest that the tool is consistent and provides stable results, particularly in its usability. These results suggest that the IoT traffic analyzer tool and benchmark framework can be useful for IoT researchers in various industries.
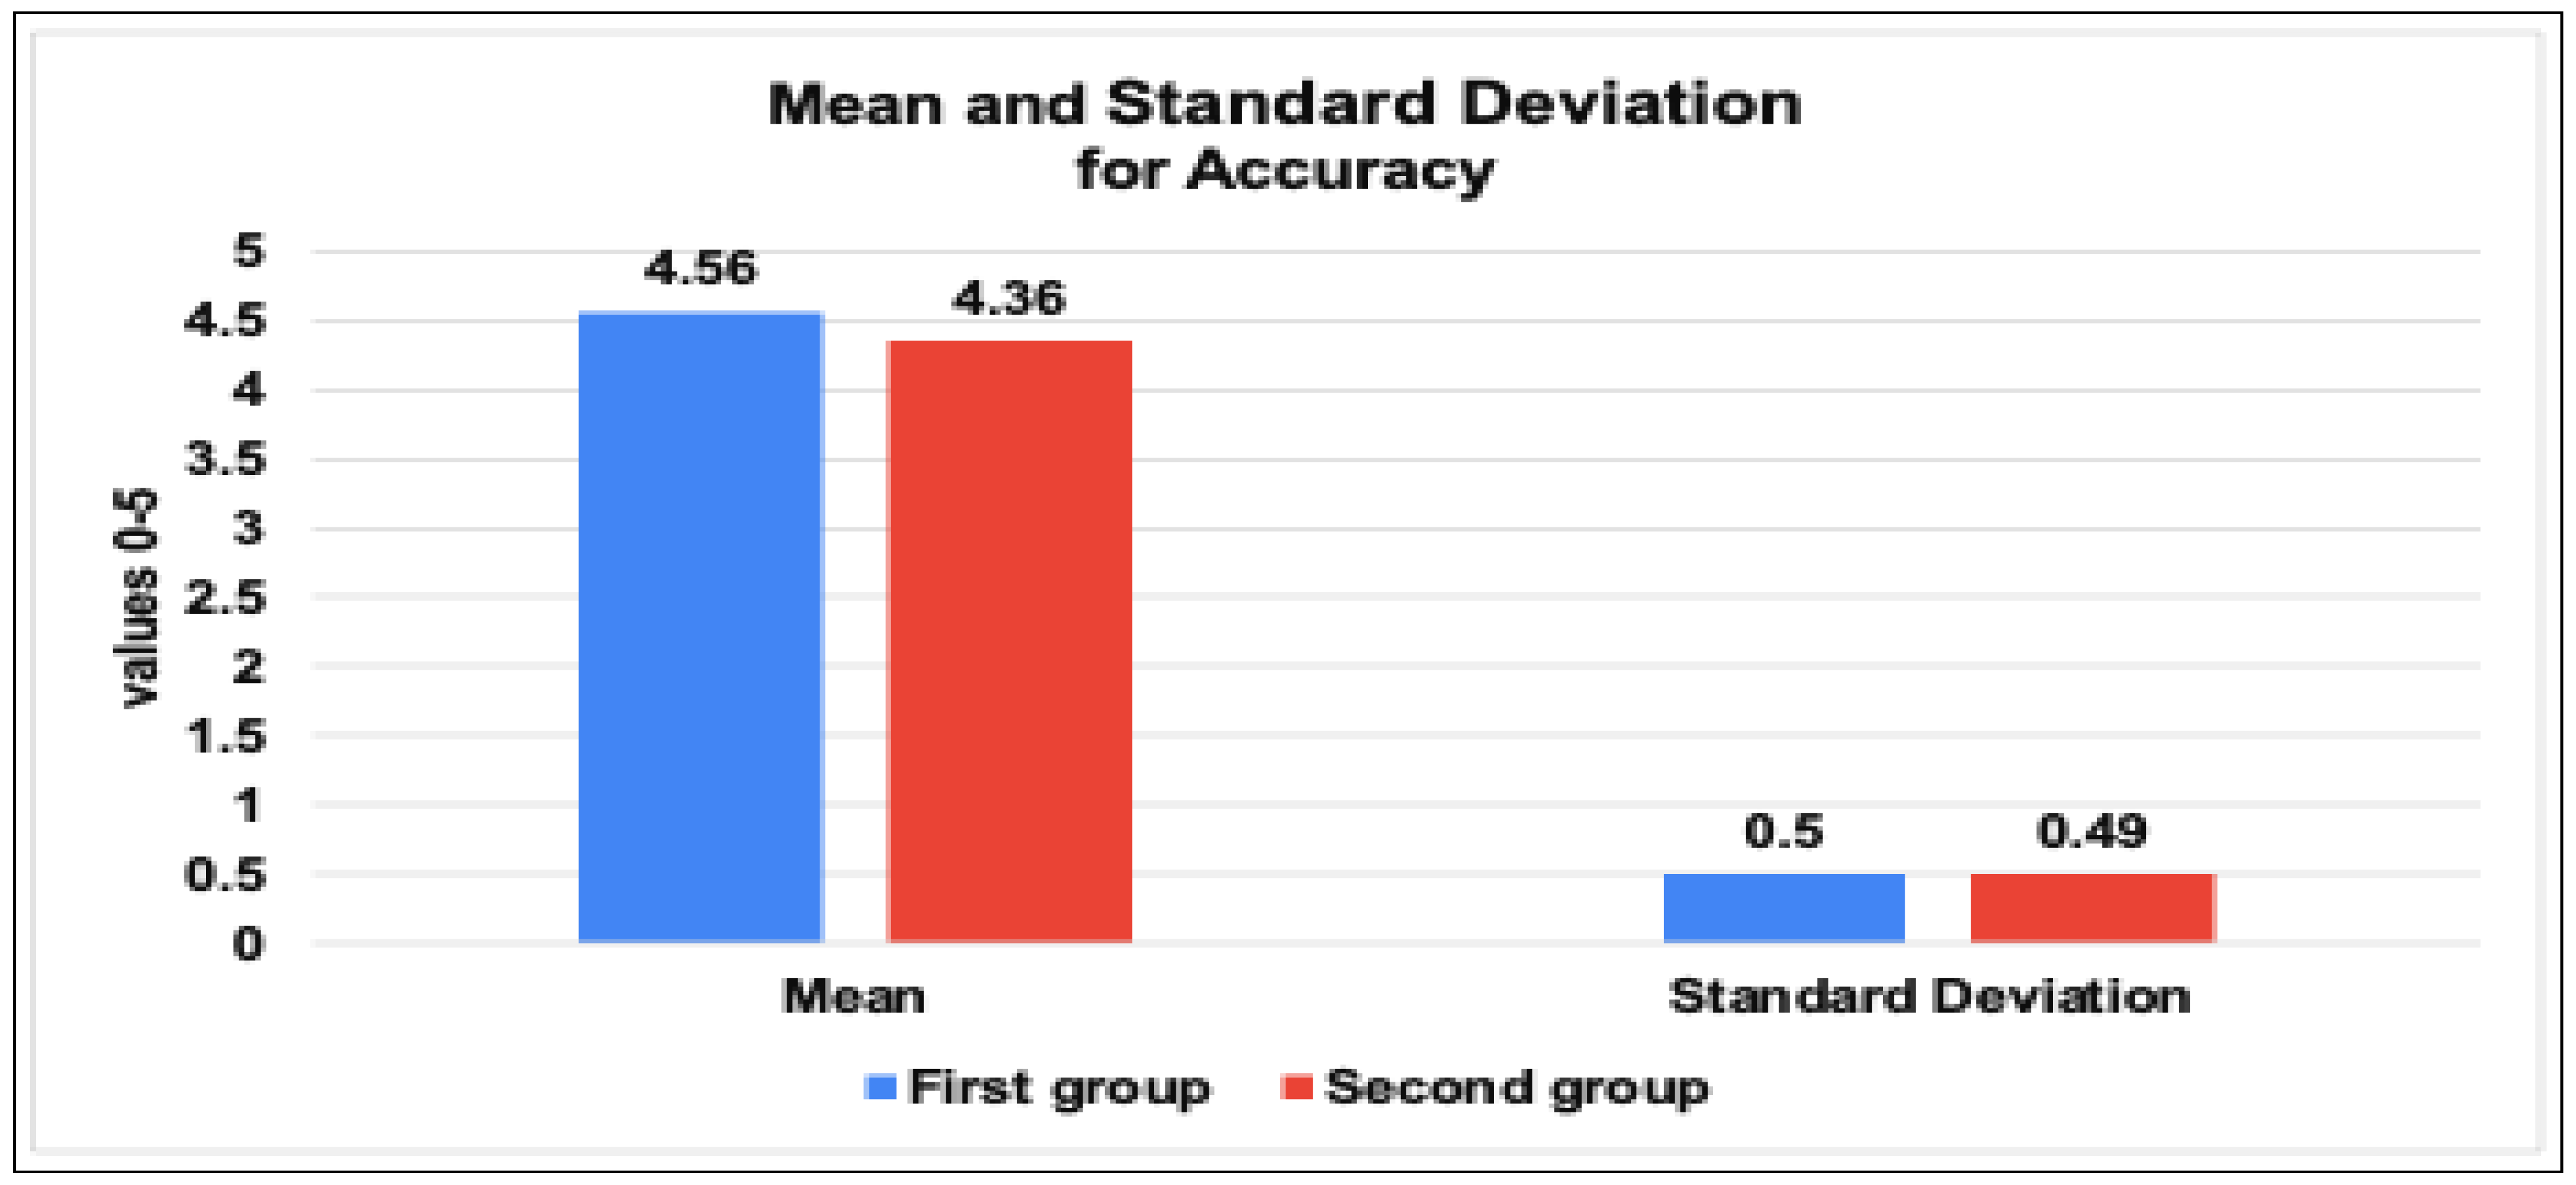
- Figure 11 found that the user’s perception of the accuracy values for the tool is positive across the two groups. The first group gave a higher average score of 4.56 with a standard deviation of 0.5, and the second group gave a slightly lower average score of 4.36 with a slightly lower standard deviation of 0.49.
5. Conclusions and Future Work
- The type of IoT device type, i.e., smart light, smart camera, etc. or
- The function of the IoT device, i.e., whether the device is on, off, or idle, or
- Whether there is any human interaction with the IoT device and what this interaction is, or
- The behavior of the IoT within the network, i.e., if the IoT interacts with other IoT or non-IoT devices that are connected to the same network, or
- Whether the IoT device is under attack and what type of this attack, i.e., MITM attack or IP address spoofing detection and so on.
Author Contributions
Funding
Data Availability Statement
Acknowledgments
Conflicts of Interest
Abbreviations
| IoT | Internet of Things |
| IoT TAHEF | IoT Traffic Analyzer Tool with Automated and Holistic Feature Extraction Capability |
Appendix A. The Manual of IoT ATAFED Tool
- IP address of the IoT device.
- Upload the. pcapng file of the IoT device to analyze.
- Select the IoT device type from the drop-down list.


- It will check whether the IP address is typed correctly; otherwise, an error message appears to inform the user to enter the correct IP format.
- the tool will check whether the uploaded file is in pcap file format or not. Otherwise, it will give an error message to upload the correct file format, as shown in Figure A4.


Appendix B. The Evaluation Survey Form
- IT Researcher
- Ph.D. researcher
- Master researcher
- Bachelor researcher
- Machine Learning with IoT
- IoT traffic analyzing
- Profiling IoT device
- Intrusion detection systems
- Identify the type and model of IoT device
- IoT behavior fingerprint
- Other:
- IoT research is completed
- IoT research is still in the middle
- IoT research is not started yet
| Strongly Agree | Agree | Neutral | Strongly Disagree | Disagree | |
|---|---|---|---|---|---|
| The interface of the tool is user friendly | |||||
| The tool has clear fields for input. | |||||
| The tool provides assistance on invalid input. | |||||
| The tool is fault tolerant. (The tool can handle a wrong input). | |||||
| The tool has clear process/downloads buttons. | |||||
| The tool generates the files in a reasonable time (less than 2 min) | |||||
| The tool automatically displays the results upon finishing the processing. |
| Strongly Agree | Agree | Neutral | Strongly Disagree | Disagree | |
|---|---|---|---|---|---|
| Recognize the IoT device type, i.e., smart light, smart camera | |||||
| Identify the IoT device behavior, i.e., whether the device is on, of, or idle. | |||||
| Determine human interaction type. | |||||
| Identify the behavior of the IoT device within the network. | |||||
| Recognize abnormal behavior, i.e., attacks such as MITM detection or IP address spoofing detection. |
- Strongly agree
- Agree
- I don’t Know
- Disagree
- Strongly disagree
- Strongly agree
- Agree
- I don’t Know
- Disagree
- Strongly disagree
- Strongly agree
- Agree
- I don’t Know
- Disagree
- Strongly disagree
References
- Ramasamy, L.K.; Kadry, S. Industrial Internet of Things. In Blockchain in the Industrial Internet of Things; IOP Publishing: Bristol, UK, 2021. [Google Scholar]
- Tekler, Z.D.; Low, R.; Yuen, C.; Blessing, L. Plug-Mate: An IoT-based occupancy-driven plug load management system in smart buildings. Build. Environ. 2022, 223, 109472. [Google Scholar] [CrossRef]
- Zhuang, D.; Gan, V.J.; Tekler, Z.D.; Chong, A.; Tian, S.; Shi, X. Data-driven predictive control for smart HVAC system in IoT-integrated buildings with time-series forecasting and reinforcement learning. Appl. Energy 2023, 338, 120936. [Google Scholar] [CrossRef]
- Mishra, S.S.; Rasool, A. IoT health care monitoring and tracking: A survey. In Proceedings of the 2019 3rd International Conference on Trends in Electronics and Informatics (ICOEI), Tirunelveli, India, 23–25 April 2019; pp. 1052–1057. [Google Scholar]
- Tekler, Z.D.; Low, R.; Gunay, B.; Andersen, R.K.; Blessing, L. A scalable Bluetooth Low Energy approach to identify occupancy patterns and profiles in office spaces. Build. Environ. 2020, 171, 106681. [Google Scholar] [CrossRef]
- Low, R.; Tekler, Z.D.; Cheah, L. Predicting commercial vehicle parking duration using generative adversarial multiple imputation networks. Transp. Res. Rec. 2020, 2674, 820–831. [Google Scholar] [CrossRef]
- Cat, C. The Internet of Things (IOT)|A Smarter Way of Living—Copycatgroup.com. Available online: https://www.copycatgroup.com/single-post/the-internet-of-things-iot-a-smarter-way-of-living (accessed on 13 January 2023).
- Marikyan, D.; Papagiannidis, S.; Alamanos, E. A systematic review of the smart home literature: A user perspective. Technol. Forecast. Soc. Chang. 2019, 138, 139–154. [Google Scholar] [CrossRef]
- Sivanathan, A. IoT behavioral monitoring via network traffic analysis. arXiv 2020, arXiv:2001.10632. [Google Scholar]
- Subahi, A.; Theodorakopoulos, G. Ensuring compliance of IoT devices with their Privacy Policy Agreement. In Proceedings of the 2018 IEEE 6th International Conference on Future Internet of Things and Cloud (FiCloud), Barcelona, Spain, 6–8 August 2018; pp. 100–107. [Google Scholar]
- Subahi, A.; Theodorakopoulos, G. Detecting IoT user behavior and sensitive information in encrypted IoT-app traffic. Sensors 2019, 19, 4777. [Google Scholar] [CrossRef] [PubMed]
- Sivanathan, A.; Gharakheili, H.H.; Sivaraman, V. Detecting behavioral change of IoT devices using clustering-based network traffic modeling. IEEE Internet Things J. 2020, 7, 7295–7309. [Google Scholar] [CrossRef]
- Gomez, C.; Crowcroft, J.; Scharf, M. Tcp Usage Guidance in the Internet of Things (iot). IETF Internet Draft. 2018. Available online: https://tools.ietf.org/id/draft-ietf-lwig-tcp-constrained-node-networks-05.html#rfc.section.8.3 (accessed on 10 December 2022).
- Meidan, Y.; Bohadana, M.; Shabtai, A.; Guarnizo, J.D.; Ochoa, M.; Tippenhauer, N.O.; Elovici, Y. ProfilIoT: A machine learning approach for IoT device identification based on network traffic analysis. In Proceedings of the Symposium on Applied Computing, Marrakech, Morocco, 4–6 April 2017; pp. 506–509. [Google Scholar]
- Noguchi, H.; Kataoka, M.; Yamato, Y. Device identification based on communication analysis for the Internet of Things. IEEE Access 2019, 7, 52903–52912. [Google Scholar] [CrossRef]
- Bezawada, B.; Ray, I.; Ray, I. Behavioral fingerprinting of Internet-of-Things devices. Wiley Interdiscip. Rev. Data Min. Knowl. Discov. 2021, 11, e1337. [Google Scholar] [CrossRef]
- Aksoy, A.; Gunes, M.H. Automated iot device identification using network traffic. In Proceedings of the ICC 2019-2019 IEEE International Conference on Communications (ICC), Shanghai, China, 20–24 May 2019; pp. 1–7. [Google Scholar]
- Meidan, Y.; Bohadana, M.; Shabtai, A.; Ochoa, M.; Tippenhauer, N.O.; Guarnizo, J.D.; Elovici, Y. Detection of unauthorized IoT devices using machine learning techniques. arXiv 2017, arXiv:1709.04647. [Google Scholar]
- Yousefnezhad, N.; Malhi, A.; Främling, K. Automated iot device identification based on full packet information using real-time network traffic. Sensors 2021, 21, 2660. [Google Scholar] [CrossRef] [PubMed]
- Sivanathan, A.; Gharakheili, H.H.; Loi, F.; Radford, A.; Wijenayake, C.; Vishwanath, A.; Sivaraman, V. Classifying IoT devices in smart environments using network traffic characteristics. IEEE Trans. Mob. Comput. 2018, 18, 1745–1759. [Google Scholar] [CrossRef]
- Dadkhah, S.; Mahdikhani, H.; Danso, P.K.; Zohourian, A.; Truong, K.A.; Ghorbani, A.A. Towards the development of a realistic multidimensional IoT profiling dataset. In Proceedings of the 2022 19th Annual International Conference on Privacy, Security & Trust (PST), Fredericton, NB, Canada, 22–24 August 2022; pp. 1–11. [Google Scholar]
- Kang, H.; Ahn, D.H.; Lee, G.M.; Yoo, J.; Park, K.H.; Kim, H.K. IoT network intrusion dataset. IEEE Dataport 2019, 10, q70p–q449. [Google Scholar]
- Koroniotis, N.; Moustafa, N.; Sitnikova, E.; Turnbull, B. Towards the development of realistic botnet dataset in the internet of things for network forensic analytics: Bot-iot dataset. Future Gener. Comput. Syst. 2019, 100, 779–796. [Google Scholar] [CrossRef]
- Parmisano, A.; Garcia, S.; Erquiaga, M. A Labeled Dataset with Malicious and Benign Iot Network Traffic; Stratosphere Laboratory: Praha, Czech Republic, 2020. [Google Scholar]
- Bui, H.K.; Lin, Y.D.; Hwang, R.H.; Lin, P.C.; Nguyen, V.L.; Lai, Y.C. CREME: A toolchain of automatic dataset collection for machine learning in intrusion detection. J. Netw. Comput. Appl. 2021, 193, 103212. [Google Scholar] [CrossRef]
- Al-Hadhrami, Y.; Hussain, F.K. Real time dataset generation framework for intrusion detection systems in IoT. Future Gener. Comput. Syst. 2020, 108, 414–423. [Google Scholar] [CrossRef]
- Tekeoglu, A.; Tosun, A.Ş. A testbed for security and privacy analysis of IoT devices. In Proceedings of the 2016 IEEE 13th International Conference on Mobile Ad Hoc and Sensor Systems (MASS), Brasilia, Brazil, 10–13 October 2016; pp. 343–348. [Google Scholar]
- Prajapat, G. How to create WI-FI Hotspot in Linux (kali Linux)-Tech Sarjan—techsarjan.com. Available online: http://techsarjan.com/2014/10/how-to-create-wi-fi-hotspot-in-linux.html (accessed on 15 January 2023).
- Soltani, R.; Goeckel, D.; Towsley, D.; Houmansadr, A. Towards provably invisible network flow fingerprints. In Proceedings of the 2017 51st Asilomar Conference on Signals, Systems, and Computers, Pacific Grove, CA, USA, 29 October–1 November 2017; pp. 258–262. [Google Scholar]
- Brickhouse, D. Packet vs. Flow: A Look at Network Traffic Analysis Techniques—liveaction.com. Available online: https://www.liveaction.com/resources/white-papers-solution-briefs/packet-vs-flow-a-look-at-network-traffic-analysis-techniques/ (accessed on 13 January 2023).


| No. | IoT Device | Brand | Description |
|---|---|---|---|
| 1 | Echo Dot (4th generation). Smart speaker with Alexa (Arabic or English) | Amazon | It can play songs and connect to external speakers or headphones. It is capable of making calls and messaging with voice commands. It is capable of hearing your voice from all directions, even when songs are played. Controls compatible with smart home devices, including lights, plugs, and more. |
| 2 | Tapo C200 Pan/Tilt 1080p Full HD Home Security Wi-Fi Camera | TP-link | Wireless Indoor Security 360° 2Mp 1080P (Full Hd). Works with Alexa and Google (Tapo C200) |
| 3 | TP-LINK Tapo Smart Plug Wi-Fi Outlet, | TP-link | Instantly turn connected devices on/off wherever you are through the Tapo app and reset a schedule to manage devices automatically. Create countdown timer lists for connected electronics. Manage your smart plug with voice commands via Amazon Alexa or Google Assistant. Automatically turns devices on and off at different times to give the appearance that someone is home |
| 4 | TP-Link Kasa Smart LED Lamp Multi-Color | TP-link | Multicolor with a wide range of colors and dimming capabilities, Kasa smart’s multicolor light bulb offers endless lighting possibilities. No hub required; connects to your home’s secure Wi-Fi network |
| IoT Device | Scenarios/ Experiments | Power is on (True/False) | App is on (True/False) | Device Idle (True/False) | App Idle (True/False) | User Interaction with IoT App (True/False) |
|---|---|---|---|---|---|---|
| Smart Plug | Scenario 1 | True | True | True | True | False |
| Scenario 2 | Alternating | True | False | False | True | |
| Scenario 3 | True | False | True | Na | Na | |
| Scenario 4 | False | True | True | True | False | |
| Scenario 5 | False | False | True | Na | Na | |
| Smart lamb | Scenario 1 | True | True | True | True | False |
| Scenario 2 | Alternating | True | False | False | True | |
| Scenario 3 | True | False | True | Na | False | |
| Scenario 4 | False | True | True | True | False | |
| Scenario 5 | False | False | True | Na | Na | |
| Smart Cam | Scenario 1 | True | True | Na | Na | Na |
| Scenario 2 | False | False | Na | Na | Na |
| IoT Device | Scenarios/ Experiments | App Idle (True/False) | Play an Audio (True/False) | Connect to a Website (True/False) | Connect to Other IoT Devices (True/False) |
|---|---|---|---|---|---|
| Alexa | Scenario 1 | True | False | False | False |
| Scenario 2 | True | False | True | False | |
| Scenario 3 | False | True | False | False | |
| Scenario 4 | True | True | False | False | |
| Scenario 5 | False | False | False | True |
Disclaimer/Publisher’s Note: The statements, opinions and data contained in all publications are solely those of the individual author(s) and contributor(s) and not of MDPI and/or the editor(s). MDPI and/or the editor(s) disclaim responsibility for any injury to people or property resulting from any ideas, methods, instructions or products referred to in the content. |
© 2023 by the authors. Licensee MDPI, Basel, Switzerland. This article is an open access article distributed under the terms and conditions of the Creative Commons Attribution (CC BY) license (https://creativecommons.org/licenses/by/4.0/).
Share and Cite
Subahi, A.; Almasre, M. IoT Traffic Analyzer Tool with Automated and Holistic Feature Extraction Capability. Sensors 2023, 23, 5011. https://doi.org/10.3390/s23115011
Subahi A, Almasre M. IoT Traffic Analyzer Tool with Automated and Holistic Feature Extraction Capability. Sensors. 2023; 23(11):5011. https://doi.org/10.3390/s23115011
Chicago/Turabian StyleSubahi, Alanoud, and Miada Almasre. 2023. "IoT Traffic Analyzer Tool with Automated and Holistic Feature Extraction Capability" Sensors 23, no. 11: 5011. https://doi.org/10.3390/s23115011