
Effects of Measurement Temperature on Radioluminescence Processes in Cerium-Activated Silica Glasses for Dosimetry Applications
 ,
,  ,
,  , , and
Abstract
:1. Introduction
2. Materials and Methods
2.1. Studied Sample
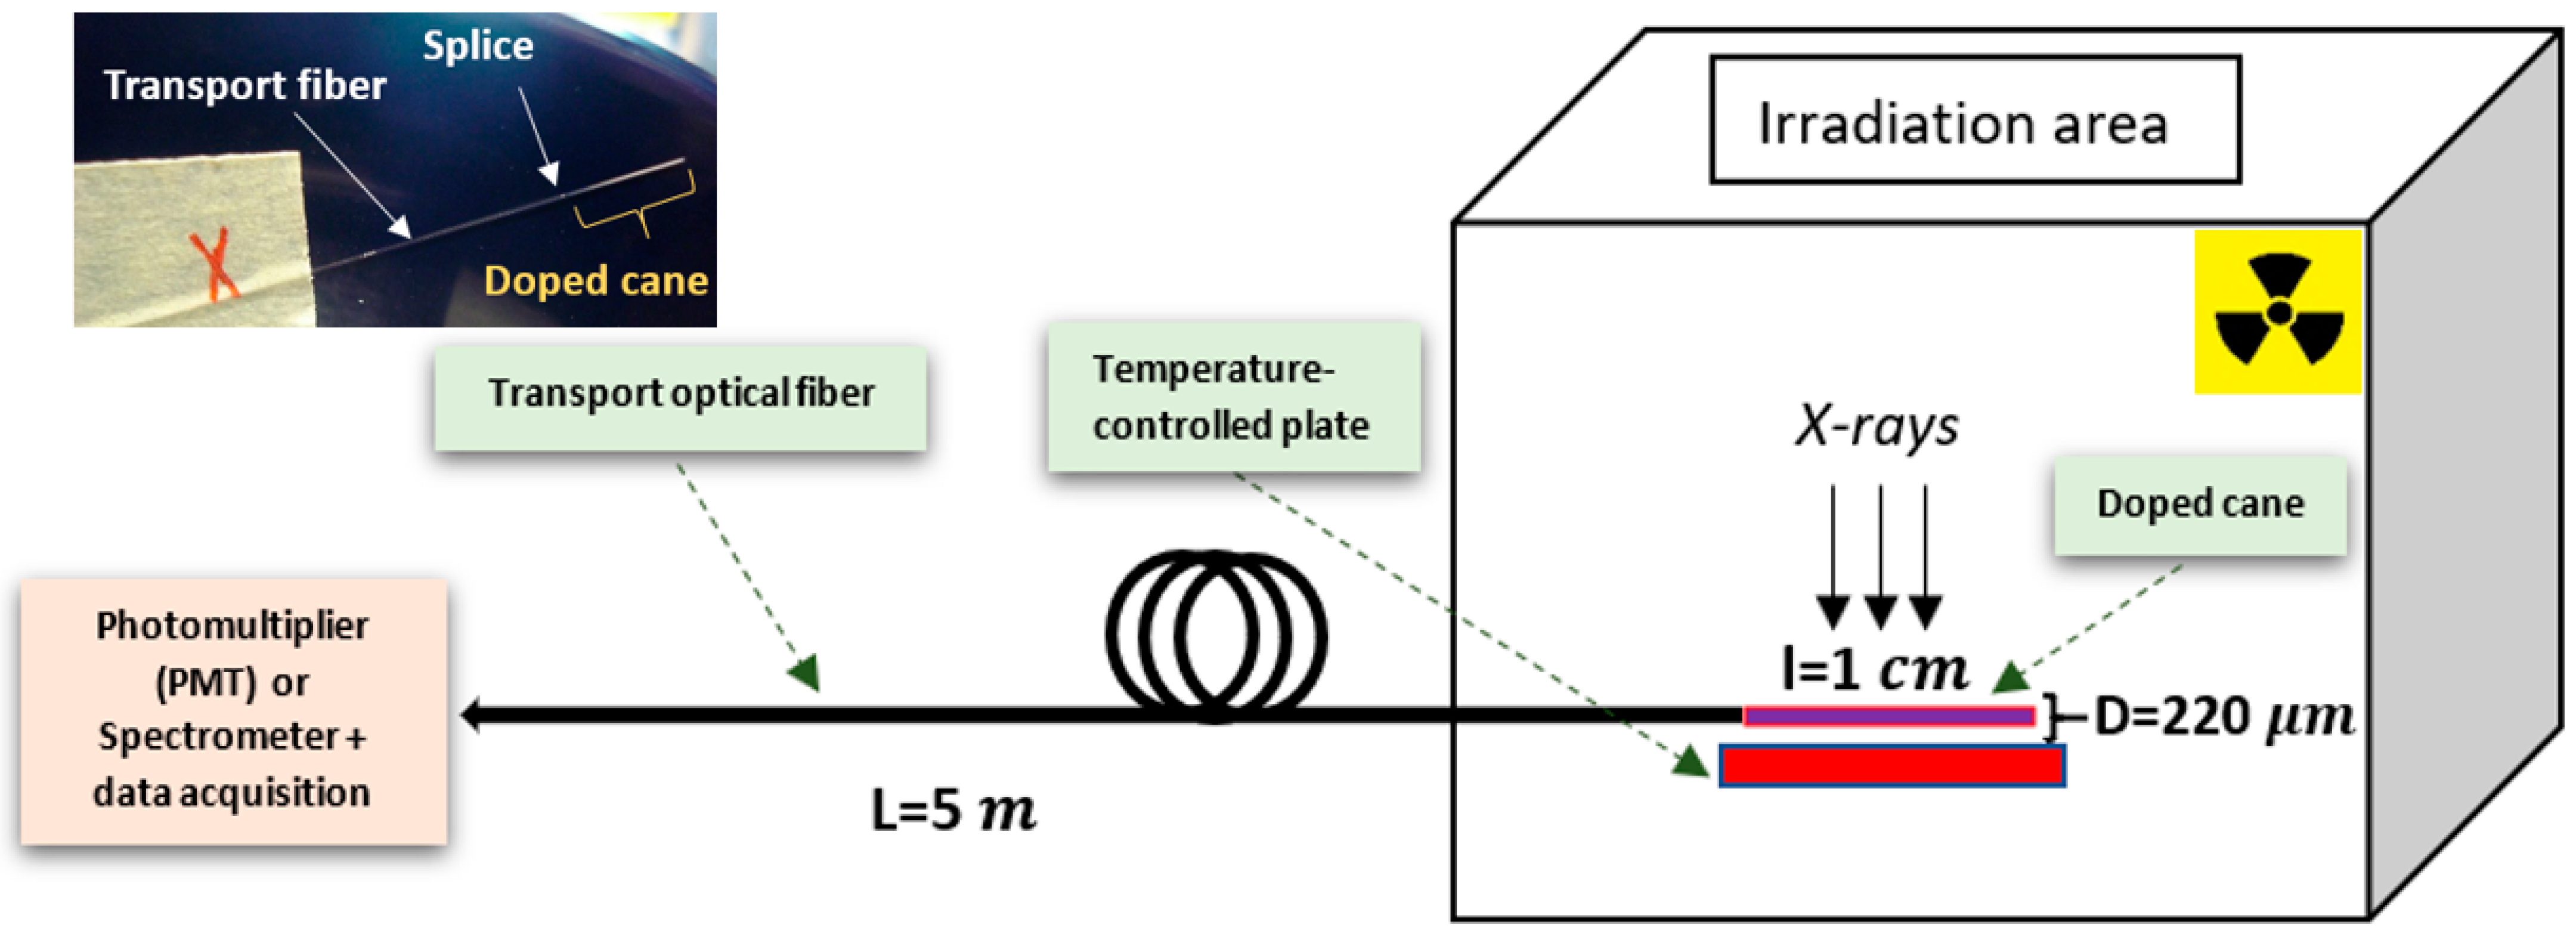
2.2. RL Measurements
3. Results and Discussion
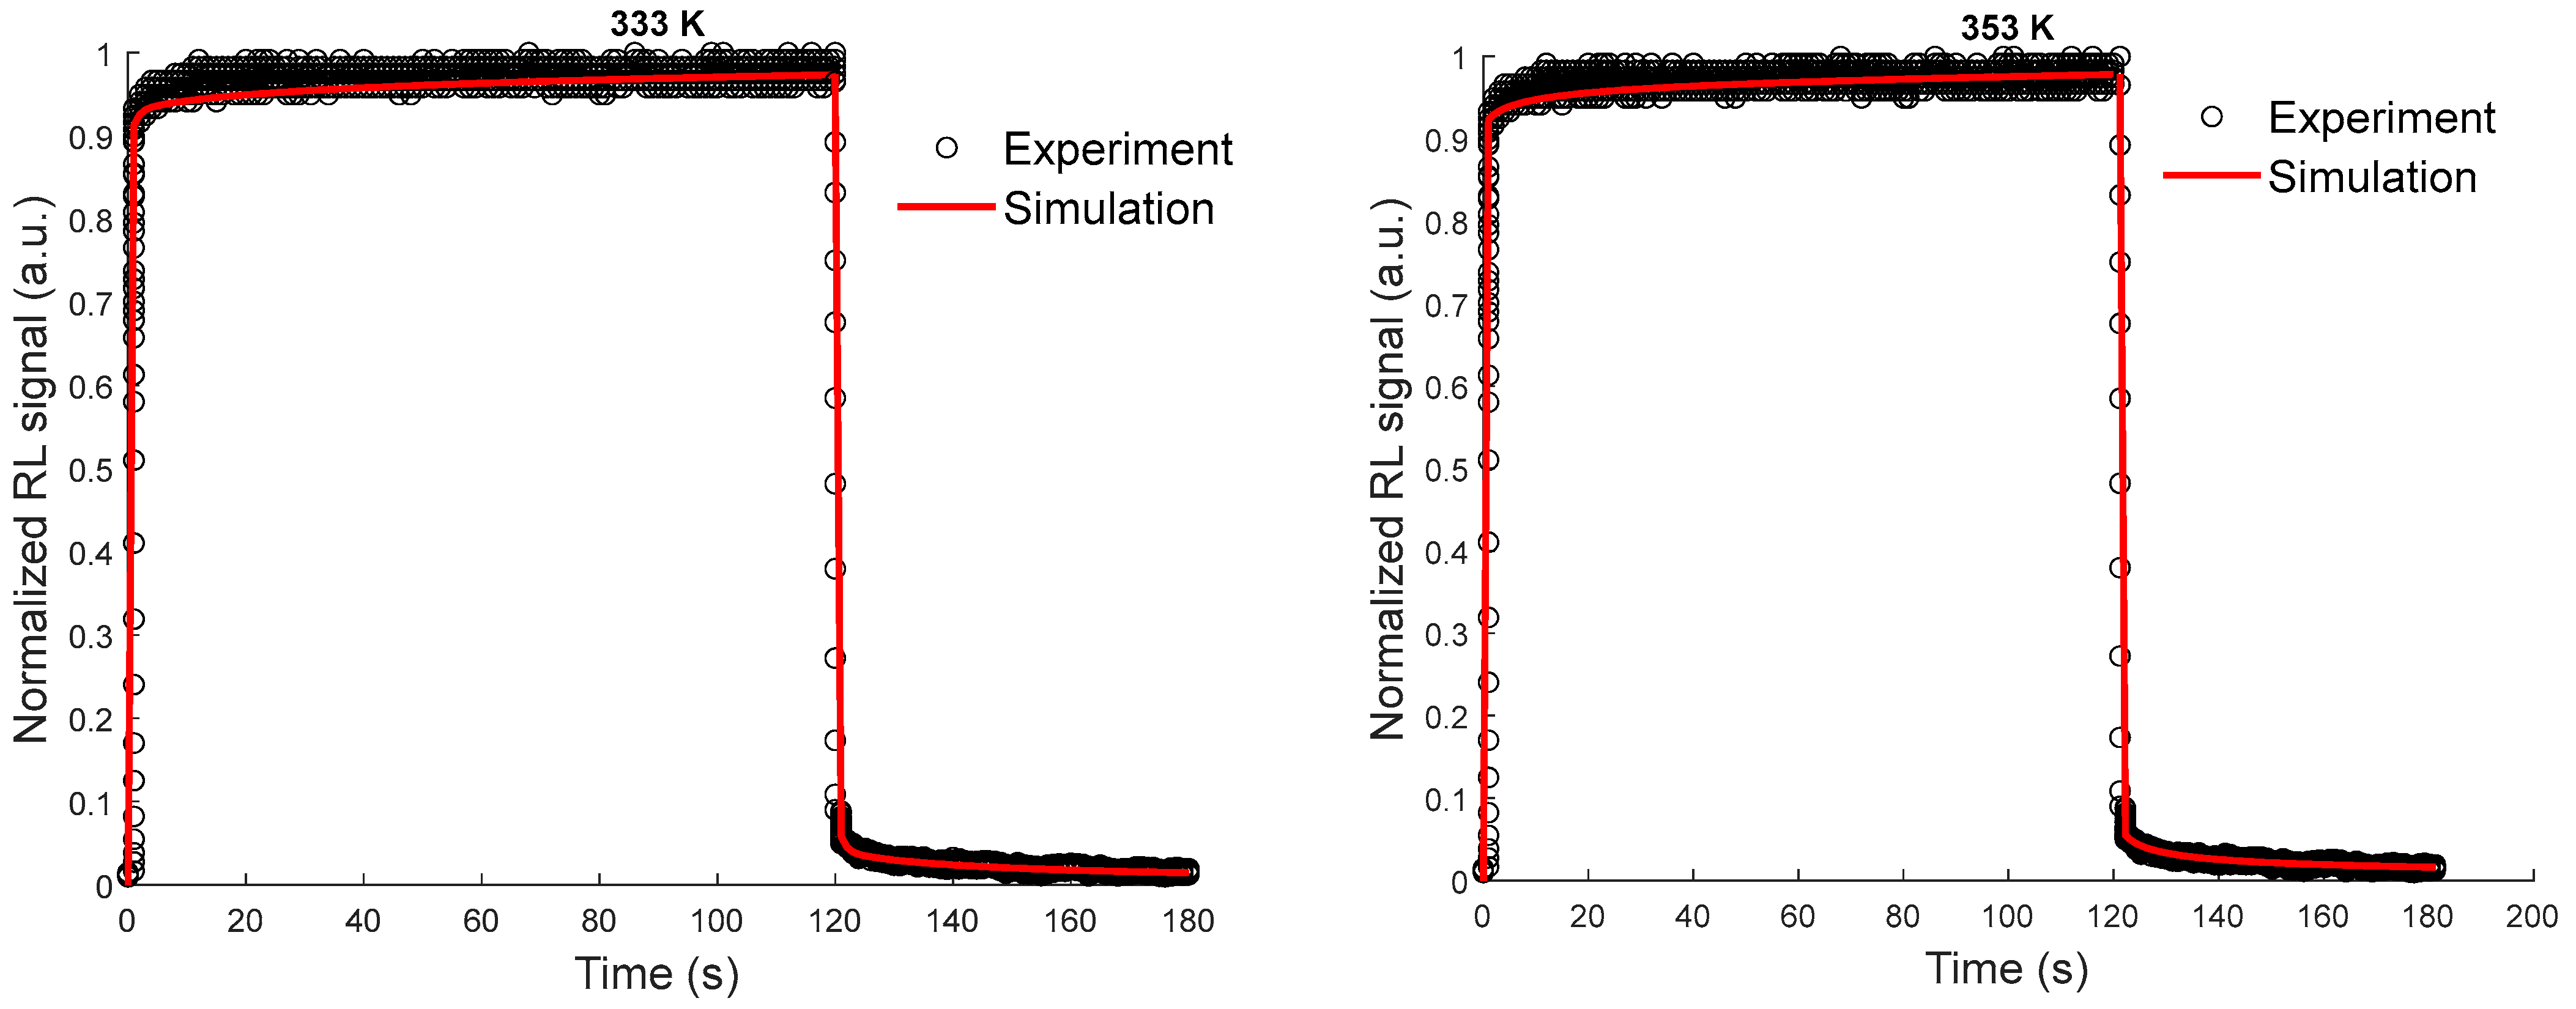
3.1. Experiment
RL Measurement
- A.
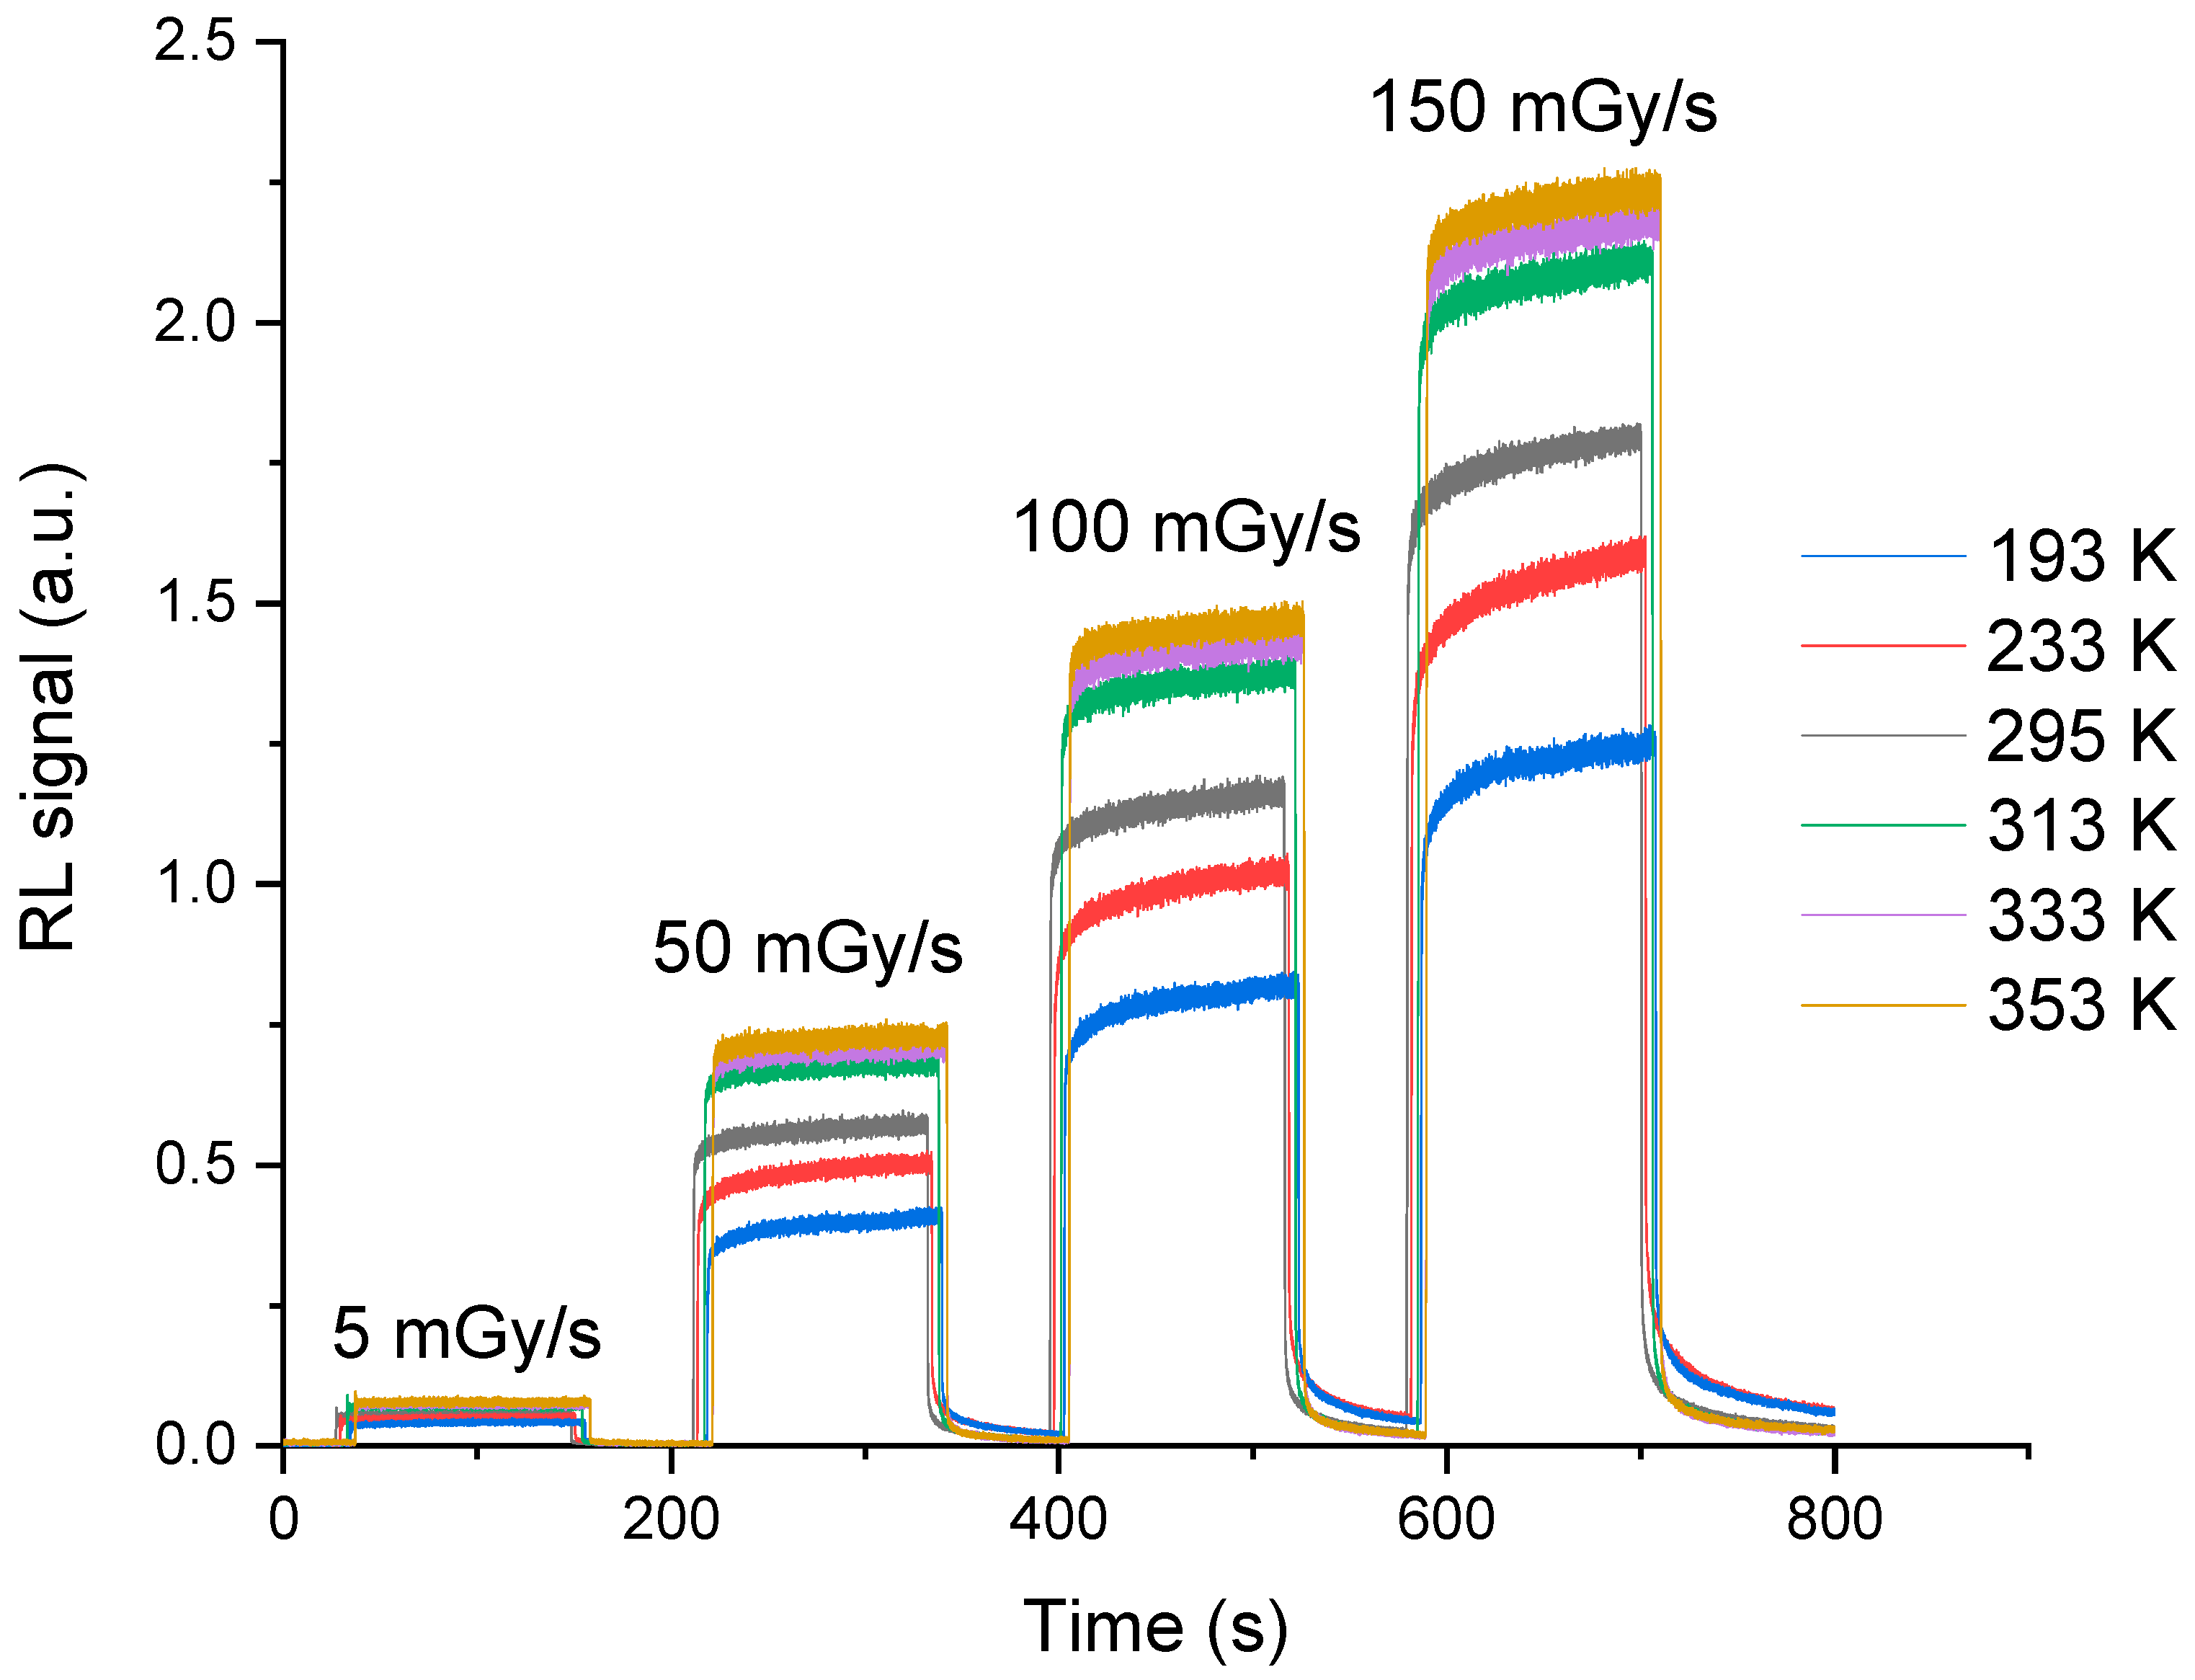
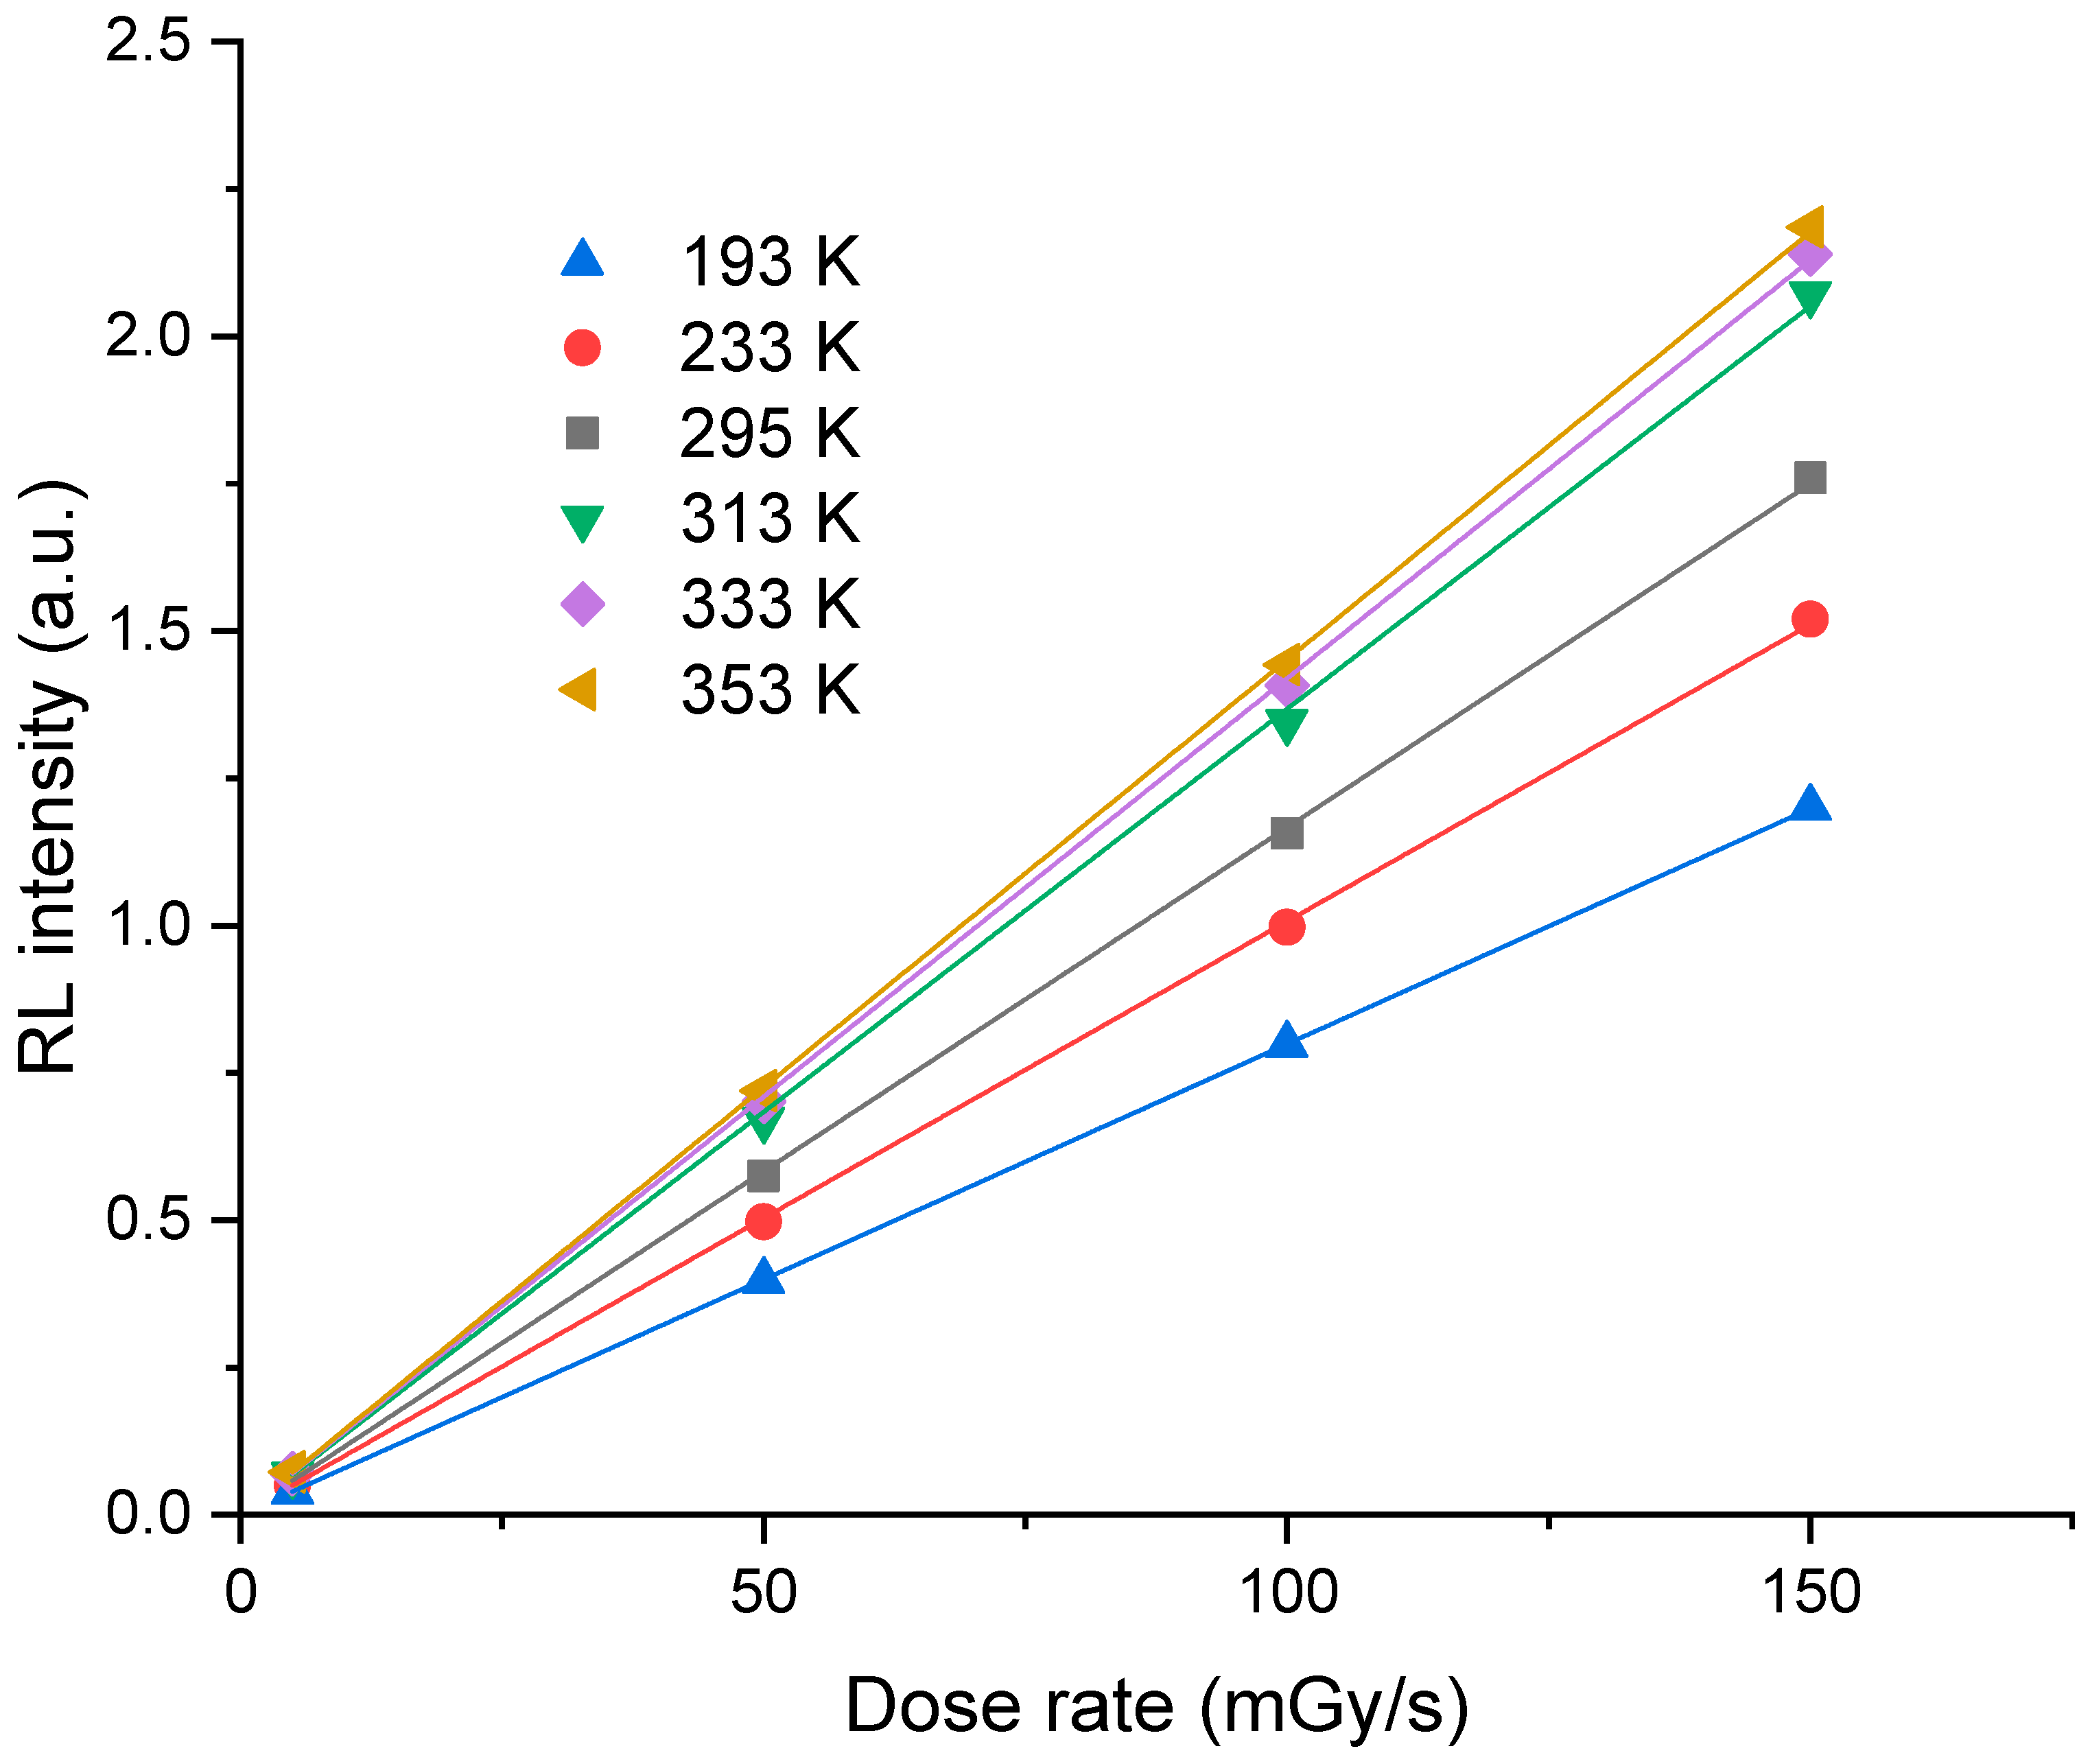
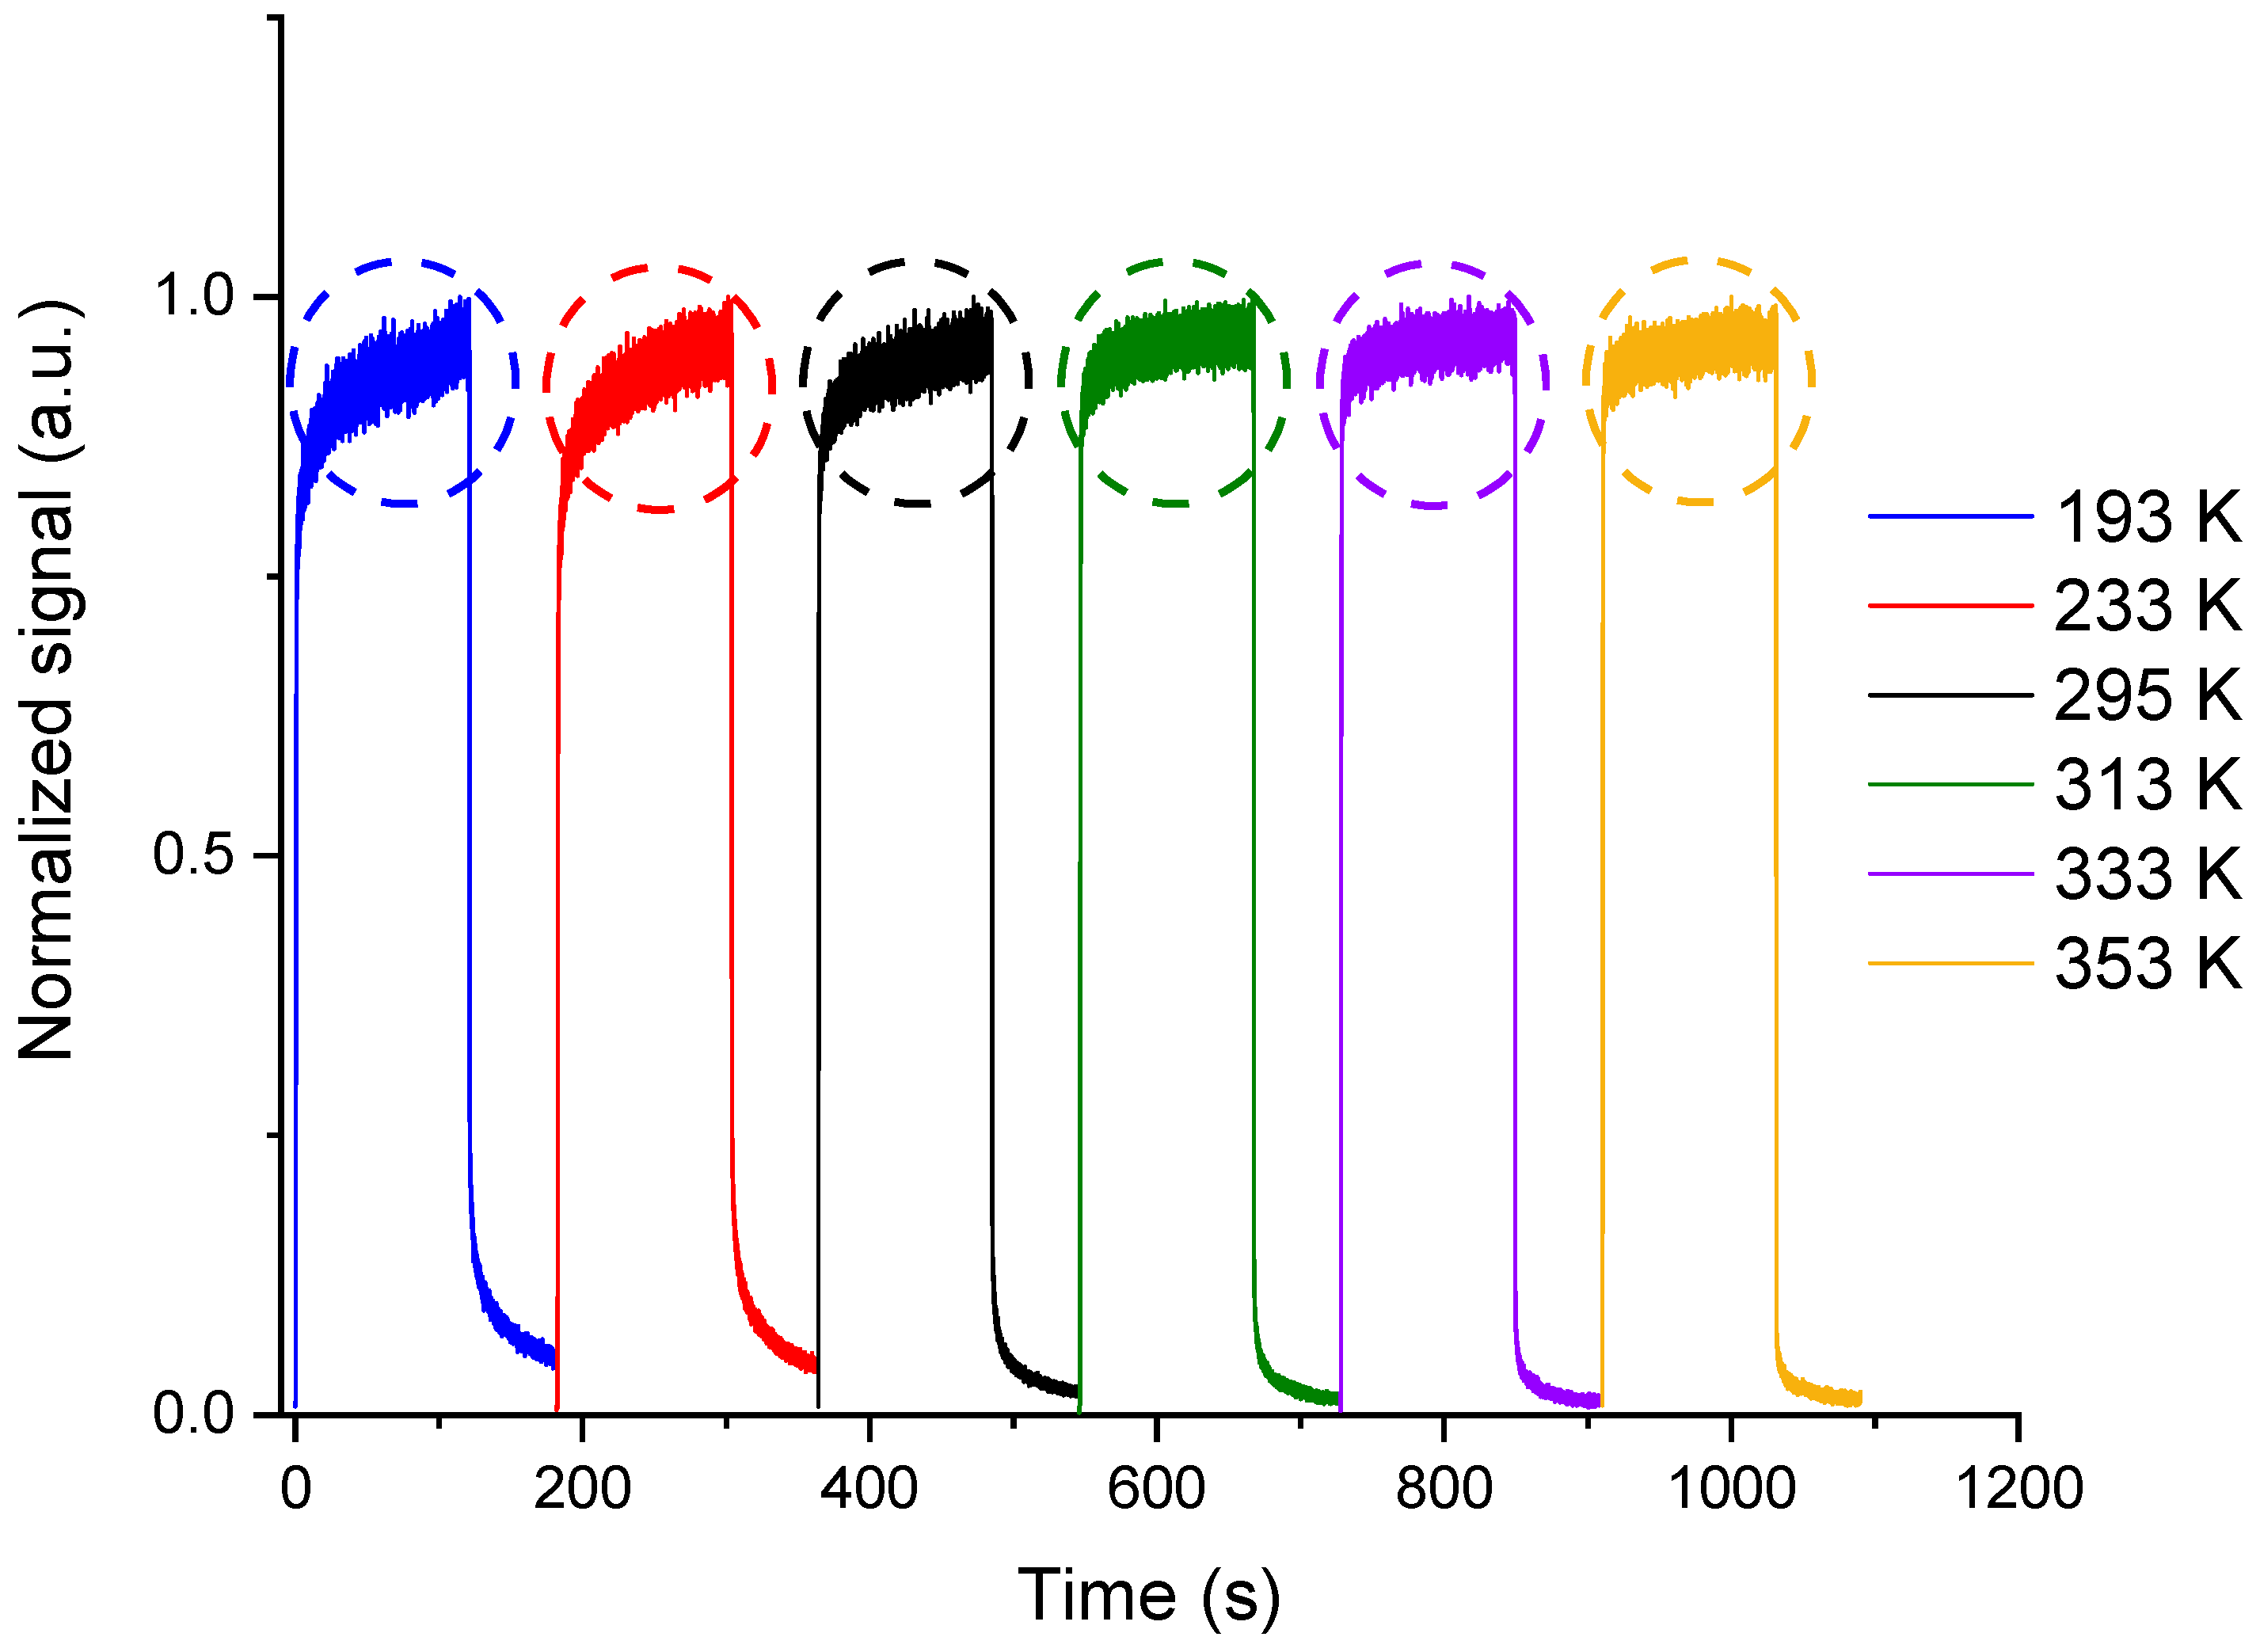
- RL signal
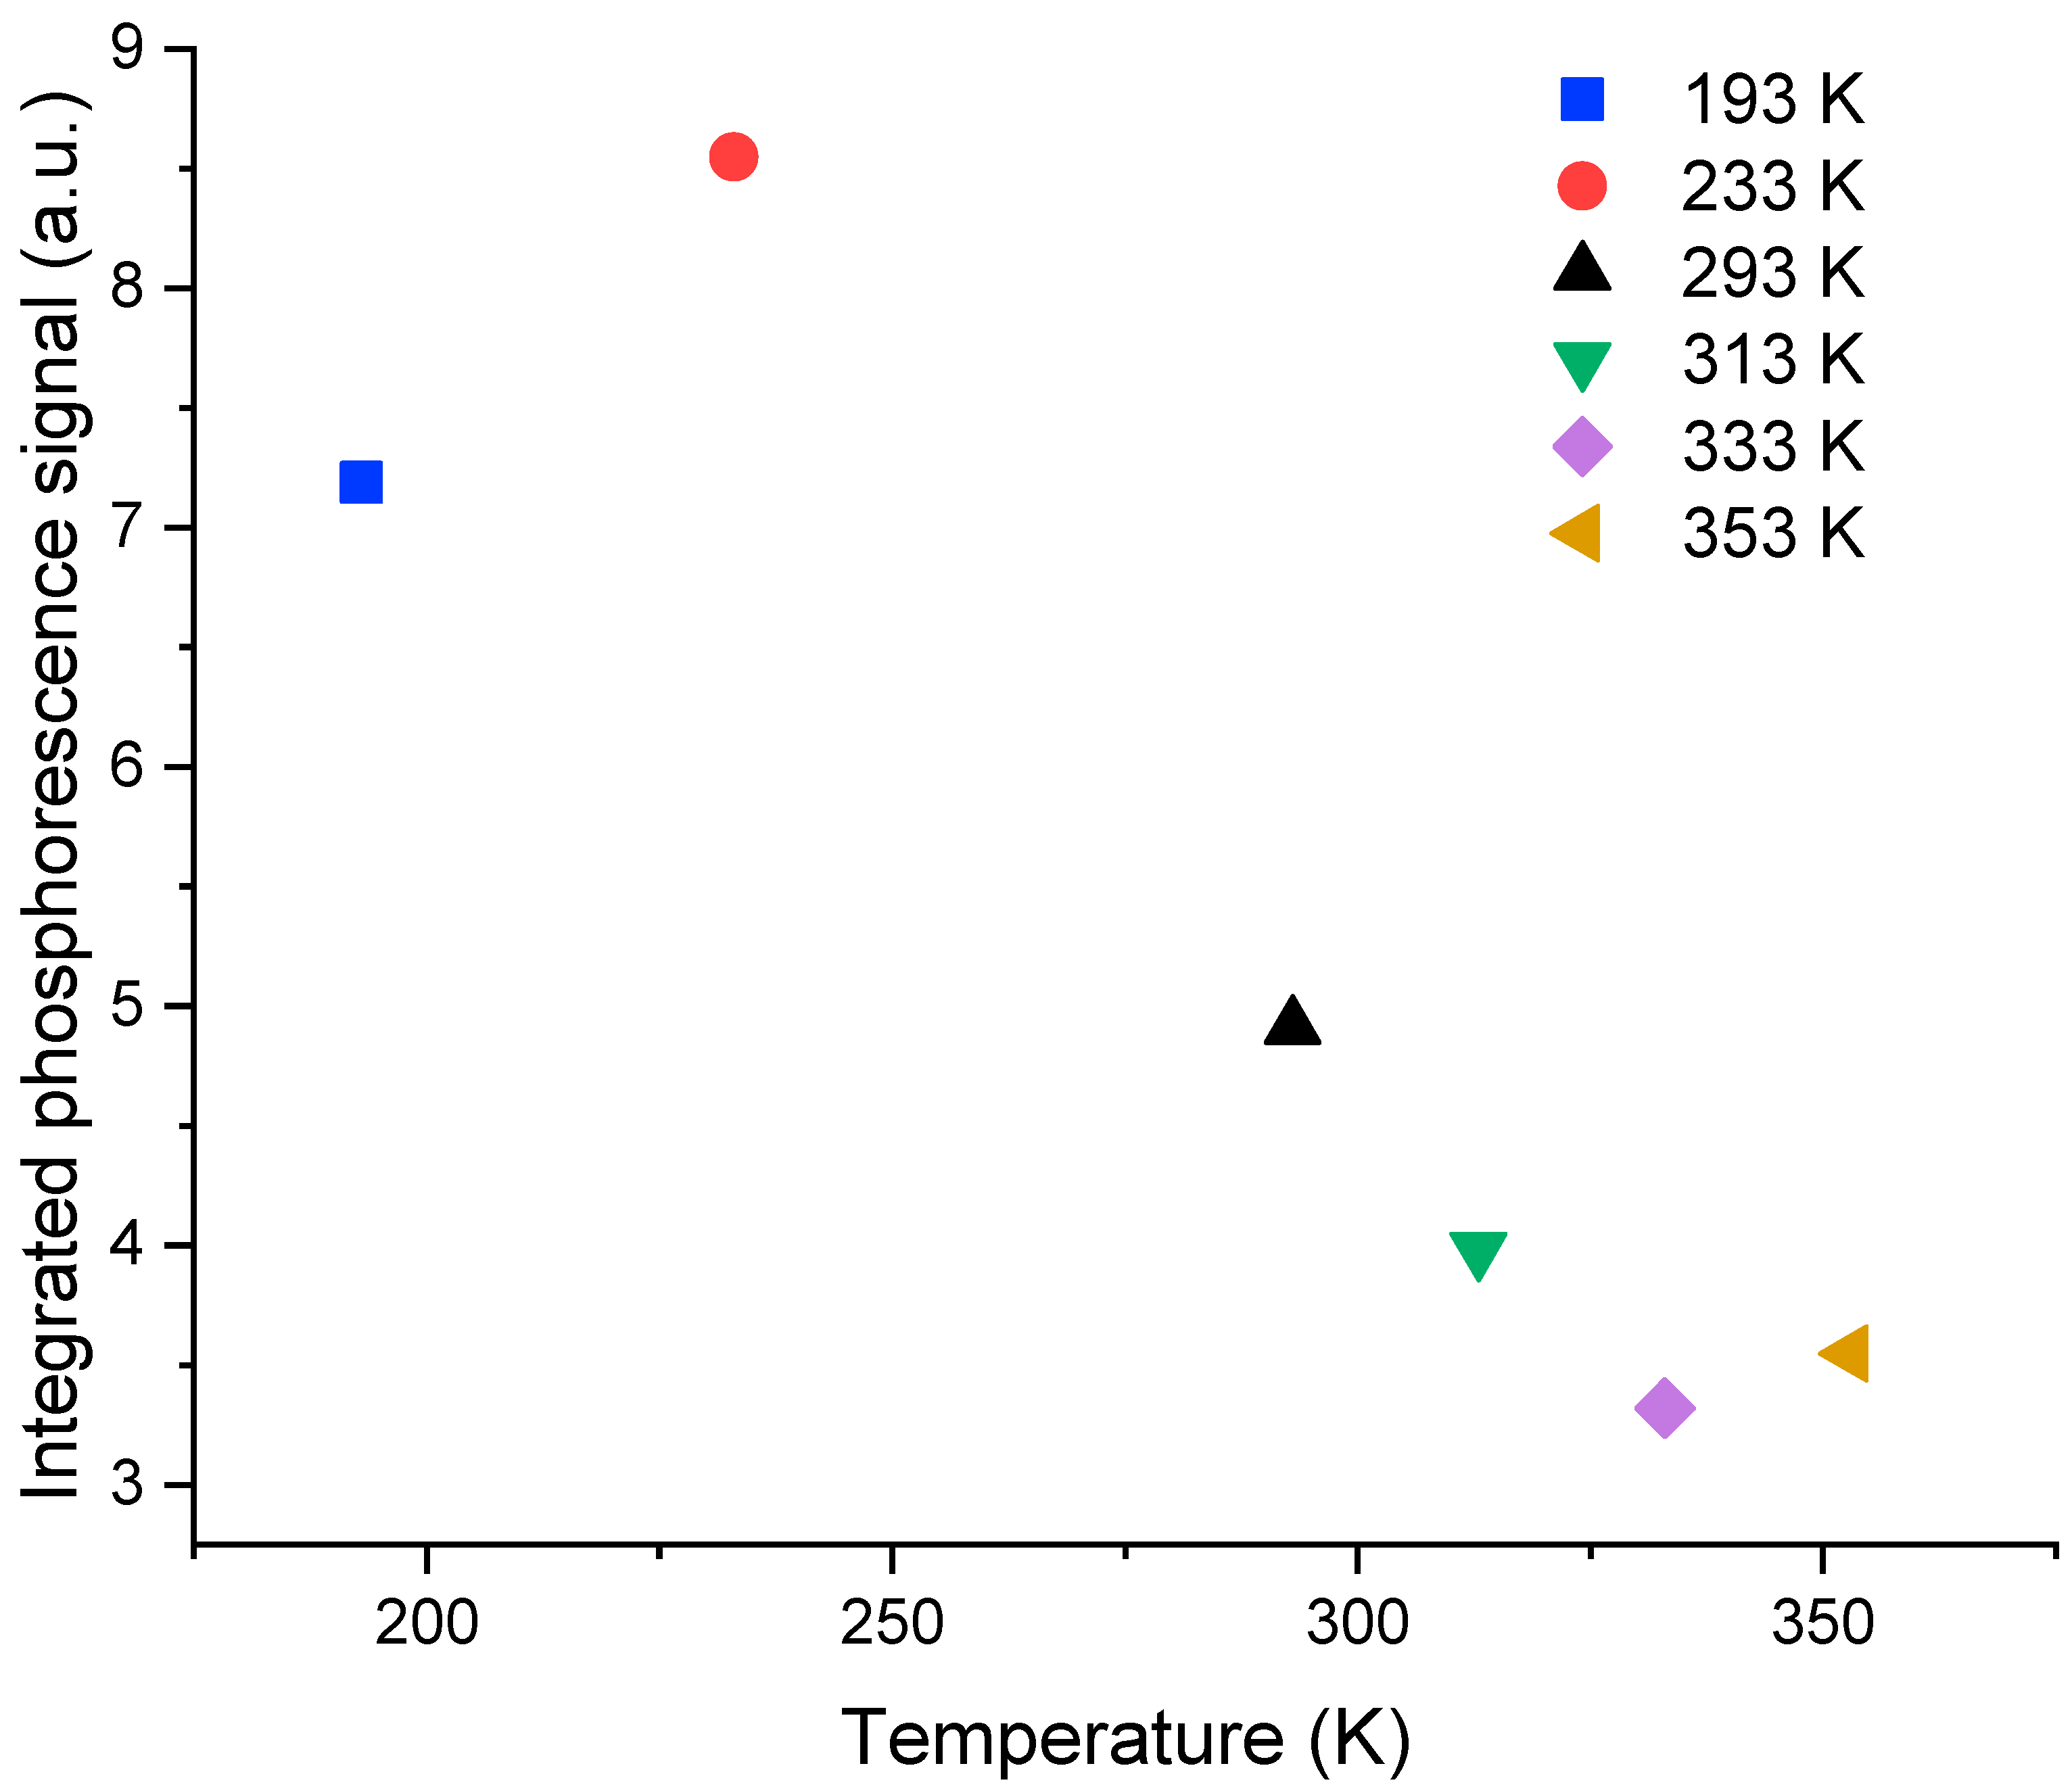
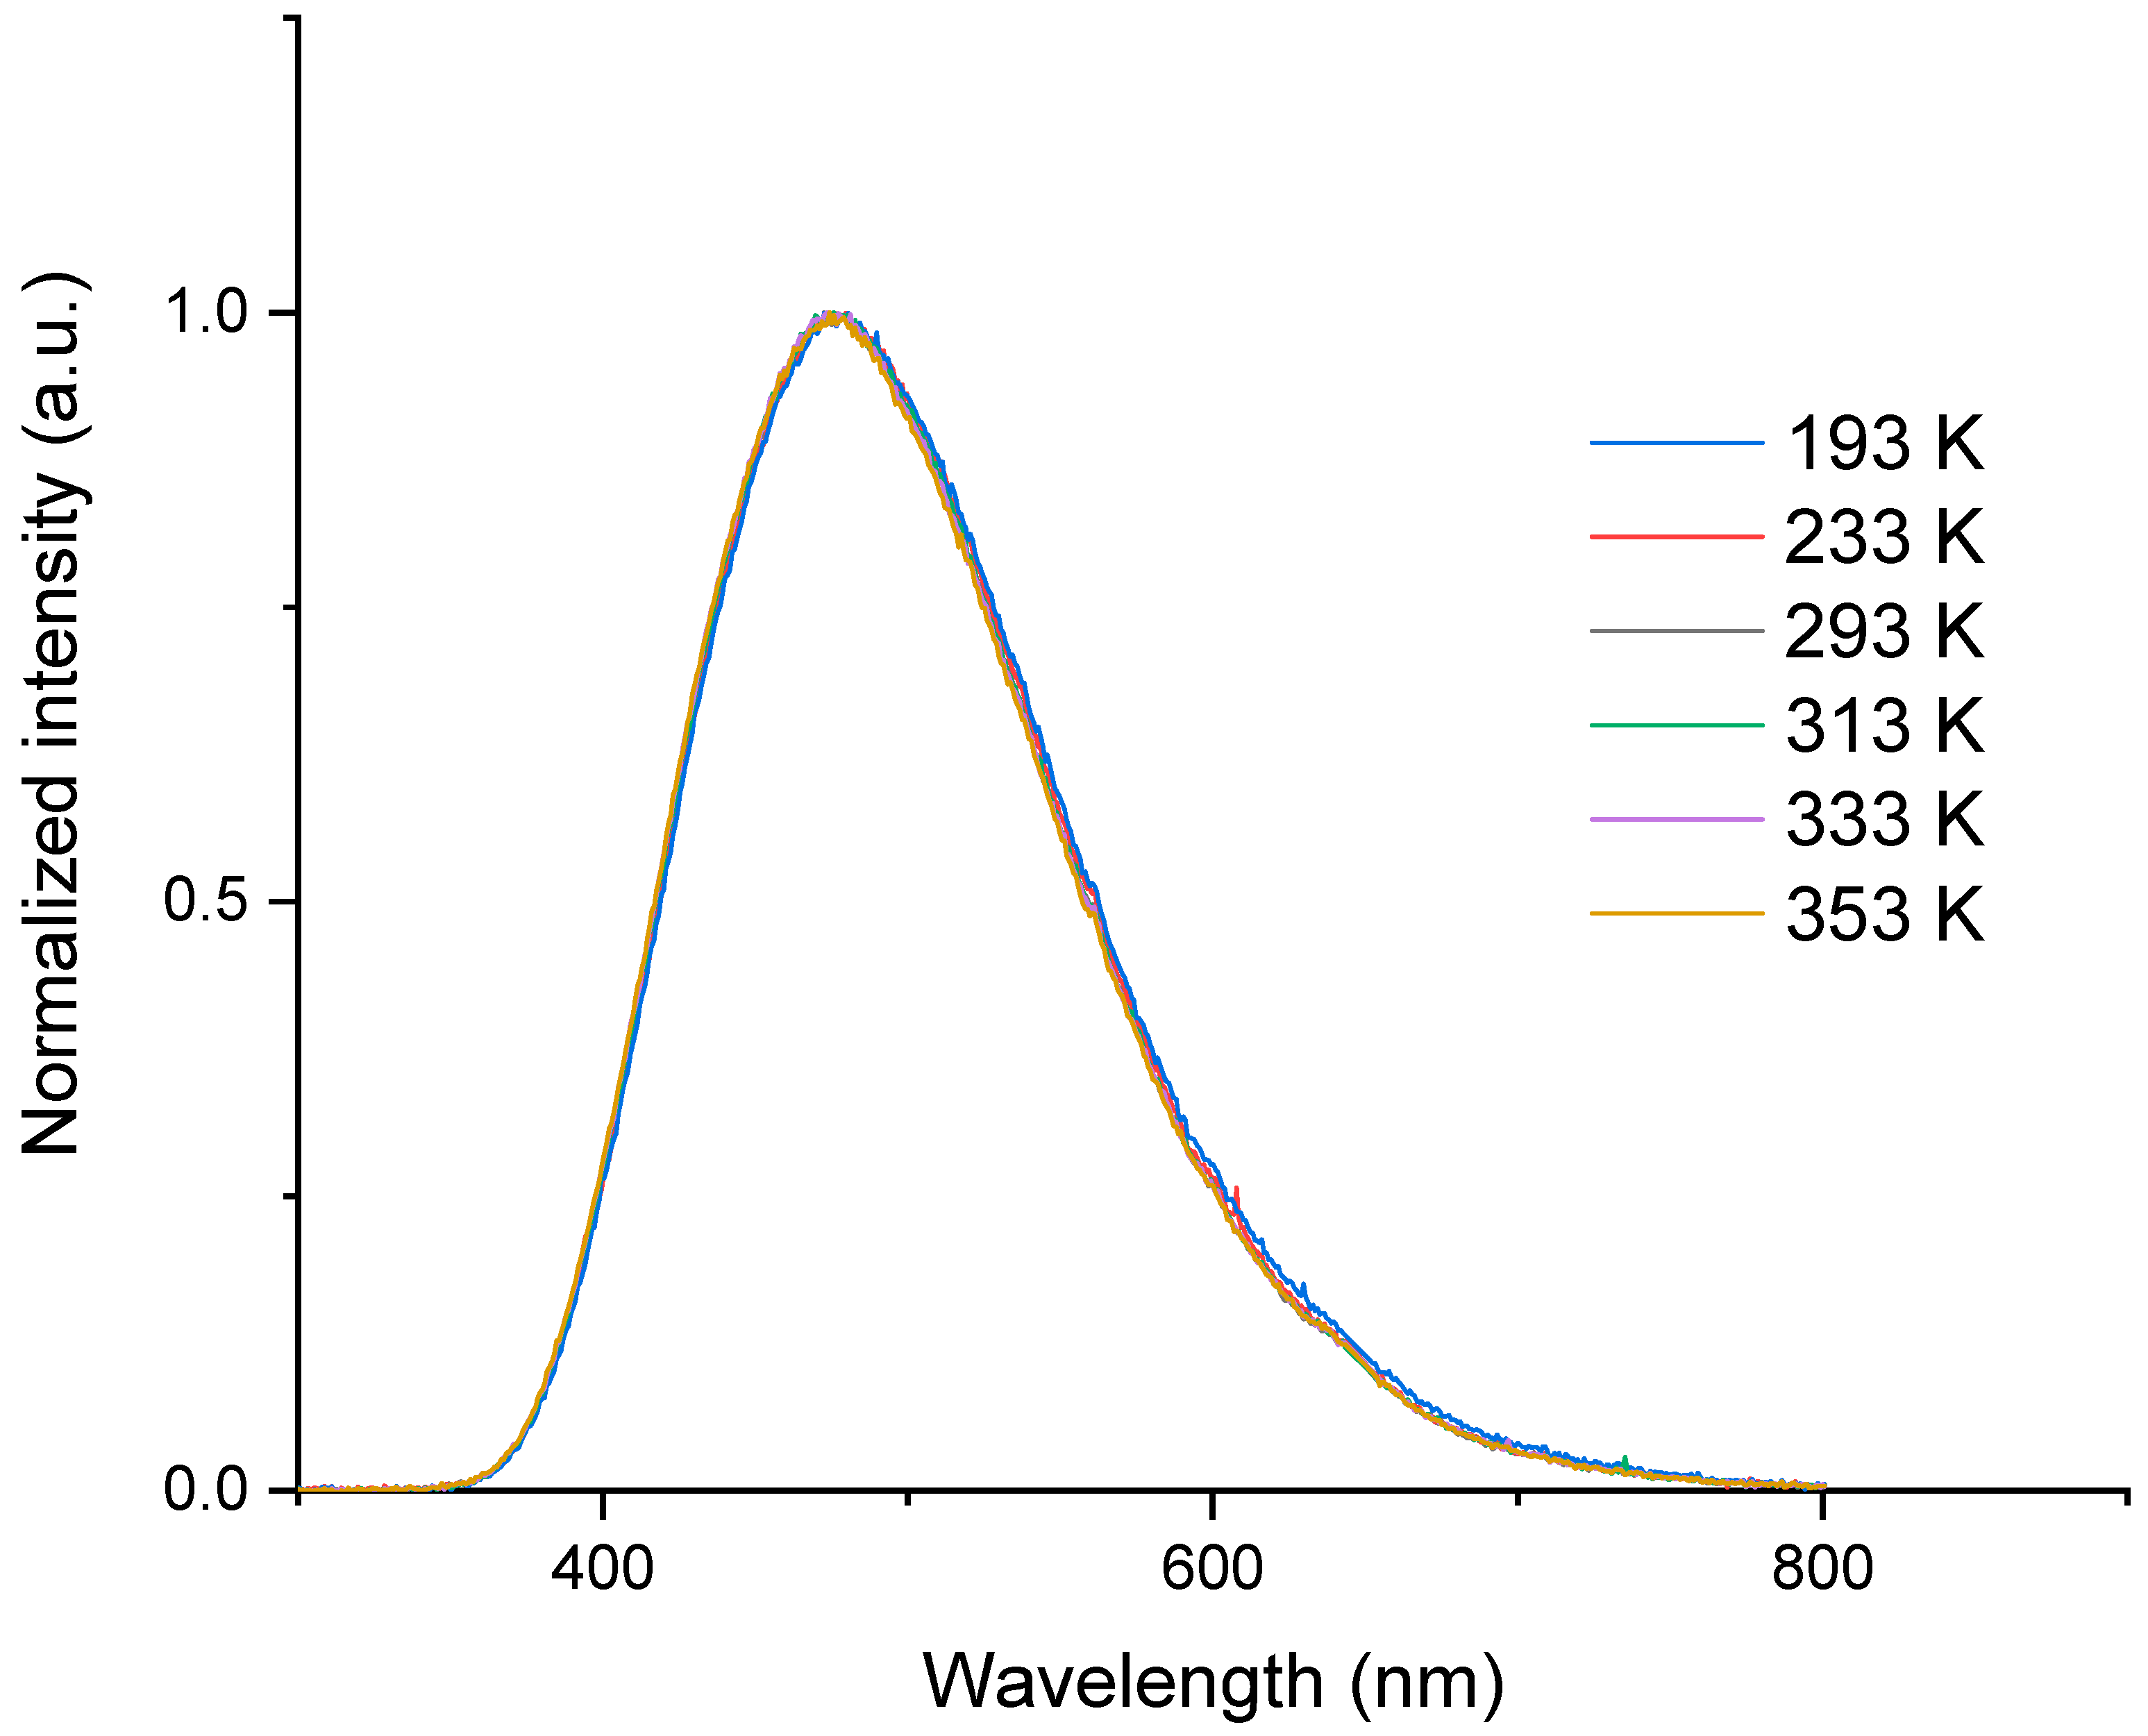
- B. RL spectra
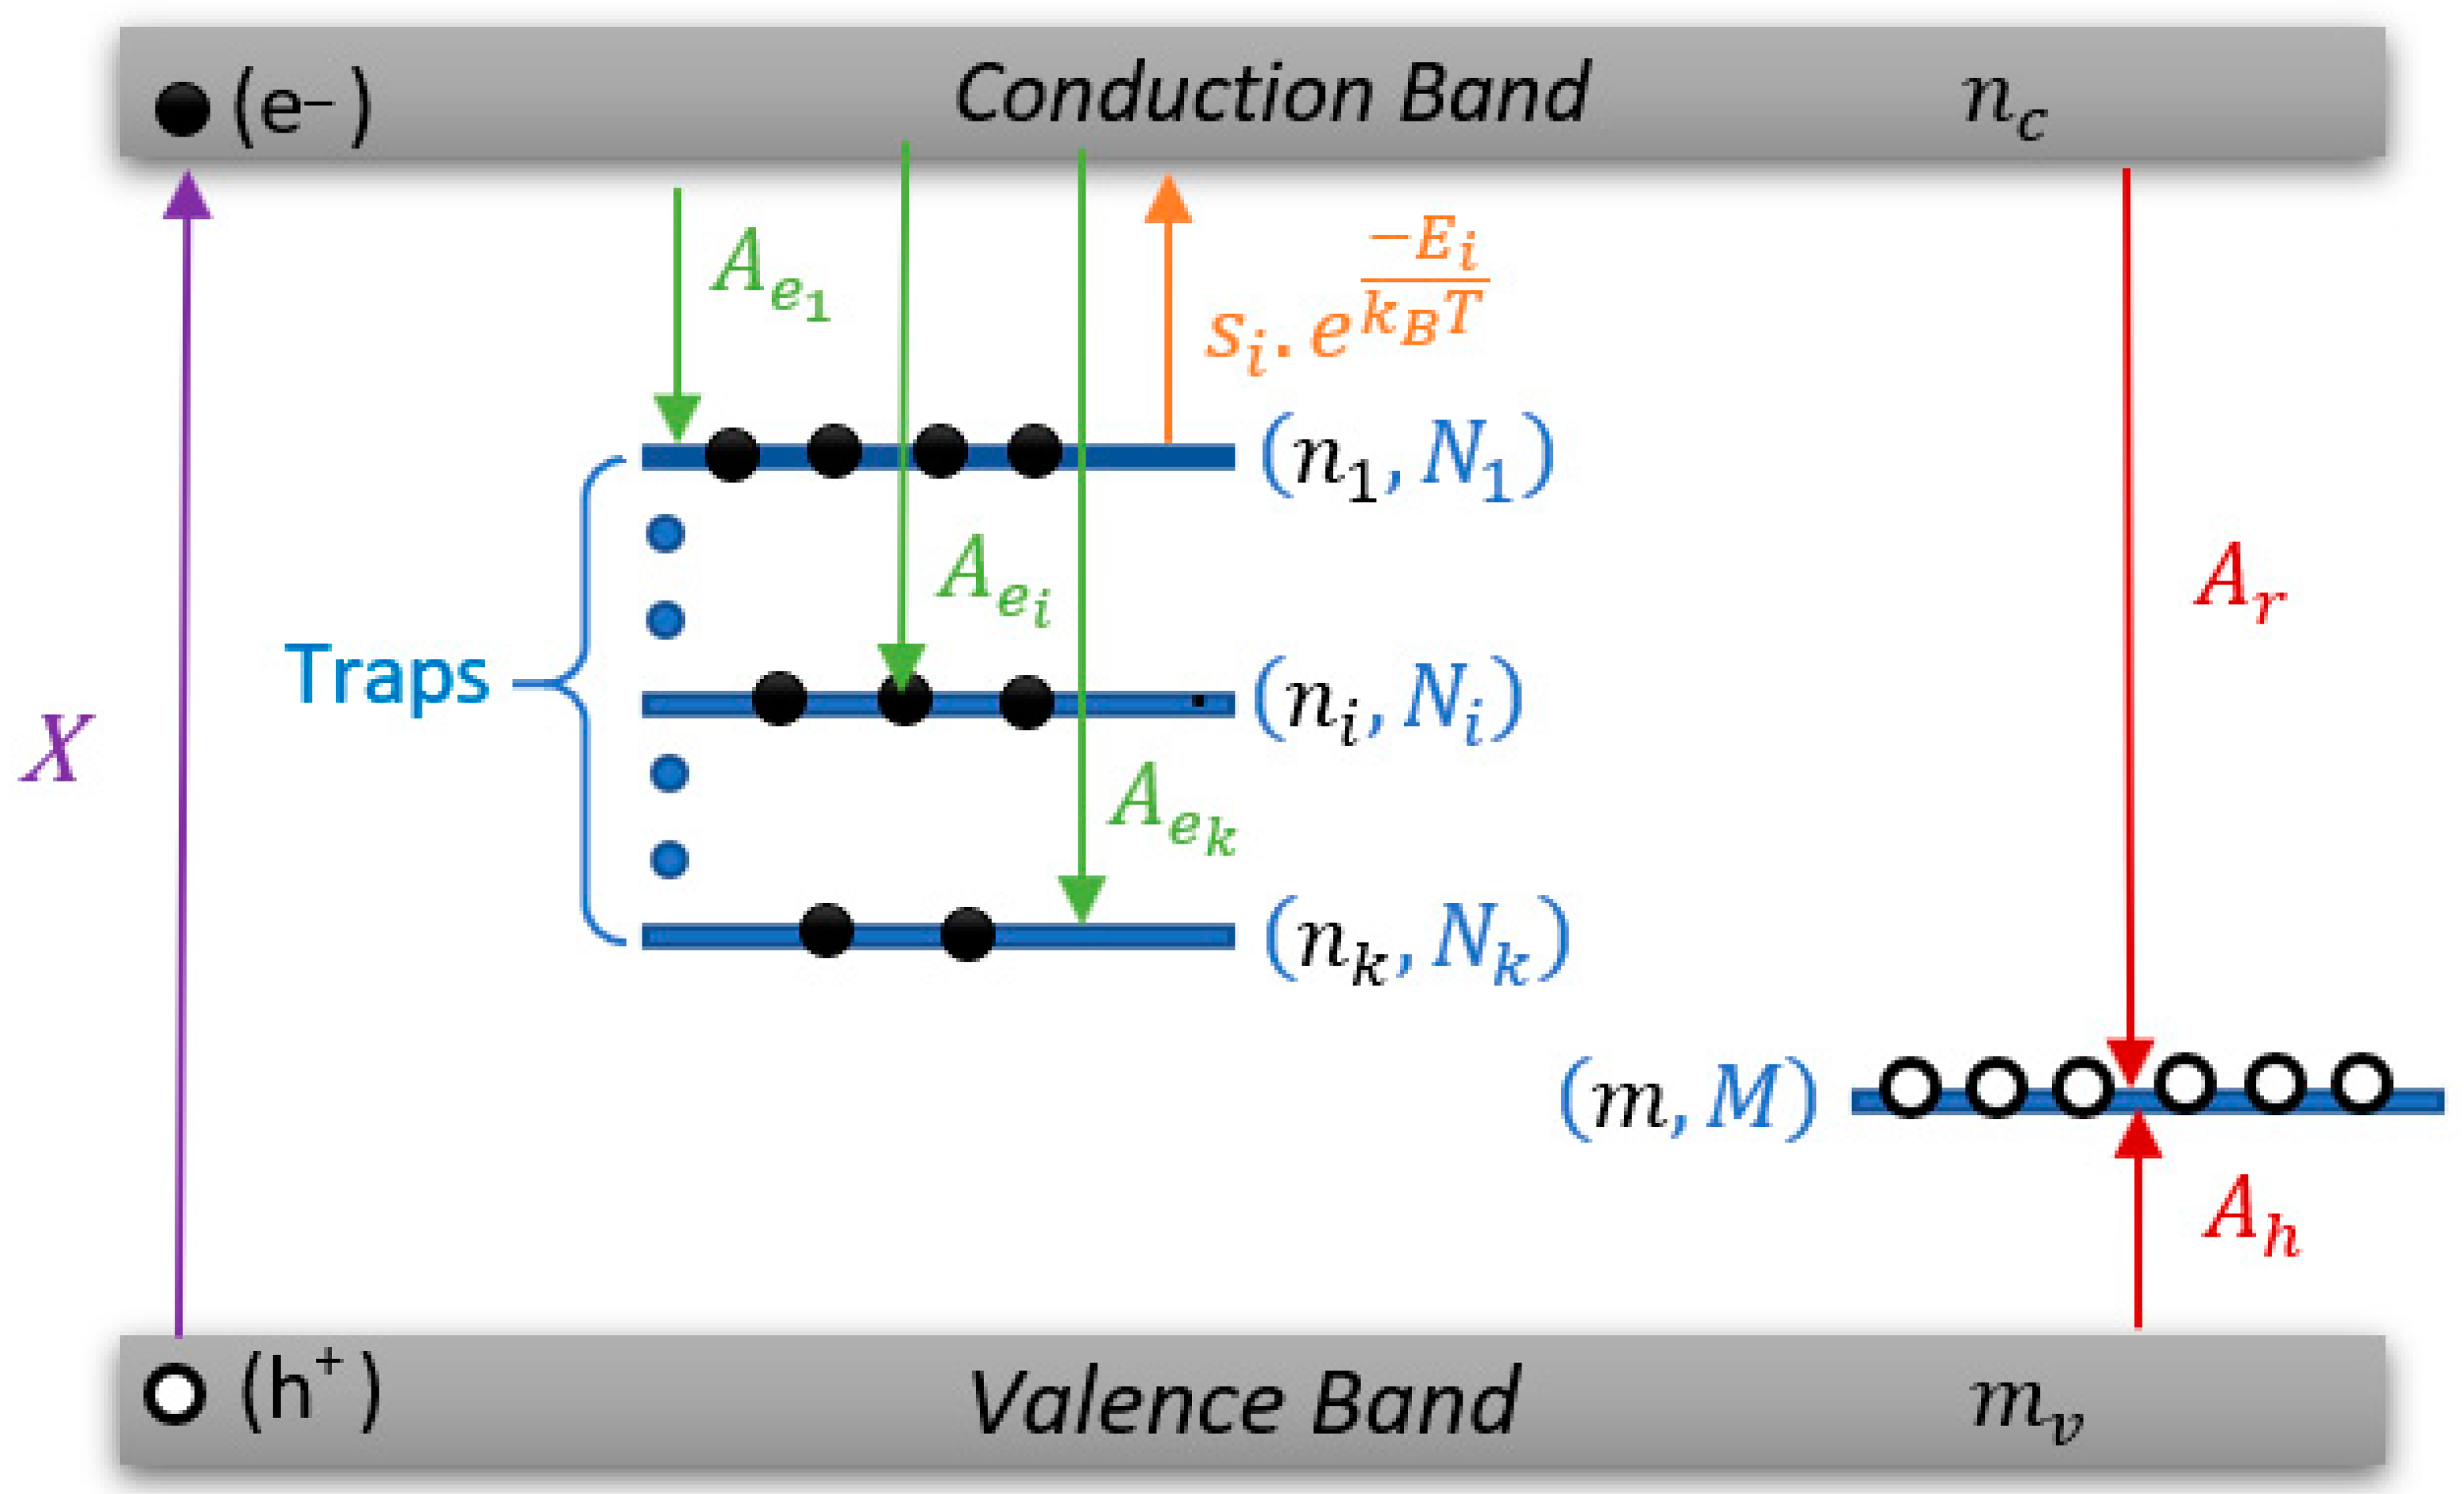
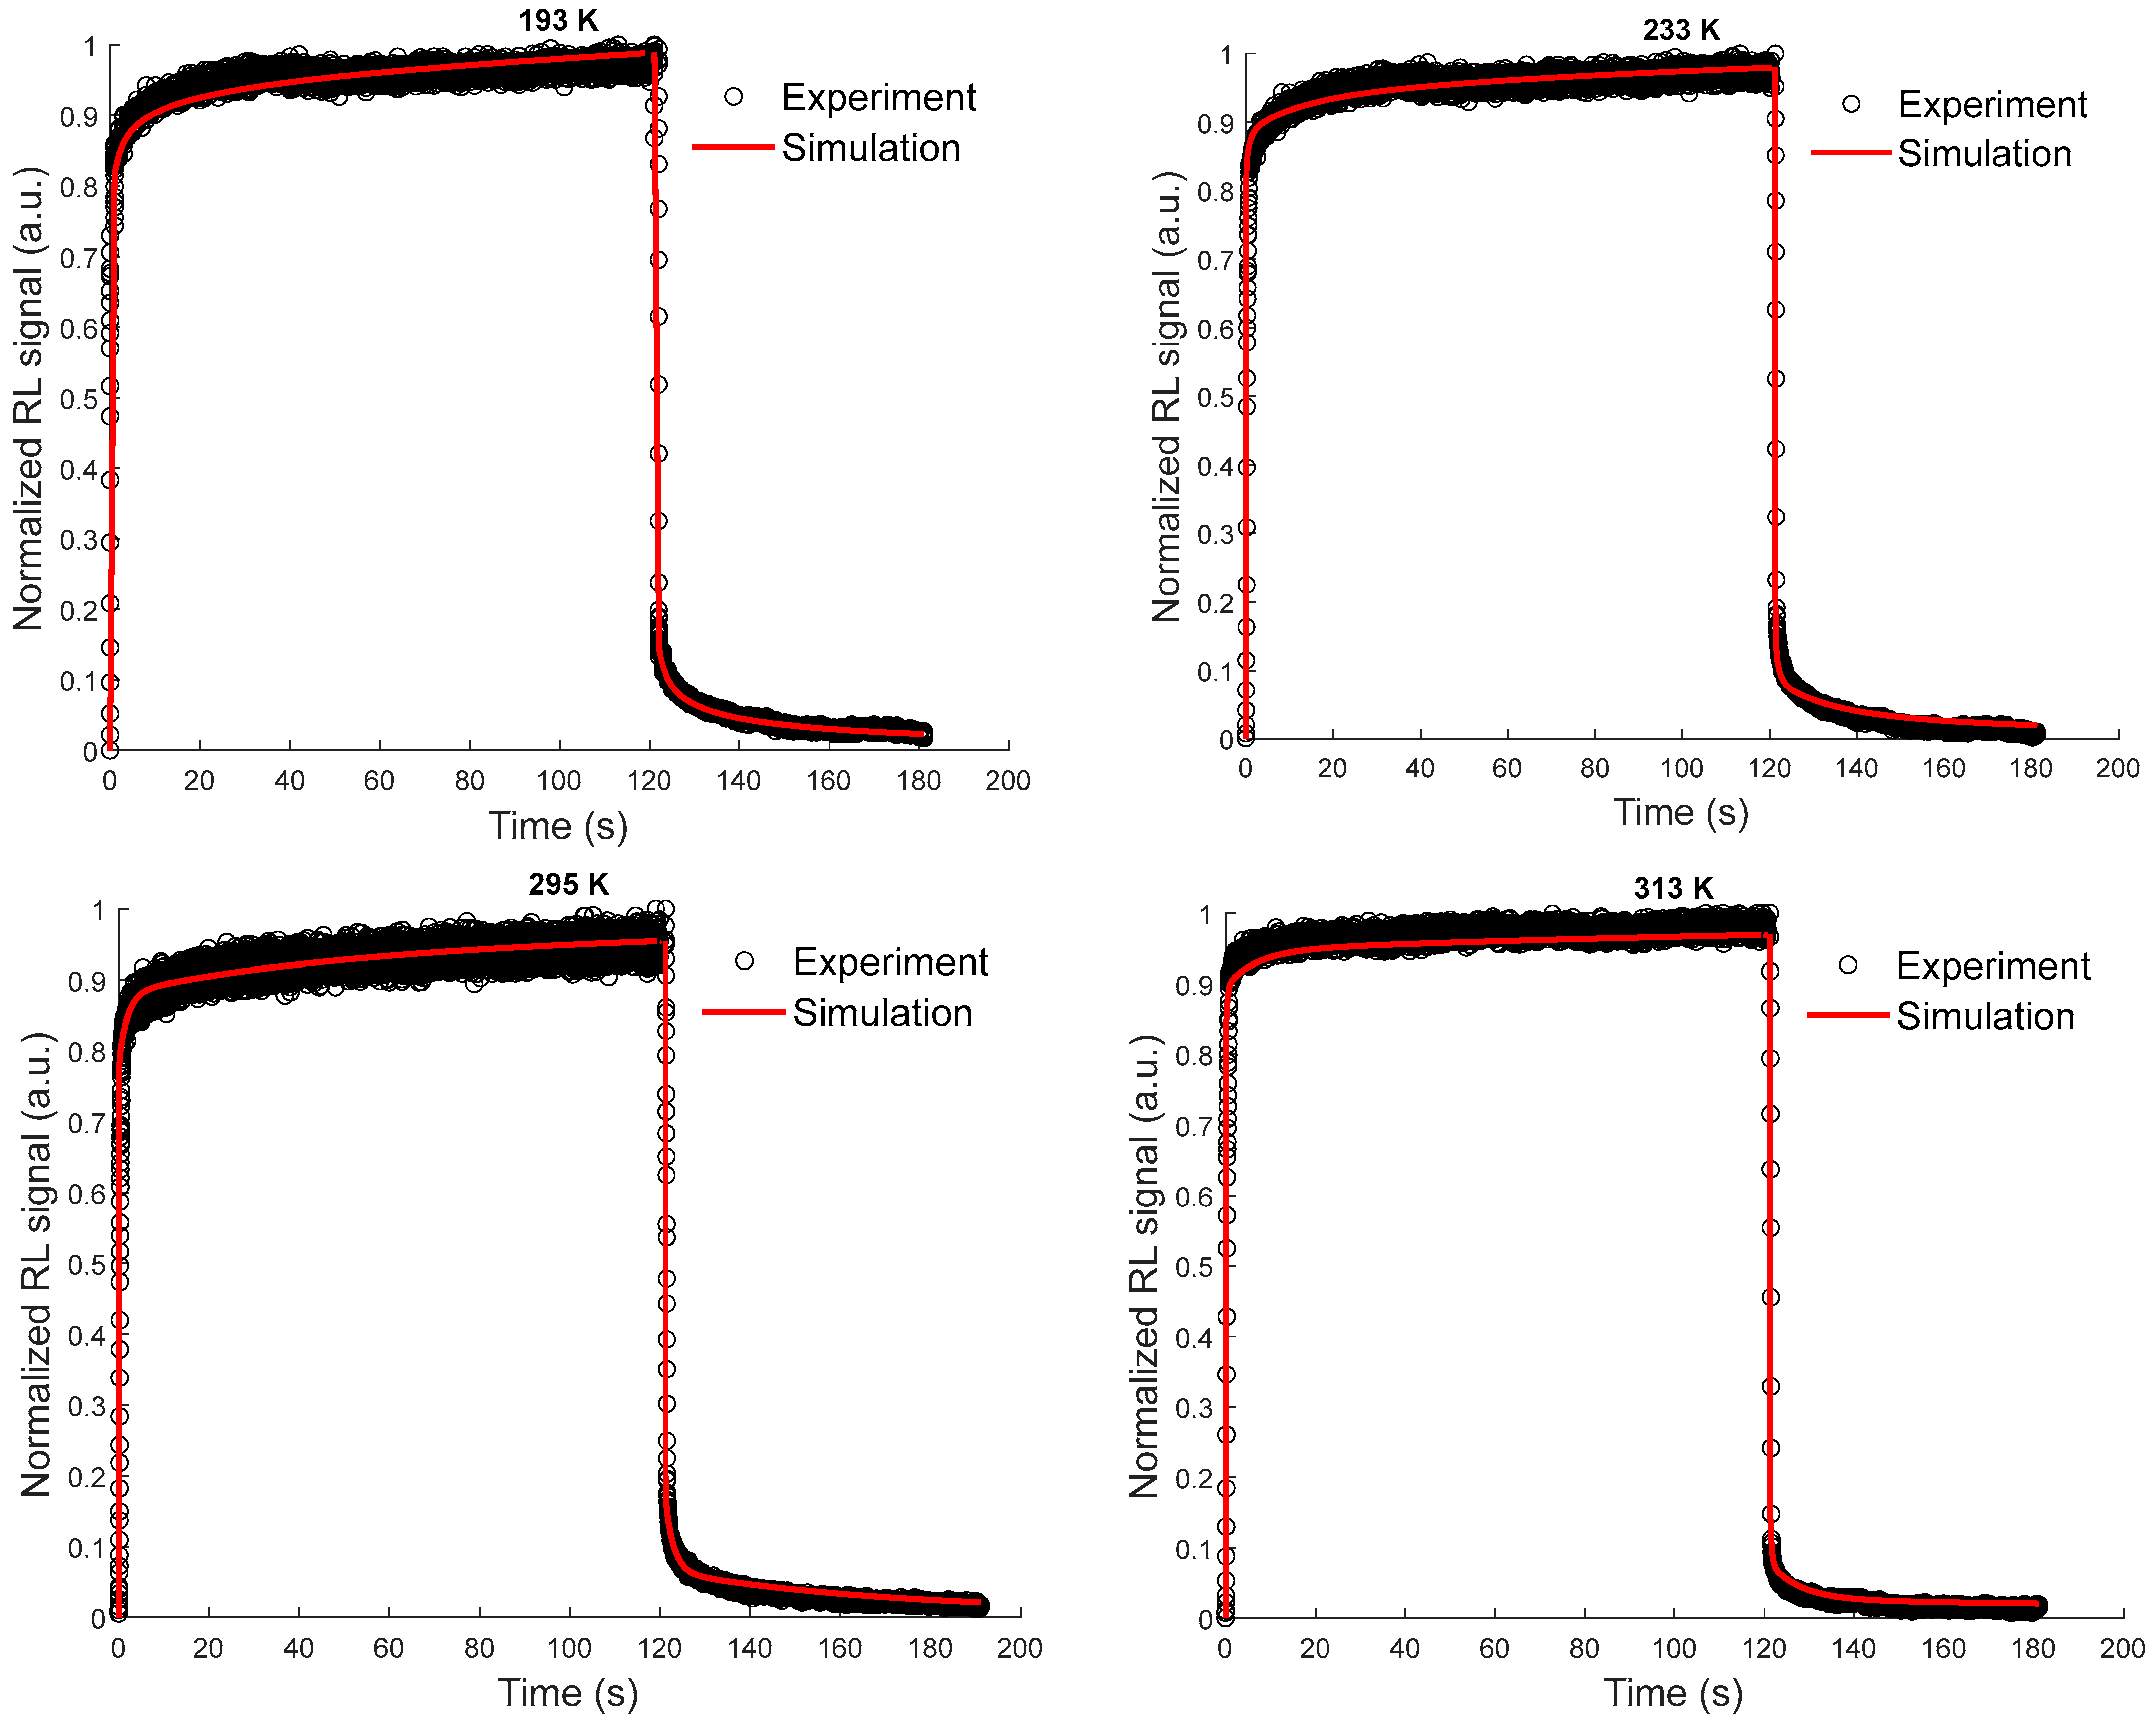
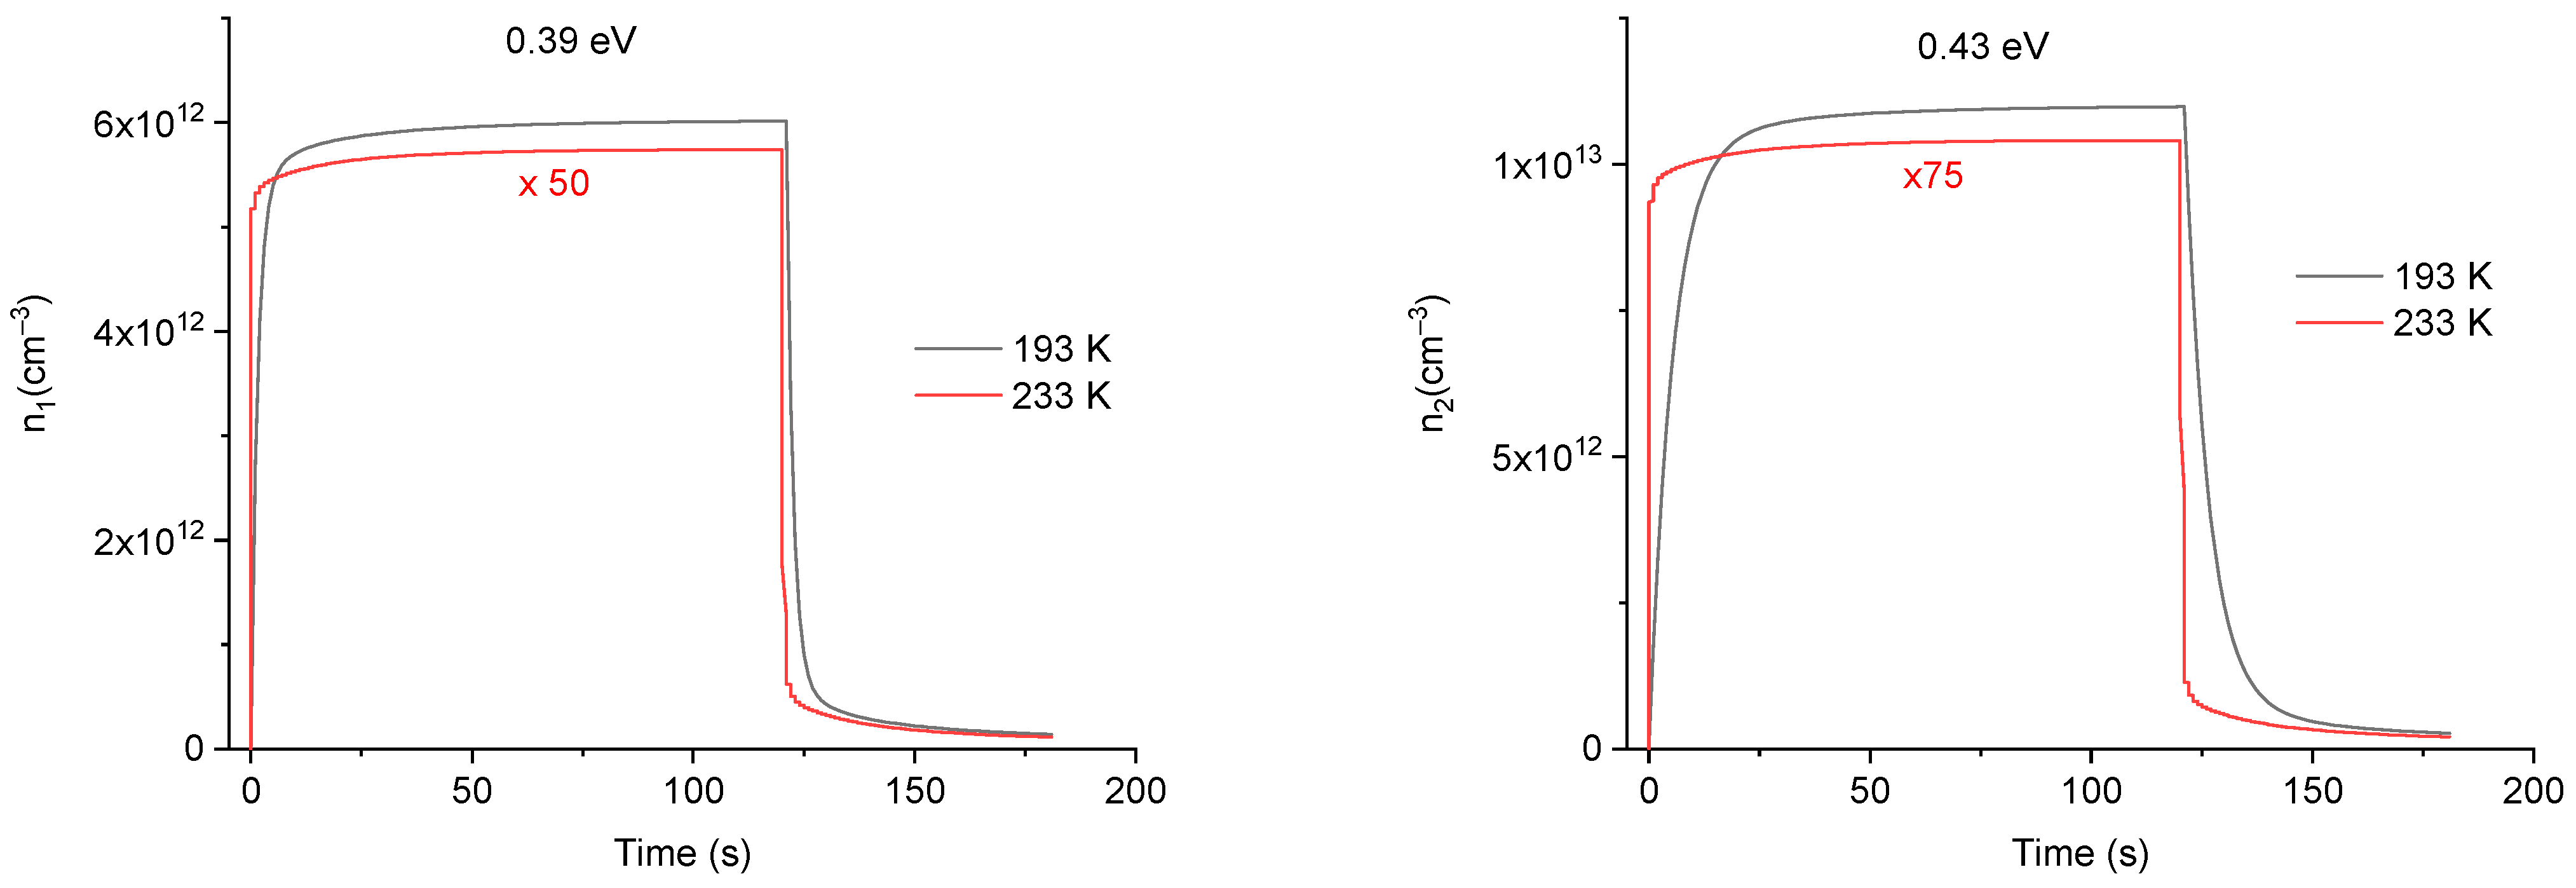
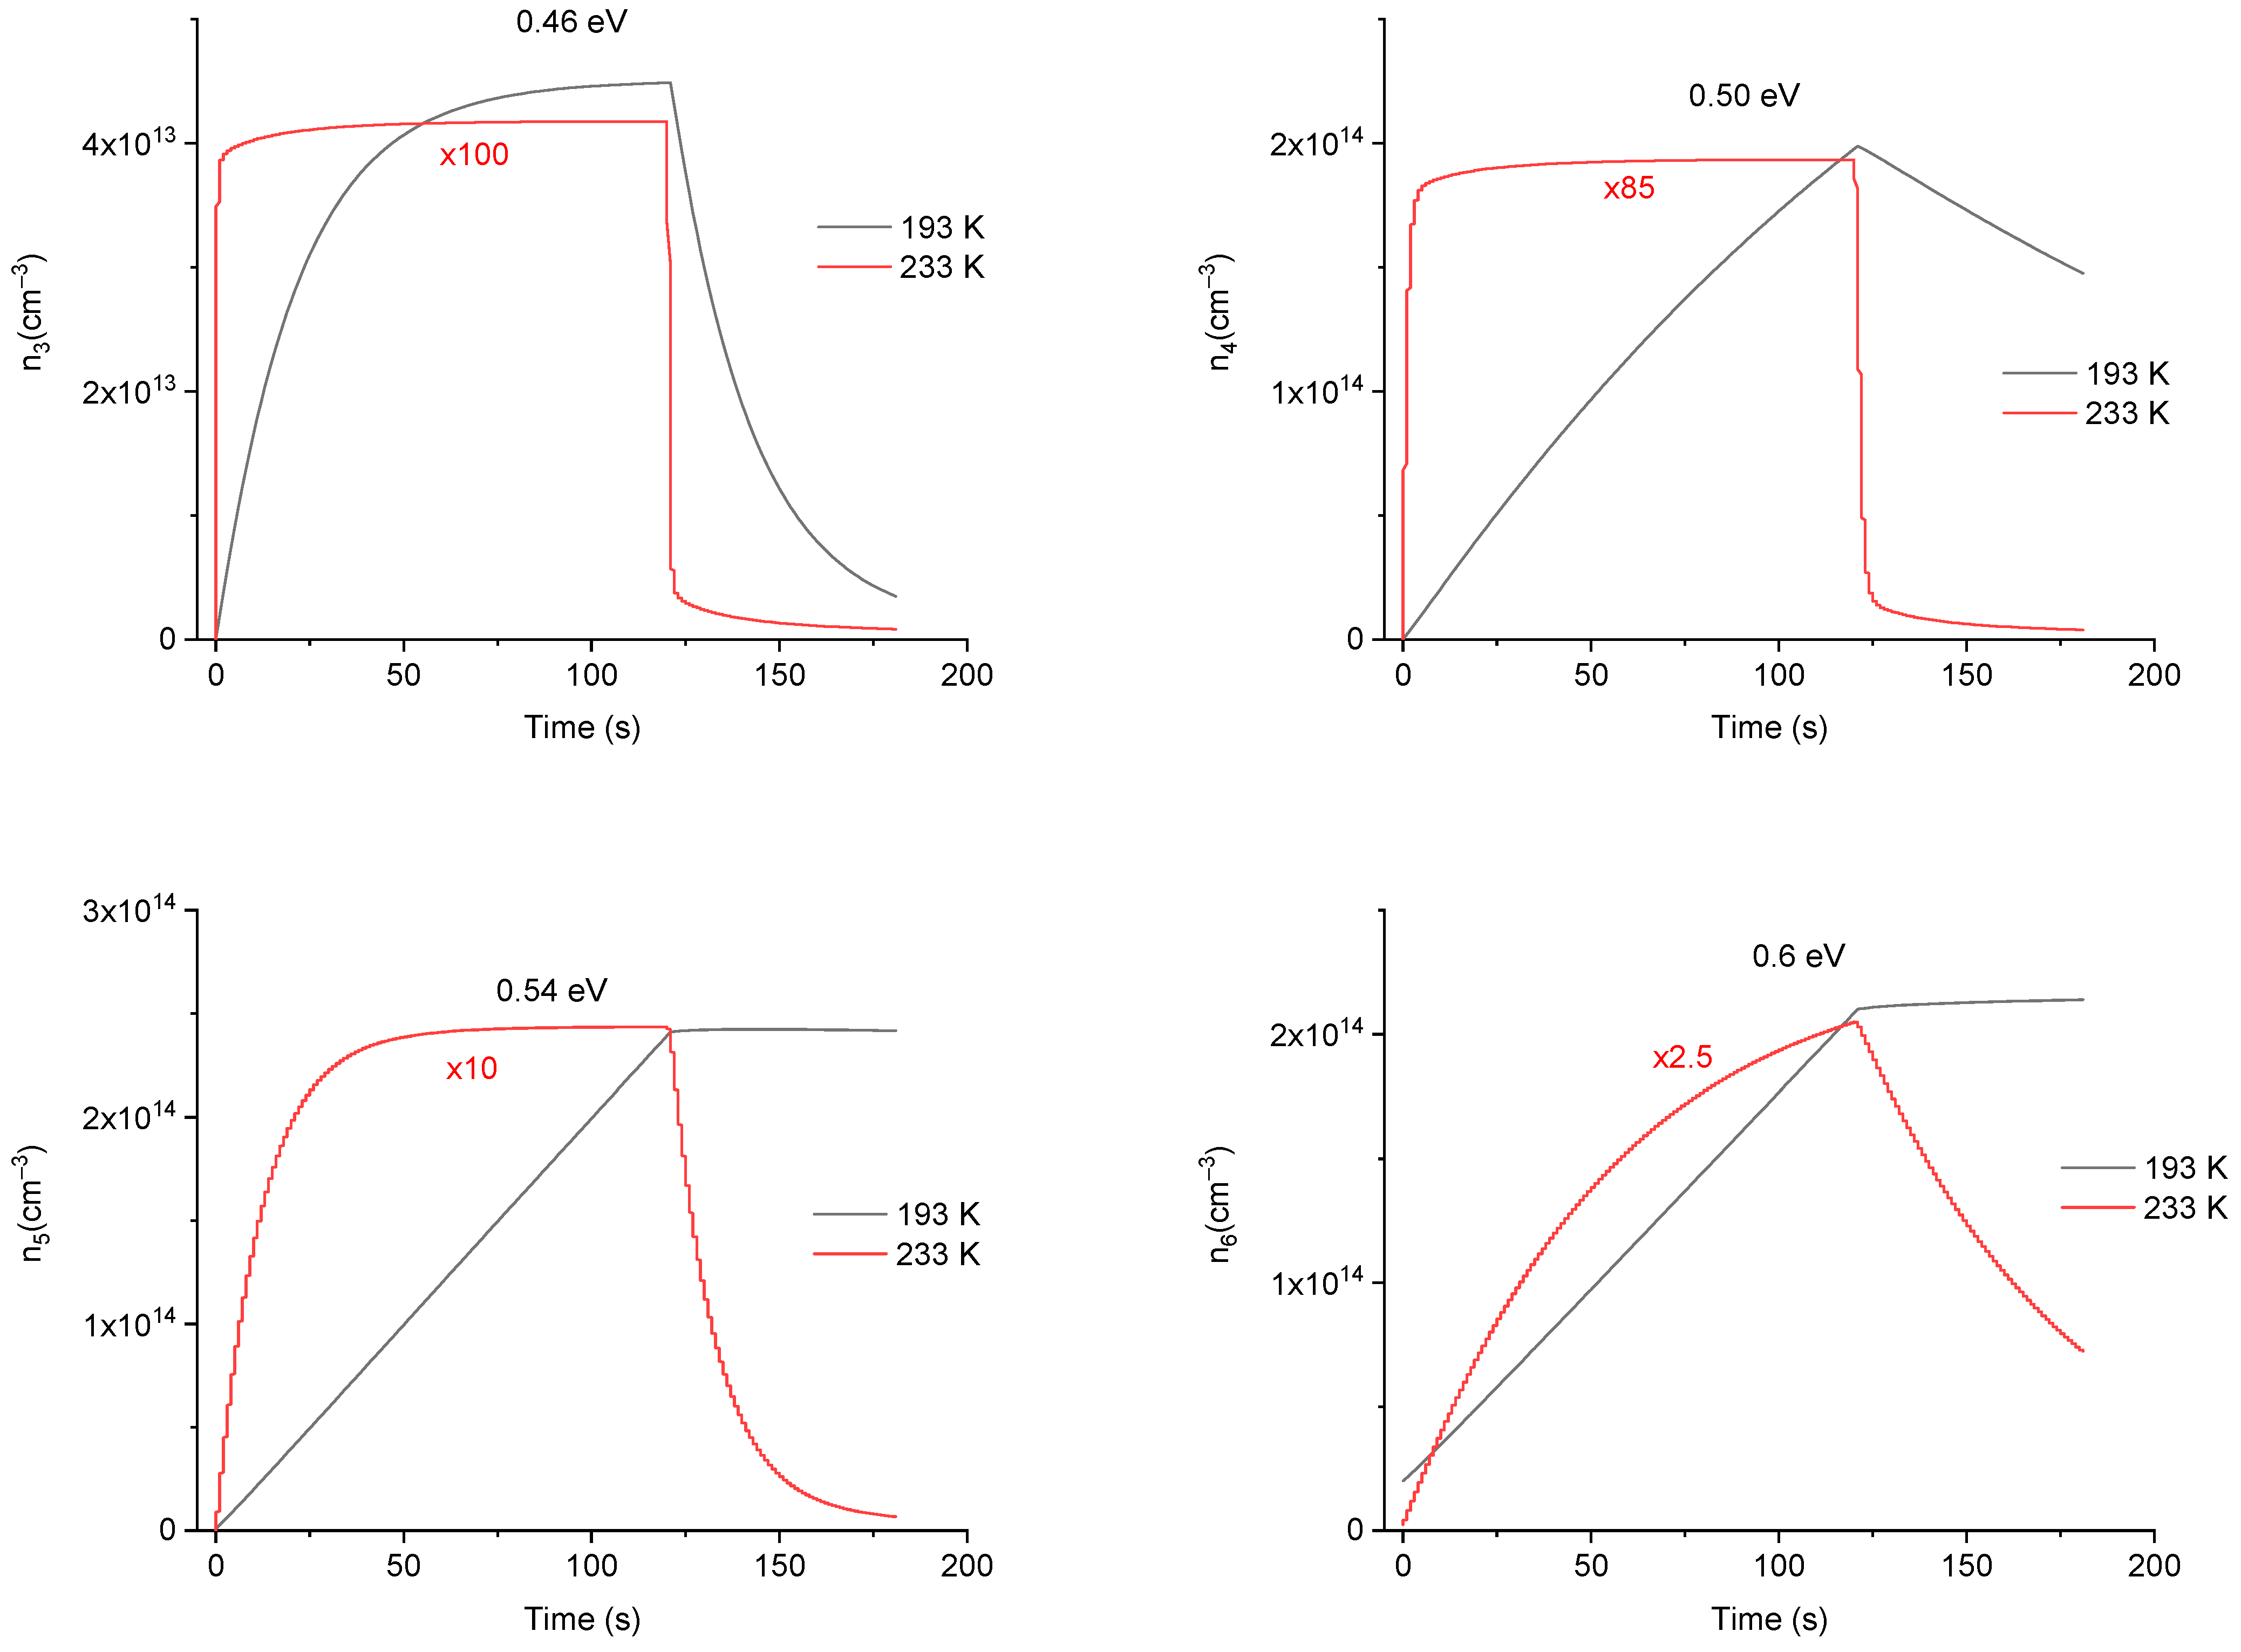
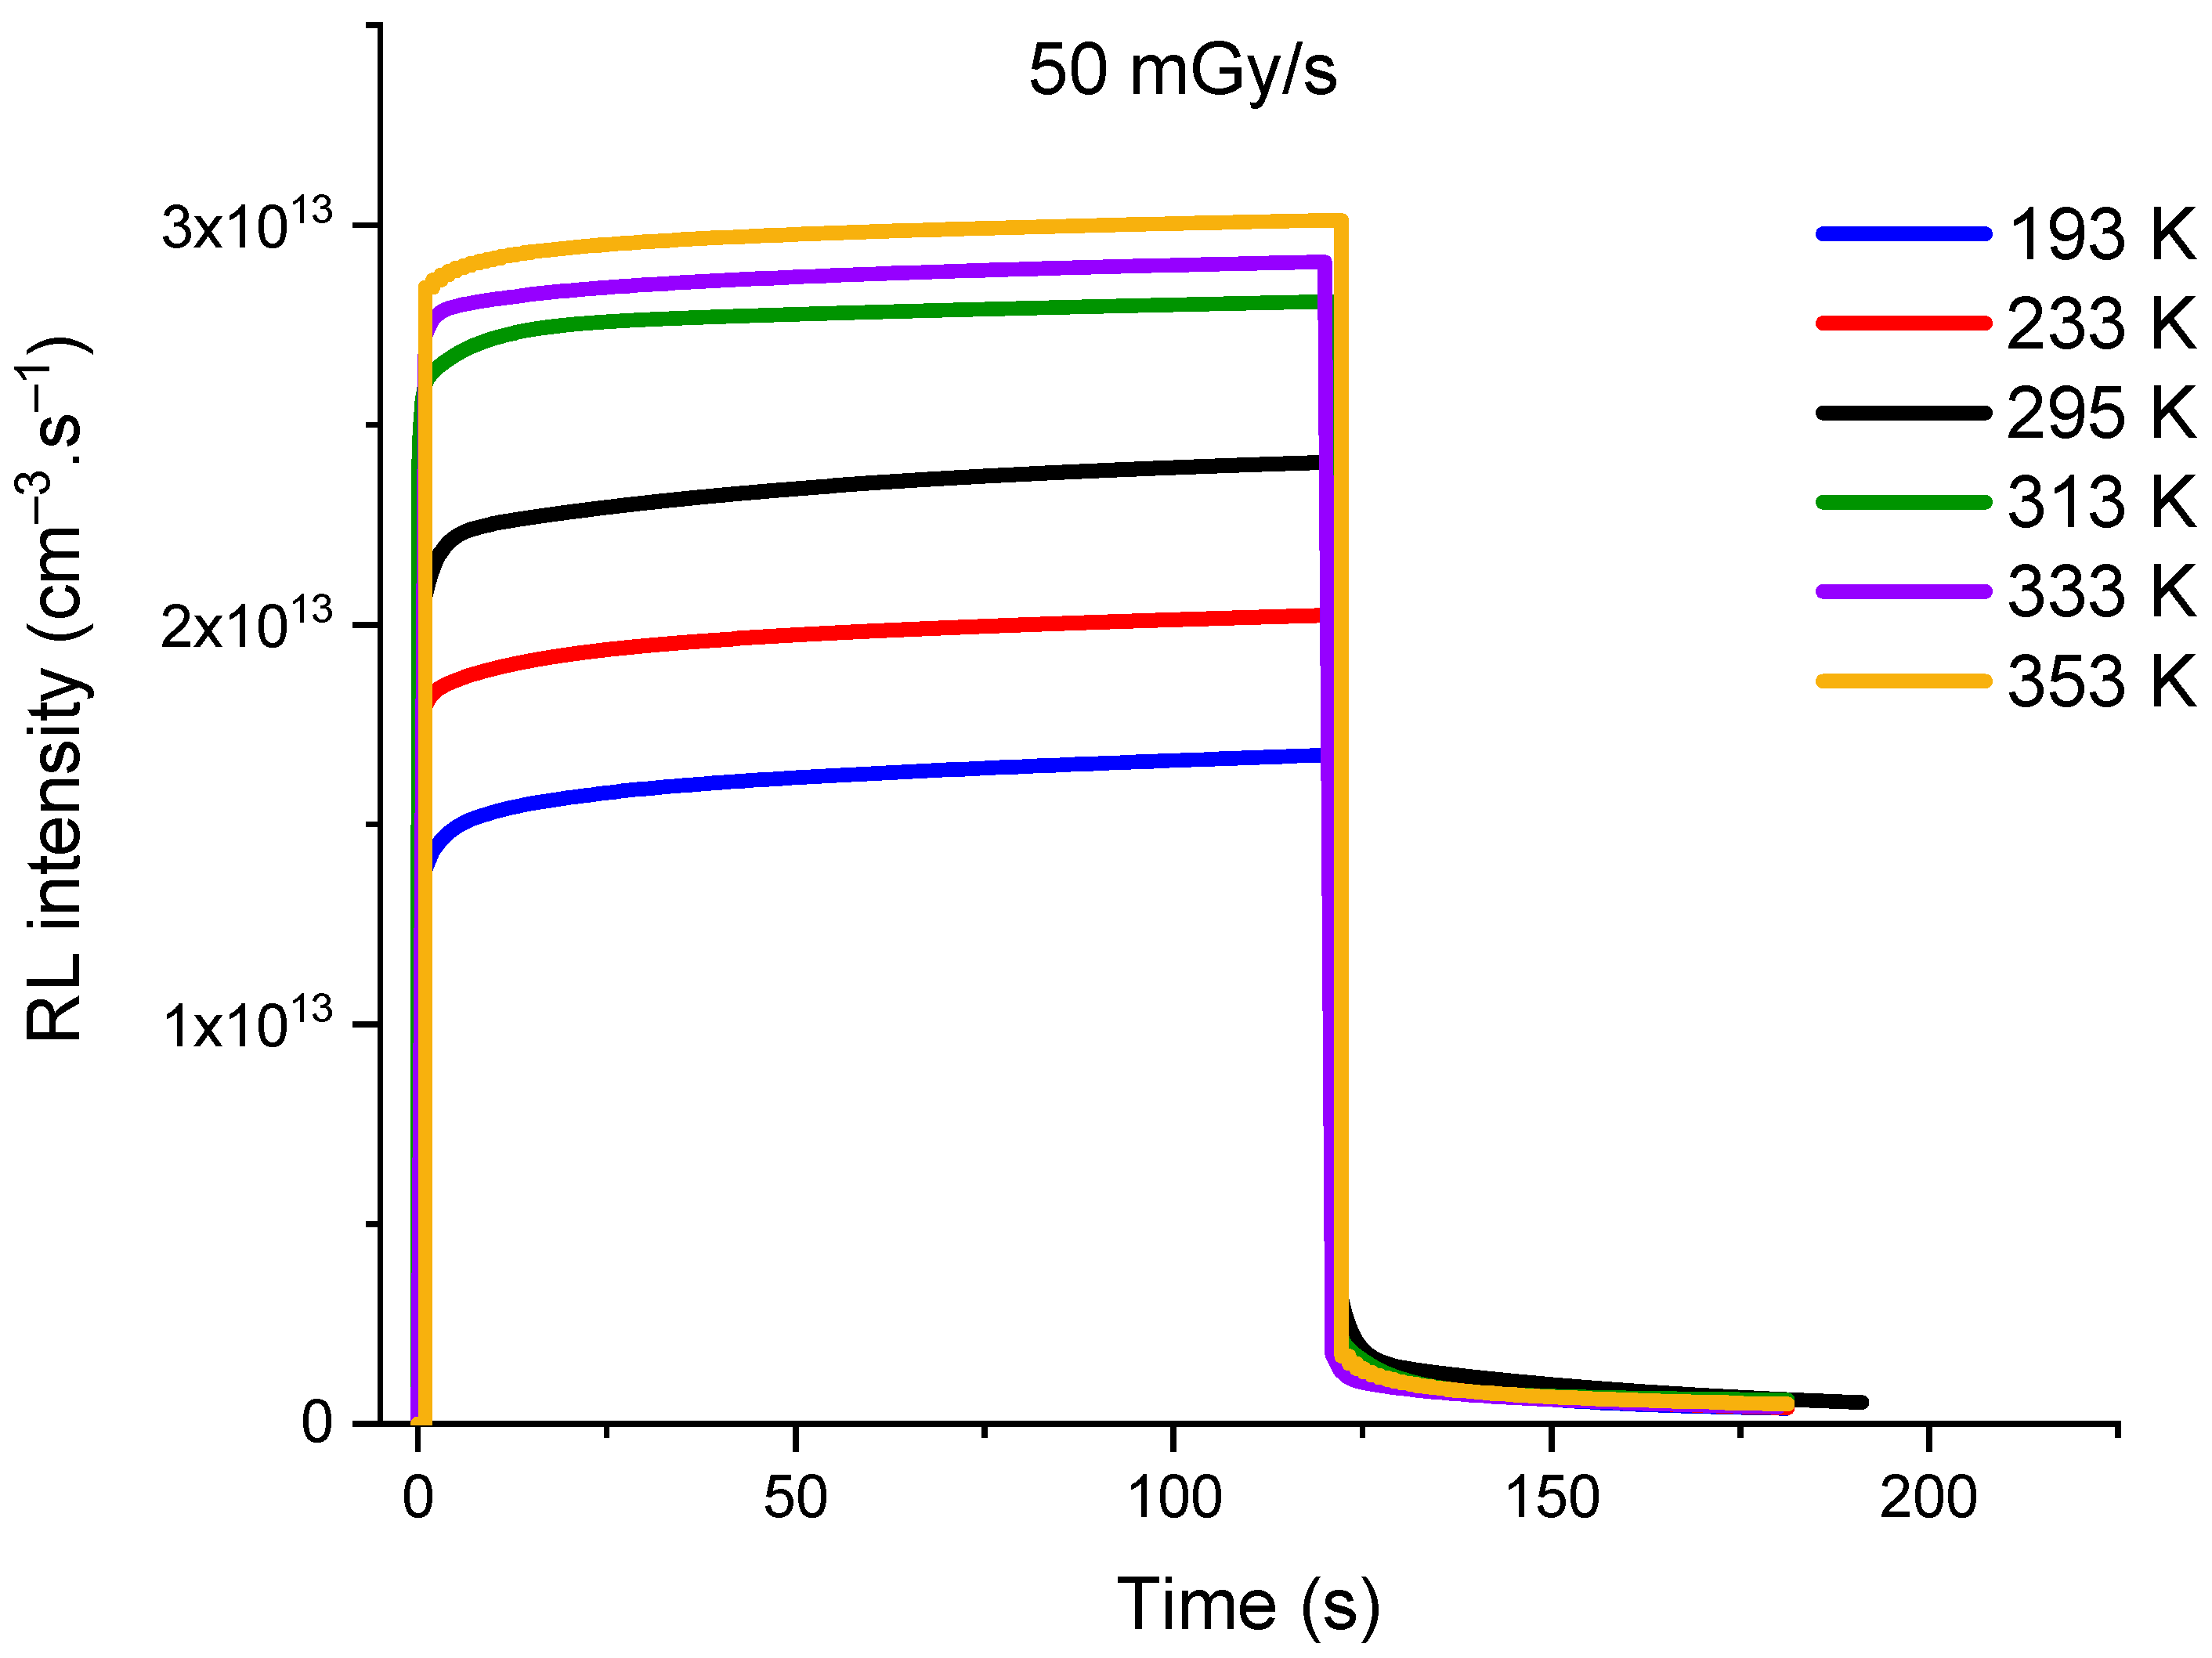
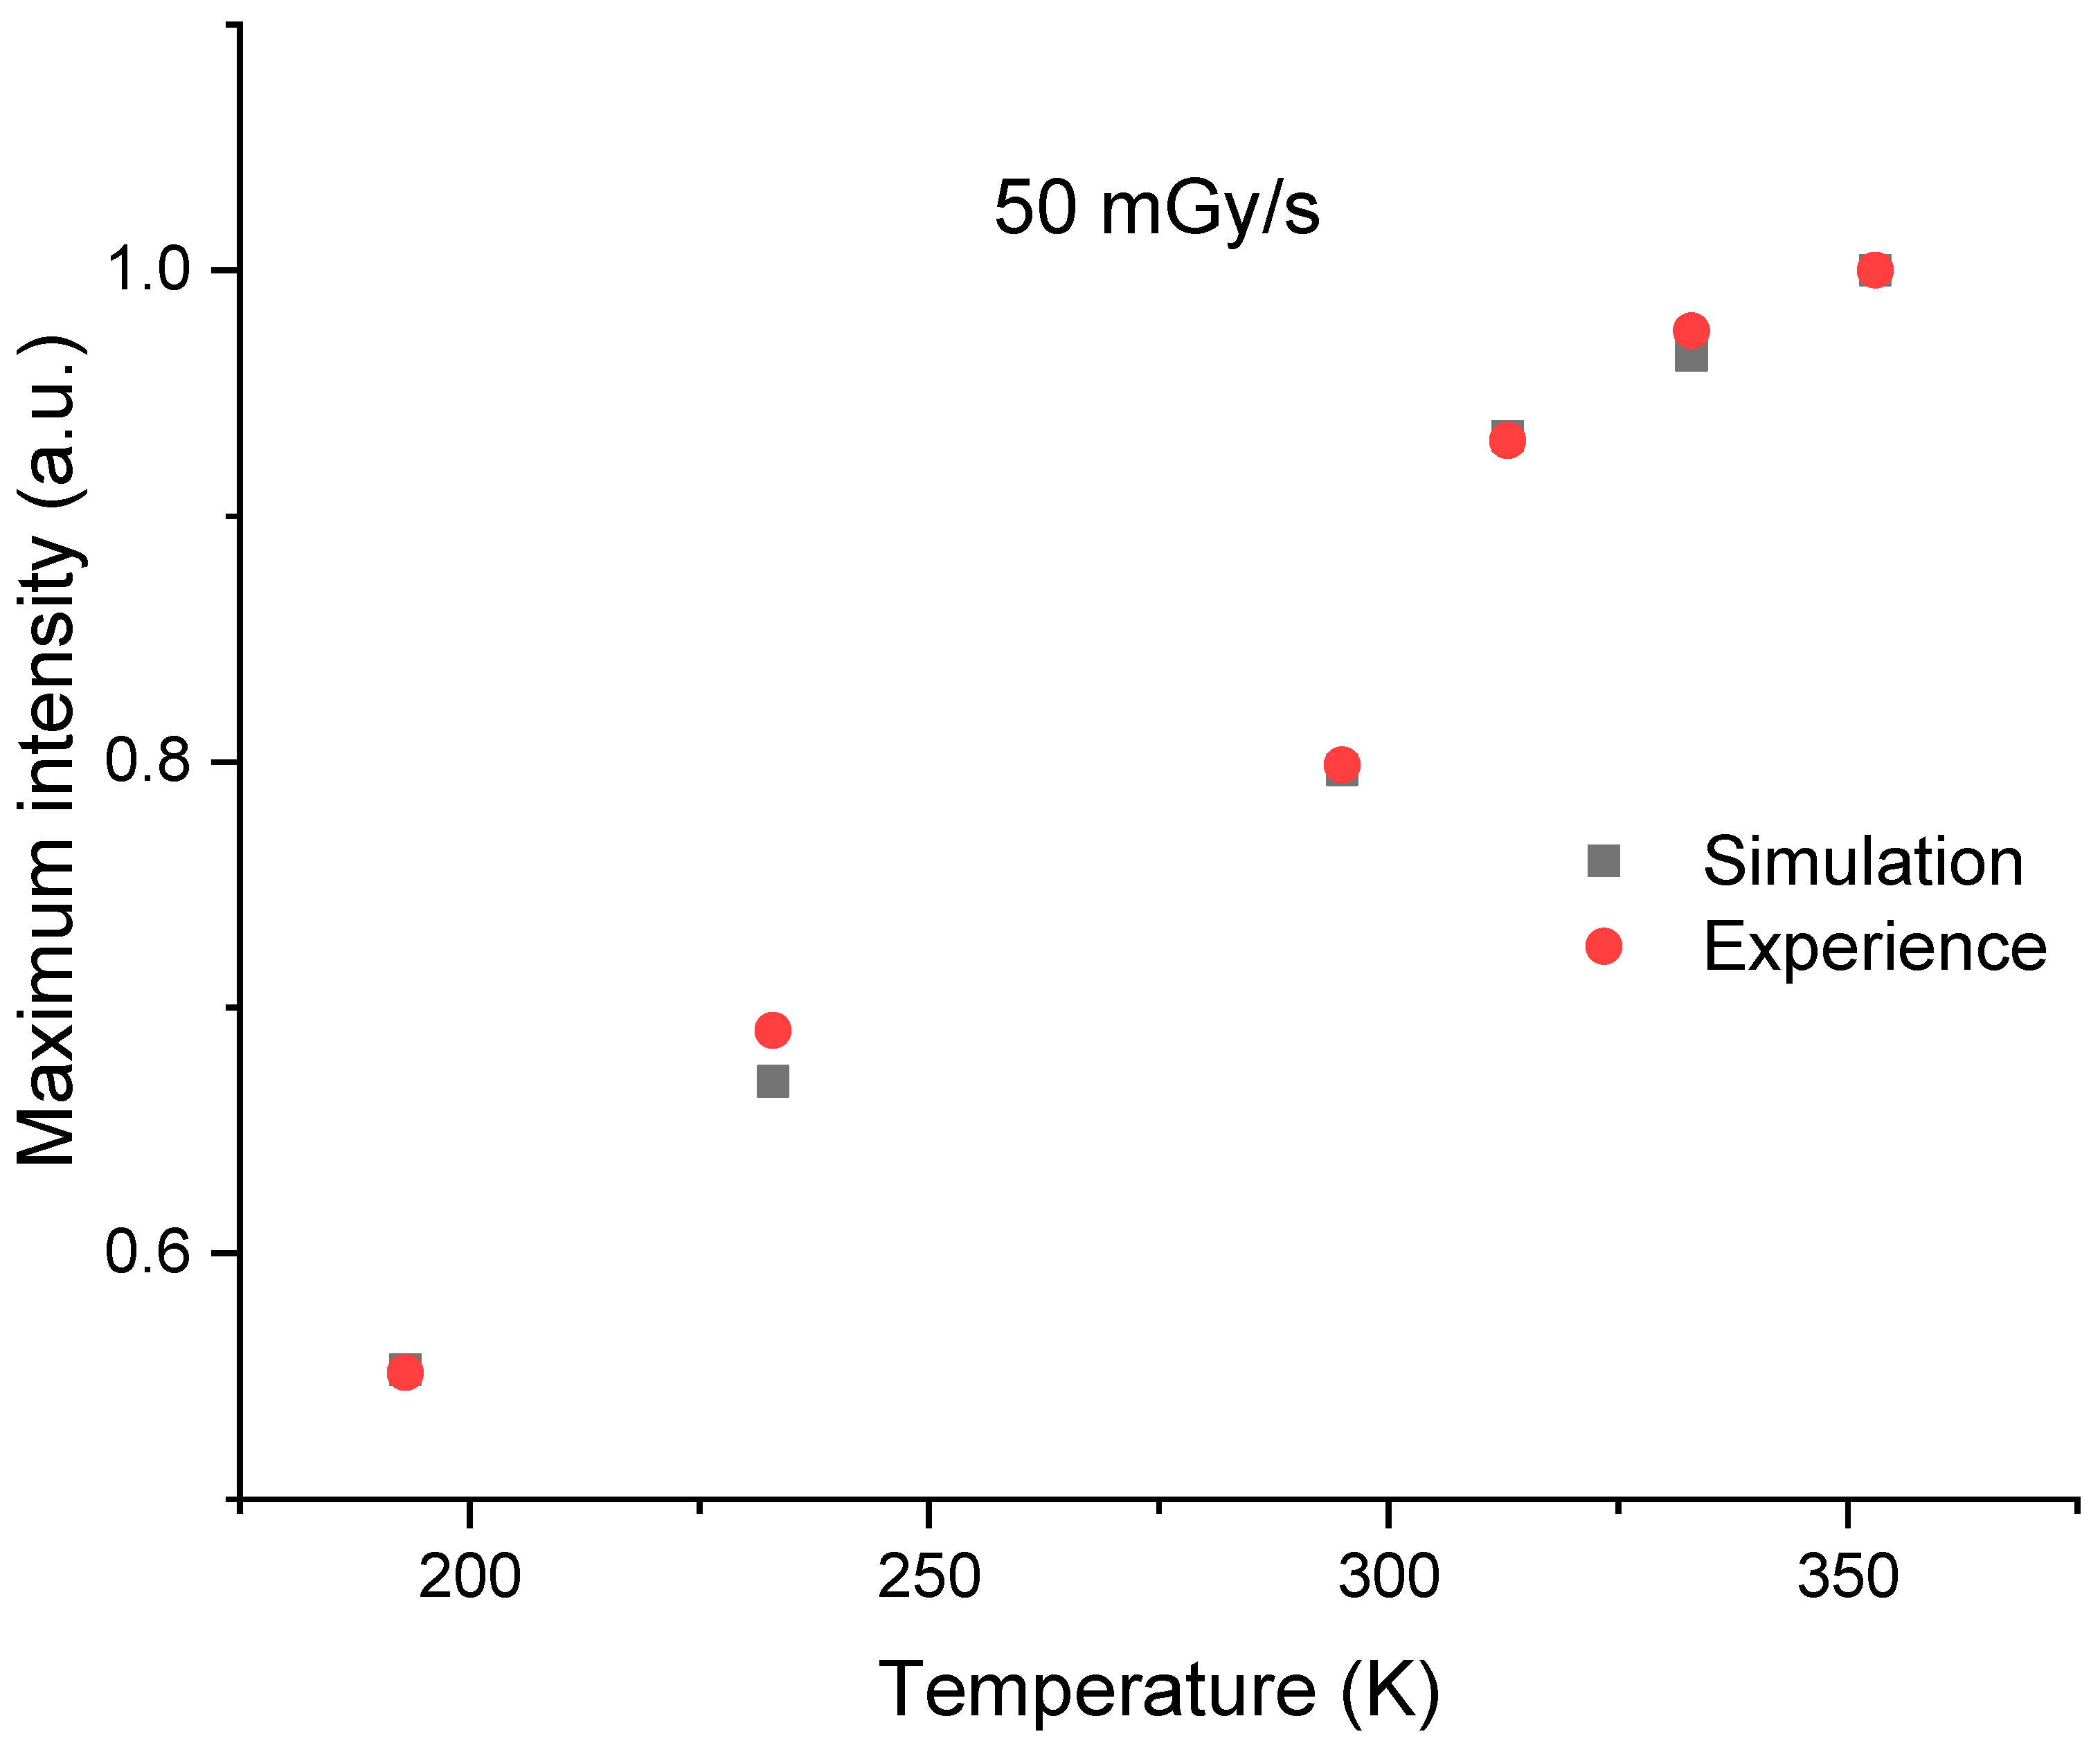
3.2. Model and Simulation
4. Conclusions
Author Contributions
Funding
Data Availability Statement
Acknowledgments
Conflicts of Interest
References
- Girard, S.; Capoen, B.; El Hamzaoui, H.; Bouazaoui, M.; Bouwmans, G.; Morana, A.; Di Francesca, D.; Boukenter, A.; Duhamel, O.; Paillet, P.; et al. Potential of Copper- and Cerium-Doped Optical Fiber Materials for Proton Beam Monitoring. IEEE Trans. Nucl. Sci. 2017, 64, 567–573. [Google Scholar] [CrossRef]
- Al Helou, N.; El Hamzaoui, H.; Capoen, B.; Bouwmans, G.; Cassez, A.; Ouerdane, Y.; Boukenter, A.; Girard, S.; Chadeyron, G.; Mahiou, R.; et al. Radioluminescence and optically stimulated luminescence responses of a cerium-doped sol-gel silica glass under X-ray beam irradiation. IEEE Trans. Nucl. Sci. 2018, 65, 1591–1597. [Google Scholar] [CrossRef]
- El Hamzaoui, H.; Capoen, B.; Al Helou, N.; Bouwmans, G.; Ouerdane, Y.; Boukenter, A.; Girard, S.; Marcandella, C.; Duhamel, O.; Chadeyron, G.; et al. Cerium-activated sol-gel silica glasses for radiation dosimetry in harsh environment. Mater. Res. Express 2016, 3, 046201. [Google Scholar] [CrossRef]
- Capoen, B.; El Hamzaoui, H.; Bouazaoui, M.; Ouerdane, Y.; Boukenter, A.; Girard, S.; Marcandella, C.; Duhamel, O. Sol-gel derived copper-doped silica glass as a sensitive material for X-ray beam dosimetry. Opt. Mater. 2016, 51, 104–109. [Google Scholar] [CrossRef]
- Söderström, D.; Kettunen, H.; Morana, A.; Javanainen, A.; Ouerdane, Y.; El Hamzaoui, H.; Capoen, B.; Bouwmans, G.; Bouazaoui, M. Radioluminescence Response of Ce-, Cu- and Gd-Doped Silica Glasses for Dosimetry of Pulsed Electron Beams. Sensors 2021, 21, 7523. [Google Scholar] [CrossRef] [PubMed]
- Cieslikiewicz-Bouet, M.; El Hamzaoui, H.; Ouerdane, Y.; Mahiou, R.; Chadeyron, G.; Bigot, L.; Delplace-Baudelle, K.; Habert, R.; Plus, S.; Cassez, A.; et al. Investigation of the Incorporation of Cerium Ions in MCVD-Silica Glass Preforms for Remote Optical Fiber Radiation Dosimetry. Sensors 2021, 21, 3362. [Google Scholar] [CrossRef] [PubMed]
- Girard, S.; Morana, A.; Ladaci, A.; Robin, T.; Mescia, L.; Bonnefois, J.-J.; Boutillier, M.; Mekki Paveau, J.A.; Cadier, B.; Marin, E.; et al. Recent advances in radiation-hardened fiber-based technologies for space applications. J. Opt. 2018, 20, 093001. [Google Scholar] [CrossRef]
- Al Helou, N.; El Hamzaoui, H.; Capoen, B.; Bouwmans, G.; Cassez, A.; Ouerdane, Y.; Cannas, M.; Girard, S.; Bouazaoui, M. Optical responses of a copper-activated sol-gel silica glass under low-dose and low-dose rate X-ray exposures. OSA Contin. 2019, 2, 563–571. [Google Scholar] [CrossRef]
- Stroud, J.S. Color Centers in a Cerium-Containing Silicate Glass. J. Chem. Phys. 1962, 37, 836–841. [Google Scholar] [CrossRef]
- Fu, X.; Song, L.; Li, J. Radiation induced color centers in cerium doped and cerium-free multicomponent silicate glasses. J. Rare Earths 2014, 32, 1037–1042. [Google Scholar] [CrossRef]
- Kurtulus, R.; Kavas, T.; Gayret, A.; Biceroglu, D. Physical, Optical, and Radiation Shielding Features of CeO2-Reinforced Li2O-ZnO-SiO2 Glass. Emerg. Mater. Res. 2021, 11, 86–92. [Google Scholar] [CrossRef]
- Benabdesselam, M.; Bahout, J.; Mady, M.; Blanc, W.; El Hamzaoui, H.; Cassez, A.; Delplace-Baudelle, K.; Habert, R.; Bouwmans, G.; Bouazaoui, M.; et al. TL Properties of RE-Doped and Co-Doped Sol-Gel Silica Rods. Application to Passive (OSL) and Real-Time (RL) Dosimetry. IEEE Sens. J. 2021, 21, 27465–27472. [Google Scholar] [CrossRef]
- Veronese, I.; Fasoli, M.; Martini, M.; Moretti, F.; Vedda, A.; Loi, G.; Mones, E. Phosphorescence of SiO2 optical fibres doped with Ce3+ ions. Phys. Stat. Sol. 2007, 4, 1024–1027. [Google Scholar]
- Kerboub, N.; Di Francesca, D.; Girard, S.; Morana, A.; El Hamzaoui, H.; Ouerdane, Y.; Bouwmans, G.; Habert, R.; Boukenter, A.; Capoen, B.; et al. Temperature Effect on the Radioluminescence of Cu, Ce and CuCe Doped Silica-based Fiber Materials. IEEE Trans. Nucl. Sci. 2021, 68, 1782–1787. [Google Scholar] [CrossRef]
- Cova, F.; Moretti, F.; Dujardin, C.; Chiodini, N.; Vedda, A. Trapping Mechanisms and Delayed Recombination Processes in Scintillating Ce-Doped Sol–Gel Silica Fibers. J. Phys. Chem. C 2021, 125, 11489–11498. [Google Scholar] [CrossRef]
- Zghari, I.; El Hamzaoui, H.; Capoen, B.; Cassez, A.; Bouwmans, G.; Hay, L.; Ouerdane, Y.; Morana, A.; Girard, S.; Boukenter, A.; et al. Radioluminescence Processes in Cerium-doped Silica Glasses. IEEE Trans. Nucl. Sci. 2023; in press. [Google Scholar] [CrossRef]
- Meyer, A.; Lambert, D.; Morana, A.; Paillet, P.; Boukenter, A.; Girard, S. Simulation and Optimization of Optical Fiber Irradiation with X-rays at Different Energies. Radiation 2023, 3, 58–74. [Google Scholar] [CrossRef]
- Vedda, A.; Chiodini, N.; Di Martino, D.; Fasoli, M.; Griguta, L.; Moretti, F.; Rosetta, E. Thermally stimulated luminescence of Ce and Tb doped SiO2 sol–gel glasses. J. Non-Cryst. Solids 2005, 351, 3699–3703. [Google Scholar] [CrossRef]
- Benabdesselam, M.; Mady, F.; Guttilla, A.; Blanc, W.; El Hamzaoui, H.; Bouazaoui, M.; Al Helou, N.; Bahout, J.; Bouwmans, G.; Capoen, B. Investigation of Thermoluminescence Properties of Potential Fibered-OSL Dosimeter Materials. IEEE Trans. Nucl. Sci. 2020, 67, 1663–1668. [Google Scholar] [CrossRef]
- Mady, F.; Gutilla, A.; Benabdesselam, M.; Wilfried, G.; Girard, S.; Ouerdane, Y.; Boukenter, A.; Desjonquères, H.; Louvet, C.M. Optical fibers under irradiation: Quantitative assessment of the energy distribution of radiation-induced trapped states. In Fiber Lasers and Glass Photonics: Materials through Applications II; SPIE: Washington, DC, USA, 2020; Volume 11357, No. 113571B. [Google Scholar]


| Parameter | Status | Description |
|---|---|---|
| M | Fixed | Concentration of radiative hole center |
| Free | Density of holes in RC and VB, respectively | |
| Nk | Free | Concentrations of electrons traps (k is the number of electron traps) |
| ni, nc | Free | Density of electrons in Ni and CB, respectively |
| X | Fixed | Rate of electron-hole pairs production |
| Aei, Ar | Free | Electron transition coefficients to traps and RC, respectively |
| Ah | Free | Hole transition coefficient to RC |
| Ei | Fixed | Trapping level |
| si, kB | Fixed | Frequency factors and Boltzmann constant, respectively |
| Measurement Temperature | Parameter | Value |
|---|---|---|
| E1, E2, E3, E4, E5, E6, E7, E8, E9, E10, E11, E12, E13, E14, E15 | 0.39, 0.43, 0.46, 0.50, 0.55, 0.60, 0.75, 0.85, 0.92, 0.96, 1.01, 1.07, 1.13, 1.18, 1.45 eV | |
| N1, N2, N3, N4, N5, N6, N7, N8, N9, N10, N11, N12, N13, N14, N15 | 2 × 10¹⁹, 1 × 10¹⁹, 1 × 10¹⁹, 1 × 10¹⁹, 9 × 10¹⁸, 7 × 10¹⁸, 2 × 10¹⁹, 1 × 10¹⁹, 2 × 10¹⁸, 3 × 10¹⁸, 3 × 10¹⁸, 3 × 10¹⁸, 3 × 10¹⁸, 3 × 10¹⁸, 5 × 1019 cm−3 | |
| At all temperature | s1, s2, s3, s4
, s5, s6, s7, s8 , s9, s10, s11, s12 , s13, s14, s15 | 1.16 × 10¹⁰, 3.51 × 10¹⁰, 5.2 × 10¹⁰, 6.59 × 10¹⁰, 7.2 × 10¹⁰, 1.76 × 10¹¹, 3.94 × 10¹², 7.54 × 10¹², 8.94 × 10¹², 9.88 × 10¹², 1.51 × 10¹³, 2.11 × 10¹³, 3.45 × 10¹³, 4.03 × 10¹³, 6.66 × 10¹³ s−1 |
| ~10−3 | ||
| X | 50 mGy(SiO2)/s→ 4.3 × 1013 cm−3 .s−1 100 mGy(SiO2)/s→ 8.6 × 1013 cm−3 .s−1 150 mGy(SiO2)/s→ 1.3 × 1014 cm−3 .s−1 | |
| M | 2 × 1018 cm−3 | |
| ti (Irradiation time) | 120 s | |
| tf (Afterglow time) | 60 s |
Disclaimer/Publisher’s Note: The statements, opinions and data contained in all publications are solely those of the individual author(s) and contributor(s) and not of MDPI and/or the editor(s). MDPI and/or the editor(s) disclaim responsibility for any injury to people or property resulting from any ideas, methods, instructions or products referred to in the content. |
© 2023 by the authors. Licensee MDPI, Basel, Switzerland. This article is an open access article distributed under the terms and conditions of the Creative Commons Attribution (CC BY) license (https://creativecommons.org/licenses/by/4.0/).
Share and Cite
Zghari, I.; El Hamzaoui, H.; Capoen, B.; Mady, F.; Benabdesselam, M.; Bouwmans, G.; Labat, D.; Ouerdane, Y.; Morana, A.; Girard, S.; et al. Effects of Measurement Temperature on Radioluminescence Processes in Cerium-Activated Silica Glasses for Dosimetry Applications. Sensors 2023, 23, 4785. https://doi.org/10.3390/s23104785
Zghari I, El Hamzaoui H, Capoen B, Mady F, Benabdesselam M, Bouwmans G, Labat D, Ouerdane Y, Morana A, Girard S, et al. Effects of Measurement Temperature on Radioluminescence Processes in Cerium-Activated Silica Glasses for Dosimetry Applications. Sensors. 2023; 23(10):4785. https://doi.org/10.3390/s23104785
Chicago/Turabian StyleZghari, Ismail, Hicham El Hamzaoui, Bruno Capoen, Franck Mady, Mourad Benabdesselam, Géraud Bouwmans, Damien Labat, Youcef Ouerdane, Adriana Morana, Sylvain Girard, and et al. 2023. "Effects of Measurement Temperature on Radioluminescence Processes in Cerium-Activated Silica Glasses for Dosimetry Applications" Sensors 23, no. 10: 4785. https://doi.org/10.3390/s23104785