

Review on the Evaluation and Development of Artificial Intelligence for COVID-19 Containment
 ,
,  and
and
Abstract
: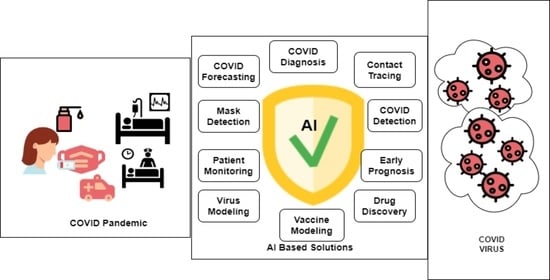
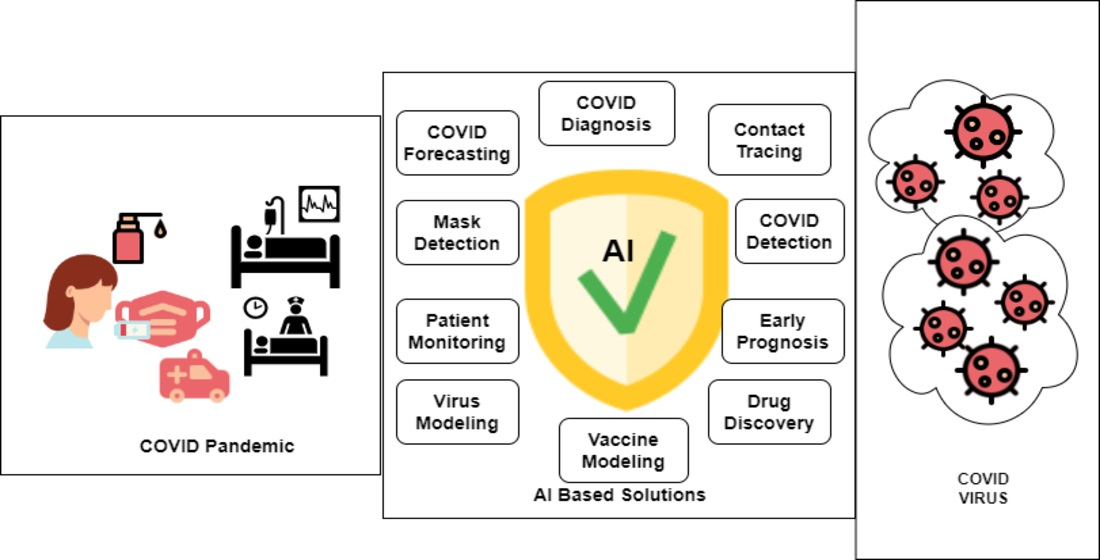
1. Introduction
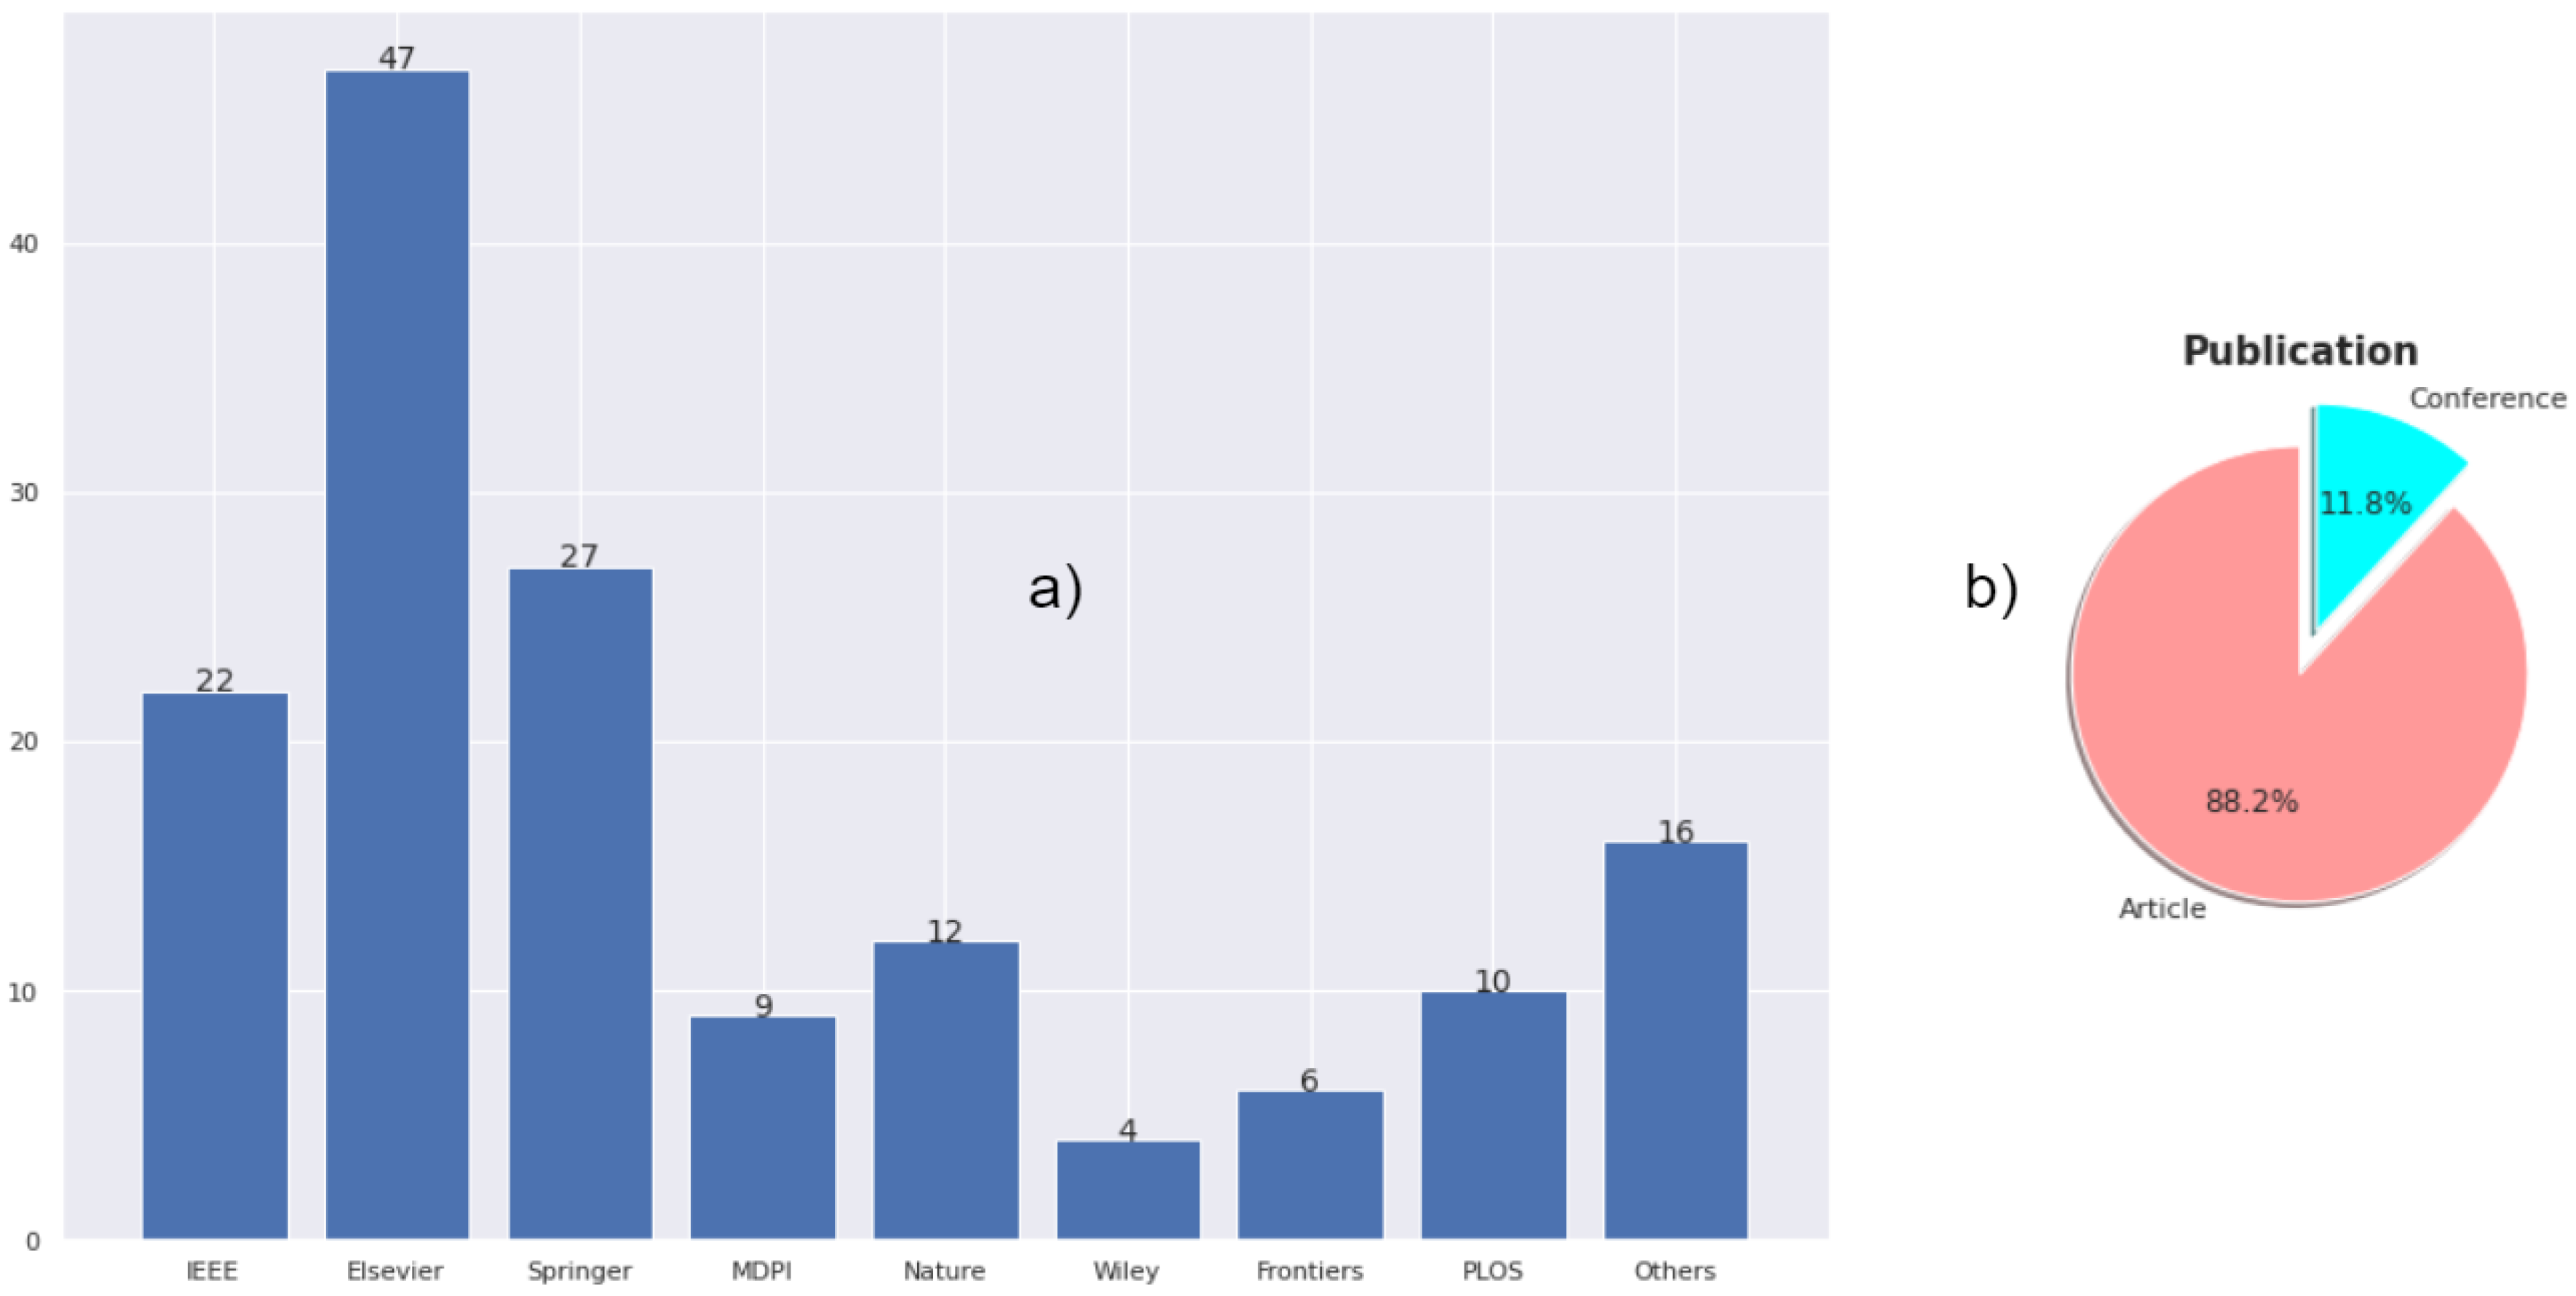
2. Methodology

Eligibility Criteria
- The research must have discussed AI-based devices or architectures, or systems for forecasting or detecting or monitoring or managing health care conditions for COVID patients.
- A clear methodology must have been coined in terms of devices used or architectures discussed in the studies.
- Unique, relevant, important, significant, and informative works were included.
- Relevant papers with historical insights were included in the discussion to find the current state of research, past historical evidence, and future policy implications for future endemics.
- Duplicate research works were excluded.
- Research work without IRB approval where a human subject was directly involved in the study were discarded.
- Media reports, university reports, and reports with ambiguity were excluded due to lack of clear methodology.
- Journal ranking (), impact factor, JCR, and conference ranking by ERA and Quails () were prioritized. Papers belonging to predatory journals were usually discarded to the best of our knowledge.
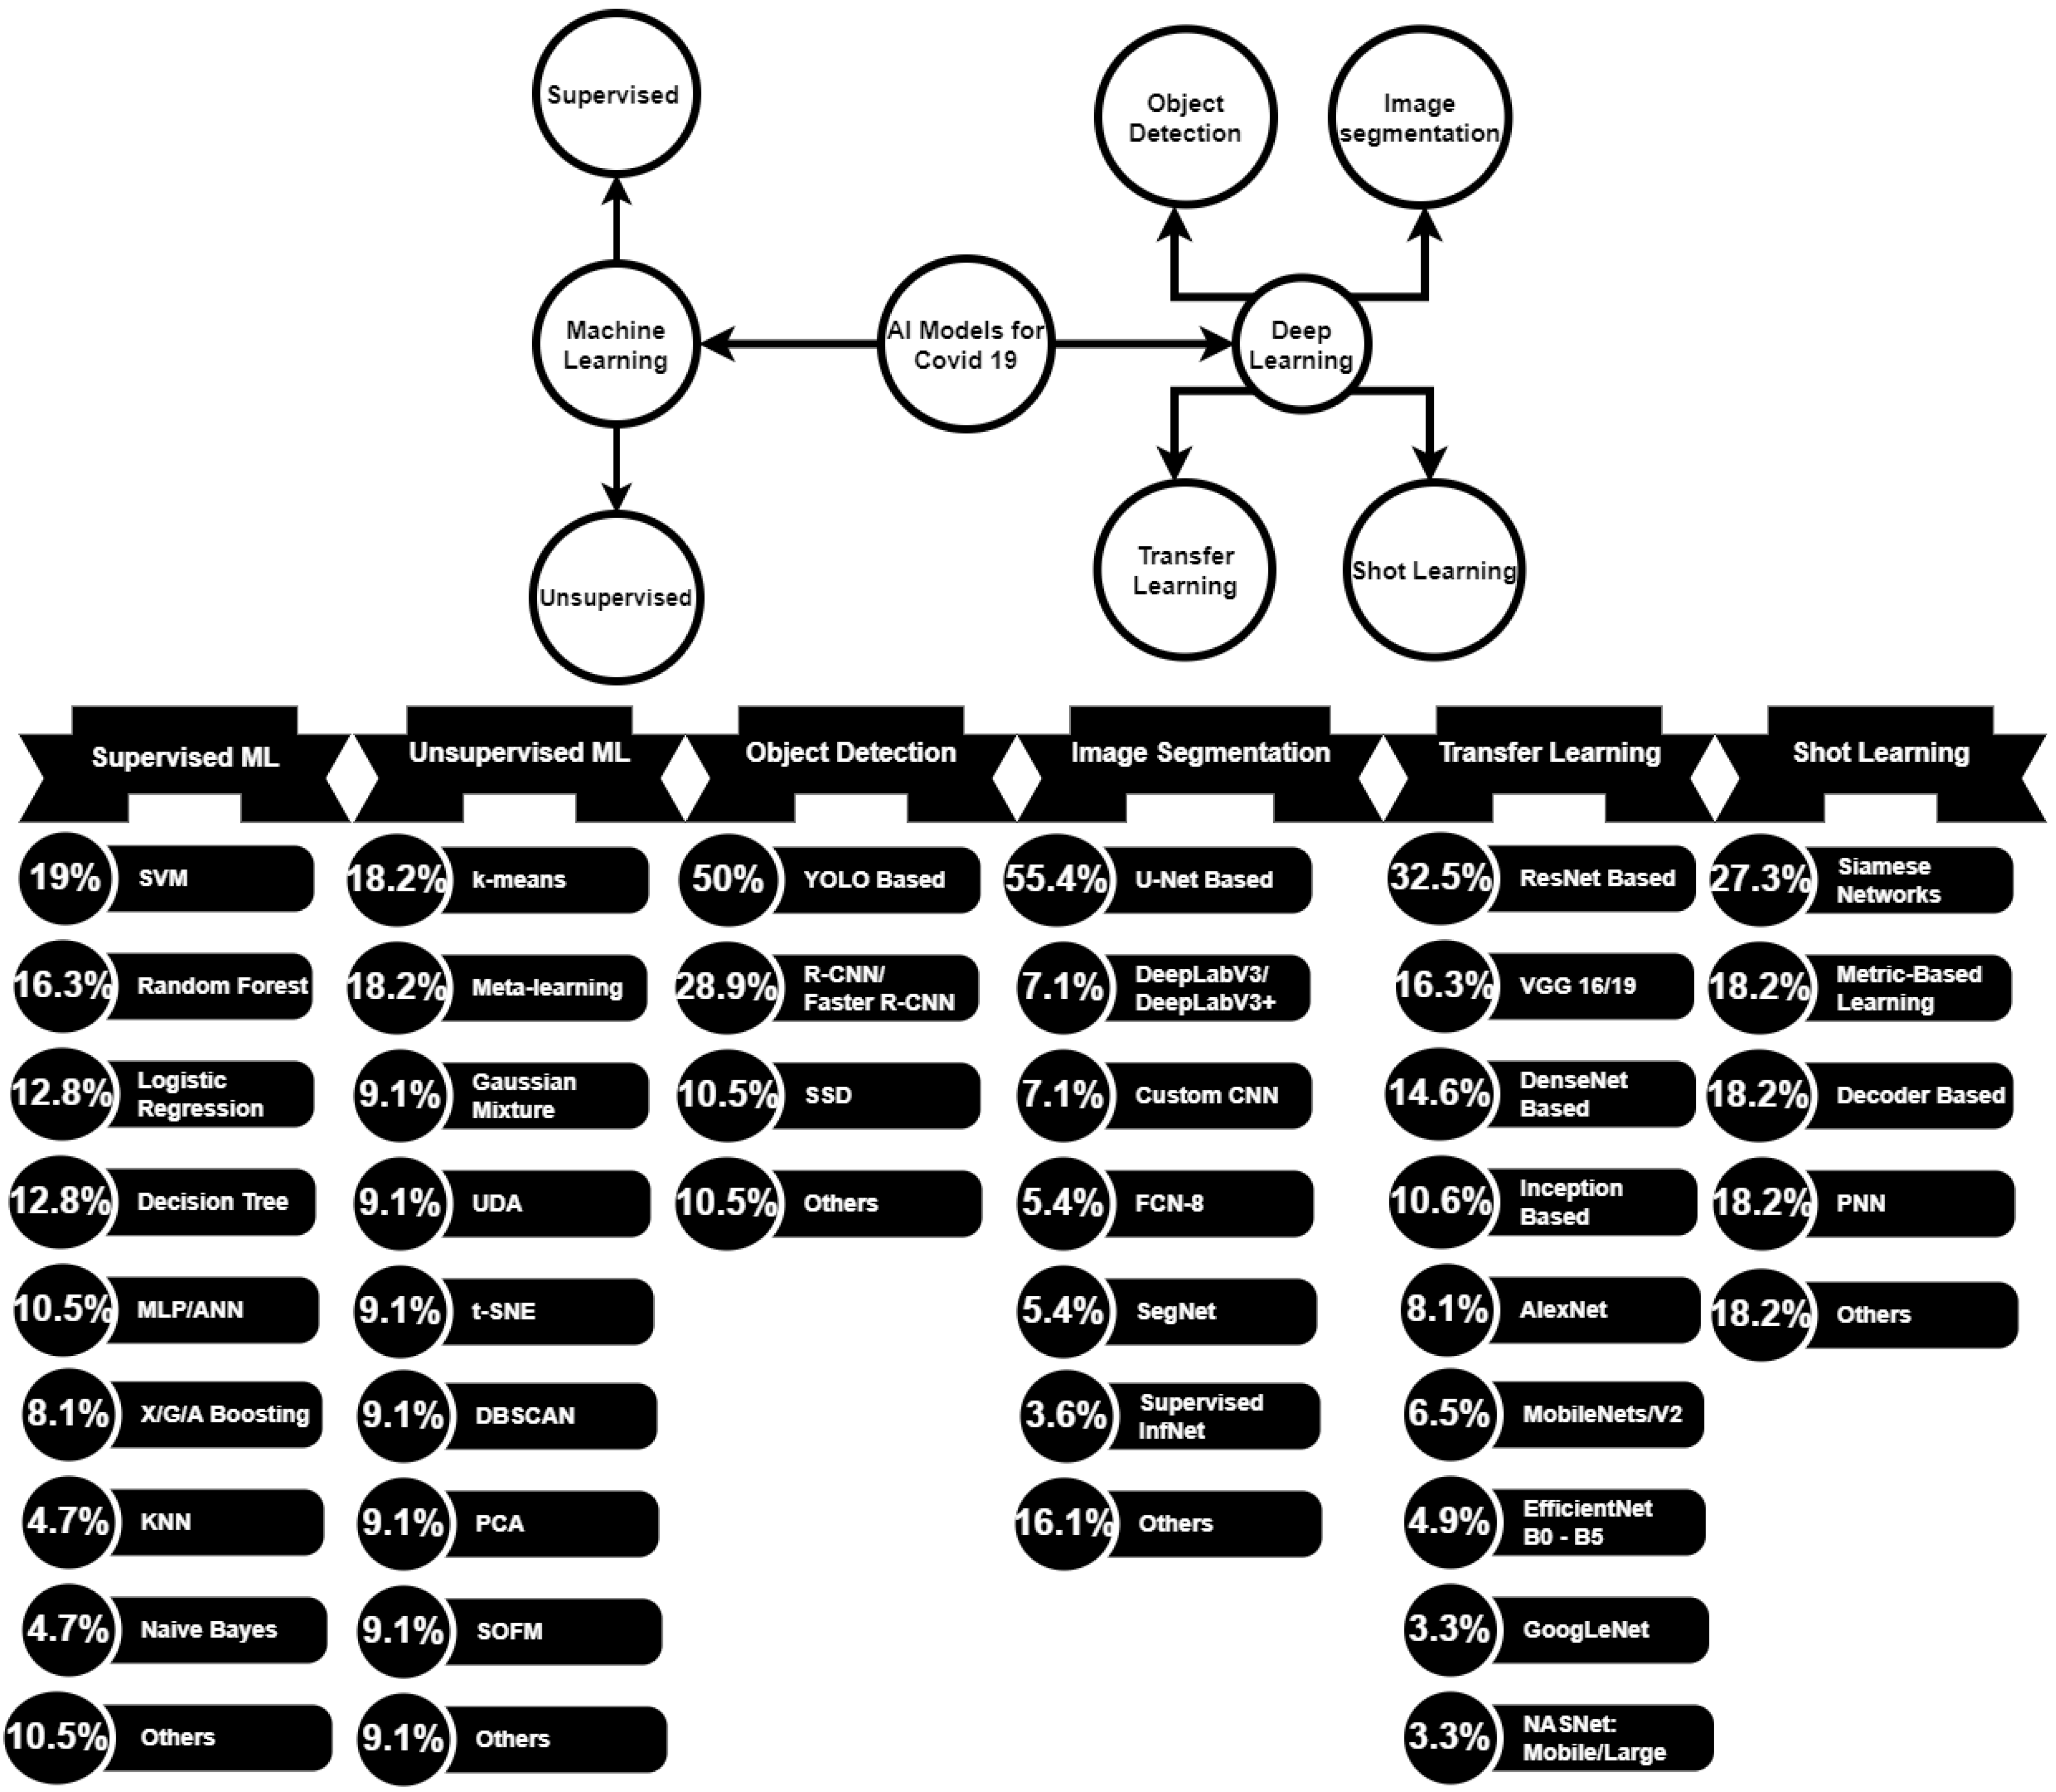
3. Machine Learning
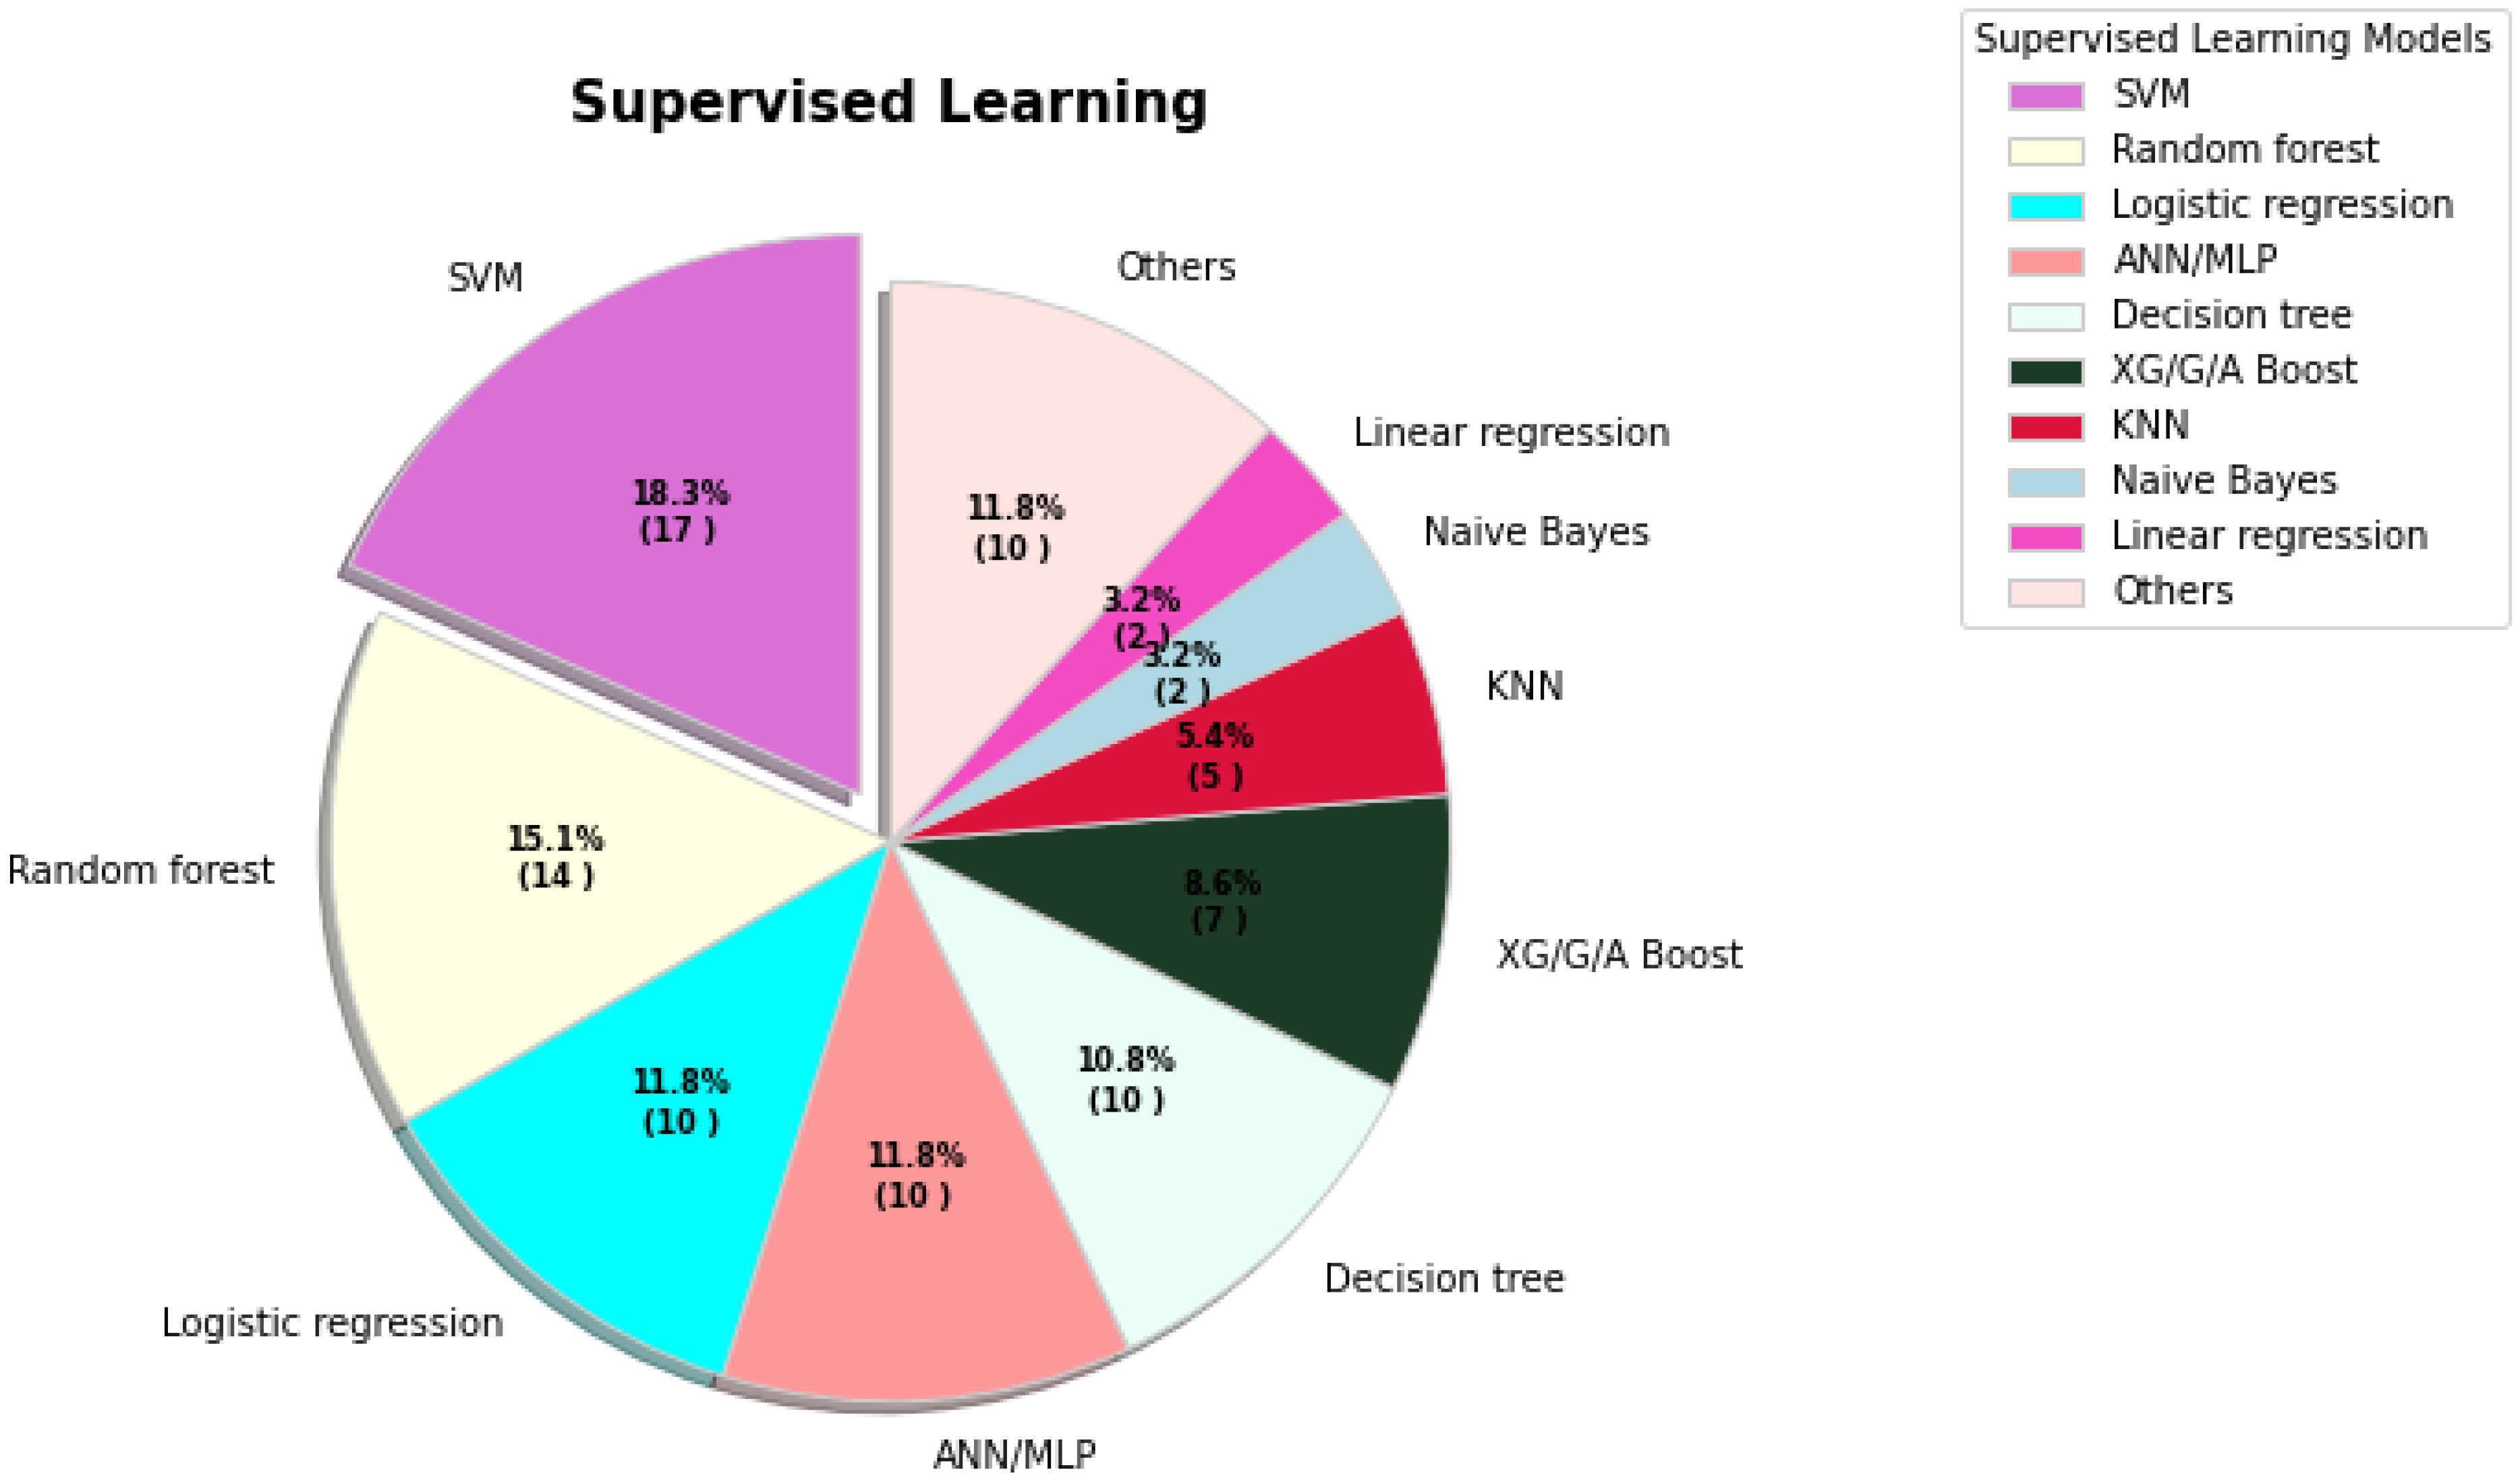
3.1. Supervised Learning

| Ref. | Problem Definition | ML Models | Sample | Performance |
|---|---|---|---|---|
| [40] | Prediction of COVID-19 infection | Logistic regresseaturion, Decision tree, SVM, naive Bayes, ANN | RT-PCR test 263,007 records, 41 features | Accuracy: 94.41%, 94.99%, 92.4%, 94.36%, 89.2% |
| [41] | The number of the positive cases prediction method | Nonlinear regression, decision tree, random forest | Six features (deaths, recovered, confirmed, amount of testing, lockdown, lockdown features) | MAPE: 0.24%, 0.18%, 0.02%. |
| [42] | Prediction model for mortality in COVID-19 infection | SVM | 398 patients (43 expired and 355 non-expired) | Sensitivity: 91%, specificity: 91% |
| [43] | COVID-19 computed tomography scan dataset for ML | – | 169 patients positive, 76 normal patients, and 60 patients with CAP | – |
| [44] | Risk factors analysis of COVID-19 patients and ARDS or no-ARDS prediction method | Decision tree, logistic regression, random forest, SVM, DNN | 659 COVID-19 patients and clinical features | Accuracy: 97%, 93%, 92%, 83%, 90% |
| [45] | Patient intensive care and mechanical ventilation prediction method | Random Forest | Socio-demographic, clinical data 212 patients (123 males, 89 females) | AUC: 80%, AUC: 82% |
| [46] | Prediction of COVID-19 diagnosis based on symptoms | Gradient-boosting | Test records of 5183 individual (cough, fever, sore throat, shortness of breath, etc) | Sensitivity: 87.30%, specificity: 71.98% |
| [20] | Early risk identification of (SARS-CoV-2) patients | Logistic regression, decision tree, random forest, KNN, SVM, AdaBoost, MLP | Total 198 patients (135 non-severe, 63 severe COVID-19) | SVM: median 96%. Other model performance result unclear in the paper |
| [47] | Chest X-ray images based COVID-19 infection detection | KNN, decision tree, random forest, L-SVC, SVC | 371 positive, 1341 normal chest X-ray images | Precision: 98.96%, 94.89%, 97.58%, 99.3%, 99.66% |
| [48] | SARS-CoV-2 pre-miRNAs detection | KNN, RUNN-COV, logistic regression, random forest, SVM | positive 569 and negative 999,888 pre-miRNA samples | F1 score: 89.86%, 98.26%, 89.47%, 91.55%, 89.83% |

3.2. Unsupervised Learning

4. Deep Learning
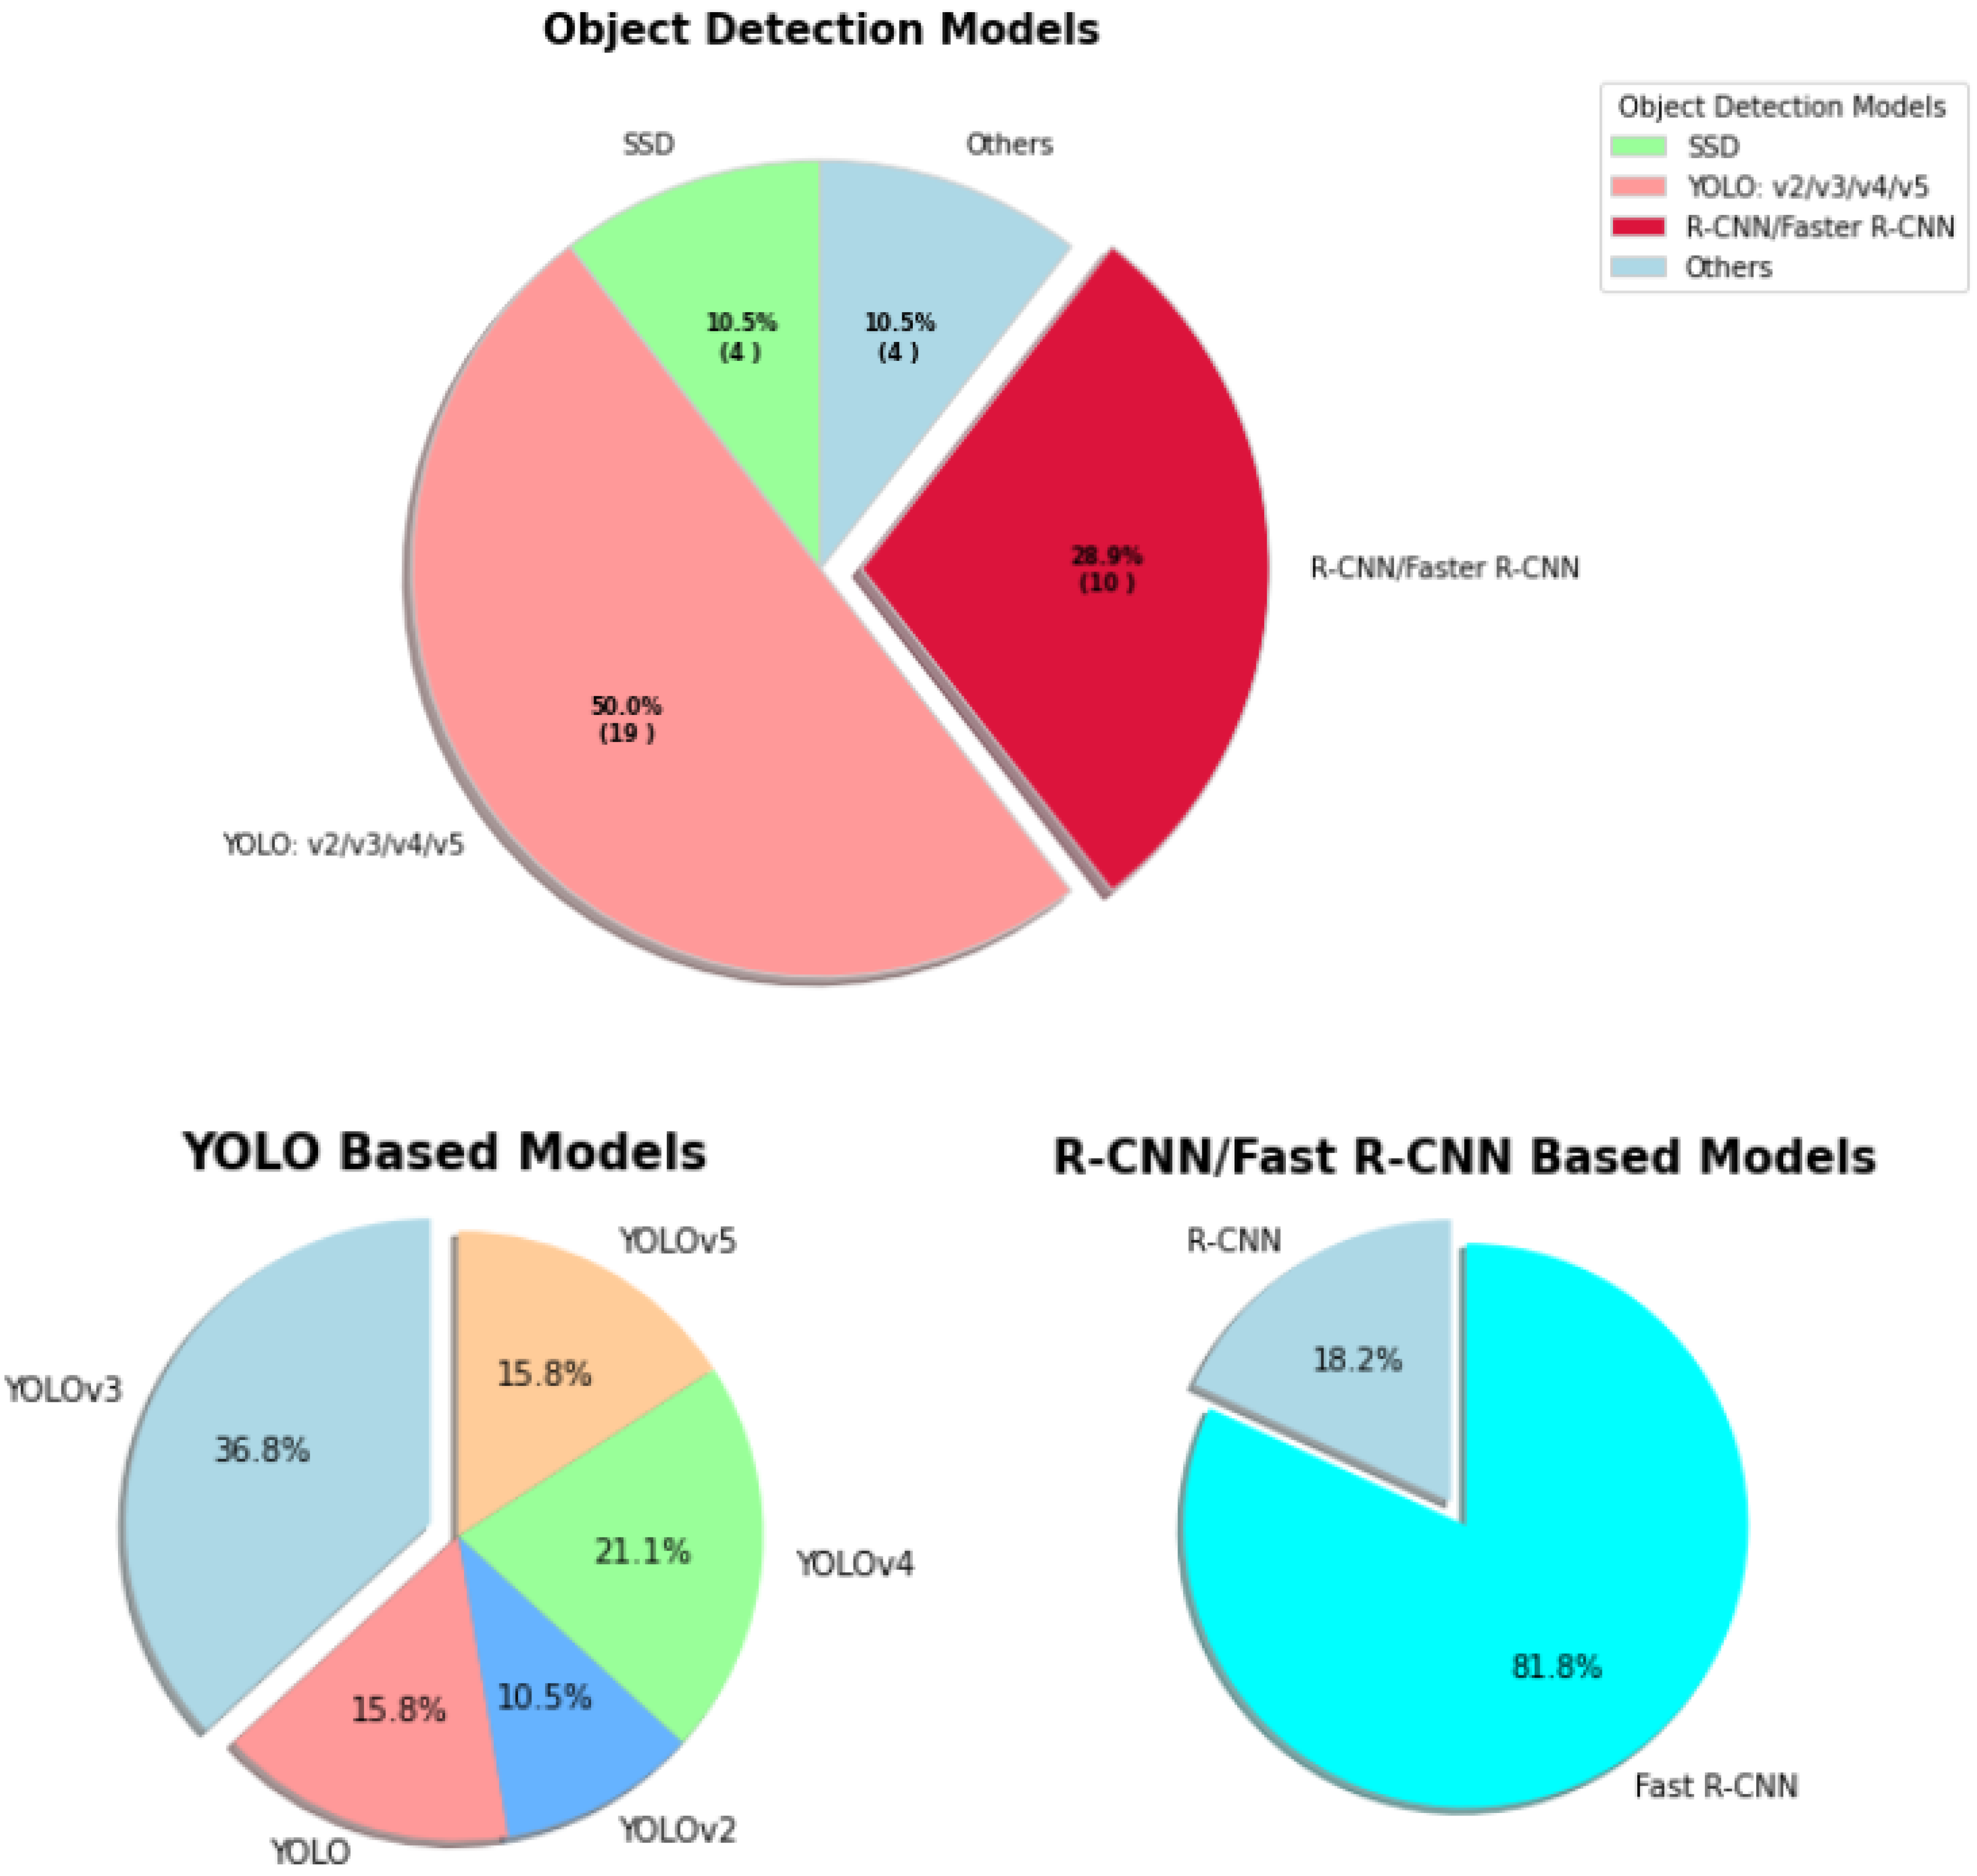
4.1. Object Detection
| Ref. | Problem Definition | Architecture | Sample | Performance |
|---|---|---|---|---|
| [77] | COVID-19 detection through the chest X-ray images | DarkNet-53 + YOLO-v3 | 4 classes (194 COVID, 1772 bacterial pneumonia, 583 normal, 493 viral pneumonia cases) 2 classes (2848 non-COVID, 194 positives, samples) Dataset augmentation applied | Accuracy (97.11 ± 2.71%) multi-class, 99.81% binary class |
| [78] | Social distancing monitoring system using mass video surveillance | Faster R-CNN, YOLO, SSD | PASCAL-VOC, MS-COCO, vision-based social media event analysis | mAP 86.8%, 84.7%, 44.5% |
| [79] | Personal protective equipment detection | YOLOv4 | 5327 images (face mask and shield, no face mask, hand gloves) | Precision 78% |
| [80] | Detecting COVID-19 related CT abnormalities | RetinaNet | DeepLesion, 32,120 axial CT slices (liver, lung, bone, abdomen, mediastinum, kidney, pelvis, and soft tissue) | mAP 91.28% (internal testing), 87.83% (External-Set-1), 71.48% (External-Set-2), 83.04% (External-Set-3) |
| [81] | Social distancing detector through thermal images or video streams | YOLOv2, Fast R-CNN, R-CNN | 1575 (Various scenarios while walking, different body positions, running, sneaking, and and different motion speeds) | Accuracy 95.6%, 91.2%, 88.5%, (Dataset II 94.5%, 90.5%, 86.5%) |
| [82] | Detection of masks and human eye areas. Measurement of body temperature through thermal cameras | YOLOv5, Resnet-50 | Dataset Celeba, Coco, Helen, IMM, Wider, Group Images, IIITD and beyond visible spectrum disguise, UL-FMTV, Terravic Facial Infrared, IRIS | Precision 96.65%, 78.7% |
| [83] | The indoor distance measurement method through the closed-circuit television | DeepSORT, YOLOv3, YOLOv4 | MS COCO dataset | Accuracy (4FPS10 62.5%, 4FPS24 93.7 4FPS35 78.9% 4FPS50 83.3%) mAP 30.4%, 42.1% |
| [84] | Data labeling and annotation framework | mask R-CNN | 750 CT images (COVID-19 positive, COVID-19 negative) | Accuracy (train, validation, and test 99%, 93.1%, and 0.8%) |

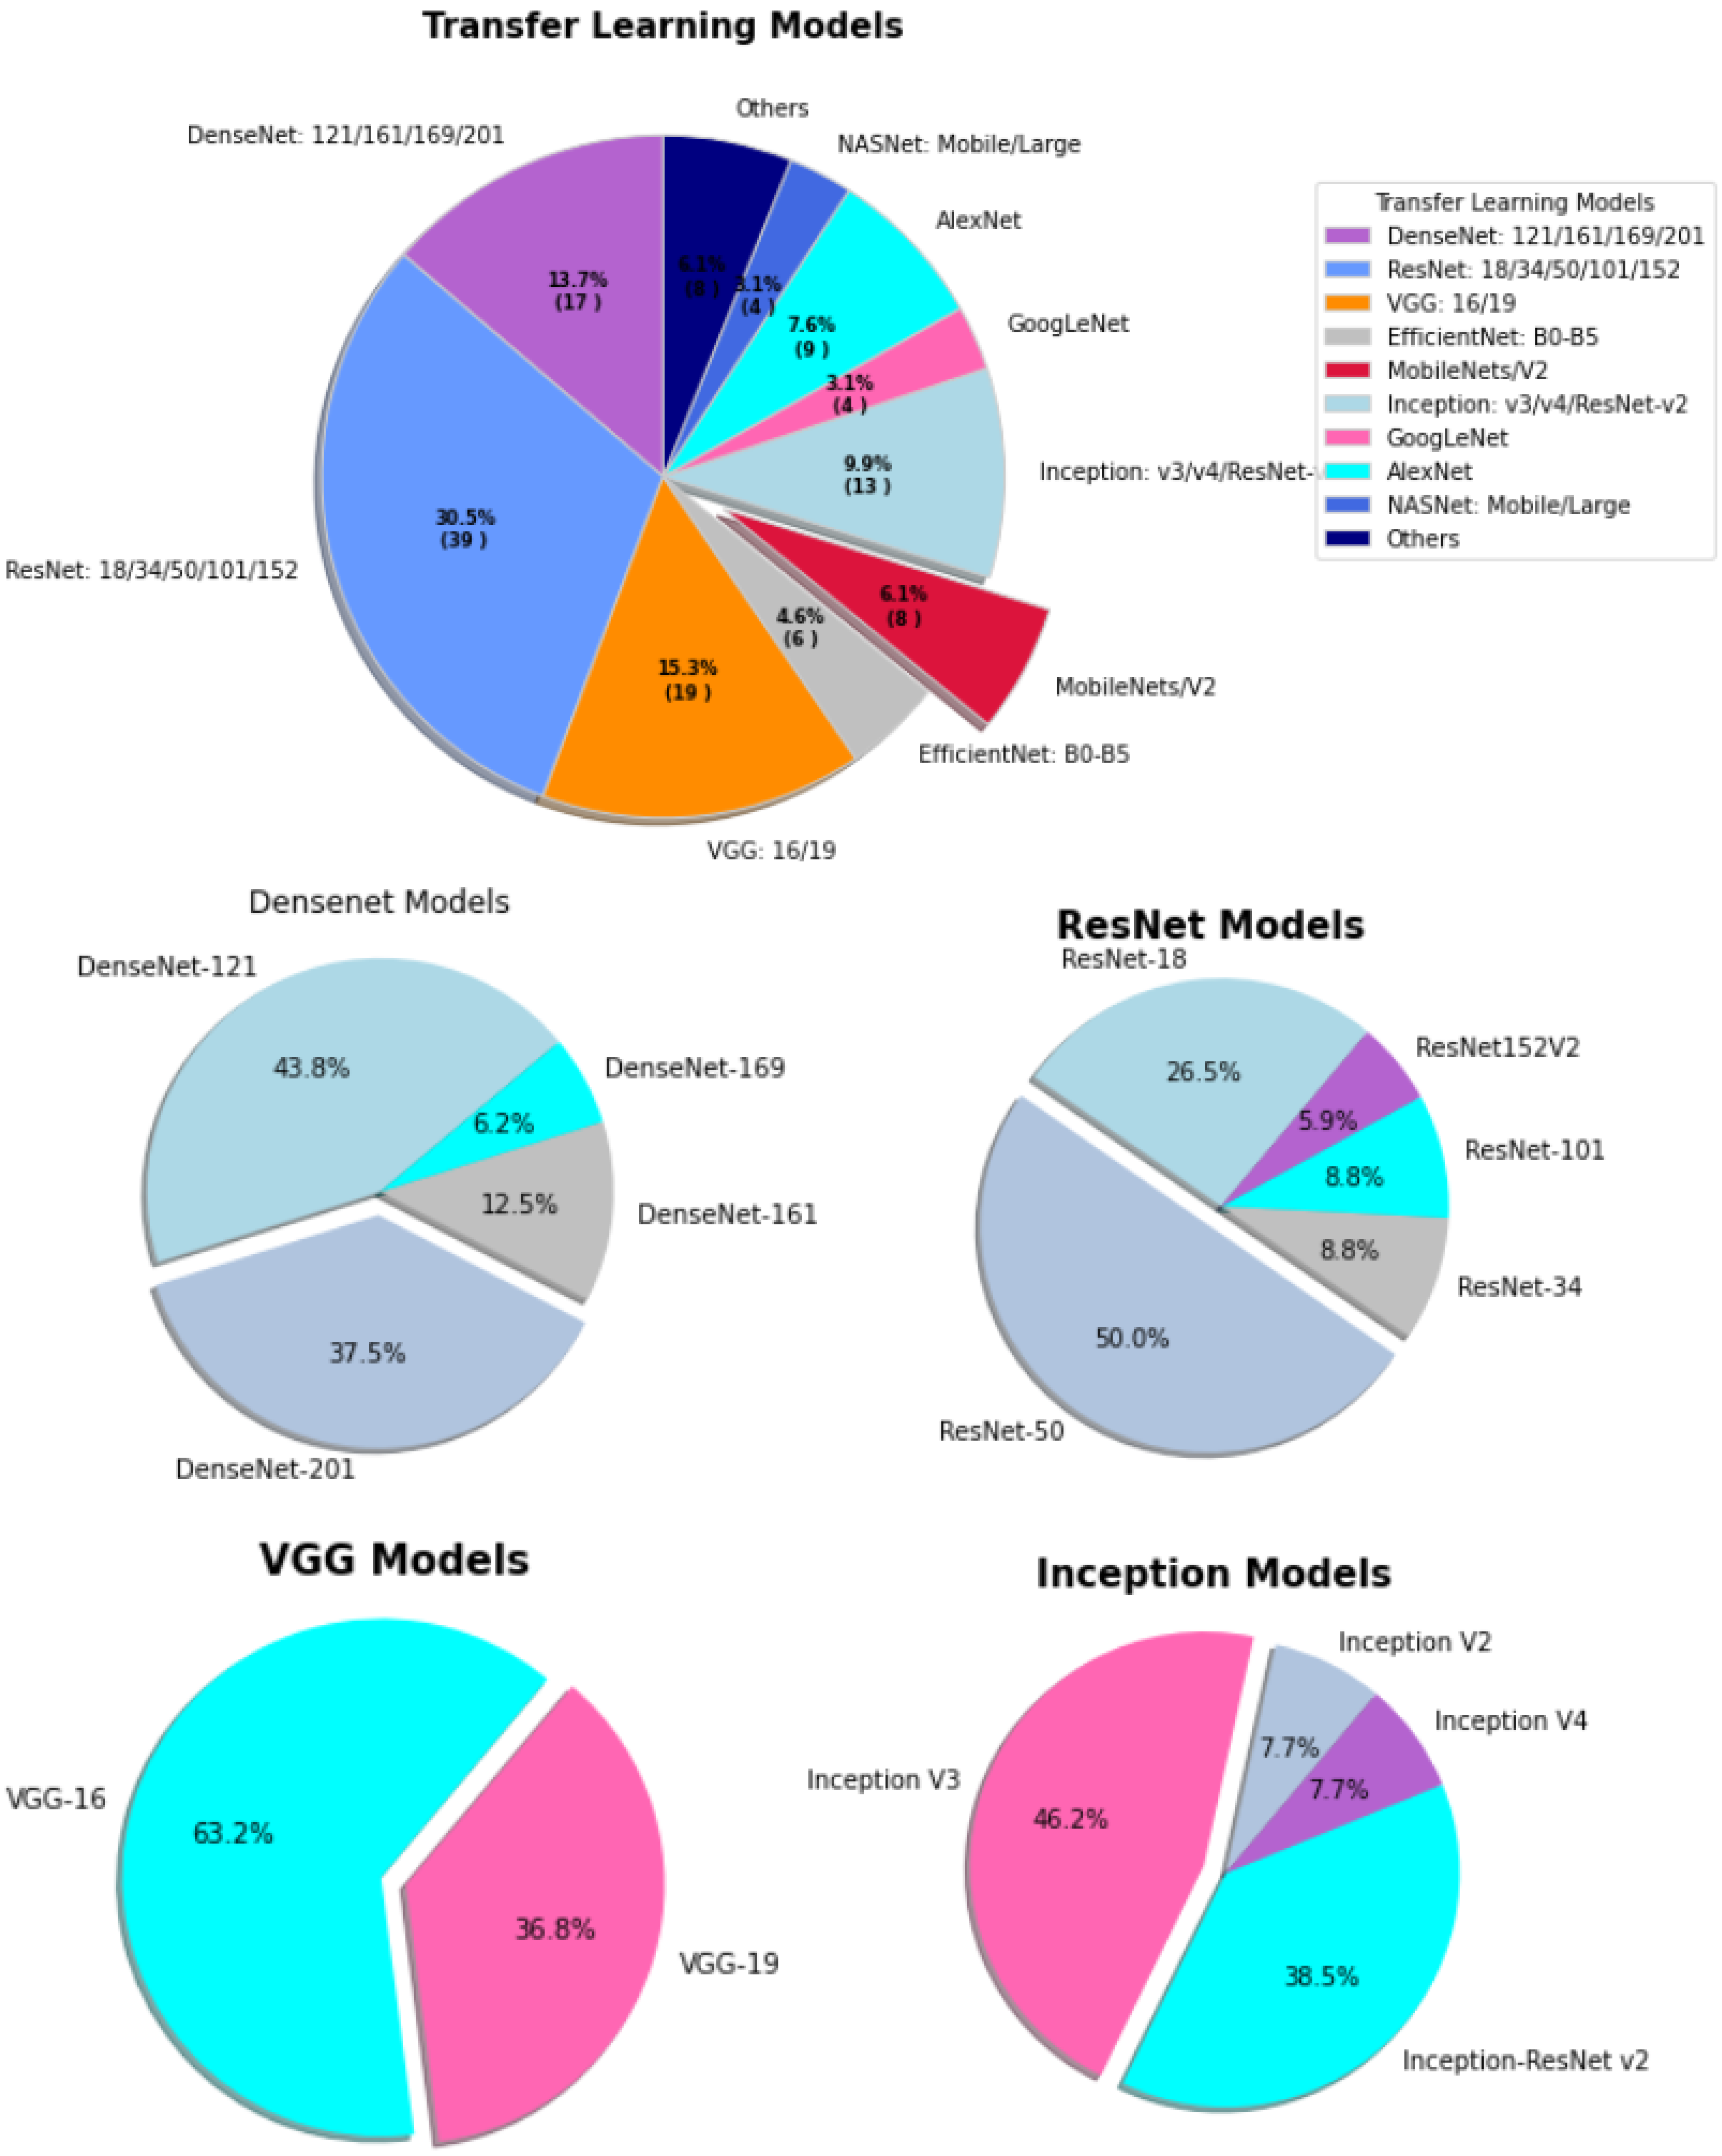
4.2. Transfer Learning
| Ref. | Problem Definition | Architecture | Sample | Performance |
|---|---|---|---|---|
| [97] | COVID-19 classification | DensetNet201, ResNet101, CCSHNet | Category (COVID-19, CAP, SPT, HC) total 1164 CCT images | F1 score 95.53%, 96.74%, 97.04% |
| [98] | The deep transfer learning technique has used to classify COVID-19 infected patients | (CNN+ ResNet-50) | 413 COVID-19 (+), 439 normal or pneumonia | Accuracy 93.01%, sensitivity 91.45% |
| [99] | An automated COVID-19 screening model | CNN, VGG-16 ResNet-50 | 219 COVID-19 positive, 1345 pneumonia infection and 1341 no infection | Accuracy 89.16%, 96.01%, 93.29% |
| [100] | Hybrid deep transfer learning-based COVID-19 positive cases detection using chest CT X-ray images | AlexNet, BiLSTM | COVID-19 219, Viral Pneumonia 1345, Normal 1341 | Accuracy 98.14%, 98.70% |
| [101] | Transfer knowledge-based chest X-ray images classification. Random oversampling was applied to overcome the class imbalance problem | ResNet, Inception v2, (Inception + ResNet-v2), DenseNet169, NASNetLarge | COVID-19 108, other pneumonia 515, normal 533, tuberculosis 58 | F1 sore 56%, 74%, 96%, 95%, 98% |
| [102] | GAN with deep transfer learning technique for coronavirus detection in chest X-ray images | Alexnet, Googlenet, Restnet18 | Total 307 X-ray images (COVID-19, normal, pneumonia bacterial, and pneumonia virus) | Binary classes accuracy (99.6%, 99.9%, 99.8%) |
| [103] | Two-step transfer learning for COVID-19 detection | ResNet34 | COVID-19 189, pneumonia 252, Normal 235 images | Accuracy 91.08% |
| [104] | Deep transfer learning-based COVID-19 detection using X-ray images | DenseNet201, Resnet50V2 and Inceptionv3 | COVID (+) 538, COVID (−) 468 | Accuracy 91.11%, 91.11%, 90.43% |
| [105] | COVID-19 screening in chest X-rays images | EfficientNet B0, EfficientNet B1, EfficientNet B2, EfficientNet B3, EfficientNet B4, EfficientNet B5, MobileNet, MobileNet V2, RESNET 50, VGG-16, VGG-19 | 13,800 X-ray images, Healthy, non-COVID-19 pneumonia, COVID-19 patients | Accuracy 90.0%, 91.8%, 90.0%, 93.9%, 93.0%, 92.2%, 90.4%, 90.0%, 83.5%, 77.0%, 75.3% |
| [106] | Multiple Kernels-Extreme Learning Machine-based DNN system to detect COVID-19 disease from CT scan images | AlexNet, GoogleNet, VGG16, MobileNetv2, ResNet18, Inceptionv3 (DenseNet201+ MK-ELM) | 349 images of COVID-19 and 397 images of no-findings (data augmentation was applied to expand the dataset) | Accuracy 90.34%, 92.86%, 92.65%, 93.19%, 92.22%, 92.54%, 98.36% |

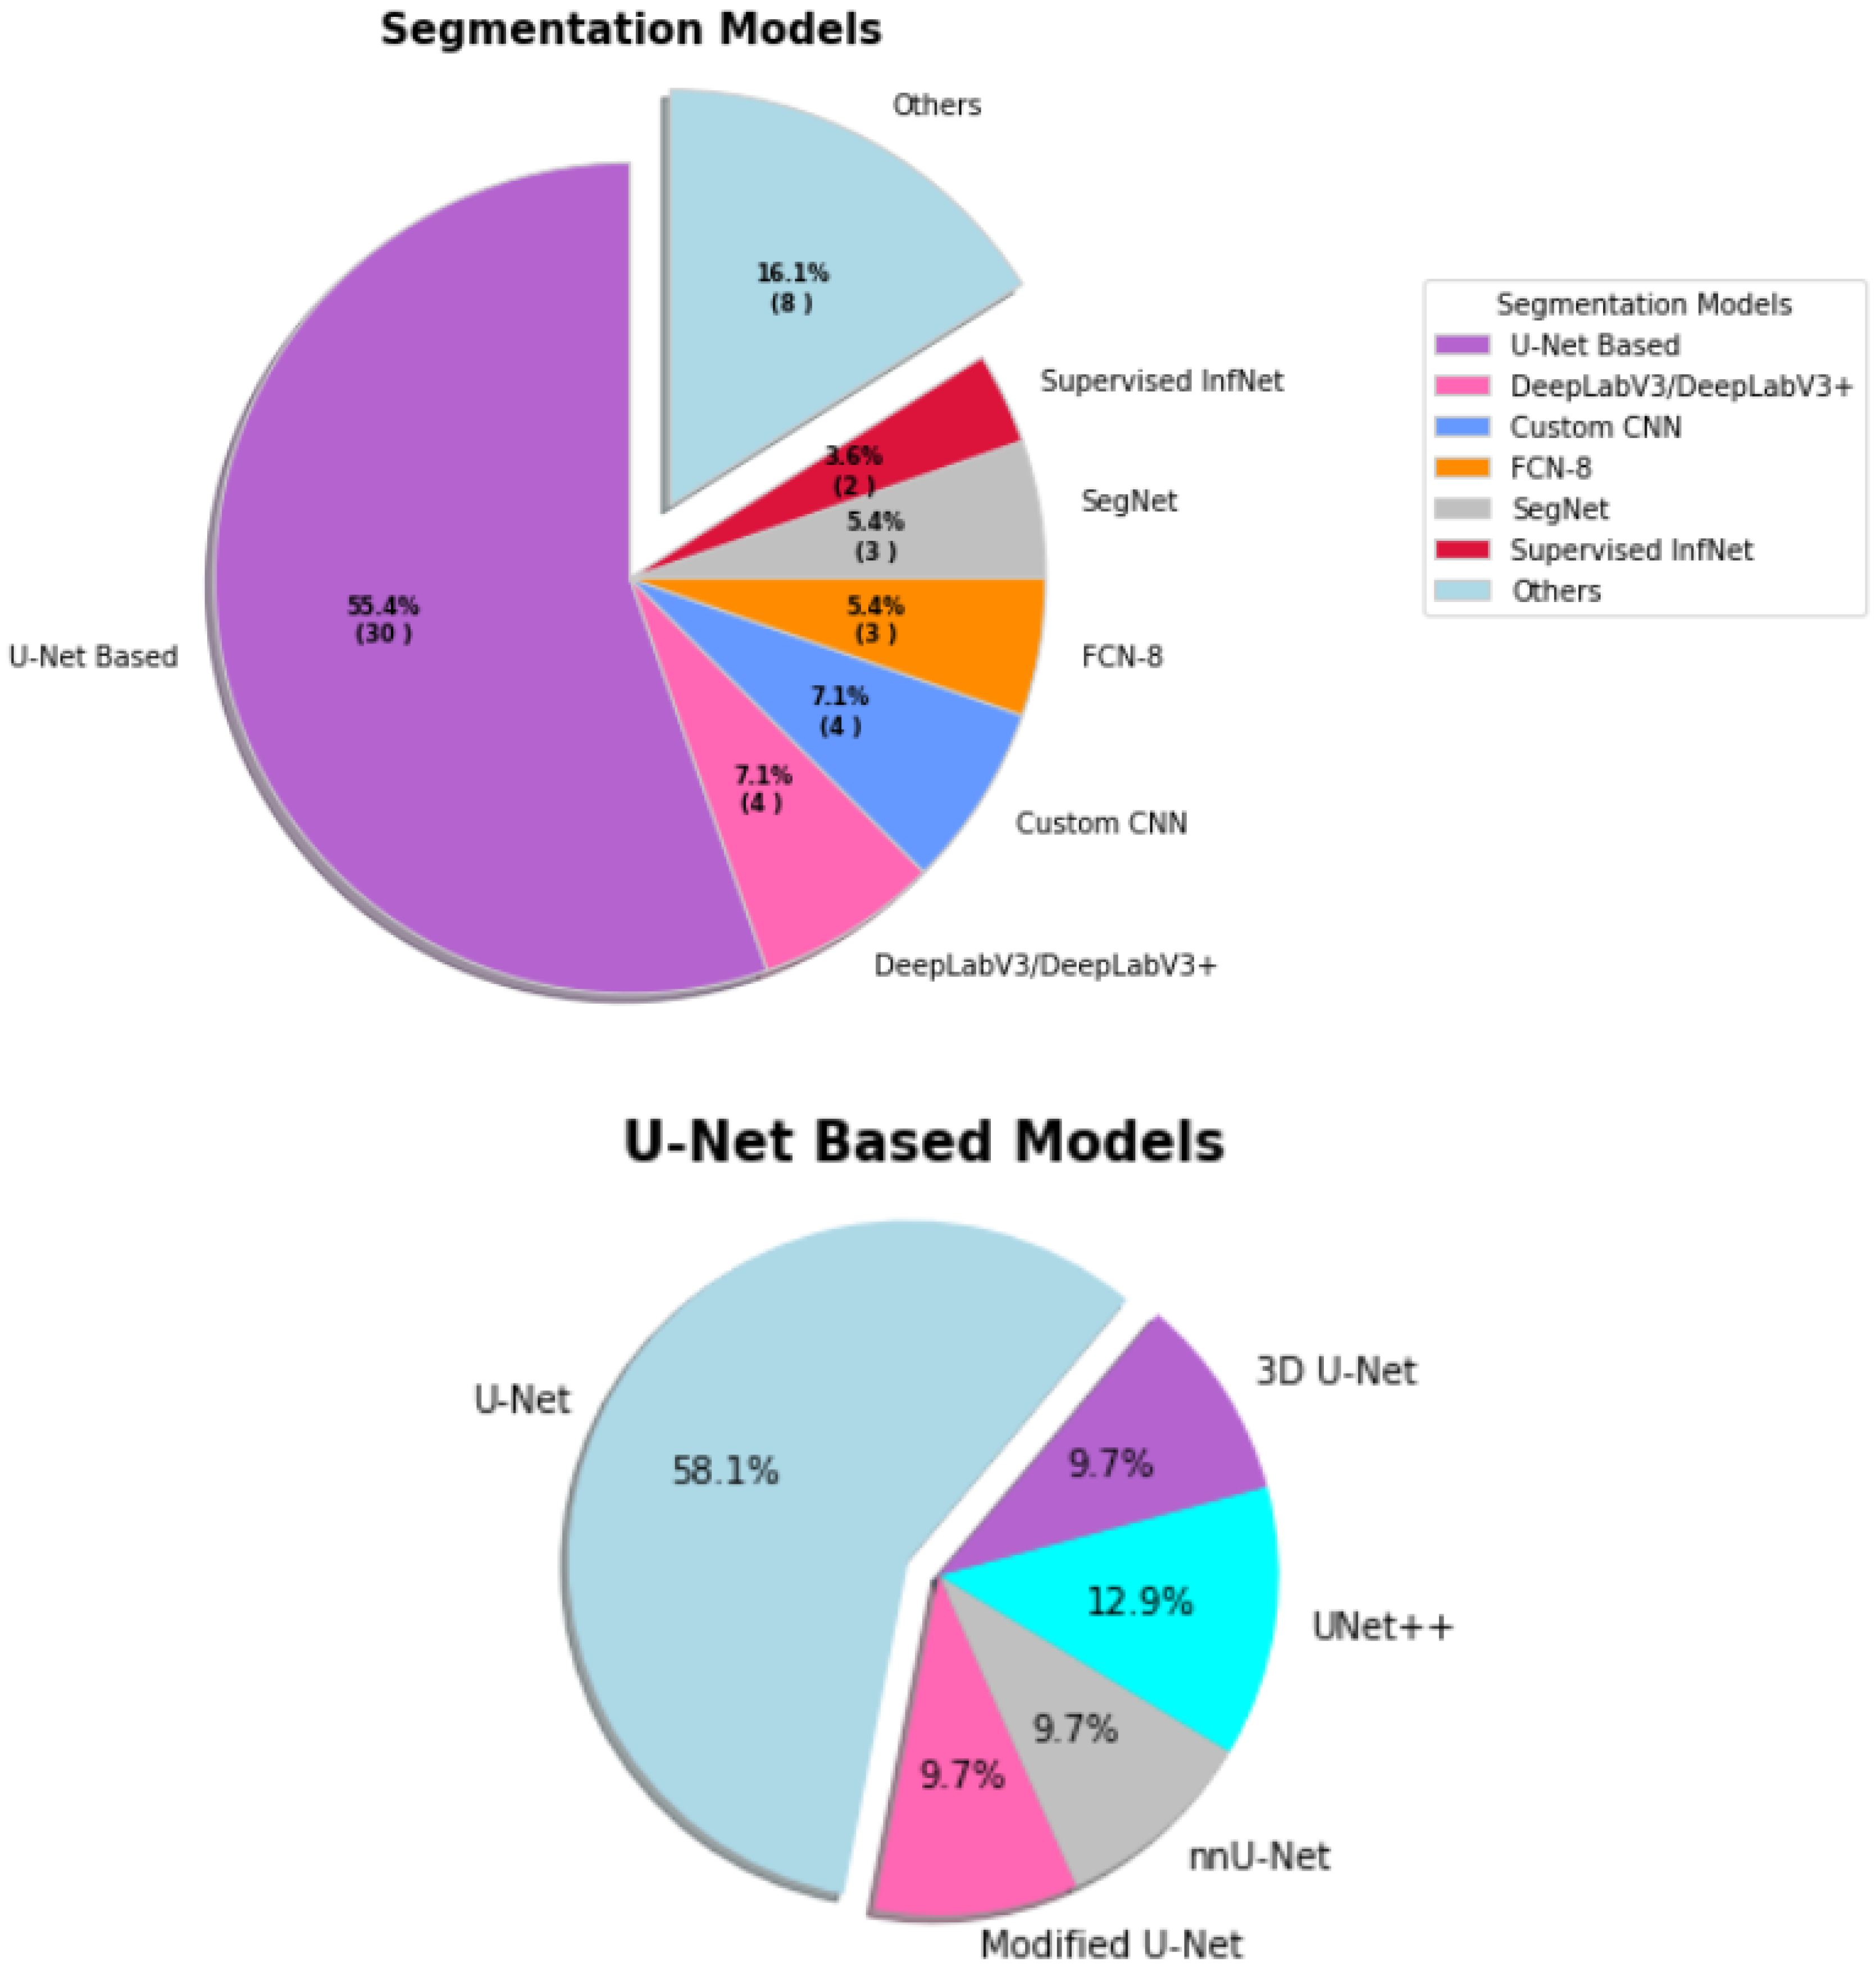
4.3. Image Segmentation
| Ref. | Problem Definition | Architecture | Sample | Performance |
|---|---|---|---|---|
| [127] | CT image segmentation and classification | Dual path Network (DPN)-92, Inception-v3, ResNet-50, and Attention ResNet-50 FCN-8s, V-Net, U-Net, 3D U-Net++ | Segmentation (positive 877, negative 541) Classification (positive 718, negative 70, and other diseases 343) | Sensitivity 97.4%, Specificity 92.2% |
| [128] | Automatic segmentation of lung opacification from CT images | SCOAT-Net, PSPNet, ESPNetv2, DenseASPP, UNet+, DeepLabV3+, U-Net, COPLE-Net, CE-Net, Attention U-Net | Two patients scanned at different times, and Kaggle dataset | Proposed model (DSC 88.99%, Sensitivity 87.85%, PPV 90.28%) |
| [129] | COVID-19 lesion segmentation in CT slices | Dilated dual attention U-Net architecture with a ResNeXt-50 | Three open-source datasets total 1645 slices | Dice 72.98%, recall 70.71% |
| [130] | Segment the radiological images | Superpixel based fuzzy modified flower pollination | 115 CT scan images | — |
| [131] | ML and DL-based classifier with CT image opacity map | 3D neural network, DenseUnet | 2446 chest CTs images | AUC 93%, sensitivity 90%, specificity 83% |
| [132] | Multi-point supervision network for segmentation of COVID-19 lung infection using CT image | U-Net based (MPS-Net) | 300 CT images | Dice 83.25%, sensitivity 84.06%, specificity 99.88%, IOU 74.2% |
| [133] | Binary and multi-class detection and labeling of infected tissues on CT lung images | SegNet and U-NET | 100 CT images | Binary segmentation (SegNet) 95%, multi-class (U-NET) 91% mean accuracy |
| [134] | Lung and lobar segmentation of CT images in patients with COVID-19 | Seg3DNet | A combination of human and animal 3D CT images. 1453 for training, 7998 for evaluation | Dice coefcient of 0.985 ± 0.011 |
| [135] | The segmentation and classification of COVID-19 using chest X-ray (CXR) images | U-Net | 1645 CXR images | F1-Score (binary 88%, multiclass 83%) |
| [136] | COVID-19 classification using plain and segmented lung CXRs | U-Net, Modified U-Net | COVID-19 3616, Normal 8851, Non-COVID 6012 | Dice 96.3%, 96.94% |

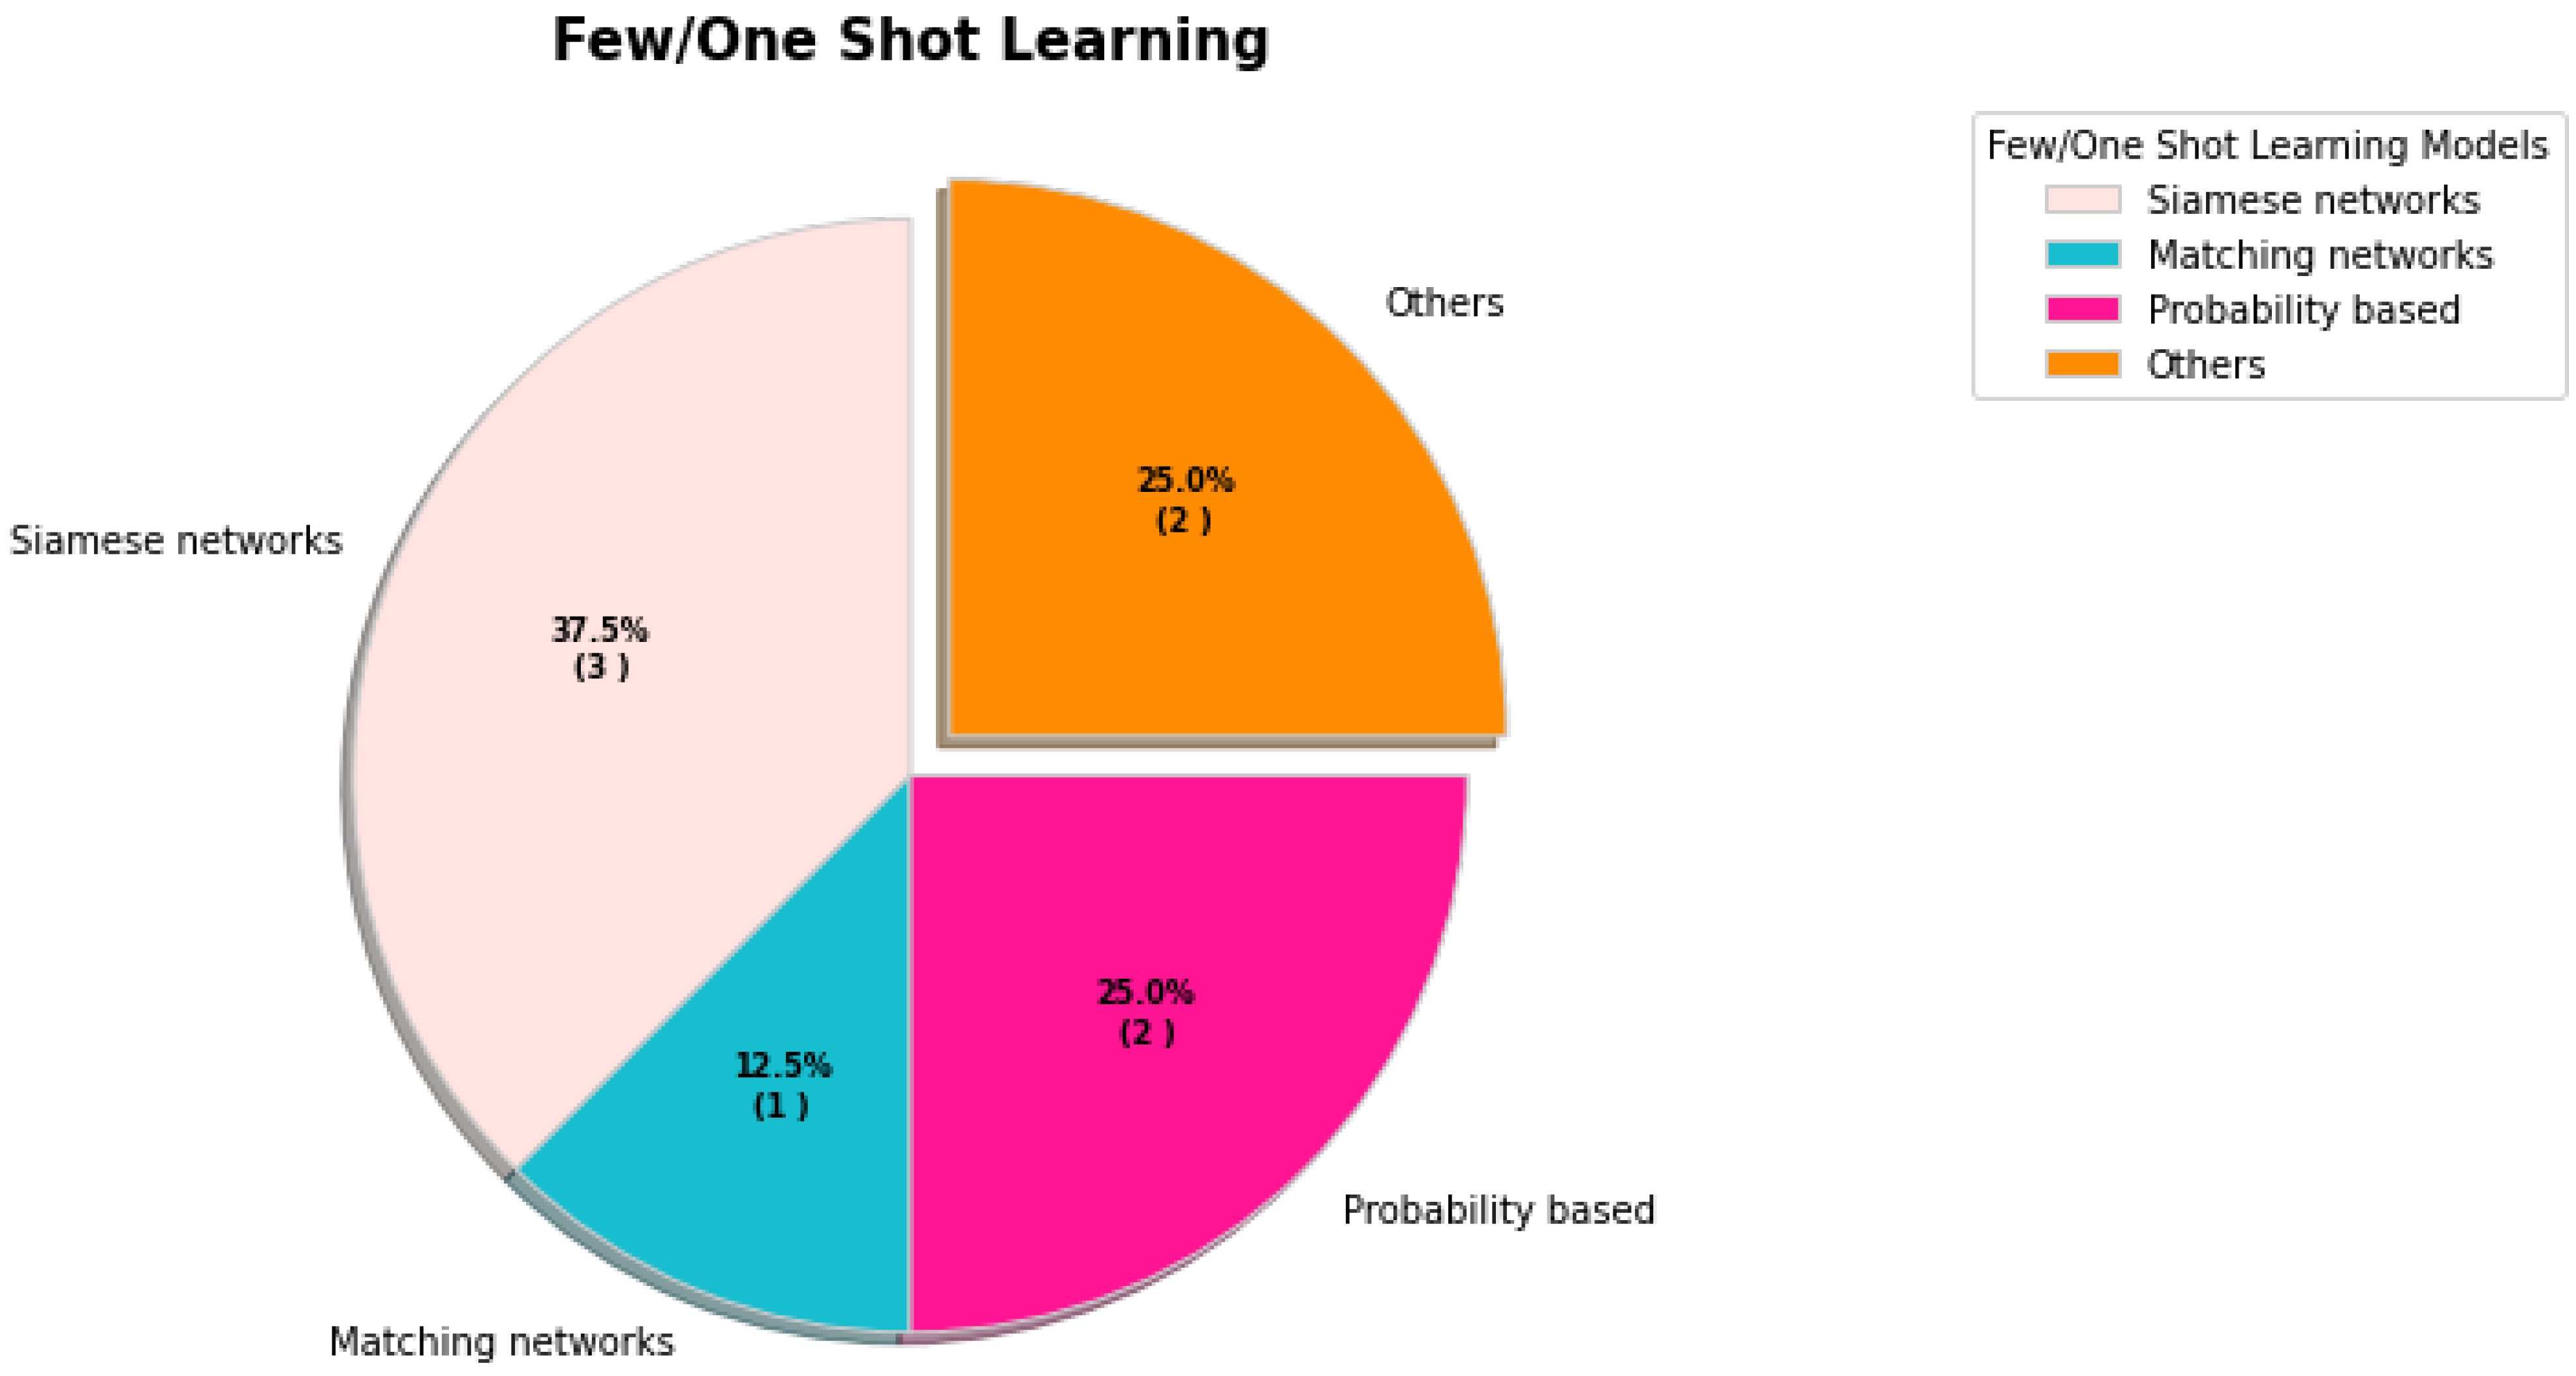
4.4. Few/One-Shot Learning
| Objective | Reference | Number of Studies | Main Reason for Implementation | Technical Issue Faced |
|---|---|---|---|---|
| Medical Image Analysis | [32,43,47,55,57,59,60,62,63,65,72,73,75,76,77,80,84,85,86,87,89,90,92,93,94,95,96,98,99,100,101,102,103,104,105,106,107,108,109,110,111,112,113,114,118,119,120,121,122,123,124,125,126,127,128,129,130,131,132,133,134,135,136,137,138,139,140,141,143,144,145,146,147,148,149,150] | 76 |
|
|
| Clinical and socio demographic data analysis | [20,22,23,24,25,27,28,29,30,31,35,36,40,42,44,46,54] | 17 |
|
|
| Sound analysis | [37,38,51,115,116,117] | 6 |
|
|
| Genetic analysis | [26,48,58,61] | 4 |
|
|
| Protective equipment observation | [66,67,68,69,70,79,82,88] | 8 |
|
|
| Social control | [71,74,78,81,83] | 5 |
|
|
| No. | Challenges | Current Limitation | Future Research Directions |
|---|---|---|---|
| 1 | Physical resource and computing time | Most deep learning models require more data and training time. | Developing metric learning, meta-learning, plug-and-play modules, optimization, and probability-based methods to overcome training time and physical resources challenges. |
| 2 | Bias | Many models are trained or tested by the unrepresentative reality or biased data. | Applying bias mitigation methods including optimized preprocessing, fair data adaptation, meta-algorithm for fair classification, adversarial debiasing, rich subgroup fairness, exponentiated gradient reduction, grid search reduction, etc. |
| 3 | Embedded machine learning | The embedded machine learning approach has still absent. | Design sophisticated machine learning approach combination of low latency, reduced power consumption, improved environmental performance, network bandwidth efficiency, and strong privacy. |
| 4 | Drugs and vaccine development | Requires to identify the most relevant biotargets and large-scale training datasets. | Focusing on protein-coding, mRNA sequence design, molecule generation, developing general vaccine prototypes, and predicting the response of the immune system. |
| 5 | Limited uses of ultrasound data | A few studies used ultrasound images. | Implementing segmentation and shot learn methods through the ultrasound image for the specific task. |

5. Discussion
6. Conclusions
Author Contributions
Funding
Institutional Review Board Statement
Informed Consent Statement
Data Availability Statement
Acknowledgments
Conflicts of Interest
Abbreviations
| AI | Artificial intelligence |
| DL | Deep learning |
| ML | Machine learning |
| KNN | K-nearest neighbors |
| SVR | Support vector regression |
| MLP | Multi-layer perceptron |
| PMLP | Polynomial multi-layer perceptron |
| PASC | Post-acute sequelae of COVID-19 |
| ANN | Artificial neural networks |
| RT-PCR | Reverse transcription polymerase chain reaction |
| MAPE | Mean absolute percentage error |
| ARDS | Acute respiratory distress syndrome |
| DNN | Deep neural network |
| LSVC | Left superior vena cava |
| CT | Computerized tomography |
| SARS | Severe acute respiratory syndrome |
| MERS | Middle east respiratory syndrome |
| t-SNE | T-distributed stochastic neighbor embedding |
| PM | Particulate matter |
| DBSCAN | Density-based spatial clustering of applications with noise |
| SPGC | Signal processing grand challenge |
| VGG | Visual geometry group |
| RNN | Recurrent neural network |
| PCAUFE | Principal-component-analysis-based unsupervised feature extraction |
| RNA | Ribonucleic acid |
| SOFM | Self-organizing feature maps |
| U-Net | U-shaped convolutional neural network |
| GAN | Generative adversarial network |
| YOLO | You only look once |
| IAVP | Influenza-A viral pneumonia |
| X-ray | X-radiation |
| CAD | Computer-aided design |
| CCTV | Closed-circuit television |
| SAM | Spatial attention module |
| SPP | Spatial pyramid pooling |
| PAN | Path aggregation network |
| MS COCO | Microsoft Common Objects in Context |
| R-CNNs | Region-based convolutional neural networks |
| ROI | Region of interest |
| CRM | Class-selective relevance mapping |
| SSD | Single shot multibox detector |
| VOC | Visual object classes |
| mAP | Mean average precision |
| CelebA | CelebFaces attributes dataset |
| Wider | Web image dataset for event recognition |
| NN | Neural networks |
| N-CLAHE | Normalization function and the contrast limited adaptive histogram equalization |
| BPSO | Binary particle swarm optimization |
| BGWO | Binary gray wolf optimization |
| ESC | Environmental sound classification |
| DLA | Deep layer aggregation |
| 3D | Three dimensions |
| NSD | Normalised surface distance |
| DSC | Dice similarity coefficient |
| PPV | Positive predictive value |
| IoU | Intersection over union |
| CXR | Chest X-ray |
| GRNN | Generalized regression neural network |
| PNN | Probabilistic neural network |
References
- Zu, Z.Y.; Jiang, M.D.; Xu, P.P.; Chen, W.; Ni, Q.Q.; Lu, G.M.; Zhang, L.J. Coronavirus disease 2019 (COVID-19): A perspective from China. Radiology 2020, 296, E15–E25. [Google Scholar] [CrossRef] [PubMed] [Green Version]
- Cunha, C.B.; Cunha, B.A. Great plagues of the past and remaining questions. Paleomicrobiology 2008, 1–20. [Google Scholar] [CrossRef]
- Menachery, V.D.; Yount, B.L.; Debbink, K.; Agnihothram, S.; Gralinski, L.E.; Plante, J.A.; Graham, R.L.; Scobey, T.; Ge, X.Y.; Donaldson, E.F.; et al. A SARS-like cluster of circulating bat coronaviruses shows potential for human emergence. Nat. Med. 2015, 21, 1508–1513. [Google Scholar] [CrossRef] [PubMed]
- Sun, H.; Xiao, Y.; Liu, J.; Wang, D.; Li, F.; Wang, C.; Li, C.; Zhu, J.; Song, J.; Sun, H.; et al. Prevalent Eurasian avian-like H1N1 swine influenza virus with 2009 pandemic viral genes facilitating human infection. Proc. Natl. Acad. Sci. USA 2020, 117, 17204–17210. [Google Scholar] [CrossRef] [PubMed]
- Giacca, M.; Shah, A.M. The pathological maelstrom of COVID-19 and cardiovascular disease. Nat. Cardiovasc. Res. 2022, 1, 200–210. [Google Scholar] [CrossRef]
- He, Q.; Zheng, H.; Ma, X.; Wang, L.; Kong, H.; Zhu, Z. Artificial intelligence application in a renewable energy-driven desalination system: A critical review. Energy AI 2022, 7, 100123. [Google Scholar] [CrossRef]
- Yang, Y.; Yang, Y. Artificial Intelligence Signal Processing Technology in Civil Aviation Electronic Information Engineering. In Proceedings of the International Conference on Multi-Modal Information Analytics, Huhehaote, China, 22–23 April 2022; pp. 587–593. [Google Scholar]
- Hasan, M.M.; Islam, M.U.; Sadeq, M.J. Towards the Technological Adaptation of Advanced Farming through Artificial Intelligence, the Internet of Things, and Robotics: A Comprehensive Overview. In Artificial Intelligence and Smart Agriculture Technology; Auerbach Publications: Boca Raton, FL, USA, 2022; pp. 21–42. [Google Scholar]
- van de Sande, D.; Van Genderen, M.E.; Smit, J.M.; Huiskens, J.; Visser, J.J.; Veen, R.E.; van Unen, E.; Hilgers, O.; Gommers, D.; van Bommel, J. Developing, implementing and governing artificial intelligence in medicine: A step-by-step approach to prevent an artificial intelligence winter. BMJ Health Care Inform. 2022, 29, e100495. [Google Scholar] [CrossRef]
- Bazoukis, G.; Hall, J.; Loscalzo, J.; Antman, E.M.; Fuster, V.; Armoundas, A.A. The inclusion of augmented intelligence in medicine: A framework for successful implementation. Cell Rep. Med. 2022, 3, 100485. [Google Scholar] [CrossRef]
- Zhang, X.; Wang, R.; Sharma, A.; Deverajan, G.G. Artificial intelligence in cognitive psychology—Influence of literature based on artificial intelligence on children’s mental disorders. Aggress. Violent Behav. 2021, 101590. [Google Scholar] [CrossRef]
- Napolitano, F.; Xu, X.; Gao, X. Impact of computational approaches in the fight against COVID-19: An AI guided review of 17,000 studies. Brief. Bioinform. 2022, 23, bbab456. [Google Scholar] [CrossRef]
- Bayes-Genis, A.; Iborra-Egea, O.; Spitaleri, G.; Domingo, M.; Revuelta-López, E.; Codina, P.; Cediel, G.; Santiago-Vacas, E.; Cserkóová, A.; Pascual-Figal, D.; et al. Decoding empagliflozin’s molecular mechanism of action in heart failure with preserved ejection fraction using artificial intelligence. Sci. Rep. 2021, 11, 12025. [Google Scholar] [CrossRef]
- Zhao, W. Inspired, but not mimicking: A conversation between artificial intelligence and human intelligence. Natl. Sci. Rev. 2022, 9, nwac068. [Google Scholar] [CrossRef]
- Alballa, N.; Al-Turaiki, I. Machine learning approaches in COVID-19 diagnosis, mortality, and severity risk prediction: A review. Inform. Med. Unlocked 2021, 24, 100564. [Google Scholar] [CrossRef]
- El-Rashidy, N.; Abdelrazik, S.; Abuhmed, T.; Amer, E.; Ali, F.; Hu, J.W.; El-Sappagh, S. Comprehensive survey of using machine learning in the COVID-19 pandemic. Diagnostics 2021, 11, 1155. [Google Scholar] [CrossRef]
- Alyasseri, Z.A.A.; Al-Betar, M.A.; Doush, I.A.; Awadallah, M.A.; Abasi, A.K.; Makhadmeh, S.N.; Alomari, O.A.; Abdulkareem, K.H.; Adam, A.; Damasevicius, R.; et al. Review on COVID-19 diagnosis models based on machine learning and deep learning approaches. Expert Syst. 2022, 39, e12759. [Google Scholar] [CrossRef]
- Kwekha-Rashid, A.S.; Abduljabbar, H.N.; Alhayani, B. Coronavirus disease (COVID-19) cases analysis using machine-learning applications. In Applied Nanoscience; Springer: Berlin/Heidelberg, Germany, 2021; pp. 1–13. [Google Scholar]
- Bhattacharya, S.; Maddikunta, P.K.R.; Pham, Q.V.; Gadekallu, T.R.; Chowdhary, C.L.; Alazab, M.; Piran, M.J. Deep learning and medical image processing for coronavirus (COVID-19) pandemic: A survey. Sustain. Cities Soc. 2021, 65, 102589. [Google Scholar] [CrossRef]
- Roberts, M.; Driggs, D.; Thorpe, M.; Gilbey, J.; Yeung, M.; Ursprung, S.; Aviles-Rivero, A.I.; Etmann, C.; McCague, C.; Beer, L.; et al. Common pitfalls and recommendations for using machine learning to detect and prognosticate for COVID-19 using chest radiographs and CT scans. Nat. Mach. Intell. 2021, 3, 199–217. [Google Scholar] [CrossRef]
- Selçuk, A.A. A guide for systematic reviews: PRISMA. Turk. Archiv. Otorhinolaryngol. 2019, 57, 57. [Google Scholar] [CrossRef]
- Cabitza, F.; Campagner, A.; Ferrari, D.; Di Resta, C.; Ceriotti, D.; Sabetta, E.; Colombini, A.; De Vecchi, E.; Banfi, G.; Locatelli, M.; et al. Development, evaluation, and validation of machine learning models for COVID-19 detection based on routine blood tests. Clin. Chem. Lab. Med. CCLM 2021, 59, 421–431. [Google Scholar] [CrossRef]
- Satu, M.; Howlader, K.C.; Mahmud, M.; Kaiser, M.S.; Shariful Islam, S.M.; Quinn, J.M.; Alyami, S.A.; Moni, M.A. Short-term prediction of COVID-19 cases using machine learning models. Appl. Sci. 2021, 11, 4266. [Google Scholar] [CrossRef]
- Arpaci, I.; Huang, S.; Al-Emran, M.; Al-Kabi, M.N.; Peng, M. Predicting the COVID-19 infection with fourteen clinical features using machine learning classification algorithms. Multimed. Tools Appl. 2021, 80, 11943–11957. [Google Scholar] [CrossRef] [PubMed]
- Chowdhury, M.E.; Rahman, T.; Khandakar, A.; Al-Madeed, S.; Zughaier, S.M.; Hassen, H.; Islam, M.T. An early warning tool for predicting mortality risk of COVID-19 patients using machine learning. In Cognitive Computation; Springer: Berlin/Heidelberg, Germany, 2021; pp. 1–16. [Google Scholar]
- Patterson, B.K.; Guevara-Coto, J.; Yogendra, R.; Francisco, E.B.; Long, E.; Pise, A.; Rodrigues, H.; Parikh, P.; Mora, J.; Mora-Rodríguez, R.A. Immune-based prediction of COVID-19 severity and chronicity decoded using machine learning. Front. Immunol. 2021, 12, 2520. [Google Scholar] [CrossRef] [PubMed]
- Karthikeyan, A.; Garg, A.; Vinod, P.; Priyakumar, U.D. Machine learning based clinical decision support system for early COVID-19 mortality prediction. Front. Public Health 2021, 9, 626697. [Google Scholar] [CrossRef] [PubMed]
- Marcos, M.; Belhassen-García, M.; Sánchez-Puente, A.; Sampedro-Gomez, J.; Azibeiro, R.; Dorado-Díaz, P.I.; Marcano-Millán, E.; García-Vidal, C.; Moreiro-Barroso, M.T.; Cubino-Bóveda, N.; et al. Development of a severity of disease score and classification model by machine learning for hospitalized COVID-19 patients. PLoS ONE 2021, 16, e0240200. [Google Scholar] [CrossRef] [PubMed]
- Mahdavi, M.; Choubdar, H.; Zabeh, E.; Rieder, M.; Safavi-Naeini, S.; Jobbagy, Z.; Ghorbani, A.; Abedini, A.; Kiani, A.; Khanlarzadeh, V.; et al. A machine learning based exploration of COVID-19 mortality risk. PLoS ONE 2021, 16, e0252384. [Google Scholar] [CrossRef]
- Li, S.; Lin, Y.; Zhu, T.; Fan, M.; Xu, S.; Qiu, W.; Chen, C.; Li, L.; Wang, Y.; Yan, J.; et al. Development and external evaluation of predictions models for mortality of COVID-19 patients using machine learning method. In Neural Computing and Applications; Springer: Berlin/Heidelberg, Germany, 2021; pp. 1–10. [Google Scholar]
- Podder, P.; Bharati, S.; Mondal, M.R.H.; Kose, U. Application of Machine Learning for the Diagnosis of COVID-19. In Data Science for COVID-19; Elsevier: Amsterdam, The Netherlands, 2021; pp. 175–194. [Google Scholar]
- Chandra, T.B.; Verma, K.; Singh, B.K.; Jain, D.; Netam, S.S. Coronavirus disease (COVID-19) detection in chest X-ray images using majority voting based classifier ensemble. Expert Syst. Appl. 2021, 165, 113909. [Google Scholar] [CrossRef]
- Ballı, S. Data analysis of COVID-19 pandemic and short-term cumulative case forecasting using machine learning time series methods. Chaos Solitons Fractals 2021, 142, 110512. [Google Scholar] [CrossRef]
- Li, M.; Zhang, Z.; Cao, W.; Liu, Y.; Du, B.; Chen, C.; Liu, Q.; Uddin, M.N.; Jiang, S.; Chen, C.; et al. Identifying novel factors associated with COVID-19 transmission and fatality using the machine learning approach. Sci. Total Environ. 2021, 764, 142810. [Google Scholar] [CrossRef]
- Kang, J.; Chen, T.; Luo, H.; Luo, Y.; Du, G.; Jiming-Yang, M. Machine learning predictive model for severe COVID-19. Infect. Genet. Evol. 2021, 90, 104737. [Google Scholar] [CrossRef]
- Kocadagli, O.; Baygul, A.; Gokmen, N.; Incir, S.; Aktan, C. Clinical prognosis evaluation of COVID-19 patients: An interpretable hybrid machine learning approach. Curr. Res. Transl. Med. 2022, 70, 103319. [Google Scholar] [CrossRef]
- SM, U.S.; Ganesan, R.; Katiravan, J.; Ramakrishnan, M. Mobile application based speech and voice analysis for COVID-19 detection using computational audit techniques. Int. J. Pervasive Comput. Commun. 2020, 18, 508–517. [Google Scholar] [CrossRef]
- Gökcen, A.; Karadağ, B.; Riva, C.; Boyacı, A. Artificial intelligence–Based COVID-19 detection using cough records. Electrica 2021, 21, 203–208. [Google Scholar] [CrossRef]
- Chintalapudi, N.; Battineni, G.; Amenta, F. Sentimental analysis of COVID-19 tweets using deep learning models. Infect. Disease Rep. 2021, 13, 329–339. [Google Scholar] [CrossRef]
- Muhammad, L.; Algehyne, E.A.; Usman, S.S.; Ahmad, A.; Chakraborty, C.; Mohammed, I.A. Supervised machine learning models for prediction of COVID-19 infection using epidemiology dataset. SN Comput. Sci. 2021, 2, 1–13. [Google Scholar] [CrossRef]
- Majhi, R.; Thangeda, R.; Sugasi, R.P.; Kumar, N. Analysis and prediction of COVID-19 trajectory: A machine learning approach. J. Public Aff. 2021, 21, e2537. [Google Scholar] [CrossRef]
- Booth, A.L.; Abels, E.; McCaffrey, P. Development of a prognostic model for mortality in COVID-19 infection using machine learning. Mod. Pathol. 2021, 34, 522–531. [Google Scholar] [CrossRef]
- Afshar, P.; Heidarian, S.; Enshaei, N.; Naderkhani, F.; Rafiee, M.J.; Oikonomou, A.; Fard, F.B.; Samimi, K.; Plataniotis, K.N.; Mohammadi, A. COVID-CT-MD, COVID-19 computed tomography scan dataset applicable in machine learning and deep learning. Sci. Data 2021, 8, 1–8. [Google Scholar] [CrossRef]
- Xu, W.; Sun, N.N.; Gao, H.N.; Chen, Z.Y.; Yang, Y.; Ju, B.; Tang, L.L. Risk factors analysis of COVID-19 patients with ARDS and prediction based on machine learning. Sci. Rep. 2021, 11, 1–12. [Google Scholar] [CrossRef]
- Patel, D.; Kher, V.; Desai, B.; Lei, X.; Cen, S.; Nanda, N.; Gholamrezanezhad, A.; Duddalwar, V.; Varghese, B.; Oberai, A.A. Machine learning based predictors for COVID-19 disease severity. Sci. Rep. 2021, 11, 1–7. [Google Scholar] [CrossRef]
- Zoabi, Y.; Deri-Rozov, S.; Shomron, N. Machine learning-based prediction of COVID-19 diagnosis based on symptoms. NPJ Digit. Med. 2021, 4, 1–5. [Google Scholar] [CrossRef]
- Singh, A.K.; Kumar, A.; Mahmud, M.; Kaiser, M.S.; Kishore, A. COVID-19 infection detection from chest X-ray images using hybrid social group optimization and support vector classifier. In Cognitive Computation; Springer: Berlin/Heidelberg, Germany, 2021; pp. 1–13. [Google Scholar]
- Hasan, M.M.; Murtaz, S.B.; Islam, M.U.; Sadeq, M.J.; Uddin, J. Robust and efficient COVID-19 detection techniques: A machine learning approach. PLoS ONE 2022, 17, e0274538. [Google Scholar] [CrossRef] [PubMed]
- Gautam, Y. Transfer Learning for COVID-19 cases and deaths forecast using LSTM network. ISA Trans. 2022, 124, 41–56. [Google Scholar] [CrossRef] [PubMed]
- Arbane, M.; Benlamri, R.; Brik, Y.; Alahmar, A.D. Social media-based COVID-19 sentiment classification model using Bi-LSTM. Expert Syst. Appl. 2023, 212, 118710. [Google Scholar] [CrossRef] [PubMed]
- Pahar, M.; Klopper, M.; Warren, R.; Niesler, T. COVID-19 cough classification using machine learning and global smartphone recordings. Comput. Biol. Med. 2021, 135, 104572. [Google Scholar] [CrossRef] [PubMed]
- Boussen, S.; Cordier, P.Y.; Malet, A.; Simeone, P.; Cataldi, S.; Vaisse, C.; Roche, X.; Castelli, A.; Assal, M.; Pepin, G.; et al. Triage and monitoring of COVID-19 patients in intensive care using unsupervised machine learning. Comput. Biol. Med. 2022, 142, 105192. [Google Scholar] [CrossRef]
- Zhao, Y.; Wang, L.; Huang, T.; Tao, S.; Liu, J.; Gao, H.; Luo, J.; Huang, Y.; Liu, X.; Chen, K.; et al. Unsupervised PM2.5 anomalies in China induced by the COVID-19 epidemic. Sci. Total Environ. 2021, 795, 148807. [Google Scholar] [CrossRef]
- Lai, Y.; Charpignon, M.L.; Ebner, D.K.; Celi, L.A. Unsupervised learning for county-level typological classification for COVID-19 research. Intell.-Based Med. 2020, 1, 100002. [Google Scholar] [CrossRef]
- Chen, H.; Jiang, Y.; Loew, M.; Ko, H. Unsupervised domain adaptation based COVID-19 CT infection segmentation network. Appl. Intell. 2022, 52, 6340–6353. [Google Scholar] [CrossRef]
- Kurniawan, R.; Abdullah, S.N.H.S.; Lestari, F.; Nazri, M.Z.A.; Mujahidin, A.; Adnan, N. Clustering and correlation methods for predicting coronavirus COVID-19 risk analysis in pandemic countries. In Proceedings of the 2020 8th International Conference on Cyber and IT Service Management (CITSM), Pangkal Pinang, Indonesia, 23–24 October 2020; pp. 1–5. [Google Scholar]
- Zheng, W.; Yan, L.; Gou, C.; Zhang, Z.C.; Zhang, J.J.; Hu, M.; Wang, F.Y. Learning to learn by yourself: Unsupervised meta-learning with self-knowledge distillation for COVID-19 diagnosis from pneumonia cases. Int. J. Intell. Syst. 2021, 36, 4033–4064. [Google Scholar] [CrossRef]
- Oniani, D.; Jiang, G.; Liu, H.; Shen, F. Constructing co-occurrence network embeddings to assist association extraction for COVID-19 and other coronavirus infectious diseases. J. Am. Med. Inform. Assoc. 2020, 27, 1259–1267. [Google Scholar] [CrossRef]
- Ewen, N.; Khan, N. Online unsupervised Learning for domain shift in COVID-19 CT scan datasets. In Proceedings of the 2021 IEEE International Conference on Autonomous Systems (ICAS), Montréal, QC, Canada, 11–13 August 2021; pp. 1–5. [Google Scholar]
- Miao, R.; Dong, X.; Xie, S.L.; Liang, Y.; Lo, S.L. UMLF-COVID: An unsupervised meta-learning model specifically designed to identify X-ray images of COVID-19 patients. BMC Med. Imaging 2021, 21, 174. [Google Scholar] [CrossRef]
- Fujisawa, K.; Shimo, M.; Taguchi, Y.H.; Ikematsu, S.; Miyata, R. PCA-based unsupervised feature extraction for gene expression analysis of COVID-19 patients. Sci. Rep. 2021, 11, 17351. [Google Scholar] [CrossRef]
- King, B.; Barve, S.; Ford, A.; Jha, R. Unsupervised clustering of COVID-19 chest X-ray images with a self-organizing feature map. In Proceedings of the 2020 IEEE 63rd International Midwest Symposium on Circuits and Systems (MWSCAS), Springfield, MA, USA, 9–12 August 2020; pp. 395–398. [Google Scholar]
- Xu, R.; Cao, X.; Wang, Y.; Chen, Y.W.; Ye, X.; Lin, L.; Zhu, W.; Chen, C.; Xu, F.; Zhou, Y.; et al. Unsupervised detection of pulmonary opacities for computer-aided diagnosis of COVID-19 on CT images. In Proceedings of the 2020 25th International Conference on Pattern Recognition (ICPR), Milan, Italy, 10–15 January 2021; pp. 9007–9014. [Google Scholar]
- Huang, R.Y.; Herr, D.R. Quantitative circular flow immunoassays with trained object recognition to detect antibodies to SARS-CoV-2 membrane glycoprotein. Biochem. Biophys. Res. Commun. 2021, 565, 8–13. [Google Scholar] [CrossRef]
- Xu, X.; Jiang, X.; Ma, C.; Du, P.; Li, X.; Lv, S.; Yu, L.; Ni, Q.; Chen, Y.; Su, J.; et al. A deep learning system to screen novel coronavirus disease 2019 pneumonia. Engineering 2020, 6, 1122–1129. [Google Scholar] [CrossRef]
- Bhuiyan, M.R.; Khushbu, S.A.; Islam, M.S. A deep learning based assistive system to classify COVID-19 face mask for human safety with YOLOv3. In Proceedings of the 2020 11th International Conference on Computing, Communication and Networking Technologies (ICCCNT), Kharagpur, India, 1–3 July 2020; pp. 1–5. [Google Scholar]
- RS, V.; Anbarasi, L.; Rukmani, P.; Sruti, V.; Ram, G.; Shaumaya, O.; Gurudaas, N. AI-based COVID-19 Airport Preventive Measures (AI-CAPM). Int. J. Curr. Res. Rev. Vol. 2021, 13, 115. [Google Scholar] [CrossRef]
- Gupta, S.; Sreenivasu, S.; Chouhan, K.; Shrivastava, A.; Sahu, B.; Potdar, R.M. Novel face mask detection technique using machine learning to control COVID’19 pandemic. Mater. Today Proc. 2021. [Google Scholar] [CrossRef]
- Loey, M.; Manogaran, G.; Taha, M.H.N.; Khalifa, N.E.M. A hybrid deep transfer learning model with machine learning methods for face mask detection in the era of the COVID-19 pandemic. Measurement 2021, 167, 108288. [Google Scholar] [CrossRef]
- Talahua, J.S.; Buele, J.; Calvopiña, P.; Varela-Aldás, J. Facial recognition system for people with and without face mask in times of the COVID-19 pandemic. Sustainability 2021, 13, 6900. [Google Scholar] [CrossRef]
- Hou, Y.C.; Baharuddin, M.Z.; Yussof, S.; Dzulkifly, S. Social distancing detection with deep learning model. In Proceedings of the 2020 8th International Conference on Information Technology and Multimedia (ICIMU), Selangor, Malaysia, 24–25 August 2020; pp. 334–338. [Google Scholar]
- Al-Antari, M.A.; Hua, C.H.; Bang, J.; Lee, S. Fast deep learning computer-aided diagnosis of COVID-19 based on digital chest X-ray images. Appl. Intell. 2021, 51, 2890–2907. [Google Scholar] [CrossRef]
- Al-Antari, M.A.; Hua, C.H.; Bang, J.; Choi, D.J.; Kang, S.M.; Lee, S. A Rapid Deep Learning Computer-Aided Diagnosis to Simultaneously Detect and Classify the Novel COVID-19 Pandemic. In Proceedings of the 2020 IEEE-EMBS Conference on Biomedical Engineering and Sciences (IECBES), Langkawi, Malaysia, 1–3 March 2021; pp. 585–588. [Google Scholar]
- Rezaei, M.; Azarmi, M. Deepsocial: Social distancing monitoring and infection risk assessment in COVID-19 pandemic. Appl. Sci. 2020, 10, 7514. [Google Scholar] [CrossRef]
- Li, Y.; He, X. COVID-19 Detection in Chest Radiograph Based on YOLO v5. In Proceedings of the 2021 IEEE International Conference on Computer Science, Electronic Information Engineering and Intelligent Control Technology (CEI), Fuzhou, China, 24–26 September 2021; pp. 344–347. [Google Scholar]
- Yoshitsugu, K.; Nakamoto, Y. COVID-19 Diagnosis Using Chest X-ray Images via Classification and Object Detection. In Proceedings of the 2021 4th Artificial Intelligence and Cloud Computing Conference, Kyoto, Japan, 17–19 December 2021; pp. 62–67. [Google Scholar]
- Joshi, R.C.; Yadav, S.; Pathak, V.K.; Malhotra, H.S.; Khokhar, H.V.S.; Parihar, A.; Kohli, N.; Himanshu, D.; Garg, R.K.; Bhatt, M.L.B.; et al. A deep learning-based COVID-19 automatic diagnostic framework using chest X-ray images. Biocybernet. Biomed. Eng. 2021, 41, 239–254. [Google Scholar] [CrossRef] [PubMed]
- Shorfuzzaman, M.; Hossain, M.S.; Alhamid, M.F. Towards the sustainable development of smart cities through mass video surveillance: A response to the COVID-19 pandemic. Sustain. Cities Soc. 2021, 64, 102582. [Google Scholar] [CrossRef] [PubMed]
- Protik, A.A.; Rafi, A.H.; Siddique, S. Real-time Personal Protective Equipment (PPE) Detection Using YOLOv4 and TensorFlow. In Proceedings of the 2021 IEEE Region 10 Symposium (TENSYMP), Grand Hyatt, Jeju, Republic of Korea, 23–25 August 2021; pp. 1–6. [Google Scholar]
- Dou, Q.; Thus, T.Y.; Jiang, M.; Liu, Q.; Vardhanabhuti, V.; Kaissis, G.; Li, Z.; Si, W.; Lee, H.H.; Yu, K.; et al. Federated deep learning for detecting COVID-19 lung abnormalities in CT: A privacy-preserving multinational validation study. NPJ Digit. Med. 2021, 4, 1–11. [Google Scholar] [CrossRef] [PubMed]
- Saponara, S.; Elhanashi, A.; Gagliardi, A. Implementing a real-time, AI-based, people detection and social distancing measuring system for COVID-19. J. Real-Time Image Process. 2021, 18, 1937–1947. [Google Scholar] [CrossRef] [PubMed]
- Melo, C.; Dixe, S.; Fonseca, J.C.; Moreira, A.H.; Borges, J. AI Based Monitoring of Different Risk Levels in COVID-19 Context. Sensors 2021, 22, 298. [Google Scholar] [CrossRef]
- Shin, M.; Moon, N. Indoor Distance Measurement System COPS (COVID-19 Prevention System). Sustainability 2021, 13, 4738. [Google Scholar] [CrossRef]
- Arunachalam, A.; Ravi, V.; Acharya, V.; Pham, T.D. Toward data-model-agnostic autonomous machine-generated data labeling and annotation platform: COVID-19 autoannotation use case. IEEE Trans. Eng. Manag. 2021. [Google Scholar] [CrossRef]
- Nurmaini, S.; Tondas, A.E.; Partan, R.U.; Rachmatullah, M.N.; Darmawahyuni, A.; Firdaus, F.; Tutuko, B.; Hidayat, R.; Sapitri, A.I. Automated Detection of COVID-19 Infected Lesion on Computed Tomography Images Using Faster-RCNNs. Eng. Lett. 2020, 28, 1287–1294. [Google Scholar]
- Rajaraman, S.; Sornapudi, S.; Alderson, P.O.; Folio, L.R.; Antani, S.K. Analyzing inter-reader variability affecting deep ensemble learning for COVID-19 detection in chest radiographs. PLoS ONE 2020, 15, e0242301. [Google Scholar] [CrossRef]
- Saiz, F.A.; Barandiaran, I. COVID-19 Detection in Chest X-ray Images using a Deep Learning Approach. Int. J. Interact. Multim. Artif. Intell. 2020, 6, 1–4. [Google Scholar] [CrossRef]
- Loey, M.; Manogaran, G.; Taha, M.H.N.; Khalifa, N.E.M. Fighting against COVID-19: A novel deep learning model based on YOLO-v2 with ResNet-50 for medical face mask detection. Sustain. Cities Soc. 2021, 65, 102600. [Google Scholar] [CrossRef]
- Li, W.; Chen, J.; Chen, P.; Yu, L.; Cui, X.; Li, Y.; Cheng, F.; Ouyang, W. NIA-Network: Towards improving lung CT infection detection for COVID-19 diagnosis. Artific. Intell. Med. 2021, 117, 102082. [Google Scholar] [CrossRef]
- de Moura, J.; Novo, J.; Ortega, M. Fully automatic deep convolutional approaches for the analysis of COVID-19 using chest X-ray images. Appl. Soft Comput. 2022, 115, 108190. [Google Scholar] [CrossRef]
- Abbas, A.; Abdelsamea, M.M.; Gaber, M.M. 4S-DT: Self-supervised super sample decomposition for transfer learning with application to COVID-19 detection. IEEE Trans. Neural Netw. Learn. Syst. 2021, 32, 2798–2808. [Google Scholar] [CrossRef]
- Rehman, A.; Naz, S.; Khan, A.; Zaib, A.; Razzak, I. Improving coronavirus (COVID-19) diagnosis using deep transfer learning. MedRxiv 2020, 350. [Google Scholar]
- Ahuja, S.; Panigrahi, B.K.; Dey, N.; Rajinikanth, V.; Gandhi, T.K. Deep transfer learning-based automated detection of COVID-19 from lung CT scan slices. Appl. Intell. 2021, 51, 571–585. [Google Scholar] [CrossRef]
- Shamsi, A.; Asgharnezhad, H.; Jokandan, S.S.; Khosravi, A.; Kebria, P.M.; Nahavandi, D.; Nahavandi, S.; Srinivasan, D. An uncertainty-aware transfer learning-based framework for COVID-19 diagnosis. IEEE Trans. Neural Netw. Learn. Syst. 2021, 32, 1408–1417. [Google Scholar] [CrossRef]
- Bassi, P.R.; Attux, R. A deep convolutional neural network for COVID-19 detection using chest X-rays. Res. Biomed. Eng. 2022, 38, 139–148. [Google Scholar] [CrossRef]
- Jaiswal, A.; Gianchandani, N.; Singh, D.; Kumar, V.; Kaur, M. Classification of the COVID-19 infected patients using DenseNet201 based deep transfer learning. J. Biomol. Struct. Dyn. 2021, 39, 5682–5689. [Google Scholar] [CrossRef]
- Wang, S.H.; Nayak, D.R.; Guttery, D.S.; Zhang, X.; Zhang, Y.D. COVID-19 classification by CCSHNet with deep fusion using transfer learning and discriminant correlation analysis. Inf. Fusion 2021, 68, 131–148. [Google Scholar] [CrossRef]
- Pathak, Y.; Shukla, P.K.; Tiwari, A.; Stalin, S.; Singh, S. Deep transfer learning based classification model for COVID-19 disease. Irbm 2022, 43, 87–92. [Google Scholar] [CrossRef] [PubMed]
- Das, A.K.; Kalam, S.; Kumar, C.; Sinha, D. TLCoV-An automated COVID-19 screening model using Transfer Learning from chest X-ray images. Chaos Solitons Fractals 2021, 144, 110713. [Google Scholar] [CrossRef] [PubMed]
- Aslan, M.F.; Unlersen, M.F.; Sabanci, K.; Durdu, A. CNN-based transfer learning–BiLSTM network: A novel approach for COVID-19 infection detection. Appl. Soft Comput. 2021, 98, 106912. [Google Scholar] [CrossRef] [PubMed]
- Punn, N.S.; Agarwal, S. Automated diagnosis of COVID-19 with limited posteroanterior chest X-ray images using fine-tuned deep neural networks. Appl. Intell. 2021, 51, 2689–2702. [Google Scholar] [CrossRef] [PubMed]
- Loey, M.; Smarandache, F.; Khalifa, N.E.M. Within the lack of chest COVID-19 X-ray dataset: A novel detection model based on GAN and deep transfer learning. Symmetry 2020, 12, 651. [Google Scholar] [CrossRef] [Green Version]
- Zhang, R.; Guo, Z.; Sun, Y.; Lu, Q.; Xu, Z.; Yao, Z.; Duan, M.; Liu, S.; Ren, Y.; Huang, L.; et al. COVID19XrayNet: A two-step transfer learning model for the COVID-19 detecting problem based on a limited number of chest X-ray images. Interdiscip. Sci. Comput. Life Sci. 2020, 12, 555–565. [Google Scholar] [CrossRef]
- Das, A.K.; Ghosh, S.; Thunder, S.; Dutta, R.; Agarwal, S.; Chakrabarti, A. Automatic COVID-19 detection from X-ray images using ensemble learning with convolutional neural network. Pattern Anal. Appl. 2021, 24, 1111–1124. [Google Scholar] [CrossRef]
- Luz, E.; Silva, P.; Silva, R.; Silva, L.; Guimarães, J.; Miozzo, G.; Moreira, G.; Menotti, D. Towards an effective and efficient deep learning model for COVID-19 patterns detection in X-ray images. Res. Biomed. Eng. 2021, 1–14. [Google Scholar] [CrossRef]
- Turkoglu, M. COVID-19 detection system using chest CT images and multiple kernels-extreme learning machine based on deep neural network. IRBM 2021, 42, 207–214. [Google Scholar] [CrossRef]
- Horry, M.J.; Chakraborty, S.; Paul, M.; Ulhaq, A.; Pradhan, B.; Saha, M.; Shukla, N. COVID-19 detection through transfer learning using multimodal imaging data. IEEE Access 2020, 8, 149808–149824. [Google Scholar] [CrossRef]
- Zhu, J.; Shen, B.; Abbasi, A.; Hoshmand-Kochi, M.; Li, H.; Duong, T.Q. Deep transfer learning artificial intelligence accurately stages COVID-19 lung disease severity on portable chest radiographs. PLoS ONE 2020, 15, e0236621. [Google Scholar] [CrossRef]
- Gianchandani, N.; Jaiswal, A.; Singh, D.; Kumar, V.; Kaur, M. Rapid COVID-19 diagnosis using ensemble deep transfer learning models from chest radiographic images. J. Ambient. Intell. Hum. Comput. 2020, 1–13. [Google Scholar] [CrossRef]
- Hira, S.; Bai, A.; Hira, S. An automatic approach based on CNN architecture to detect COVID-19 disease from chest X-ray images. Appl. Intell. 2021, 51, 2864–2889. [Google Scholar] [CrossRef]
- Ibrahim, A.U.; Ozsoz, M.; Serte, S.; Al-Turjman, F.; Yakoi, P.S. Pneumonia classification using deep learning from chest X-ray images during COVID-19. In Cognitive Computation; Springer: Berlin/Heidelberg, Germany, 2021; pp. 1–13. [Google Scholar]
- Kc, K.; Yin, Z.; Wu, M.; Wu, Z. Evaluation of deep learning-based approaches for COVID-19 classification based on chest X-ray images. Signal Image Video Process. 2021, 15, 959–966. [Google Scholar] [CrossRef]
- Canayaz, M. MH-COVIDNet: Diagnosis of COVID-19 using deep neural networks and meta-heuristic-based feature selection on X-ray images. Biomed. Signal Process. Control 2021, 64, 102257. [Google Scholar] [CrossRef]
- Das, N.N.; Kumar, N.; Kaur, M.; Kumar, V.; Singh, D. Automated deep transfer learning-based approach for detection of COVID-19 infection in chest X-rays. Irbm 2020. [Google Scholar] [CrossRef]
- Rodriguez, C.R.; Angeles, D.; Chafloque, R.; Kaseng, F.; Pandey, B. Deep learning audio spectrograms processing to the early COVID-19 detection. In Proceedings of the 2020 12th International Conference on Computational Intelligence and Communication Networks (CICN), Bhimtal, India, 25–26 September 2020; pp. 429–434. [Google Scholar]
- Loey, M.; Mirjalili, S. COVID-19 cough sound symptoms classification from scalogram image representation using deep learning models. Comput. Biol. Med. 2021, 139, 105020. [Google Scholar] [CrossRef]
- Imran, A.; Posokhova, I.; Qureshi, H.N.; Masood, U.; Riaz, M.S.; Ali, K.; John, C.N.; Hussain, M.I.; Nabeel, M. AI4COVID-19: AI enabled preliminary diagnosis for COVID-19 from cough samples via an app. Inform. Med. Unlocked 2020, 20, 100378. [Google Scholar] [CrossRef]
- Saeedizadeh, N.; Minaee, S.; Kafieh, R.; Yazdani, S.; Sonka, M. COVID TV-Unet: Segmenting COVID-19 chest CT images using connectivity imposed Unet. Comput. Methods Programs Biomed. Update 2021, 1, 100007. [Google Scholar] [CrossRef]
- Ma, J.; Wang, Y.; An, X.; Ge, C.; Yu, Z.; Chen, J.; Zhu, Q.; Dong, G.; He, J.; He, Z.; et al. Toward data-efficient learning: A benchmark for COVID-19 CT lung and infection segmentation. Med. Phys. 2021, 48, 1197–1210. [Google Scholar] [CrossRef]
- Yazdekhasty, P.; Zindari, A.; Nabizadeh-ShahreBabak, Z.; Roshandel, R.; Khadivi, P.; Karimi, N.; Samavi, S. Bifurcated autoencoder for segmentation of COVID-19 infected regions in CT images. In Proceedings of the International Conference on Pattern Recognition; Springer: Cham, Switzerland, 2021; pp. 597–607. [Google Scholar]
- Ranjbarzadeh, R.; Jafarzadeh Ghoushchi, S.; Bendechache, M.; Amirabadi, A.; Ab Rahman, M.N.; Baseri Saadi, S.; Aghamohammadi, A.; Kooshki Forooshani, M. Lung infection segmentation for COVID-19 pneumonia based on a cascade convolutional network from CT images. BioMed Res. Int. 2021, 2021. [Google Scholar] [CrossRef] [PubMed]
- Zheng, R.; Zheng, Y.; Dong-Ye, C. Improved 3D U-Net for COVID-19 Chest CT Image Segmentation. Sci. Programm. 2021, 2021, 9999368. [Google Scholar] [CrossRef]
- Chen, C.; Zhou, K.; Zha, M.; Qu, X.; Guo, X.; Chen, H.; Wang, Z.; Xiao, R. An effective deep neural network for lung lesions segmentation from COVID-19 CT images. IEEE Trans. Ind. Inform. 2021, 17, 6528–6538. [Google Scholar] [CrossRef]
- Yan, Q.; Wang, B.; Gong, D.; Luo, C.; Zhao, W.; Shen, J.; Ai, J.; Shi, Q.; Zhang, Y.; Jin, S.; et al. COVID-19 chest CT image segmentation network by multi-scale fusion and enhancement operations. IEEE Trans. Big Data 2021, 7, 13–24. [Google Scholar] [CrossRef]
- Frid-Adar, M.; Amer, R.; Gozes, O.; Nassar, J.; Greenspan, H. COVID-19 in CXR: From detection and severity scoring to patient disease monitoring. IEEE J. Biomed. Health Inform. 2021, 25, 1892–1903. [Google Scholar] [CrossRef]
- Degerli, A.; Ahishali, M.; Yamac, M.; Kiranyaz, S.; Chowdhury, M.E.; Hameed, K.; Hamid, T.; Mazhar, R.; Gabbouj, M. COVID-19 infection map generation and detection from chest X-ray images. Health Inf. Sci. Syst. 2021, 9, 1–16. [Google Scholar] [CrossRef]
- Wang, B.; Jin, S.; Yan, Q.; Xu, H.; Luo, C.; Wei, L.; Zhao, W.; Hou, X.; Ma, W.; Xu, Z.; et al. AI-assisted CT imaging analysis for COVID-19 screening: Building and deploying a medical AI system. Appl. Soft Comput. 2021, 98, 106897. [Google Scholar] [CrossRef]
- Zhao, S.; Li, Z.; Chen, Y.; Zhao, W.; Xie, X.; Liu, J.; Zhao, D.; Li, Y. SCOAT-Net: A novel network for segmenting COVID-19 lung opacification from CT images. Pattern Recognit. 2021, 119, 108109. [Google Scholar] [CrossRef]
- Zhao, X.; Zhang, P.; Song, F.; Fan, G.; Sun, Y.; Wang, Y.; Tian, Z.; Zhang, L.; Zhang, G. D2A U-Net: Automatic segmentation of COVID-19 CT slices based on dual attention and hybrid dilated convolution. Comput. Biol. Med. 2021, 135, 104526. [Google Scholar] [CrossRef]
- Chakraborty, S.; Mali, K. SuFMoFPA: A superpixel and meta-heuristic based fuzzy image segmentation approach to explicate COVID-19 radiological images. Expert Syst. Appl. 2021, 167, 114142. [Google Scholar] [CrossRef]
- Mortani Barbosa, E.J.; Georgescu, B.; Chaganti, S.; Aleman, G.B.; Cabrero, J.B.; Chabin, G.; Flohr, T.; Grenier, P.; Grbic, S.; Gupta, N.; et al. Machine learning automatically detects COVID-19 using chest CTs in a large multicenter cohort. Eur. Radiol. 2021, 31, 8775–8785. [Google Scholar] [CrossRef]
- Pei, H.Y.; Yang, D.; Liu, G.R.; Lu, T. MPS-net: Multi-point supervised network for ct image segmentation of COVID-19. IEEE Access 2021, 9, 47144–47153. [Google Scholar] [CrossRef]
- Saood, A.; Hatem, I. COVID-19 lung CT image segmentation using deep learning methods: U-Net versus SegNet. BMC Med. Imaging 2021, 21, 19. [Google Scholar] [CrossRef]
- Gerard, S.E.; Herrmann, J.; Xin, Y.; Martin, K.T.; Rezoagli, E.; Ippolito, D.; Bellani, G.; Cereda, M.; Guo, J.; Hoffman, E.A.; et al. CT image segmentation for inflamed and fibrotic lungs using a multi-resolution convolutional neural network. Sci. Rep. 2021, 11, 1455. [Google Scholar] [CrossRef]
- Teixeira, L.O.; Pereira, R.M.; Bertolini, D.; Oliveira, L.S.; Nanni, L.; Cavalcanti, G.D.; Costa, Y.M. Impact of lung segmentation on the diagnosis and explanation of COVID-19 in chest X-ray images. Sensors 2021, 21, 7116. [Google Scholar] [CrossRef]
- Rahman, T.; Khandakar, A.; Qiblawey, Y.; Tahir, A.; Kiranyaz, S.; Kashem, S.B.A.; Islam, M.T.; Al Maadeed, S.; Zughaier, S.M.; Khan, M.S.; et al. Exploring the effect of image enhancement techniques on COVID-19 detection using chest X-ray images. Comput. Biol. Med. 2021, 132, 104319. [Google Scholar] [CrossRef]
- Fung, D.L.; Liu, Q.; Zammit, J.; Leung, C.K.S.; Hu, P. Self-supervised deep learning model for COVID-19 lung CT image segmentation highlighting putative causal relationship among age, underlying disease and COVID-19. J. Transl. Med. 2021, 19, 1–18. [Google Scholar] [CrossRef]
- Wu, Y.H.; Gao, S.H.; Mei, J.; Xu, J.; Fan, D.P.; Zhang, R.G.; Cheng, M.M. Jcs: An explainable COVID-19 diagnosis system by joint classification and segmentation. IEEE Trans. Image Process. 2021, 30, 3113–3126. [Google Scholar] [CrossRef]
- Laradji, I.; Rodriguez, P.; Manas, O.; Lensink, K.; Law, M.; Kurzman, L.; Parker, W.; Vazquez, D.; Nowrouzezahrai, D. A weakly supervised consistency-based learning method for COVID-19 segmentation in ct images. In Proceedings of the IEEE/CVF Winter Conference on Applications of Computer Vision, Waikoloa, HI, USA, 4–8 January 2021; pp. 2453–2462. [Google Scholar]
- Wang, Y.; Zhang, Y.; Liu, Y.; Tian, J.; Zhong, C.; Shi, Z.; Zhang, Y.; He, Z. Does non-COVID-19 lung lesion help? investigating transferability in COVID-19 CT image segmentation. Comput. Methods Prog. Biomed. 2021, 202, 106004. [Google Scholar] [CrossRef]
- Oulefki, A.; Agaian, S.; Trongtirakul, T.; Laouar, A.K. Automatic COVID-19 lung infected region segmentation and measurement using CT-scans images. Pattern Recognit. 2021, 114, 107747. [Google Scholar] [CrossRef]
- Gao, K.; Su, J.; Jiang, Z.; Zeng, L.L.; Feng, Z.; Shen, H.; Rong, P.; Xu, X.; Qin, J.; Yang, Y.; et al. Dual-branch combination network (DCN): Towards accurate diagnosis and lesion segmentation of COVID-19 using CT images. Med. Image Anal. 2021, 67, 101836. [Google Scholar] [CrossRef] [PubMed]
- Aradhya, V.; Mahmud, M.; Guru, D.; Agarwal, B.; Kaiser, M.S. One-shot cluster-based approach for the detection of COVID–19 from chest X–ray images. Cognit. Comput. 2021, 13, 873–881. [Google Scholar] [CrossRef] [PubMed]
- Jadon, S. COVID-19 detection from scarce chest X-ray image data using few-shot deep learning approach. In Proceedings of the Medical Imaging 2021: Imaging Informatics for Healthcare, Research, and Applications; International Society for Optics and Photonics: Bellingham, WA, USA, 2021; Volume 11601, p. 116010X. [Google Scholar]
- Jiang, Y.; Chen, H.; Ko, H.; Han, D.K. Few-shot learning for ct scan based COVID-19 diagnosis. In Proceedings of the ICASSP 2021-2021 IEEE International Conference on Acoustics, Speech and Signal Processing (ICASSP), Virtual, 6–12 June 2021; pp. 1045–1049. [Google Scholar]
- Szucs, G.; Németh, M. Double-view matching network for few-shot learning to classify COVID-19 in X-ray images. Infocommun. J. 2021, 13, 26–34. [Google Scholar] [CrossRef]
- Aradhya, V.M.; Mahmud, M.; Chowdhury, M.; Guru, D.; Kaiser, M.S.; Azad, S. Learning Through One Shot: A Phase by Phase Approach for COVID-19 Chest X-ray Classification. In Proceedings of the 2020 IEEE-EMBS Conference on Biomedical Engineering and Sciences (IECBES), Langkawi, Malaysia, 1 December 2020–3 March 2021; pp. 241–244. [Google Scholar]
- Chen, X.; Yao, L.; Zhou, T.; Dong, J.; Zhang, Y. Momentum contrastive learning for few-shot COVID-19 diagnosis from chest CT images. Pattern Recognit. 2021, 113, 107826. [Google Scholar] [CrossRef]
- Shorfuzzaman, M.; Hossain, M.S. MetaCOVID: A Siamese neural network framework with contrastive loss for n-shot diagnosis of COVID-19 patients. Pattern Recognit. 2021, 113, 107700. [Google Scholar] [CrossRef]
- Karnes, M.; Perera, S.; Adhikari, S.; Yilmaz, A. Adaptive Few-Shot Learning PoC Ultrasound COVID-19 Diagnostic System. In Proceedings of the 2021 IEEE Biomedical Circuits and Systems Conference (BioCAS), Virtual, 7–9 October 2021; pp. 1–6. [Google Scholar]
- Piret, J.; Boivin, G. Pandemics throughout history. Front. Microbiol. 2021, 11, 631736. [Google Scholar] [CrossRef]
- Zietz, B.P.; Dunkelberg, H. The history of the plague and the research on the causative agent Yersinia pestis. Int. J. Hyg. Environ. Health 2004, 207, 165–178. [Google Scholar] [CrossRef]
- Faruque, S.M.; Albert, M.J.; Mekalanos, J.J. Epidemiology, genetics, and ecology of toxigenic Vibrio cholerae. Microbiol. Mol. Biol. Rev. 1998, 62, 1301–1314. [Google Scholar] [CrossRef] [Green Version]
- Johnson, N.P.; Mueller, J. Updating the accounts: Global mortality of the 1918–1920 “Spanish” influenza pandemic. Bull. Hist. Med. 2002, 76, 105–115. [Google Scholar] [CrossRef]

Disclaimer/Publisher’s Note: The statements, opinions and data contained in all publications are solely those of the individual author(s) and contributor(s) and not of MDPI and/or the editor(s). MDPI and/or the editor(s) disclaim responsibility for any injury to people or property resulting from any ideas, methods, instructions or products referred to in the content. |
© 2023 by the authors. Licensee MDPI, Basel, Switzerland. This article is an open access article distributed under the terms and conditions of the Creative Commons Attribution (CC BY) license (https://creativecommons.org/licenses/by/4.0/).
Share and Cite
Hasan, M.M.; Islam, M.U.; Sadeq, M.J.; Fung, W.-K.; Uddin, J. Review on the Evaluation and Development of Artificial Intelligence for COVID-19 Containment. Sensors 2023, 23, 527. https://doi.org/10.3390/s23010527
Hasan MM, Islam MU, Sadeq MJ, Fung W-K, Uddin J. Review on the Evaluation and Development of Artificial Intelligence for COVID-19 Containment. Sensors. 2023; 23(1):527. https://doi.org/10.3390/s23010527
Chicago/Turabian StyleHasan, Md. Mahadi, Muhammad Usama Islam, Muhammad Jafar Sadeq, Wai-Keung Fung, and Jasim Uddin. 2023. "Review on the Evaluation and Development of Artificial Intelligence for COVID-19 Containment" Sensors 23, no. 1: 527. https://doi.org/10.3390/s23010527