Article

Neural Modelling in the Exploration of the Biomethane Potential from Cattle Manure: A Case Study on Herds Structure from Wielkopolskie, Podlaskie, and Mazowieckie Voivodeships in Poland

Department of Biosystems Engineering, Poznan University of Life Sciences, Wojska Polskiego 28, 60-637 Poznan, Poland
*
Authors to whom correspondence should be addressed.
Sensors 2023, 23(1), 164; https://doi.org/10.3390/s23010164
Submission received: 14 November 2022 / Revised: 2 December 2022 / Accepted: 20 December 2022 / Published: 23 December 2022
(This article belongs to the Section Smart Agriculture)

Abstract

:
In the presented study, data on the size and structure of cattle herds in Wielkopolskie, Podlaskie, and Mazowieckie voivodeships in 2019 were analyzed and subjected to modelling with the use of artificial intelligence, namely artificial neural networks (ANNs). The potential amount of biogas (m3) from cattle manure and slurry for the analyzed provinces was as follows: for the Mazowieckie Voivodeship, 800,654,186 m3; for the Podlaskie voivodeship, 662,655,274 m3; and for the Wielkopolskie voivodeship, 657,571,373 m3. Neural modelling was applied to find the relationship between the structure of the herds and the amount of generated slurry and manure (biomethane potential), as well as to indicate the most important animal types participating in biogas production. In each of the analyzed cases, the three-layer MLP perceptron with a single hidden layer proved to be the most optimal network structure. Sensitivity analysis of the generated models concerning herd structure showed a significant contribution of dairy cows to the methanogenic potential for both slurry and manure. The amount of slurry produced in the Mazowieckie and Wielkopolskie voivodeships was influenced in turn by heifers (both 6–12 and 12–18 months old) and bulls 12–24 months old, and in the Podlaskie voivodeship by calves and heifers 6–12 months old. As for manure, in addition to cows, bulls 12–24 months old and heifers 12–18 represented the main factor for Mazowieckie and Wielkopolskie voivodeships, and heifers (both 6–12 and 12–18 months old) for Podlaskie voivodeship.

1. Introduction

Biomethane plays an important role in meeting the European Union (EU) 2030 greenhouse gas emissions reduction target and will help in achieving net-zero emissions by 2050. Additionally, biomethane increases European energy security by reducing the dependency on Russian natural gas and can alleviate energy cost pressure on households and companies [1].
The 2020 EU natural gas consumption is 400 bcm (billion cubic meters), 155 bcm of which was imported from Russia. Therefore, searching for alternative energy sources is of great importance [1].
Animal manure can be a good raw material for biogas production as an additional energy source for producing heat and/or electricity [2,3,4].
Poland is one of leaders in the European Union in animal breeding [5]. In Poland, in 2019, there were 6358 thousand LSU (Livestock Unit) of cattle including 2461 thousand LSU of cows. Within the polish voivodships, most cattle were raised in: Mazowieckie, with 558.8 thousand heads; Podlaskie, with 457.2 thousand LSU; and Wielkopolskie, with 279.3 thousand LSU [6]. Polish agriculture produced 99 million tons of feces from cows and pigs, including 78 million tons of manure [7]. In comparison, in the European Union and UK, animal farming generated more than 1.4 billion tons of manure annually in the 2016–2019 [8]. Six major countries (Germany, Spain, France, Italy, Poland, United Kingdom) produce about 68% of the total manure, while Ireland (84 million tons) and the Netherlands (73 million tons) also make important contributions [9]. More than 75% of the produced manure comes from cattle, while approximately 12% comes from pigs and chickens [10].
Manure management, i.e., the acquisition, storage, processing, and use of natural fertilizers, affects the profitability of livestock operations and can affect environmental quality [11]. Polish agriculture is a large producer of atmospheric emissions of CH4 and N2O [12]. Most CH4 comes from manure produced by cattle (54%) and pigs (31%). N2O emissions from manure management amounted to 9.4 kt in 2019 and have decreased by 32% since 1988, which is mainly related to the decline in livestock populations. In this category, direct emissions account for about 49% and indirect emissions 51% of N2O emissions [13].
Among Baltic Sea countries, Poland ranks second in terms of the number of biogas plants, biofuel installed capacity, and pellet plants [14]. It is planned in near future that in Poland troublesome waste in the form of manure and slurry will be disposed of by agricultural biogas plants located mostly near large animal farms [15]. Due to the high cattle population, Poland takes a leading position among the European Union countries in terms of the amount of manure produced. However, its use in this country is primarily limited to fertilizing farmland [16]. Animal manure has a high biomethane potential and cattle manure is reported as the most promising [5].
The first known calculations of the biomethane potential based on cattle excrement data in Poland from 2018 were made in 2021 [7]. The visualization concerning voivodeships included in this study is presented on Figure 1.
The previously published data on possibilities of biogas production in Poland based on the data concerning livestock and poultry population in 2010–2016 indicates Wielkopolskie, Mazowieckie, and Podlaskie voivodeships as the biggest potential biogas producers. However, authors indicated that in order to reach such a potential, the building of biogas plants is required, especially in Podlaskie voivodeship [5].
Estimations of biogas potential in Europe show that up to 41 bcm of biomethane in 2030 and 151 bcm in 2050 could be available. It is predicted that Germany would become the leading producer of biogas in 2030, followed by France and Italy. In the ranking of possible biogas producers, Poland is ranked fifth [1].
In the topic of biogas, neural networks have been used in many aspects, such as biogas yield optimization [17,18] or biogas production prediction [19,20,21]. ANNs have been previously used to model an anaerobic fermentation process [17,18], for biogas production integrated with wastewater purification considering both technological aspects of the process and treated wastewater quality [22], or for biogas production from food, fruits, and vegetables wastes [23], as well as from mixed lignocellulosic co-substrates [21]. ANN model was mainly used defining the optimum region in biogas production [24,25,26]. ANN combined with non-linear regression models were developed to predict the biogas production rate from anaerobic hybrid reactor [20,21,27,28] and as an element of the optimization strategy for biogas production from wastes [24]. Concerning biogas from animal wastes, ANNs were used for the optimization of production from poultry [26] or cattle manure [29,30,31]. ANNs were also used to model and predict the synergistic effect between anaerobic digestion and aerobic process in order to achieve maximum biogas production [32].
To date, there are no publications on the application of artificial intelligence, including artificial neural networks in assessing the impact of cattle herd structure on the amount of biogas extracted from manure or slurry (biomethane potential). Therefore, the aim of the presented research was to conduct a case study of biomethane potential for the Wielkopolskie, Podlaskie, and Mazowieckie voivodeships in Poland. The aim was to find the relationship between the structure of the herds and the amount of the generated slurry and manure (biomethane potential). The data were subjected to neural modelling to indicate the most important animal types participating in biogas production.

2. Materials and Methods

2.1. Obtaining Data for Modelling

Three voivodeships characterized by the highest number of cattle raised and a high expected biogas potential were selected for the study: Podlaskie, Mazowieckie, and Wielkopolskie voivodeships (see Figure 1). Podlaskie voivodeship, located in the north-eastern part of Poland, covers an area of 2,018,702 km2. Mazowieckie voivodeship is the largest in terms of area and population, located in the central and eastern part of Poland which covers an area of 3,555,847 km2, and Wielkopolskie voivodeship is located in central-western Poland covering an area of 2,982,650 km2.
Data for modeling were obtained through the following procedures [7]:
  • Collection of data from the Agency for Restructuring and Modernization of Agriculture (raw data disclosed by the Agency at the request of A. Wawrzyniak). The data concerned livestock production in rural areas by municipality/province. The data obtained concerned cattle counts in the provinces of Poland selected for the study.
  • Averaging of cattle numbers in province-level data converted to livestock unit (LSU) using conversional factors from the 2010 GUS Agricultural Census [33] dedicated to cattle and specific livestock systems (as in Table 1).
  • Calculation of the amount of waste generated from keeping cattle. Calculations performed separately for manure and for slurry. Calculations were made on the basis of literature data [33].
The following equation was used to calculate amount of slurry:
L o = ( x × L S U ) × ( 1 S B S S s + S B S ) × O   ( tons )
while the equation as below was used for calculation of the amount of manure:
L G = ( x × L S U ) × ( S B S S s + S B S )   ( m 3 )
where:
  • L o : amount of manure (tons)
  • L G : amount of slurry (m3)
  • x: cattle population (units)
  • LSU: Livestock Unit. An index of animals per unit according to Regulation of the Council of Ministers of 12 February 2020 [34].
  • O: average amount of manure per year per cattle unit (Mg/LSU·year)
  • S B S and S s are the conversional factorsbased on animal keeping systems in barns as listed in Table 1.
The amount of obtained biogas was calculated on the basis of [35].
It was assumed for cattle that:
-
One ton of manure produces an average of 60 m3 of biogas
-
1 m3 of slurry produces 28 m3 of biogas on average
-
The calorific value of biogas is between 19 and 23 (MJ/m3)
Therefore, the potential amount of biogas obtained for cattle P b (m3) was calculated as follows:
P b = ( L G · P G + L o · P G )   [ m 3 ]
where:
  • P G : average amount of biogas containing 60% methane from a unit amount of animal feces (m3∙(tons or m3) −1)
  • L G : estimated amount of slurry (m3)
  • L o : estimated amount of manure (tons)

2.2. Simulation Studies

Data consisted of 108, 308, and, 213 cases, respectively, for Podlaskie, Mazowieckie, and Wielkopolskie voivodeships. The data were divided into teaching, validating, and test sets in a 2:1:1 ratio, which was 54/27/27, 154/77/77, and 107/53/53/, respectively, for Podlaskie, Mazowieckie, and Wielkopolskie voivodeships. The neural network had 7 independent input variables (input: 1, 2, … …, 7) and 1 output variable (one from O-1 through O-2, either for slurry as for manure for the examined voivodeship) (marked as in Table 2). The structure of the input set was adjusted to the requirements of the ANN simulator implemented in the commercial STATISTICA package (v13.3, Statsoft, Cracow, Poland).
Table 3 shows the exemplary structure of training file for Podlaskie voivodeship.
The ANN simulator was focused on 4 standard ANN topologies: Linear, GRNN (generalized regression neural network), MLP (multi-layer perceptron), and RBF (radial basis function). In all the created networks, the input layer consisted of 7 neurons with a linear PSP (postsynaptic function) and a linear activation function. The hidden layers consisted of a different number of sigmoid neurons, i.e., having a linear PSP function and a logistic activation function. Single sigmoid neuron was obtained as the output of the networks. The generated neural models were trained by the method was BP (back propagation–back propagation of errors) in 5 cycles of 1200 epochs and optimized with the CG (conjugate gradients) algorithm for 200 epochs. In the process of training the network, the Levenberg–Marquardt algorithm was used, tuning the network through 50 epochs. The following parameters were adopted in the learning process with the BP error back propagation algorithm: decreasing learning coefficient (from η = 0.3 to η = 0.03), momentum factor α = 0.4.
The structure and complexity of the ANN (artificial neural network) was determined after several test runs. In our case, 100 networks were tested and 20 were retained. The system automatically assessed the effectiveness of the best network as excellent (under condition that low regression coefficient and correlation approaching to 1 was obtained). The degree of accuracy required for prediction usually varies from application to application. However, roughly, it was assumed that the standard deviation quotient equal to 0.1 (or less) proved a good regression realization by the generated ANN, and above 0.7 (or more) disqualified the generated neural model. Regression statistics were determined independently by standard: for the training and test sets.

3. Results

3.1. Biomethane Potential in the Analysed Voivodeships

Analysis of the data from the Agency for Restructuring and Modernization of Agriculture in 2013–2018 showed that the structure of livestock was as follows: pigs 64–72%; cattle 27–34%; sheep approximately 1%, and goats less than 1%. The highest percentage of cattle breeding was recorded in 2019 in the Mazowieckie, Podlaskie, and Wielkopolskie voivodeships.
The highest potential for biogas production from cattle manure in Poland in 2019 occurred in the Mazowieckie Voivodeship. The potential amount of biogas (m3) from cattle manure and slurry in 2019 for the analyzed provinces was as follows: for the Mazowieckie Voivodeship, 800,654,186 m3; for the Podlaskie Voivodeship, 662,655,274 m3; and for the Wielkopolskie Voivodeship, 657,571,373 m3. Detailed analyses can be found in Supplementary Materials File S1 tables (SF1).

3.2. Results on ANN Simulation

Although The ANN simulator was focused on four different ANN topologies: linear, GRNN (generalized regression neural network), MLP (multi-layer perceptron), and RBF (radial basis function), the generated topologies selected as optimal were ANNs of the MLP (multi-layer perceptron). A graphical representation of the structure of the generated networks is shown in Figure 2 and the regressions statistics of the obtained optimal neural models in Table 4.
Table 5 shows the sensitivity analysis for each of the seven input variables separately for the training and validation files. The compliance of indications for both subfiles is an indicator of the correctness of the assessment of the sensitivity.
Sensitivity is given in the form of three parameters, namely Rank, Error, and Quotient. The key issue in the sensitivity analysis is to define the “importance” of variables. In ANNs, the input variables are ordered according to the loss suffered by the network when the variable is turned off. The basic error is the Error, indicating the quality of the generated ANN in the absence of a given variable. A large value indicates that the network loses a lot without this variable. The quotient is the result of dividing the Error by the error obtained using all the variables. Sensitivity analysis gives an insight into the utility (significance level) of an individual input variable (the lower the variable’s rank, the higher the level of its significance in the generated neural model), indicating variables that (without losing network quality) can be omitted and key variables that should not be omitted.

4. Discussion

4.1. Biomethane Potential in the Analysed Voivodeships

The largest amount of cattle-derived manure was produced in Wielkopolskie, Podlaskie, and Mazowieckie voivodeships, accounting for 45% of the total manure in Poland. This is in consistence with the previous publication based on data from 2018 year where the same voivodeships were indicated as the largest cattle breeders. The amount of manure and slurry from livestock production depends on the size of livestock farms, and thus the amount of breed animals. Our calculations show that the examined voivodeships produced the most cattle manure, namely 51% of the manure in Poland.
The total production of cattle manure and slurry exceeds 76 million Mg per 2018 year. The apparent leaders included three voivodeships: Mazowieckie, Wielkopolskie, and Podlaskie [7]. Similar studies have been previously performed on data from 2010–2016 by Kozłowski et al. [5].
The highest potential for biogas production from cattle manure in Poland in 2019 occurred in the Mazowieckie Voivodeship. The potential amount of biogas [m3] from cattle manure and slurry in 2019 for the analyzed provinces was as follows: for the Mazowieckie Voivodeship, 800,654,186 m3; for the Podlaskie Voivodeship, 662,655,274 m3; and for the Wielkopolskie Voivodeship, 657,571,373 m3. Detailed analyses can be found in Supplementary Materials File S1 tables (SF1).
The obtained values for biogas potential (amount of biogas in m3) were lower from that previously calculated for the examined voivodeships, differing by 5.11%, 1.12%, and 1.75%, respectively, for Podlaskie, Wielkopolskie, and Mazowieckie voivodeships. The main reason for the differences in biogas potential compared to the previous evaluation is a gradual decrease in the pig population in Poland along with the increase in the cattle population [34,35,36].
Due to extensive agriculture, Poland is characterized by a large availability of organic waste streams that can be utilized for energy. Unfortunately, due to the lack of stable support for the development of this renewable energy sector in Poland in previous years, as of today, only 123 agricultural biogas plants operate in it (as of December 2022). The annual capacity of these installations for the production of agricultural biogas is approximately 335.335 million m3 to generate electricity. In total, 732.645 GWh of electricity was produced from agricultural biogas, of which approximately 607.708 GWh was sold to obliged sellers and other recipients [37].

4.2. ANN Simulation

The formulated prediction problem as the effect of a herd structure on the biogas production was best solved by the ANN of the multilayer perceptron type. The conducted analysis allowed for the conclusion that, for the correct prediction of the amount of produced biogas, the knowledge contained in the variables representing the information on the amount of manure produced by cows, heifers, calves, and bulls is sufficient.
Regression analysis of the generated neural models showed that the best predictive ability was achieved by the neural topology of the three-layer perceptron type containing 2–7 neurons in the hidden layer. Variables ranked from 1 to 3 (Table 5) include information on the type of animals that have the greatest impact on the amount of biogas generated. Sensitivity analysis of the model concerning herd structure showed a significant contribution of dairy cows to the methanogenic potential for all the examined voivodeships for both slurry and manure. The amount of slurry produced in the Mazowieckie and Wielkopolskie voivodeships was influenced in turn by heifers (both 6–12 and 12–18 months old) and bulls 12–24 months old, while in the Podlaskie voivodeship by calves and heifers 6–12 months old. As for manure, in addition to cows, bulls 12–24 months old and heifers 12–18 were the main factor for Mazowieckie and Wielkopolskie voivodeships, and heifers (both 6–12 and 12–18 months old) for Podlaskie voivodeship.
For dairy cows, the first 100 days of lactation represent the most demanding period in feeding. Heifers over 12 months of age were another significant factor. This is probably related to the nutritional requirements of this group of animals in the herd: young heifers should consume 6–9 kg of dry matter of feed per day, and the weight gain from protein should already be 0.4 kg greater than its gain from energy. This is the group of animals in the herd with the highest nutritional requirements and therefore one that needs the most intensive feeding [34]. Calves right after birth are fed colostrum and then powdered milk or whey. Feeding animals with forage is common in breeding herds [35].
The only exception in the presented results are early-maturing bulls. This difference may be due to the fact that in young animals the daily weight gain is mainly dominated by meat tissue. The older the animal gets, the more often they deposit fat rather than protein, resulting in an increase in adipose tissue. This results in an increase in energy requirements [36,37,38].
The analysis showed clear differences between Podlaskie and other voivodeships. In addition to the factor related to nutrition, the location of the far-regional factors and the economic situation can have an impact on the obtained results. A common practice of farms in Poland is to arrange feed rations based on the feeds that are available on the farm/region [39,40]. The methanogenic potential in the herd will therefore depend on the category of animals. The method of feeding (depending on the availability of feeds and their price) can be an additional factor. The differing animal keeping systems are also notable.
In a broader perspective, research on the influence of herd structure on the amount of biogas harvested may allow breeders to more carefully select the number and structure (type) of animals. We suspect that the way animals are breeding in the eastern and western parts of Poland may affect the amount of the obtained biogas. This is an issue we intend to study in more detail on data from across Poland.

5. Conclusions

The potential amount of biogas (m3) from cattle manure and slurry in 2019 for the analyzed provinces was as follows: for the Mazowieckie Voivodeship, 800,654,186 m3; for the Podlaskie Voivodeship, 662,655,274 m3; and for the Wielkopolskie Voivodeship, 657,571,373 m3.
The results of the network sensitivity analysis indicate a significant contribution of dairy cows in the herd structure in maximizing both slurry and manure production. The next categories of animals are heifers of different weight, calves, and bulls.
The obtained research results confirm the that artificial neural networks can be an effective tool in supporting the process of forecasting biogas production from cattle feces based on the structure of the herd.

Supplementary Materials

The following supporting information can be downloaded at: https://www.mdpi.com/article/10.3390/s23010164/s1, File S1: Detailed data on cattle number and herd structure for Wielkopolskie, Podlaskie and Mazowieckie voivodeships in Poland (including individual districts).

Author Contributions

Data curation, A.S. and P.B.; formal analysis, A.P. and A.S.; investigation, A.S. and P.B.; methodology, A.W., A.S. and P.B.; project administration, A.S.; resources, A.S.; software, A.P. and P.B.; supervision, A.S.; validation, A.W., A.P., A.S. and P.B.; writing—original draft, A.W., A.P. and A.S.; writing—review & editing, P.B. All authors have read and agreed to the published version of the manuscript.

Funding

This research received no external funding.

Institutional Review Board Statement

Not applicable.

Informed Consent Statement

Not applicable.

Data Availability Statement

Data available on request.

Conflicts of Interest

The authors declare no conflict of interest.

References

  1. Alberici, S.; Grimme, W.; Toop, G. Biomethane production potentials in the EU. In Feasibility of REPower EU 2030 Targets, Production Potentials in the Member States and Outlook to 2050, A Gas for Climate Report; Guidehouse Netherlands B.V.: Utrecht, The Netherlands, 2022; pp. 1–35. Available online: https://www.europeanbiogas.eu/wp-content/uploads/2022/07/GfC_national-biomethane-potentials_070722.pdf (accessed on 5 June 2022).
  2. Ramos-Suárez, J.L.; Ritterb, A.; Mata González, V.; Camacho Pérez, A. Biogas from animal manure: A sustainable energy opportunity in the Canary Islands. Renew. Sustain. Energy Rev. 2019, 104, 137–150. [Google Scholar] [CrossRef]
  3. Płatek, W. Methane from biogas as one of methods for natural gas supplying diversification in Poland. Energy Policy J. 2007, 10, 17–329. [Google Scholar]
  4. Zbytek, Z.; Adamczyk, F. Możliwości wykorzystywania biomasy stałej. Część 1. Uwarunkowania prawne i podział biomasy stałej. [Possibilities of using solid biomass. Part 1. Legal conditions and division of solid biomass]. For. Hortic. Agric. Technol. 2017, 2, 26–28. (In Polish) [Google Scholar]
  5. Kozłowski, K.; Dach, J.; Lewicki, A.; Malińska, K.; do Carmo, I.E.P. Potential of biogas production from animal manure in Poland. Arch. Environ. Prot. 2019, 45, 99–108. [Google Scholar]
  6. National Agricultural Census. Statistical Yearbook of Agriculture. 2020; ISSN-2080-8798. Available online: https://stat.gov.pl/obszary-tematyczne/roczniki-statystyczne/roczniki-statystyczne/rocznik-statystyczny-rolnictwa-2020,6,14.html (accessed on 15 June 2022).
  7. Wawrzyniak, A.; Pochwatka, A.; Lewicki, A.; Sołowiej, P.; Czekała, W. Database system for estimating the biogas potential of cattle and swine feces in Poland. J. Ecol. Eng. 2021, 22, 111–120. [Google Scholar] [CrossRef]
  8. Koninger, J.; Lugato, E.; Panagos, P.; Kochupillali, M.; Orgiazzi, A.; Briones, J.I.M. Manure management and soil biodiversity: Towards more sustainable food systems in the EU. Agric. Syst. 2021, 194, 103251. [Google Scholar] [CrossRef]
  9. Eurostat. Treatment of Waste by Waste Category, Hazardousness and Waste Management Operations for Animal Faeces, Manure and Urine. Available online: https://ec.europa.eu/eurostat/databrowser/view/ENV_WASTRT__custom_795114/default/table?lang=en (accessed on 5 June 2022).
  10. Eurostat. Agri-Environmental Indicator-Livestock Patterns. Available online: https://ec.europa.eu/eurostat/statistics-explained/index.php?title=Agri-environmental_indicator_-_livestock_patterns#Focus_on_the_agricultural_holdings_with_livestock_in_2016 (accessed on 5 June 2022).
  11. Horn van, H.H.; Wilkie, C.A.; Powers, J.W.; Nordstedt, A.R. Components of dairy manure management systems. J. Dairy Sci. 1994, 77, 2008–2030. [Google Scholar] [CrossRef]
  12. Witkowska-Dąbrowska, M. Changes in the amount of greenhouse gases and ammonia emissions to air from agricultural activities in Poland and the EU–analyzes using sustainable development indicators. Probl. World Agric. 2018, 18, 303–314. [Google Scholar] [CrossRef] [Green Version]
  13. Poland’s National Inventory Report 2019. Greenhouse Gas Inventory for 1988–2017, National Center for Balancing and Management of Emissions. Available online: https://www.kobize.pl/pl/fileCategory/id/16/krajowa-inwentaryzacja-emisji (accessed on 5 June 2022).
  14. Stolarski, M.J.; Warmiński, K.; Krzyżaniak, M.; Olba–Zięty, E.; Akincza, M. Bioenergy technologies and biomass potential vary in Northern European countries. Renew. Sustain. Energy Rev. 2020, 133, 110238. [Google Scholar] [CrossRef]
  15. Piechota, G.; Igliński, B. Biomethane in Poland—Current Status, Potential, Perspective and Development. Energies 2021, 14, 1517. [Google Scholar] [CrossRef]
  16. Bojarski, W.; Pulka, J.; Pochwatka, P.; Bresz, P.; Nowak, M.; Dach, J. Energetic Potential of Dairy Cow Breeding in Poland. In Farm Machinery and Processes Management in Sustainable Agriculture, FMPMSA; Pascuzzi, S., Santoro, F., Eds.; Lecture Notes in Civil Engineering; Springer: Berlin/Heidelberg, Germany, 2022; Volume 289, pp. 115–121. [Google Scholar] [CrossRef]
  17. Iweka, S.C.; Owuama, K.C.; Chukwuneke, J.L.; Falowo, O.A. Optymization of biogas yield from anaerobic co-digestion of corn-chaff and cow dung digestate: RSM and python approach. Heliyon 2021, 7, e08255. [Google Scholar] [CrossRef] [PubMed]
  18. Albari, M.; Abubaker, A.; Darwish, A.A.; Sammeer, A.-D.; Ayadi, O.; Hjouj, D.; Al-Ghussan, L. Optimization of energy production from biogas fuel in a closed landfill using artificial neural networks: A case study of Al Ghabawi Landfill, Jordan. Waste Manag. 2022, 150, 218–226. [Google Scholar] [CrossRef]
  19. Antwi, P.; Li, J.; Boadi, P.O.; Meng, J.; Shi, E.; Deng, K.; Bondinuba, F.K. Estimation of biogas and methane yields in an UASB treating potato starch processing wastewater with backpropagation artificial neural network. Bioresour. Technol. 2017, 228, 106–115. [Google Scholar] [CrossRef] [PubMed]
  20. Ghatak, M.; Ghatak, A. Artificial neural network model to predict behaviour of biogas production curve from mixed ligninocellulosic cosubstrates. Fuel 2018, 232, 178–189. [Google Scholar] [CrossRef]
  21. Yukesh Kannah, R.; Bhava Rohini, K.; Gunasekaran, M.; Gokulakrishnan, K.; Kumar, G.; Rajesh Banu, J. Prediction of effective substrate concentration and its impact of biogas prediction using Artificial Neural Network in Hybrid Upflow anaerobic sludge blanket reactor for treating landfill leachate. Fuel 2022, 313, 122697. [Google Scholar] [CrossRef]
  22. Neto, J.G.; Ozorio, L.V.; Campos de Abreu, T.C.; dos Santosa, B.F.; Florian Pradelle, F. Modeling of biogas production from food, fruits and vegetables wastes using artificial neural network (ANN). Fuel 2021, 285, 119081. [Google Scholar] [CrossRef]
  23. Gopal, L.C.; Govindarajan, M.; Kavipriya, M.R.; Mahboob, S.; Al-Ghanim, K.A.; Virik, P.; Zubair, A.; Al-Mulhm, N.; Senthilkumaran, V.; Shankar, V. Optimization strategies for improved biogas production by recycling of waste through response surface methodology and artificial neural network: Sustainable energy perspective research. J. King Saud. Univ.-Sci. 2021, 33, 101241. [Google Scholar] [CrossRef]
  24. Aklilu, E.G.; Waday, Y.A. Optimizing the process parameters to maximize biogas yield from anaerobic co-digestion of alkali-treated corn stover and poultry manure using artificial neural network and response surface methodology. Biomass Conv. Bioref. 2021. [Google Scholar] [CrossRef]
  25. Rego, A.S.C.; Augusta, S.; Leite, F.; Leiteb, B.S.; Grillo, A.V.; Santos, B.F. Artificial Neural Network Modelling for Biogas Production in Biodigesters. Chem. Eng. Trans. 2019, 74, 25–30. [Google Scholar]
  26. Tufaner, F.; Demirci, Y. Prediction of biogas production rate from anaerobic hybrid reactor by artificial neural network and nonlinear regressions models. Clean Technol. Environ. Policy 2020, 22, 713–724. [Google Scholar] [CrossRef]
  27. Sakiewicz, P.; Piotrowski, K.; Ober, J.; Karwot, J. Innovative artificial neural network approach for integrated biogas–wastewater treatment system modelling: Effect of plant operating parameters on process intensification. Renew. Sustain. Energy Rev. 2020, 124, 109784. [Google Scholar] [CrossRef]
  28. Tufaner, F.; Avşar, Y.; Gönüllü, M.T. Modeling of biogas production from cattle manure with co-digestion of different organic wastes using an artificial neural network. Clean Technol. Environ. Policy 2017, 19, 2255–2264. [Google Scholar] [CrossRef]
  29. Almomani, F. Prediction of biogas production from chemically treated co-digested agricultural waste using artificial neural network. Fuel 2020, 280, 118573. [Google Scholar] [CrossRef]
  30. Okwu, M.O.; Samuel, O.D.; Otanocha, O.B.; Tartibu, L.K.; Omoregbee, H.O.; Mbachu, V.M. Development of ternary models for prediction of biogas yield in a novel modular biodigester: A case of fuzzy Mamdani model (FMM), artificial neural network (ANN), and response surface methodology (RSM). Biomass Conv. Bioref. 2020. [Google Scholar] [CrossRef]
  31. Chen, W.-Y.; Chan, Y.J.; Lim, J.W.; Liew, C.S.; Mohamad, M.; Ho, C.-D.; Usman, A.; Lisak, G.; Hara, H.; Tan, W.-N. Artificial Neural Network (ANN) Modelling for Biogas Production in Pre-Commercialized Integrated Anaerobic-Aerobic Bioreactors (IAAB). Water 2022, 14, 1410. [Google Scholar] [CrossRef]
  32. GUS Agricultural Census. Livestock and Selected Elements of Animal Production Method, 1390; GUS Agricultural Census: Warsaw, Poland, 2010. [Google Scholar]
  33. Regulation of the Council of Ministers of 12 February 2020. Position 243. Available online: https://isap.sejm.gov.pl/isap.nsf/DocDetails.xsp?id=WDU20200000243 (accessed on 2 December 2022). (In Polish)
  34. Myczko, M.; Myczko, R.; Kołodziejczyk, T.; Golimowska, R.; Lenarczyk, J.; Janas, Z.; Kliber, A.; Karłowski, J.; Dolska, M. Budowa i Eksploatacja Biogazowni Rolniczych [Construction and Operation of Agricultural Biogas Plants]. Instytut Technologiczno-Przyrodniczy. Poznań. 2011. Available online: https://www.itp.edu.pl/old/wydawnictwo/indexbf07.html?id=budowa&a=inne (accessed on 5 June 2022). (In Polish).
  35. Pogłowie Bydła Grudzień. 2018. Available online: https://stat.gov.pl/obszary-tematyczne/rolnictwo-lesnictwo/produkcja-zwierzeca-zwierzeta-gospodarskie/poglowie-bydla-wedlug-stanu-w-grudniu-2018-roku,5,20.html (accessed on 2 December 2022).
  36. Krajowy Ośrodek Wsparcia Rolnictwa-KOWR. Available online: https://www.kowr.gov.pl/biuro-prasowe/aktualnosci/128-instalacji-biogazu-rolniczego (accessed on 2 December 2022).
  37. Bilik, K.; Strzelski, J. Dairy cow feeding according to organic standards with regard to studies at the National Research Institute of Animal Production. Wiadomości. Zootech. R. LI 2013, 3, 25–41. (In Polish) [Google Scholar]
  38. Najważniejsze Zasady Żywienia Jałówek. Tygodnik Poradnik Rolniczy. 26 April 2018. Available online: https://www.tygodnik-rolniczy.pl/articles/polskie-mleko/najwazniejsze-zasady-zywienia-jalowek (accessed on 2 December 2022).
  39. Żywienie Bydła Opasowego Technologia Produkcji Rolniczej. Kujawsko-Pomorski Agricultural Advisory Centre in Minikowo. 14 April 2020. Available online: https://technologia.kpodr.pl/index.php/2020/04/15/zywienie-bydla-opasowego (accessed on 2 December 2022).
  40. Kowalski, Z.M.; Kamiński, J. Niektóre problemy żywienia krów wysoko wydajnych. Postępy Nauk. Rol. 2000, 47, 77–98. [Google Scholar]
Figure 1. The potential of biogas production from cattle manure and slurry in the examined voivodeships in Poland based on data from 2018 [6].
Sensors 23 00164 g001
Figure 2. Structures of the generated MPL-type networks obtained for modeling the amounts of slurry or manure in the examined voivodeships, as indicated. Input and output variables are as described in Table 2.
Sensors 23 00164 g002
Table 1. The conversial factors S B S   and   S s based on Central Statistical Office of the 2010 Agricultural Census [33].
Animal Keeping System
VoivodeshipStands with a Slatted Floor ( S B S )Stands with a Solid Floor ( S s )
Mazowieckie0.1490.851
Podlaskie0.7700.230
Wielkopolskie0.3430.657
Table 2. Input and output variables of created ANNs; values without dimensions were considered in the model.
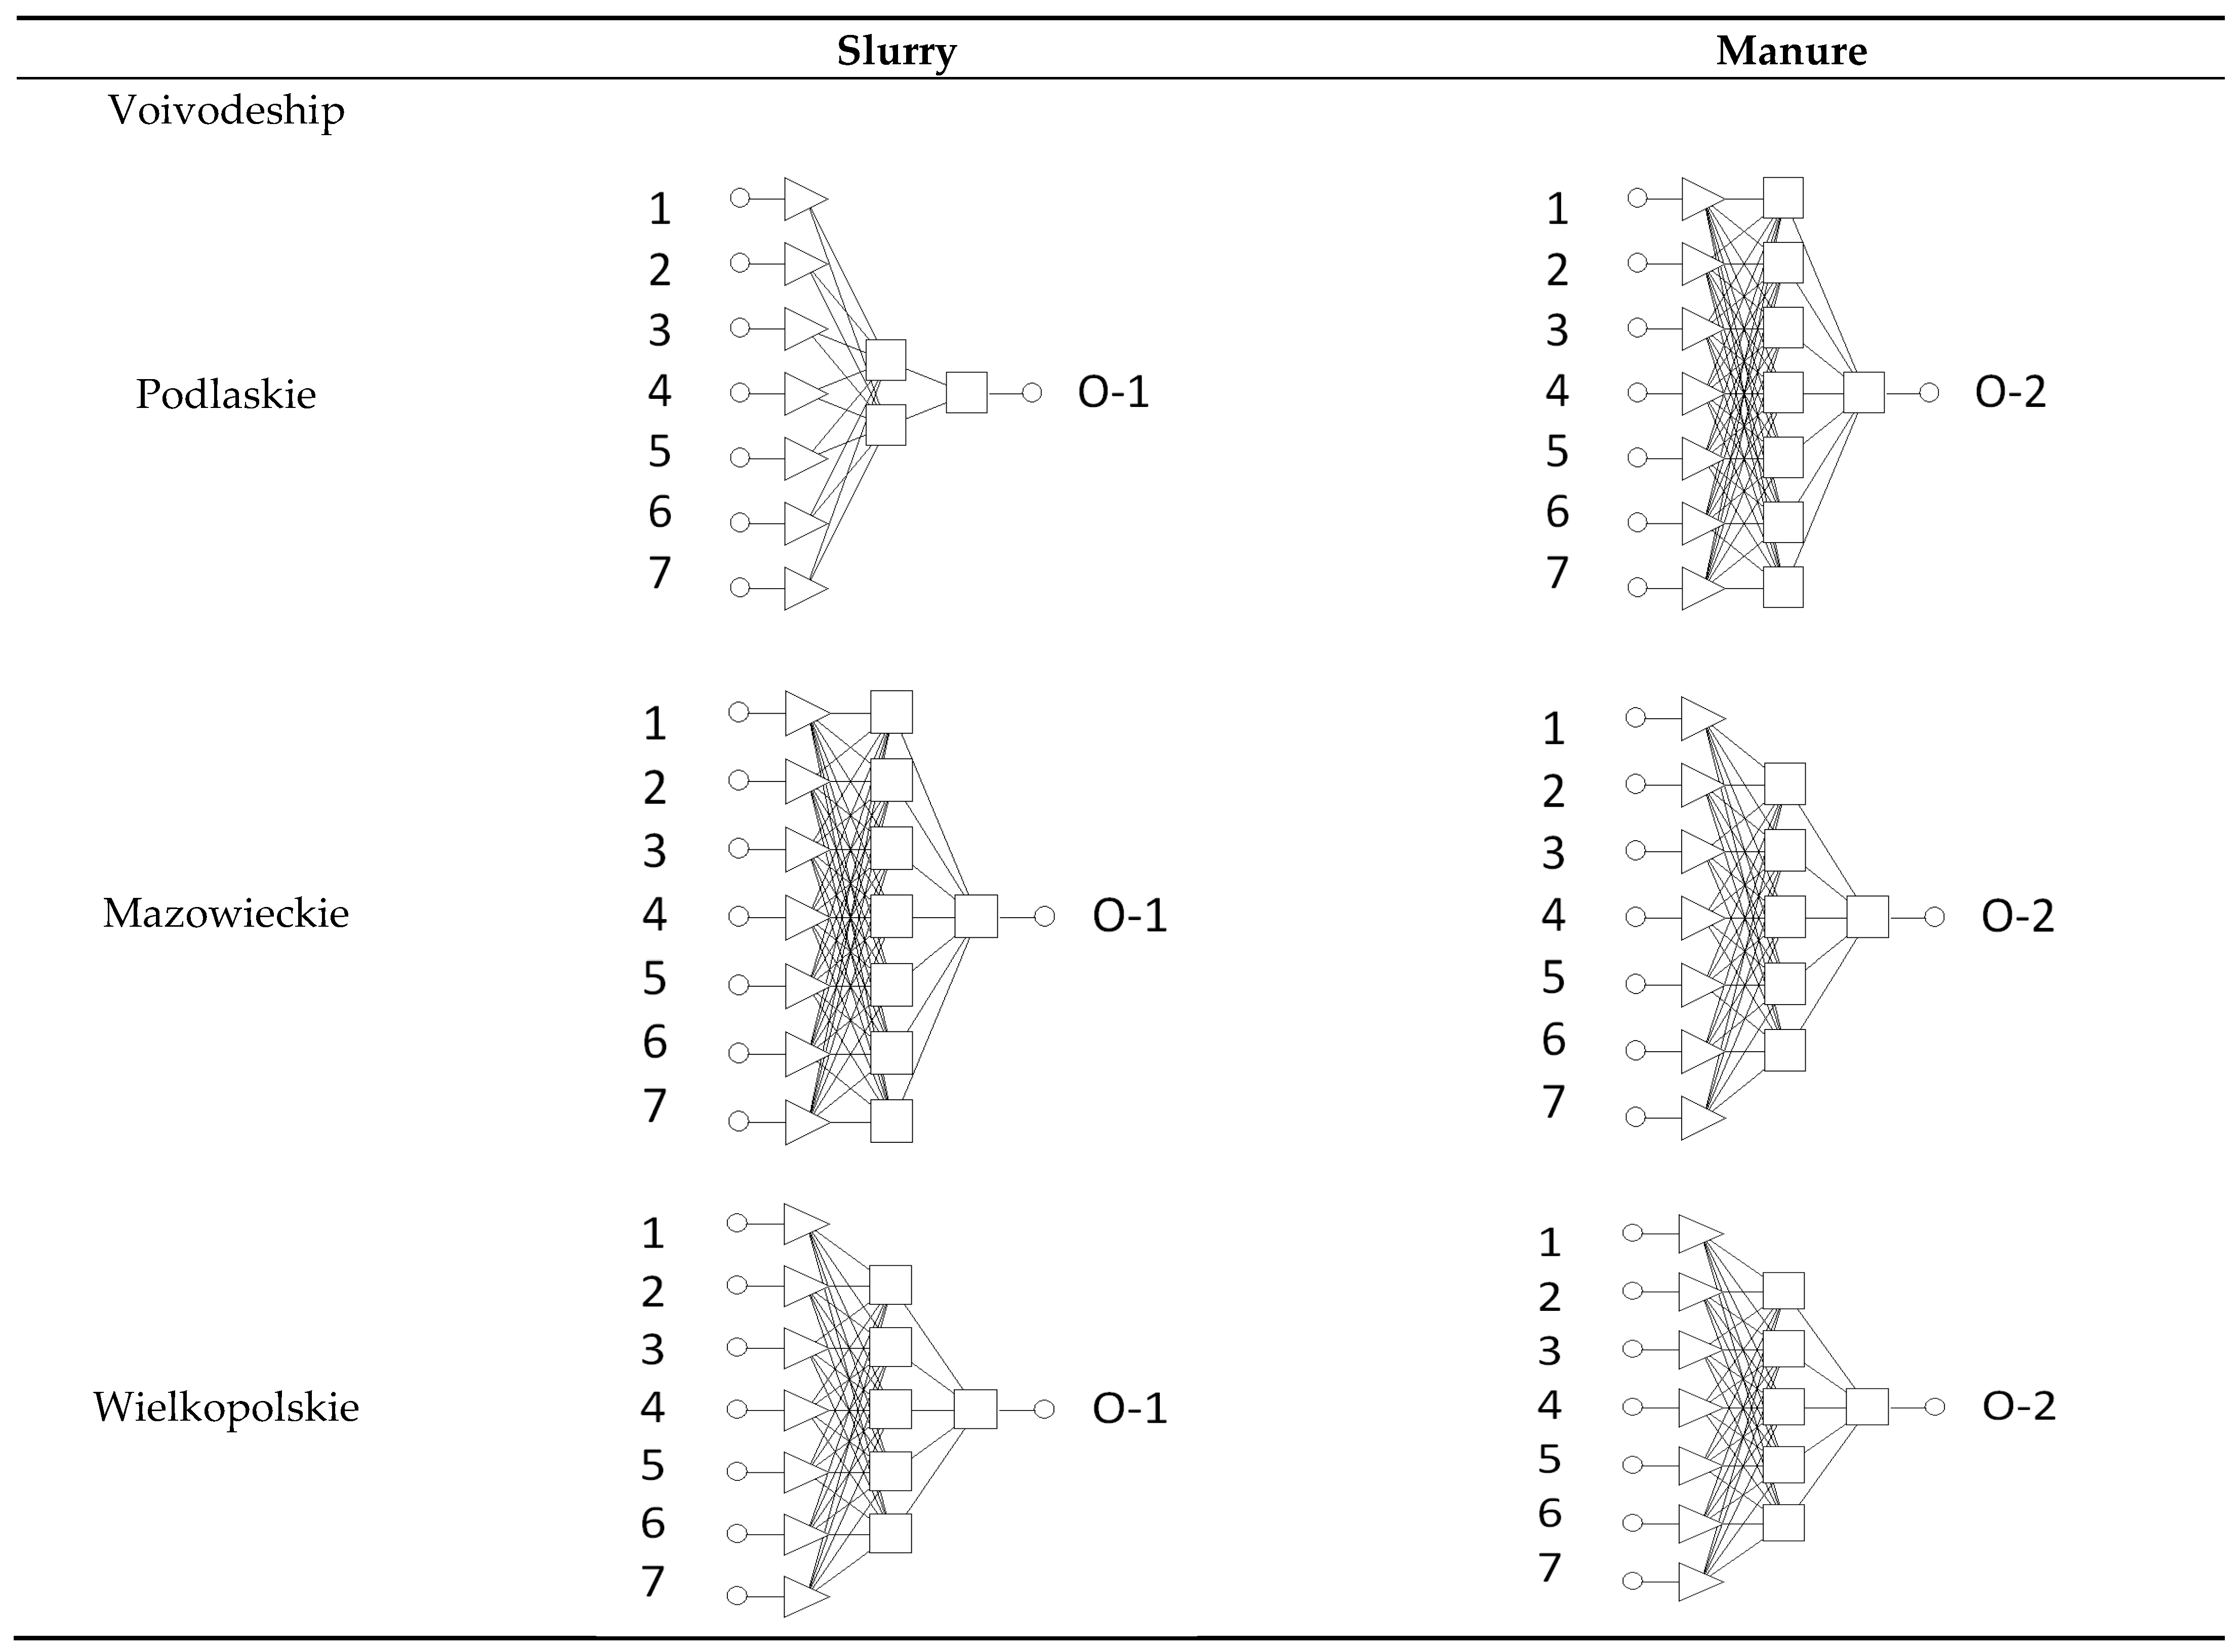
Input Variables (Descriptors)-Number of Animals
of a Certain Type in the Herd Structure
1   Calves
2   Bulls 6–12 months
3   Bulls 12–24 months
4   Bulls > 24 months
5   Heifers 6–12 months
6   Heifers 12–18 months
7   Dairy Cows months
Output (options)
O-1  amount of biogas from slurry for examined voivodeship
O-2  amount of biogas from manure for examined voivodeship
Table 3. The exemplary structure of training file for Podlaskie voivodeship.
1234567O-1O-2
No.Calves DJPBulls
6–12 Months
Bulls
12–24 Months
Bulls
>24 Months
Heifers 6–12 MonthsHeifers
12–18 Months
Dairy Cows Amount of Biogas from Manure (m3)Amount of Biogas from Slurry (m3)
1410.25243.31012.8294545.71361.613,52712,653,6691,956,062
2396.75186.9737.6238547.5130813,84312,466,3071,927,098
3174.45148.8620163.8202.547645114,641,118717,445
469.666.9257.667.2100.8195.217921,854,335286,652
511.2513.535.21413.528.8382376,27458,166
6286.2223.5808175338.182081157,835,3541,211,225
796.387.9391.281.2106.8195.221952,337,194361,294
83338.420865.824.976.8542749,772115,903
96949.5180.867.2102201.623952,394,325370,126
1067.3554.3172.872.882.5165.622672,210,135341,653
108476.25257.11160274.4590.11567.213,92813,158,8402,034,153
Table 4. Regression statistics of the obtained optimal neural models. S.D: ratio-quotient of standard deviations determined for errors and for data. Correlation standard: Pearson correlation coefficient between the results given by the generated neural model and the actual output values.
Learning FileValidation FileTest FileType of Neural Network
Podlaskie voivodeship
slurry
S.D. ratio0.0591800.033480.095860MLP: 7-2-1
Correlation0.9983050.999540.995798
manure
S.D. ratio0.944290.023360.0616MLP: 7-7-1
Correlation0.999020.9997540.998841
Mazowieckie voivodeship
slurry
S.D. ratio0.017030.014290.02317MLP: 7-7-1
Correlation0.9998630.99990.999816
manure
S.D. ratio0.0105810.011270.01075MLP: 7-5-1
Correlation0.9999440.9999450.999942
Wielkopolskie voivodeship
slurry
S.D. ratio0.026450.028170.02472MLP: 7-5-1
Correlation0.9996530.9996050.999703
manure
S.D. ratio0.015020.0089930.01077MLP: 7-5-1
Correlation0.9998870.999960.999953
Table 5. The sensitivity analysis of the input variables for the examined output variables.
CalvesBulls 6–12 MonthsBulls 12–24 MonthsBulls > 24 MonthsHeifers 6–12 MonthsHeifers 12–18 MonthsDairy Cows
Podlaskie voivodeship
Slurry-analysis for training set
Rank2574361
Error782,535.2331,844.3234,644.5402,790.21456,897.9315,716.22,383,259
Quotient3.5576511.5086681.0667681.831212.0772011.43534510.83504
Slurry-analysis for validation set
Rank2574361
Error641,876.1244,916.7131,120.5288,690.6350,421.5168,073.52,344,526
Quotient5.2809282.0150121.0787722.3751532.8830351.38279719.28919
Manure-analysis for training set
Rank5647321
Error346,955.1174,304.3400,851173,594.9537,229557,505.12,107,914
Quotient2.177741.0940592.5160291.0896073.3720353.49930313.23078
Manure-analysis for validation set
Rank5647321
Error278,951.589,571.02394,983.279,676.33454,054.6471,651.72,006,711
Quotient3.6096391.1590515.1110931.0310145.8754796.10318525.96689
Mazowieckie voivodeship
Slurry-analysis for training set
Rank6745231
Error103,841.869,071.22199,142.9164,292.1212,249.7205,6491,830,063
Quotient2.3978021.5949174.5983883.7936544.9010384.74862142.25781
Slurry-analysis for validation set
Rank6745321
Error96,951.8366,217.75174,988.8156,794.4192,573.9204,318.11,696,270
Quotient2.8350911.9363575.1170684.5850225.6312965.97472449.60278
Manure-analysis for training set
Rank4625371
Error110,416.767,805.55327,842106,089.1200,68758,909.332,127,190
Quotient3.8660672.37410411.478873.7145427.0267392.06261774.48018
Manure-analysis for validation set
Rank5624371
Error85,550.3467,821.77337,742.4112,396.3177,292.750,618.031,857,479
Quotient3.0764552.43892312.145474.0418566.375581.82026366.79635
Wielkopolskie voivodeship
Slurry-analysis for training set
Rank6534721
Error164,558.3193,348.8393,748.6218,477.685,506.16407,828.61,191,321
Quotient2.6088643.0653016.2423853.4636851.3555926.46560518.88689
Slurry-analysis for validation set
Rank6524731
Error154,924.7199,205.6361,707.1212,250.683,400.45357,936.41,010,796
Quotient2.6090113.3547246.0913323.5744081.4045066.02783117.02231
Manure-analysis for training set
Rank6524731
Error126,985.5149,031.5450,806.2165,423.279,804.95209,430.41,260,193
Quotient3.6297294.25988912.885764.7284272.281135.9863236.02112
Manure-analysis for validation set
Rank6524731
Error121,494.7158,065.2514,812.5184,429.878,210.54261,2971,466,372
Quotient4.6147396.00379819.554157.0052072.9706759.92485755.69727
Disclaimer/Publisher’s Note: The statements, opinions and data contained in all publications are solely those of the individual author(s) and contributor(s) and not of MDPI and/or the editor(s). MDPI and/or the editor(s) disclaim responsibility for any injury to people or property resulting from any ideas, methods, instructions or products referred to in the content.

