
Inter-Patient Congestive Heart Failure Detection Using ECG-Convolution-Vision Transformer Network

Abstract
:1. Introduction
2. Materials
2.1. Databases
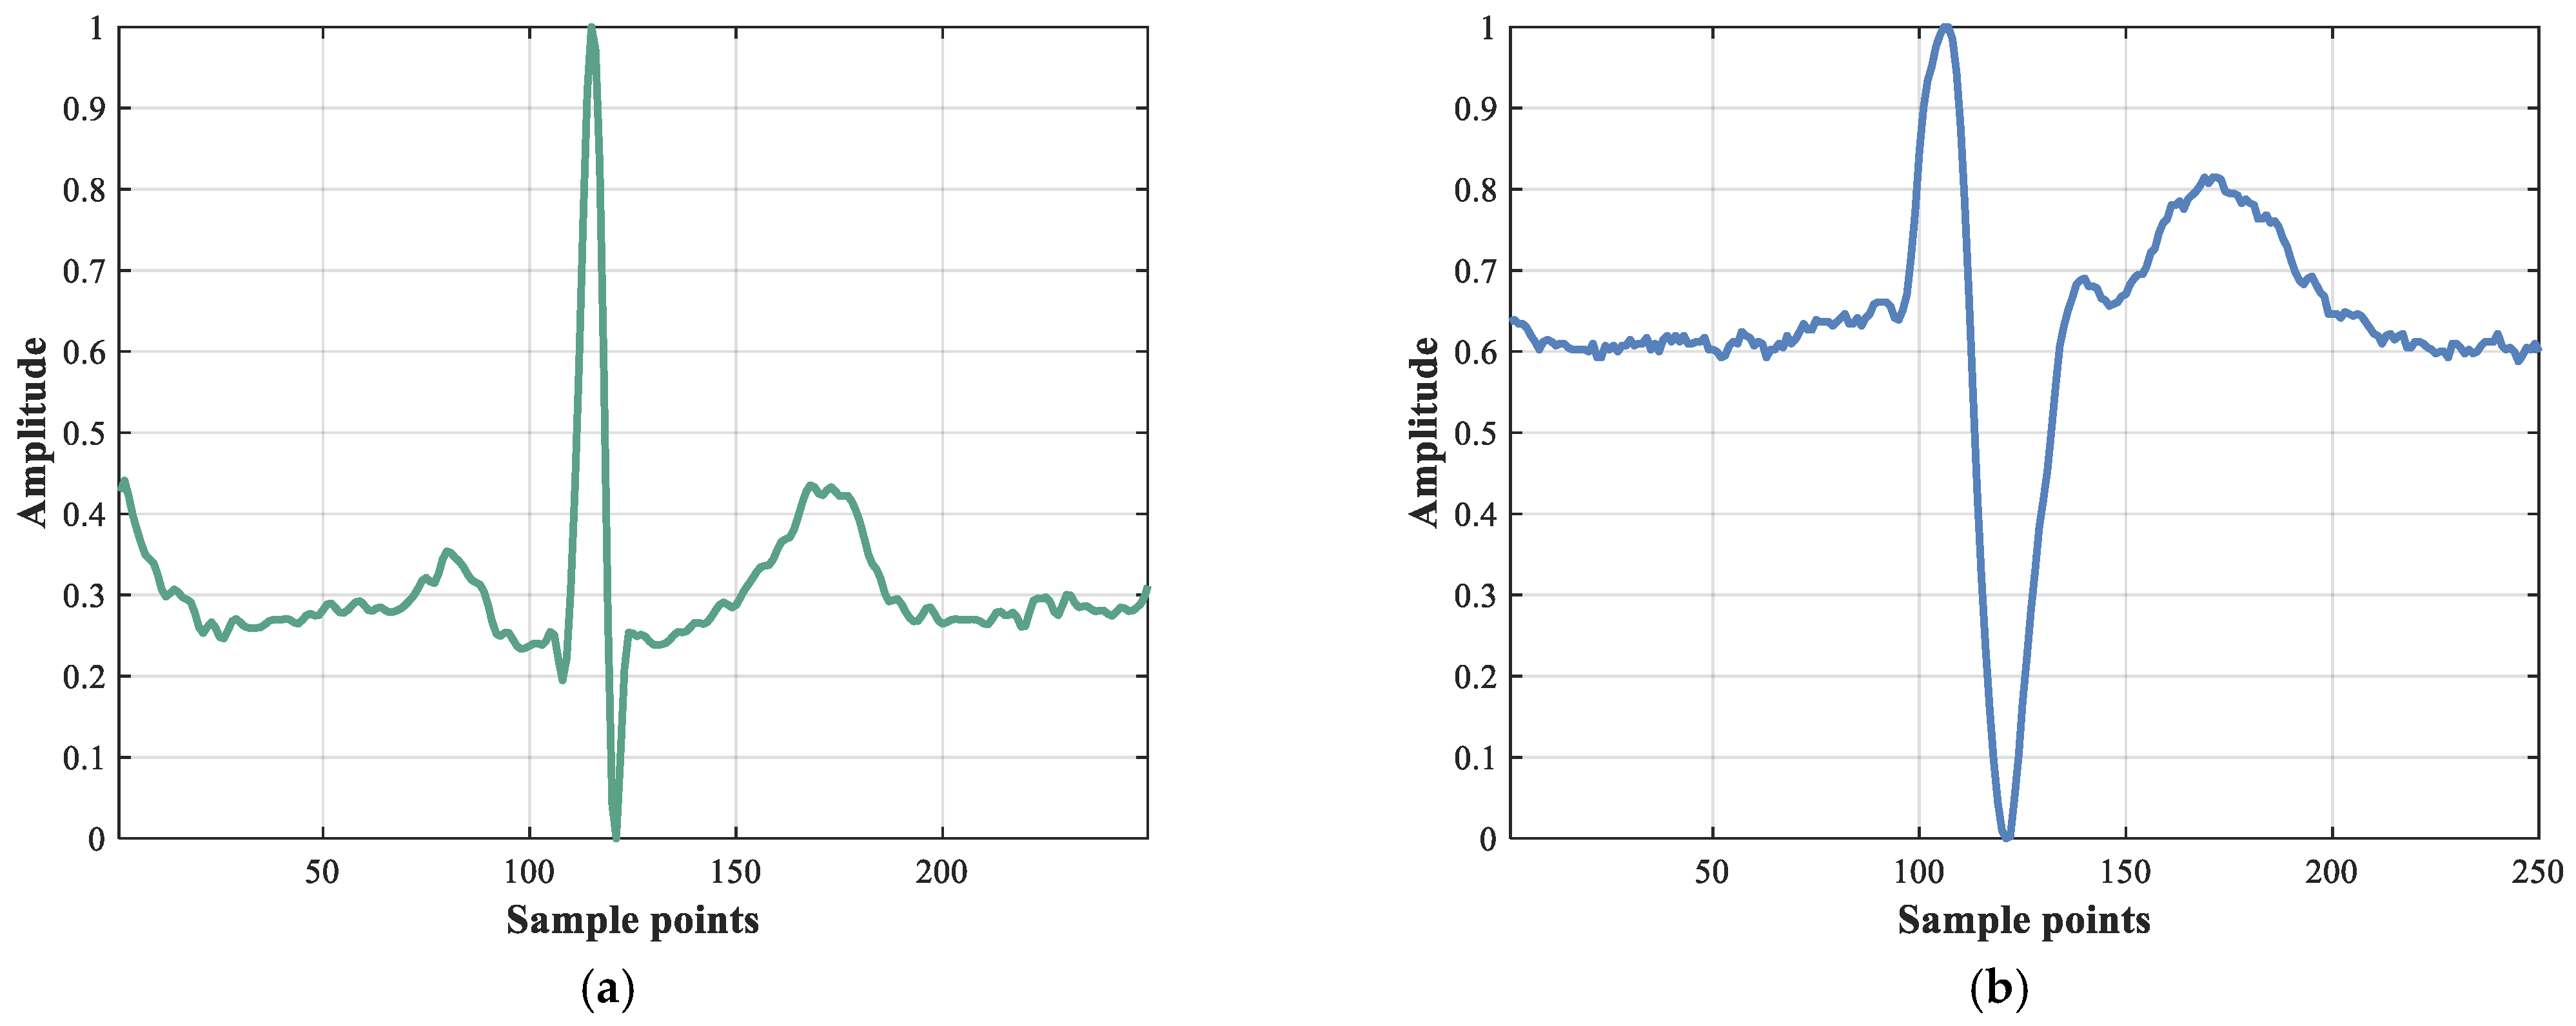
- The MITNSR database includes ECG recordings from 18 people in normal sinus rhythm, with a sampling frequency of 128 Hz.
- The BIDMC database contains ECG recordings from 15 patients with severe CHF, sampled at 250 Hz.
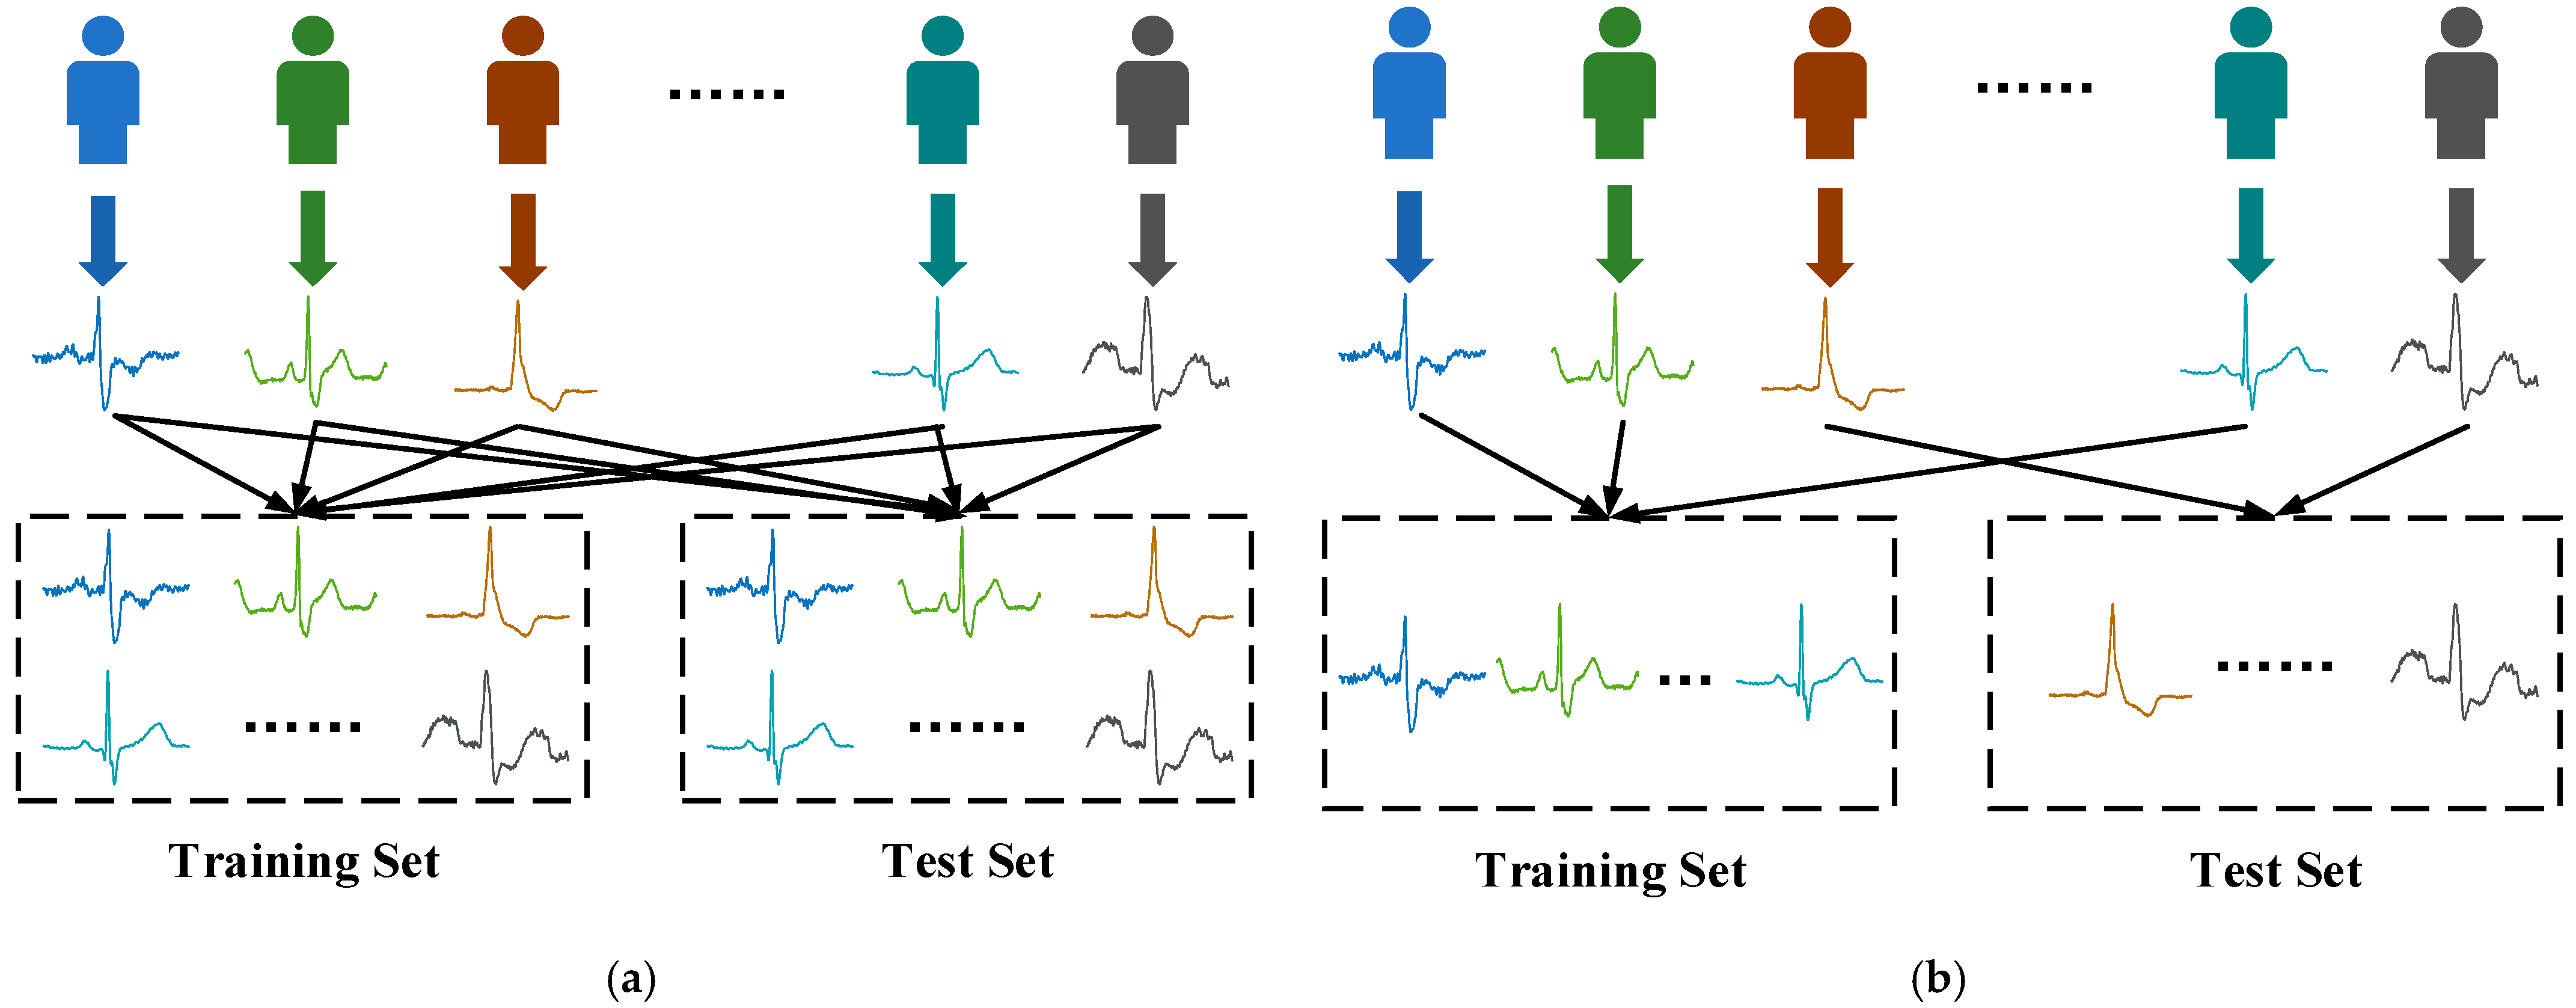
2.2. Data Grouping
- The Intra-patient scheme: randomly divided the heartbeats of the same patient into training and test sets. To reduce the chance of the experiment, this scheme adopts a ten-fold cross-validation.
- The Inter-patient scheme: different patients in training set and test set.
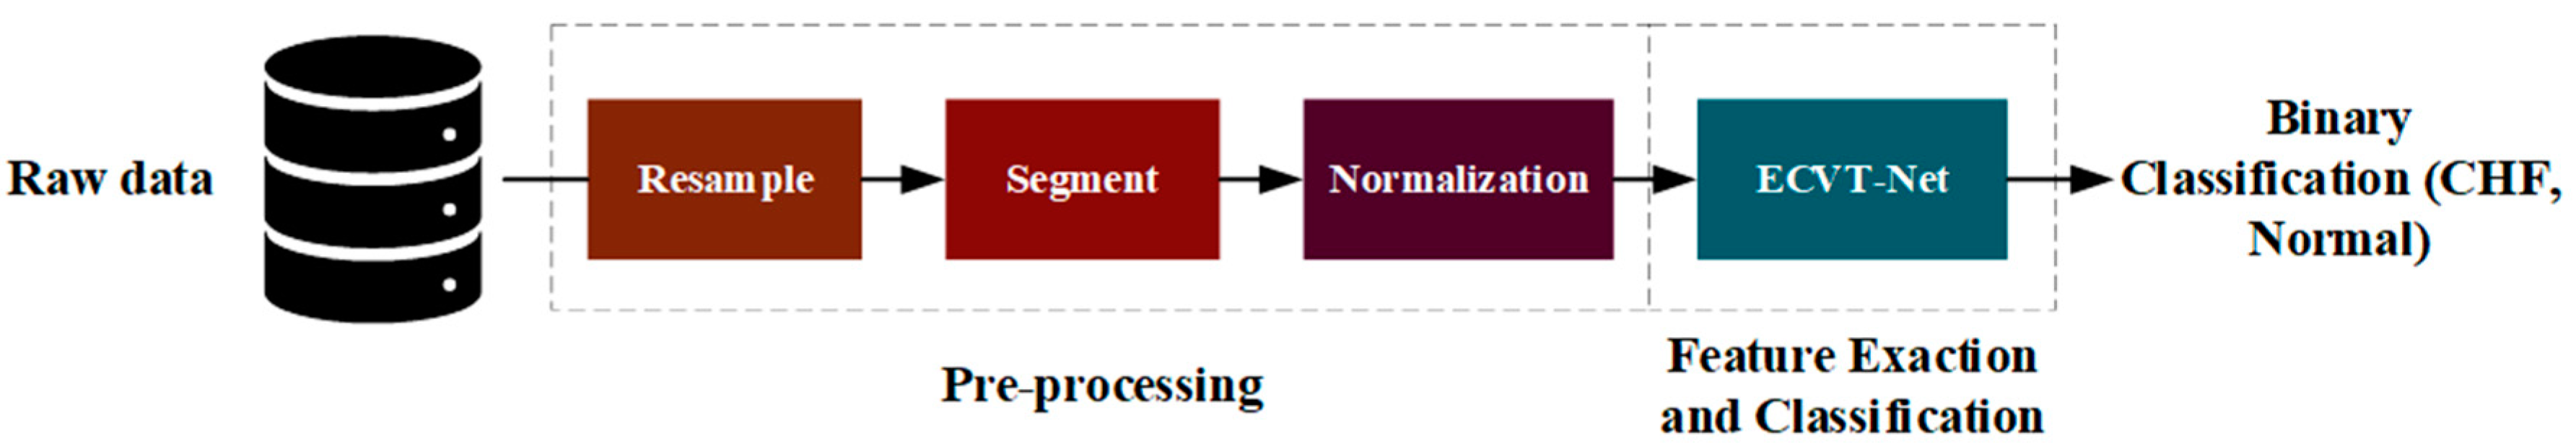
3. Methods
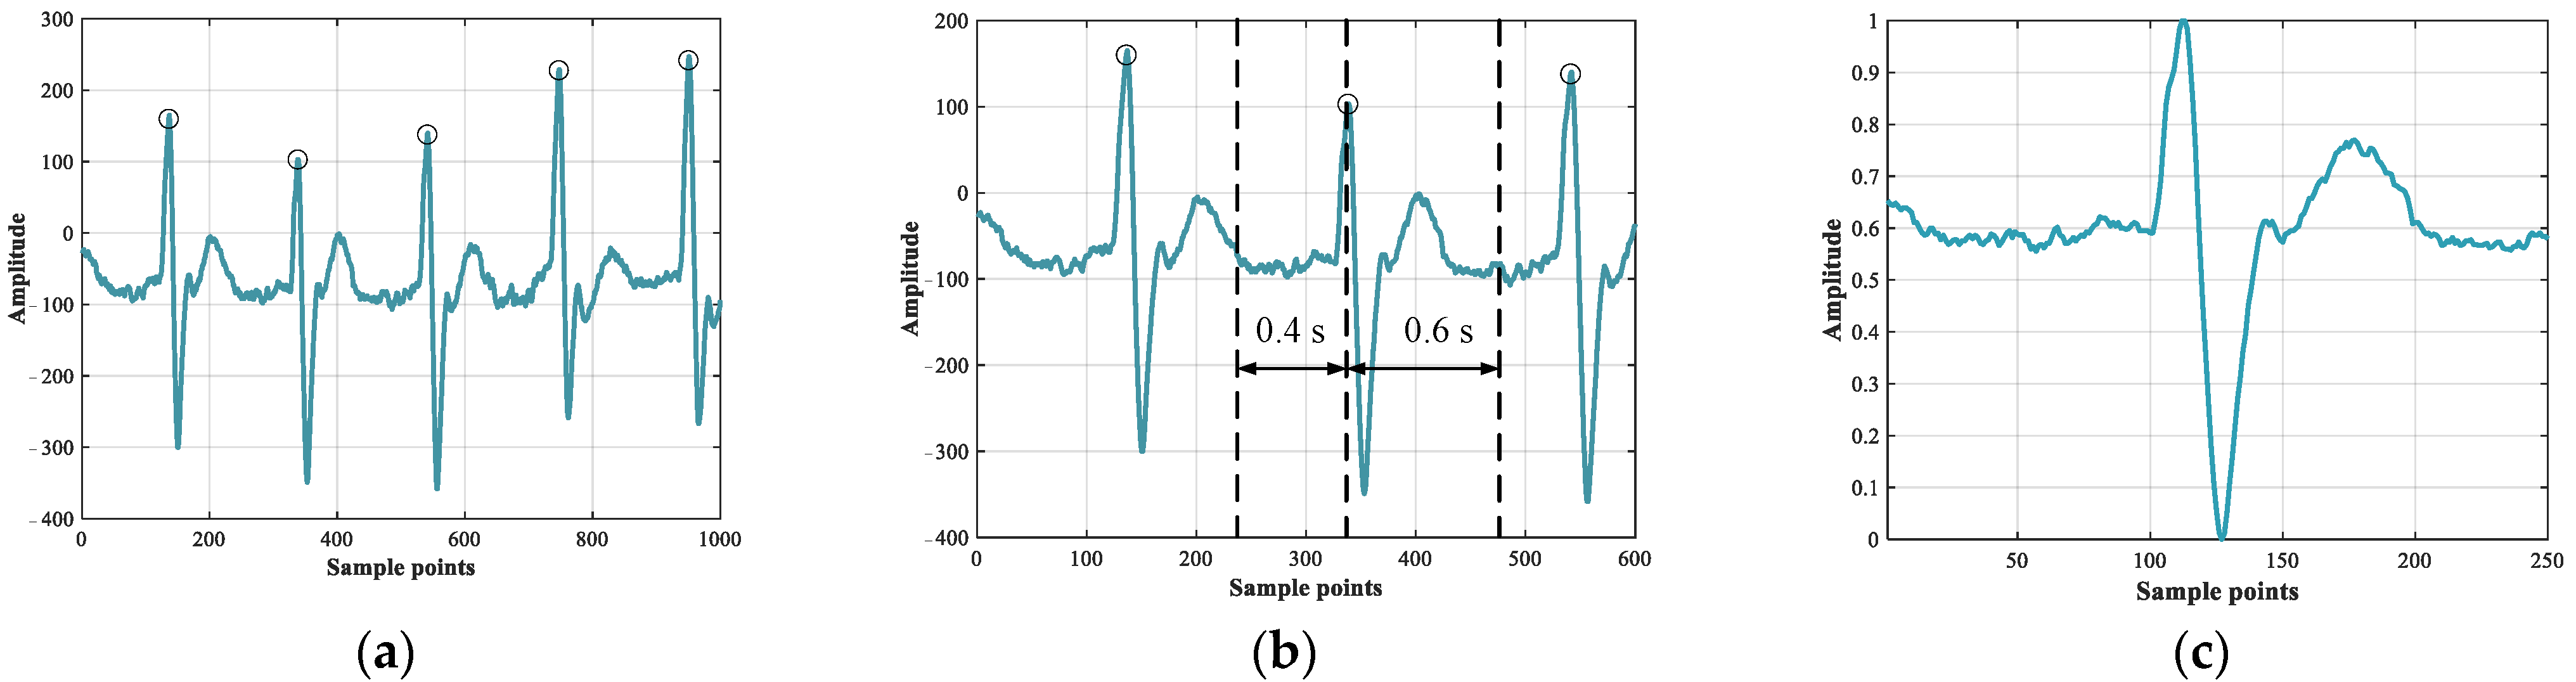
3.1. Pre-Processing
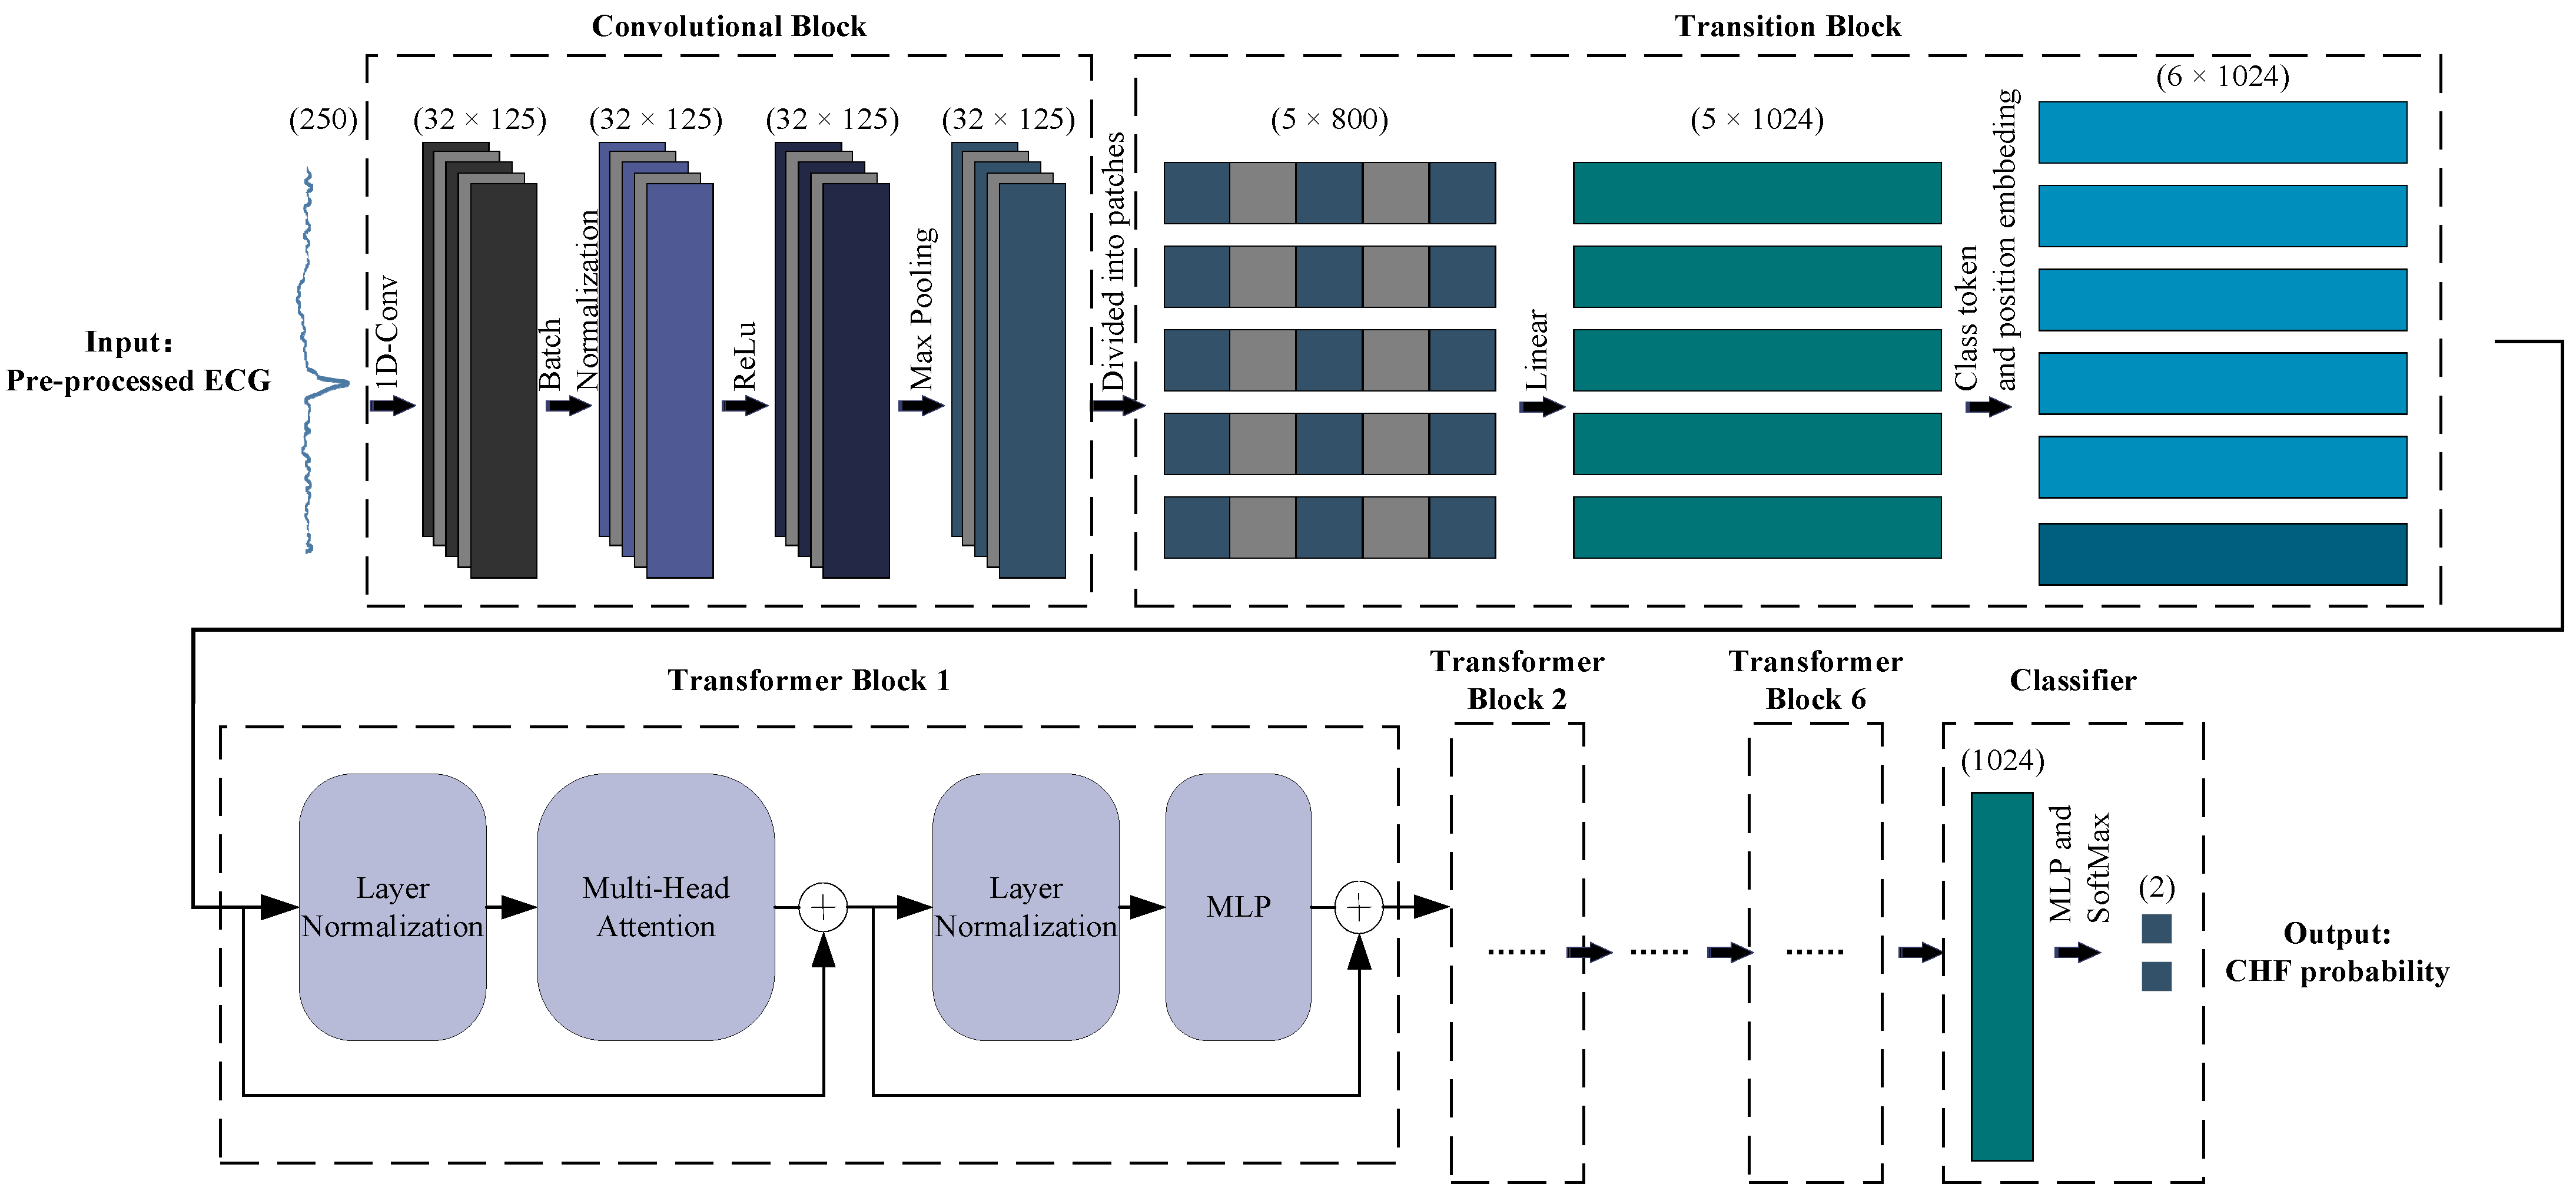
3.2. Feature Extraction and Classification (ECVT-Net)
3.2.1. Overview
3.2.2. Convolutional Block
3.2.3. Transition Block
3.2.4. Transformer Block
3.2.5. Classifier
3.3. Evaluation Indicators
4. Results and Discussion
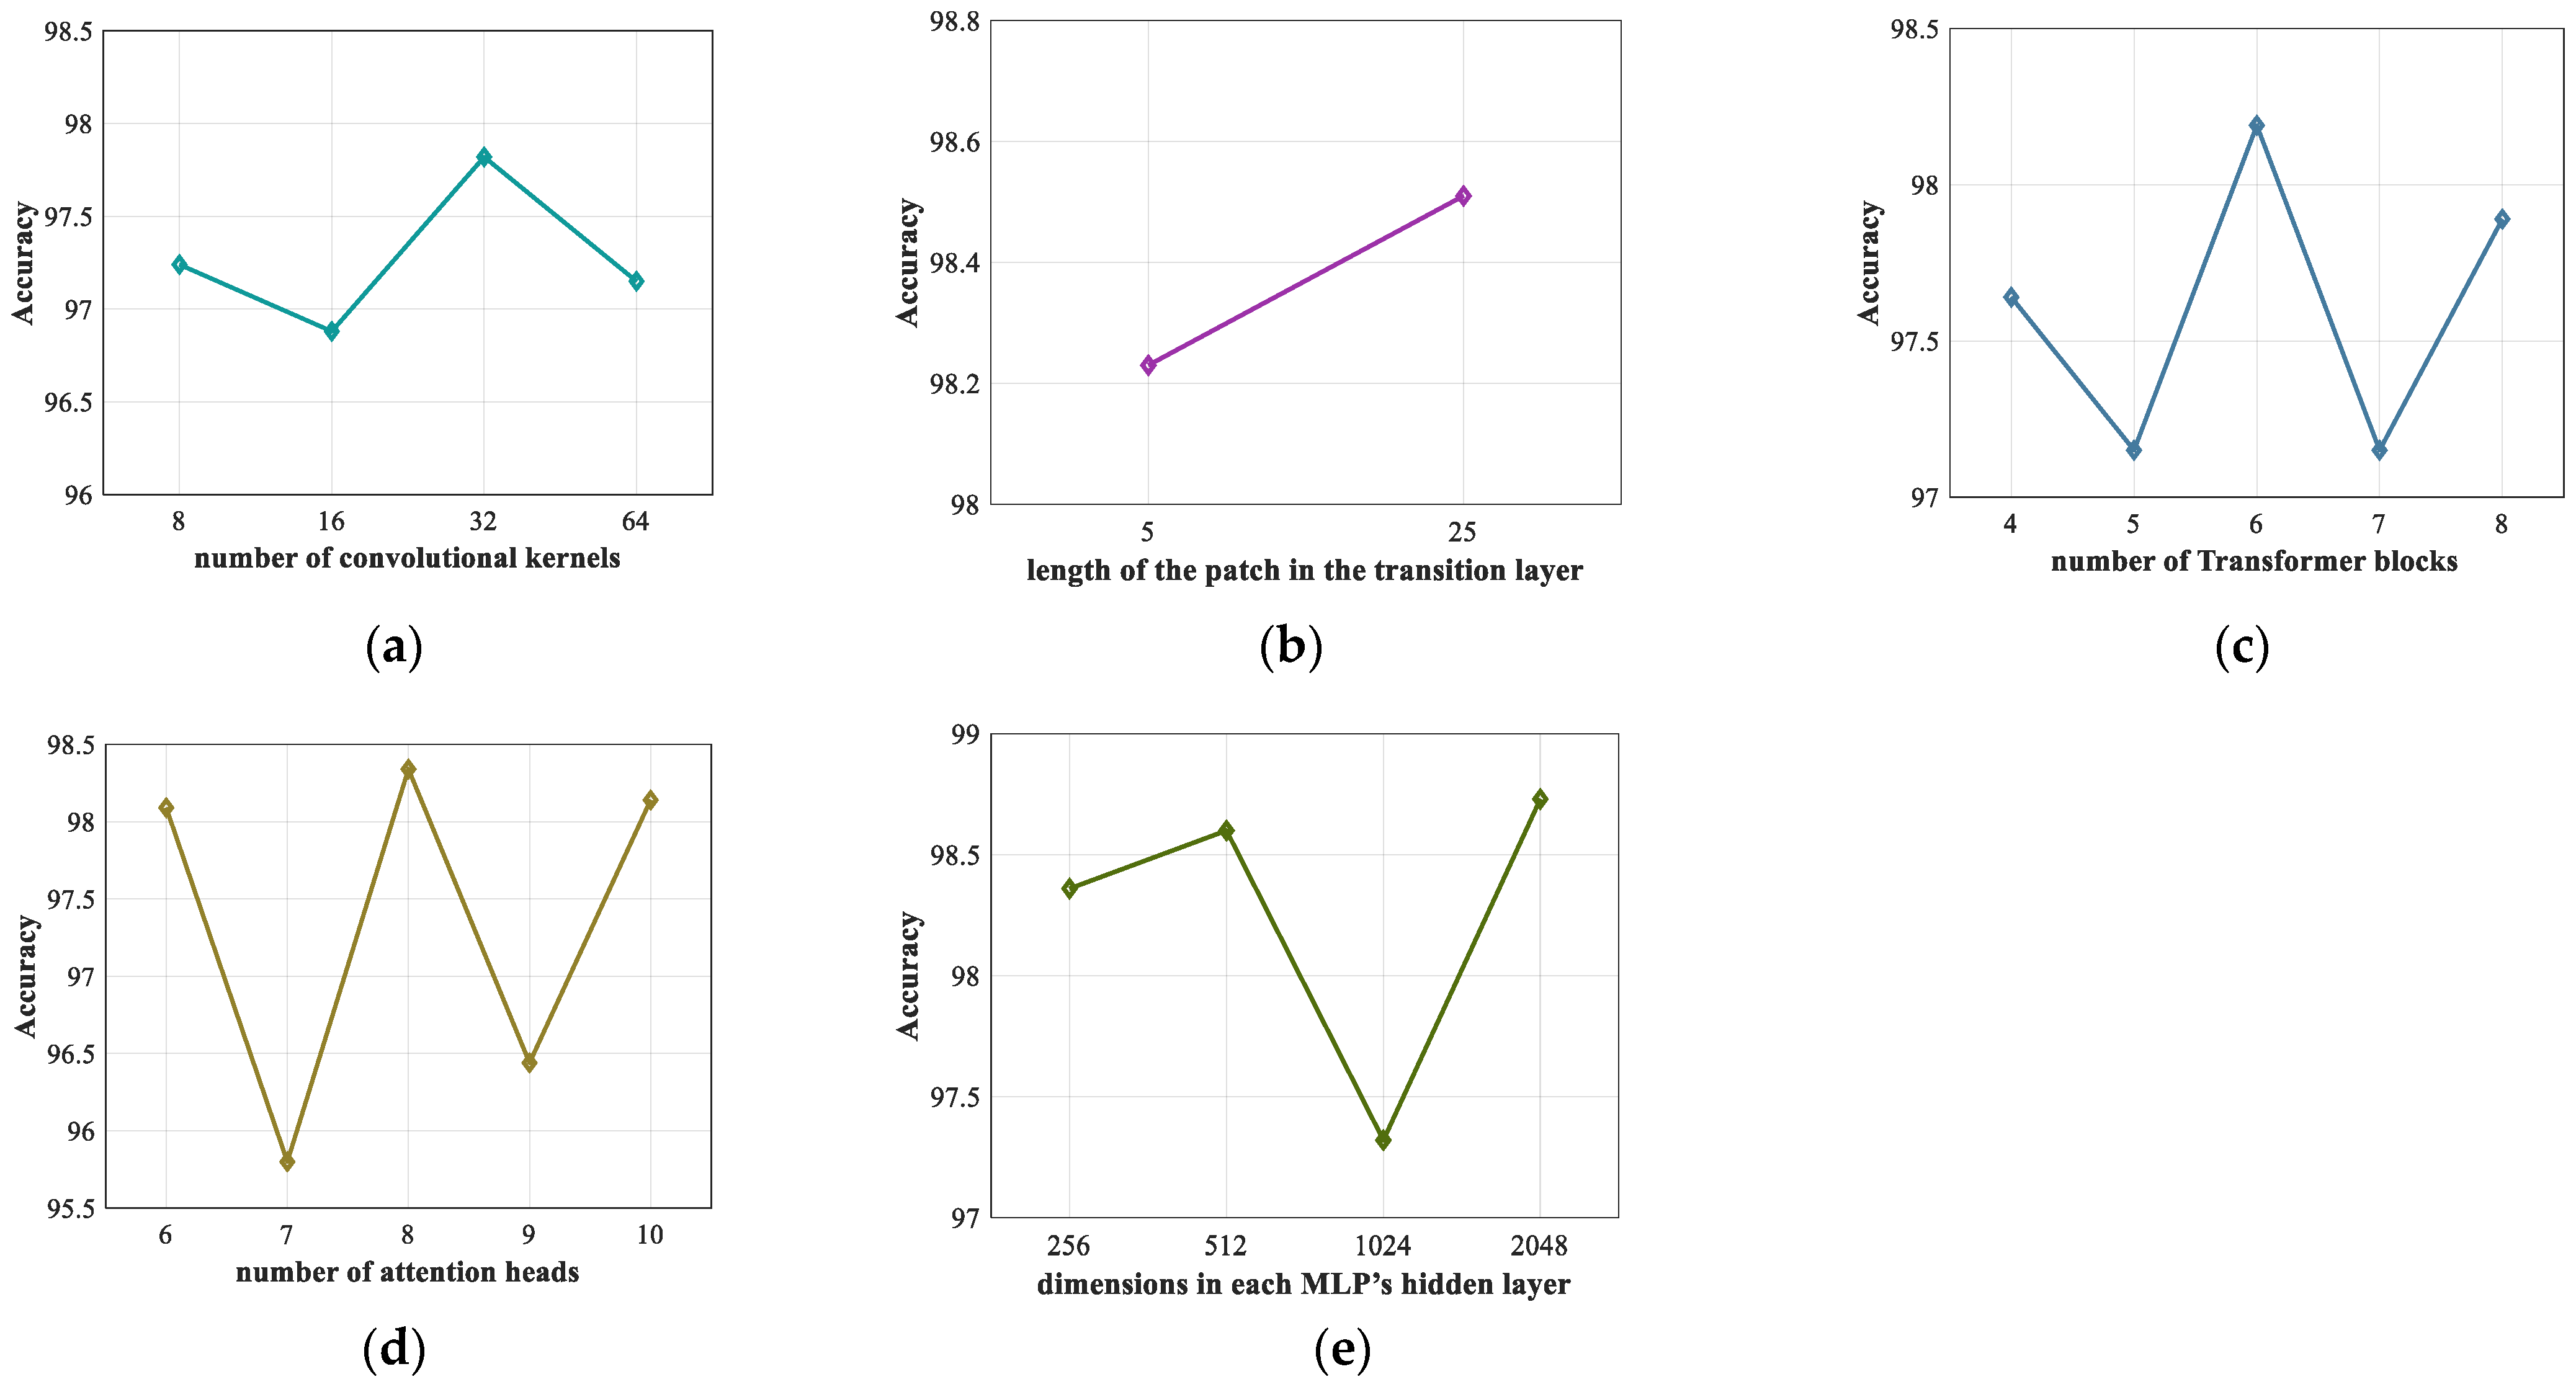
4.1. Experimental Setup
4.2. Results on the Intra-Patient Scheme
4.3. Results on the Inter-Patient Scheme
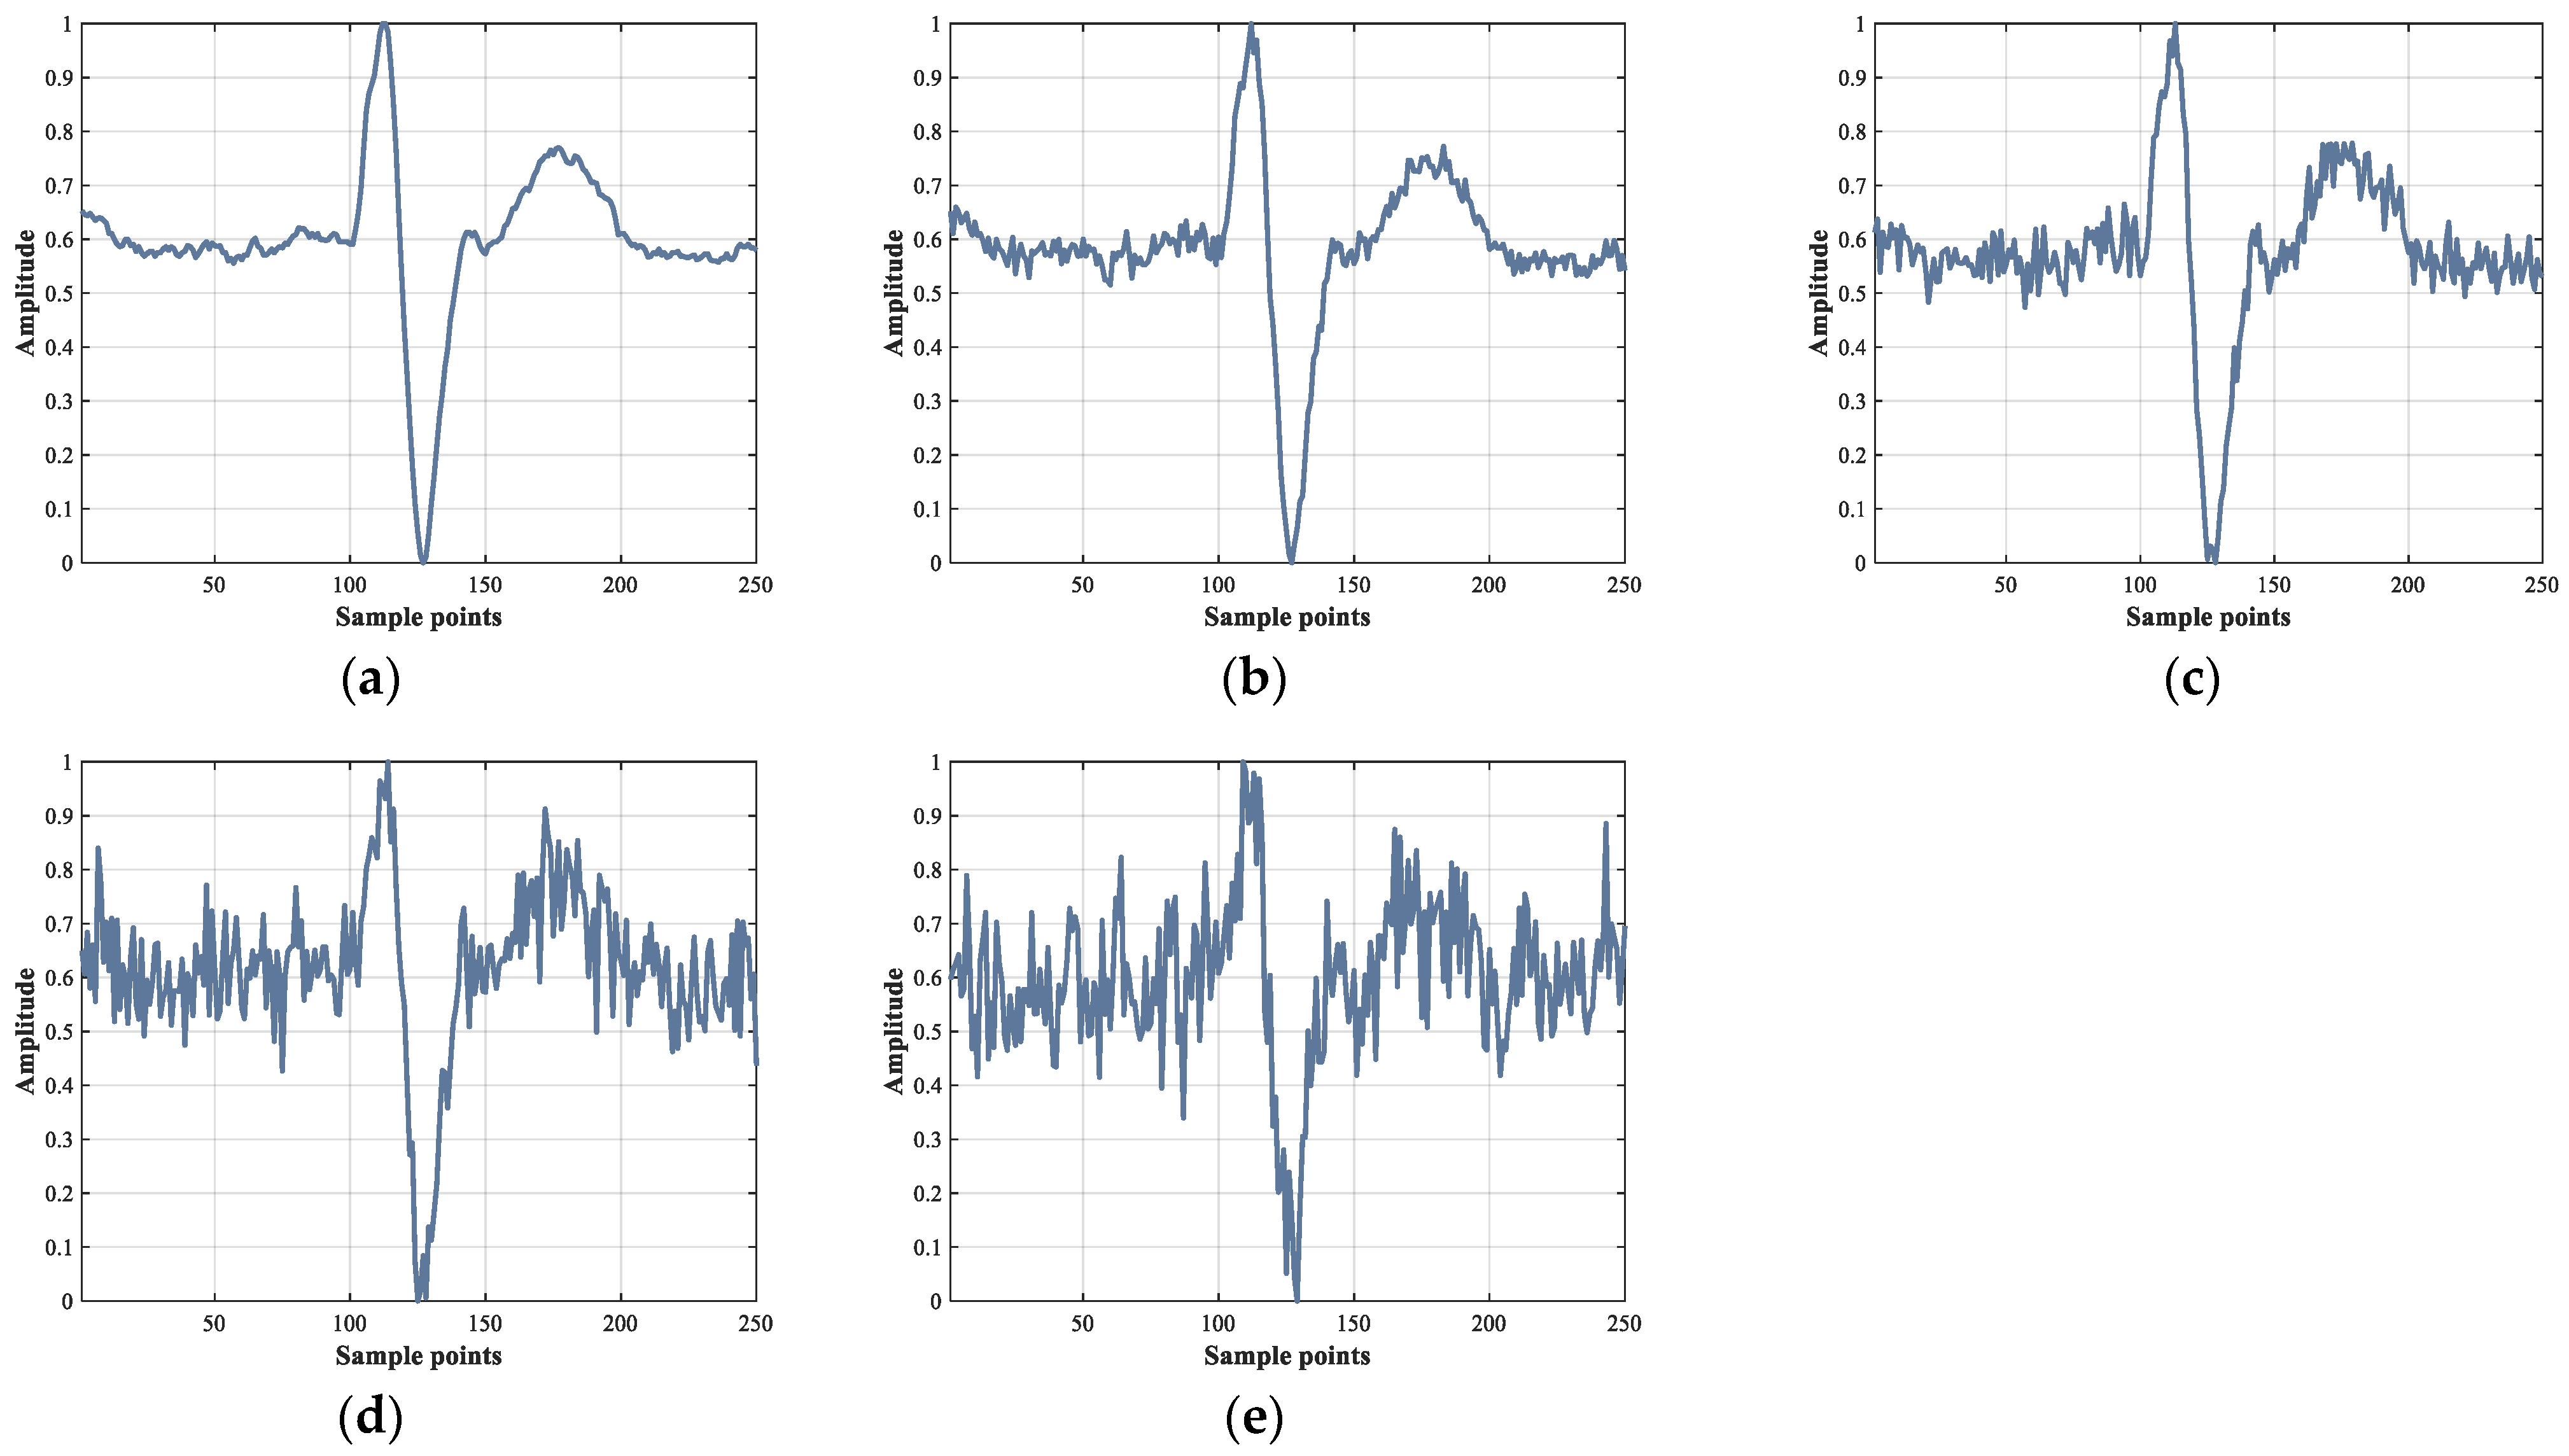
4.4. Results under Different Noise Levels
4.5. Ablation Experiment
4.6. Comparison and Performance Analysis
- High accuracy;
- Automatic CHF detection model combining a CNN and a ViT;
- Good generalization performance that can work under the scheme between patients;
- Robust to noise;
- No manual feature extraction.
5. Conclusions
Author Contributions
Funding
Institutional Review Board Statement
Informed Consent Statement
Data Availability Statement
Conflicts of Interest
References
- Groenewegen, A.; Rutten, F.H.; Mosterd, A.; Hoes, A.W. Epidemiology of heart failure. Eur. J. Heart Fail. 2020, 22, 1342–1356. [Google Scholar] [CrossRef] [PubMed]
- Virani, S.S.; Alonso, A.; Aparicio, H.J.; Benjamin, E.J.; Bittencourt, M.S.; Callaway, C.W.; Carson, A.P.; Chamberlain, A.M.; Cheng, S.; Delling, F.N. Heart disease and stroke statistics—2021 update: A report from the American Heart Association. Circulation 2021, 143, e254–e743. [Google Scholar] [CrossRef] [PubMed]
- Dunlay, S.M.; Roger, V.L. Understanding the Epidemic of Heart Failure: Past, Present, and Future. Curr. Heart Fail. Rep. 2014, 11, 404–415. [Google Scholar] [CrossRef] [Green Version]
- Krumholz, H.M.; Chen, Y.-T.; Wang, Y.; Vaccarino, V.; Radford, M.J.; Horwitz, R.I. Predictors of readmission among elderly survivors of admission with heart failure. Am. Heart J. 2000, 139, 72–77. [Google Scholar] [CrossRef]
- Azam, R.; Cameron, M.; Clark, R.; Clune, E.; Davidson, P.; Driscoll, A.; Huang, N.; McVeigh, J.; Paguio, V.; Percival, G. Living Well with Chronic Heart Failure. 2008. Available online: https://dro.deakin.edu.au/eserv/DU:30056043/driscoll-livingwell-2008.pdf (accessed on 27 January 2022).
- Baumert, M.; Porta, A.; Cichocki, A. Biomedical signal processing: From a conceptual framework to clinical applications [scanning the issue]. Proc. IEEE 2016, 104, 220–222. [Google Scholar] [CrossRef]
- Jahmunah, V.; Oh, S.L.; Wei, J.K.E.; Ciaccio, E.J.; Chua, K.; San, T.R.; Acharya, U.R. Computer-aided diagnosis of congestive heart failure using ECG signals—A review. Phys. Med. 2019, 62, 95–104. [Google Scholar] [CrossRef] [PubMed] [Green Version]
- Orhan, U. Real-time CHF detection from ECG signals using a novel discretization method. Comput. Biol. Med. 2013, 43, 1556–1562. [Google Scholar] [CrossRef]
- Kamath, C. A new approach to detect congestive heart failure using detrended fluctuation analysis of electrocardiogram signals. J. Eng. Sci. Technol. 2015, 10, 145–159. [Google Scholar]
- Sudarshan, V.K.; Acharya, U.R.; Oh, S.L.; Adam, M.; Tan, J.H.; Chua, C.K.; Chua, K.P.; Tan, R.S. Automated diagnosis of congestive heart failure using dual tree complex wavelet transform and statistical features extracted from 2 s of ECG signals. Comput. Biol. Med. 2017, 83, 48–58. [Google Scholar] [CrossRef]
- Acharya, U.R.; Fujita, H.; Oh, S.L.; Hagiwara, Y.; Tan, J.H.; Adam, M.; Tan, R.S. Deep convolutional neural network for the automated diagnosis of congestive heart failure using ECG signals. Appl. Intell. 2019, 49, 16–27. [Google Scholar] [CrossRef]
- Darmawahyuni, A.; Nurmaini, S.; Yuwandini, M.; Muhammad Naufal, R.; Firdaus, F.; Tutuko, B. Congestive heart failure waveform classification based on short time-step analysis with recurrent network. Inform. Med. Unlocked 2020, 21, 100441. [Google Scholar] [CrossRef]
- Naik, M.S.; Pancholi, T.K.; Achary, R. Prediction of Congestive Heart Failure (CHF) ECG Data Using Machine Learning. In Intelligent Data Communication Technologies and Internet of Things; Springer: Berlin, Germany, 2021; pp. 325–333. [Google Scholar]
- Baloglu, U.B.; Talo, M.; Yildirim, O.; San Tan, R.; Acharya, U.R. Classification of myocardial infarction with multi-lead ECG signals and deep CNN. Pattern Recognit. Lett. 2019, 122, 23–30. [Google Scholar] [CrossRef]
- Labati, R.D.; Muñoz, E.; Piuri, V.; Sassi, R.; Scotti, F. Deep-ECG: Convolutional neural networks for ECG biometric recognition. Pattern Recognit. Lett. 2019, 126, 78–85. [Google Scholar] [CrossRef]
- Kong, Q.; Xu, Y.; Wang, W.; Plumbley, M.D. Sound Event Detection of Weakly Labelled Data With CNN-Transformer and Automatic Threshold Optimization. IEEE/ACM Trans. Audio Speech Lang. Processing 2020, 28, 2450–2460. [Google Scholar] [CrossRef]
- Vaswani, A.; Shazeer, N.; Parmar, N.; Uszkoreit, J.; Jones, L.; Gomez, A.N.; Kaiser, Ł.; Polosukhin, I. Attention is all you need. Adv. Neural Inf. Processing Syst. 2017, 30. [Google Scholar] [CrossRef]
- Dosovitskiy, A.; Beyer, L.; Kolesnikov, A.; Weissenborn, D.; Zhai, X.; Unterthiner, T.; Dehghani, M.; Minderer, M.; Heigold, G.; Gelly, S. An image is worth 16x16 words: Transformers for image recognition at scale. arXiv 2020, arXiv:2010.11929. [Google Scholar]
- Liu, Z.; Lin, Y.; Cao, Y.; Hu, H.; Wei, Y.; Zhang, Z.; Lin, S.; Guo, B. Swin Transformer: Hierarchical Vision Transformer Using Shifted Windows. In Proceedings of the IEEE/CVF International Conference on Computer Vision, Montreal, QC, Canada, 11–17 October 2021; pp. 10012–10022. [Google Scholar]
- Han, K.; Wang, Y.; Chen, H.; Chen, X.; Guo, J.; Liu, Z.; Tang, Y.; Xiao, A.; Xu, C.; Xu, Y. A survey on visual transformer. arXiv 2020, arXiv:2012.12556. [Google Scholar]
- Arnab, A.; Dehghani, M.; Heigold, G.; Sun, C.; Lučić, M.; Schmid, C. Vivit: A video vision transformer. In Proceedings of the IEEE/CVF International Conference on Computer Vision, Montreal, QC, Canada, 11–17 October 2021; pp. 6836–6846. [Google Scholar]
- Kiranyaz, S.; Ince, T.; Abdeljaber, O.; Avci, O.; Gabbouj, M. 1-D Convolutional Neural Networks for Signal Processing Applications. In Proceedings of the ICASSP 2019 IEEE International Conference on Acoustics, Speech and Signal Processing (ICASSP), Brighton, UK, 12–17 May 2019; pp. 8360–8364. [Google Scholar]
- Ma, L.; Liang, L. Enhance CNN Robustness Against Noises for Classification of 12-Lead ECG with Variable Length. In Proceedings of the 2020 19th IEEE International Conference on Machine Learning and Applications (ICMLA), Online, 14–17 December 2020; pp. 839–846. [Google Scholar]
- Mao, X.; Qi, G.; Chen, Y.; Li, X.; Duan, R.; Ye, S.; He, Y.; Xue, H. Towards robust vision transformer. arXiv 2021, arXiv:2105.07926. [Google Scholar]
- Goldberger, A.L.; Amaral, L.A.; Glass, L.; Hausdorff, J.M.; Ivanov, P.C.; Mark, R.G.; Mietus, J.E.; Moody, G.B.; Peng, C.-K.; Stanley, H.E. PhysioBank, PhysioToolkit, and PhysioNet: Components of a new research resource for complex physiologic signals. Circulation 2000, 101, e215–e220. [Google Scholar] [CrossRef] [Green Version]
- Baim, D.S.; Colucci, W.S.; Monrad, E.S.; Smith, H.S.; Wright, R.F.; Lanoue, A.; Gauthier, D.F.; Ransil, B.J.; Grossman, W.; Braunwald, E. Survival of patients with severe congestive heart failure treated with oral milrinone. J. Am. Coll. Cardiol. 1986, 7, 661–670. [Google Scholar] [CrossRef] [Green Version]
- Santurkar, S.; Tsipras, D.; Ilyas, A.; Madry, A. How does batch normalization help optimization? Adv. Neural Inf. Processing Syst. 2018, 31. [Google Scholar]
- Glorot, X.; Bordes, A.; Bengio, Y. Deep sparse rectifier neural networks. In Proceedings of the Fourteenth International Conference on Artificial Intelligence and Statistics, Ft. Lauderdale, FL, USA, 11–13 April 2011; pp. 315–323. [Google Scholar]
- Ba, J.L.; Kiros, J.R.; Hinton, G.E. Layer normalization. arXiv 2016, arXiv:1607.06450. [Google Scholar]
- Bishop, C.M. Pattern Recognition and Machine Learning; Springer: Berlin, Germany, 2006; Volume 4. [Google Scholar]
- Krizhevsky, A.; Sutskever, I.; Hinton, G.E. Imagenet classification with deep convolutional neural networks. Adv. Neural Inf. Processing Syst. 2012, 25. [Google Scholar] [CrossRef]


| Author (Year) | Method | Database | Results |
|---|---|---|---|
| Orhan (2013) [8] | EFiA-EWiT, and LR | CHF: BIDMC Normal: MITNSR | Acc: 99.33% Se: 99.36% |
| Kamath (2015) [9] | DFA | CHF: BIDMC Normal: MITNSR | Acc: 98.20% Se: 98.40% |
| Sudarshan et al. (2017) [10] | DTCWT, DT, and KNN | CHF: BIDMC Normal: Fantasia, MITNSR | Acc: 99.86% Se: 99.78% |
| Acharya et al. (2019) [11] | 11-layer deep CNN | CHF: BIDMC Normal: Fantasia | Acc: 98.97% Se: 98.87% |
| Darmawahyuni et al. (2020) [12] | LSTM | CHF: BIDMC Normal: MITNSR | Acc: 99.86% Pr: 99.86% Se: 99.85% |
| Naik et al. (2021) [13] | VGG16 | CHF: BIDMC Normal: Fantasia | Acc: 100% |
| Database | ECG Type | Sampling Rates (Hz) | ID | Individual (Sex, Age) | Total Heart Beats Used |
|---|---|---|---|---|---|
| MITNSR | Normal | 128 | 16265, 16272, 16273, 16420, 16483, 16539, 16773, 16786, 16795, 17052, 17453, 18177, 18184, 19088, 19090, 19093, 19140, 19830 | 5 men (aged 26~45), 13 women (aged 20~50) | 36,000 |
| BIDMC | CHF | 250 | chf01~chf15 | 11 men (aged 22~71), 4 women (aged 54~63) | 30,000 |
| Scheme | Category | Training Set | Test Set | ||
|---|---|---|---|---|---|
| Patient ID | Number of Heartbeats | Patient ID | Number of Heartbeats | ||
| Intra-patient | Normal | Mixed | 32,400 | Mixed | 3600 |
| (Cross-validation) | CHF | Mixed | 27,000 | Mixed | 3000 |
| Inter-patient | Normal | 16265, 16272, 16273, 16420, 16483, 16539, 16773, 16786, 16795, 17052, | 20,000 | 17453, 18177, 18184, 19088, 19090, 19093, 19140, 19830 | 16,000 |
| CHF | chf01~chf08 | 16,000 | chf09~chf15 | 14,000 |
| Parameter | Value | Alternative List | Meaning |
|---|---|---|---|
| Batch size | 512 | (32, 64, …, 1024) | Quantity of heartbeats per batch |
| Epoch | 100 | (50, 100, 150) | Number of training iterations |
| Feature channel | 32 | (8, 16, 32, 64) | Number of convolutional kernels |
| Patch length | 25 | (5, 25) | Length of the patch in the transition layer |
| Depth | 6 | (4, 5, 6, 7, 8) | Number of Transformer blocks |
| Head | 8 | (6, 7, 8, 9, 10) | Number of attention heads |
| MLP dim | 2048 | (256, 512, 1024, 2048) | Dimensions in each MLP’s hidden layer |
| Learning rate | 0.001 | (0.1, 0.01, 0.001) | Learning rate of the optimizer |
| Original/Predicted | Normal | CHF | Pr (%) | Se (%) |
|---|---|---|---|---|
| Normal | 35,987 | 13 | 99.96 | 99.96 |
| CHF | 14 | 29,986 | 99.96 | 99.95 |
| Average (%) | 99.96 | 99.96 | ||
| Acc (%) | 99.96 | |||
| Original/Predicted | Normal | CHF | Pr (%) | Se (%) |
|---|---|---|---|---|
| Normal | 15,694 | 306 | 99.82 | 98.09 |
| CHF | 29 | 13,971 | 97.86 | 99.79 |
| Average (%) | 98.84 | 98.94 | ||
| Acc (%) | 98.88 | |||
| SNR (dB) | ACC (%) | Pr (%) | Se (%) |
|---|---|---|---|
| ∞ | 98.88 | 98.84 | 98.94 |
| 24 | 98.60 | 98.56 | 98.64 |
| 18 | 97.99 | 97.98 | 97.99 |
| 12 | 94.69 | 95.04 | 94.45 |
| 6 | 87.97 | 89.99 | 87.24 |
| Model | Acc (%) | Average | |
|---|---|---|---|
| Pr (%) | Se (%) | ||
| CNN (1D Alex-Net) | 97.99 | 97.98 | 97.98 |
| ViT | 95.36 | 95.55 | 95.19 |
| Conv + ViT | 95.45 | 95.62 | 95.29 |
| Conv + BN + ViT | 98.32 | 98.29 | 98.35 |
| Conv + BN + ReLu + ViT | 98.19 | 98.17 | 98.20 |
| Conv + BN + ReLu + Pooling + ViT (ECVT-Net) | 98.88 | 98.84 | 98.94 |
| Author | Method | Results | |
|---|---|---|---|
| Intra-Patient | Inter-Patient | ||
| Orhan. [8] | EFiA-EWiT, and LR | Acc: 99.33% Se: 99.36% | |
| Kamath. [9] | DFA | Acc: 98.20% Se: 98.40% | |
| Darmawahyuni et al. [12] | LSTM | Acc: 99.86% Pr: 99.86% Se: 99.85% | |
| Ours | ECVT-Net | Acc: 99.96% Pr: 99.96% Se: 99.96% | Acc: 98.88% Pr: 98.84% Se: 98.94% |
Publisher’s Note: MDPI stays neutral with regard to jurisdictional claims in published maps and institutional affiliations. |
© 2022 by the authors. Licensee MDPI, Basel, Switzerland. This article is an open access article distributed under the terms and conditions of the Creative Commons Attribution (CC BY) license (https://creativecommons.org/licenses/by/4.0/).
Share and Cite
Liu, T.; Si, Y.; Yang, W.; Huang, J.; Yu, Y.; Zhang, G.; Zhou, R. Inter-Patient Congestive Heart Failure Detection Using ECG-Convolution-Vision Transformer Network. Sensors 2022, 22, 3283. https://doi.org/10.3390/s22093283
Liu T, Si Y, Yang W, Huang J, Yu Y, Zhang G, Zhou R. Inter-Patient Congestive Heart Failure Detection Using ECG-Convolution-Vision Transformer Network. Sensors. 2022; 22(9):3283. https://doi.org/10.3390/s22093283
Chicago/Turabian StyleLiu, Taotao, Yujuan Si, Weiyi Yang, Jiaqi Huang, Yongheng Yu, Gengbo Zhang, and Rongrong Zhou. 2022. "Inter-Patient Congestive Heart Failure Detection Using ECG-Convolution-Vision Transformer Network" Sensors 22, no. 9: 3283. https://doi.org/10.3390/s22093283