
Experimental Study on Bottom-Up Detection of Underwater Targets Based on Polarization Imaging

 ,
,
Abstract
:1. Introduction
2. Data and Methods
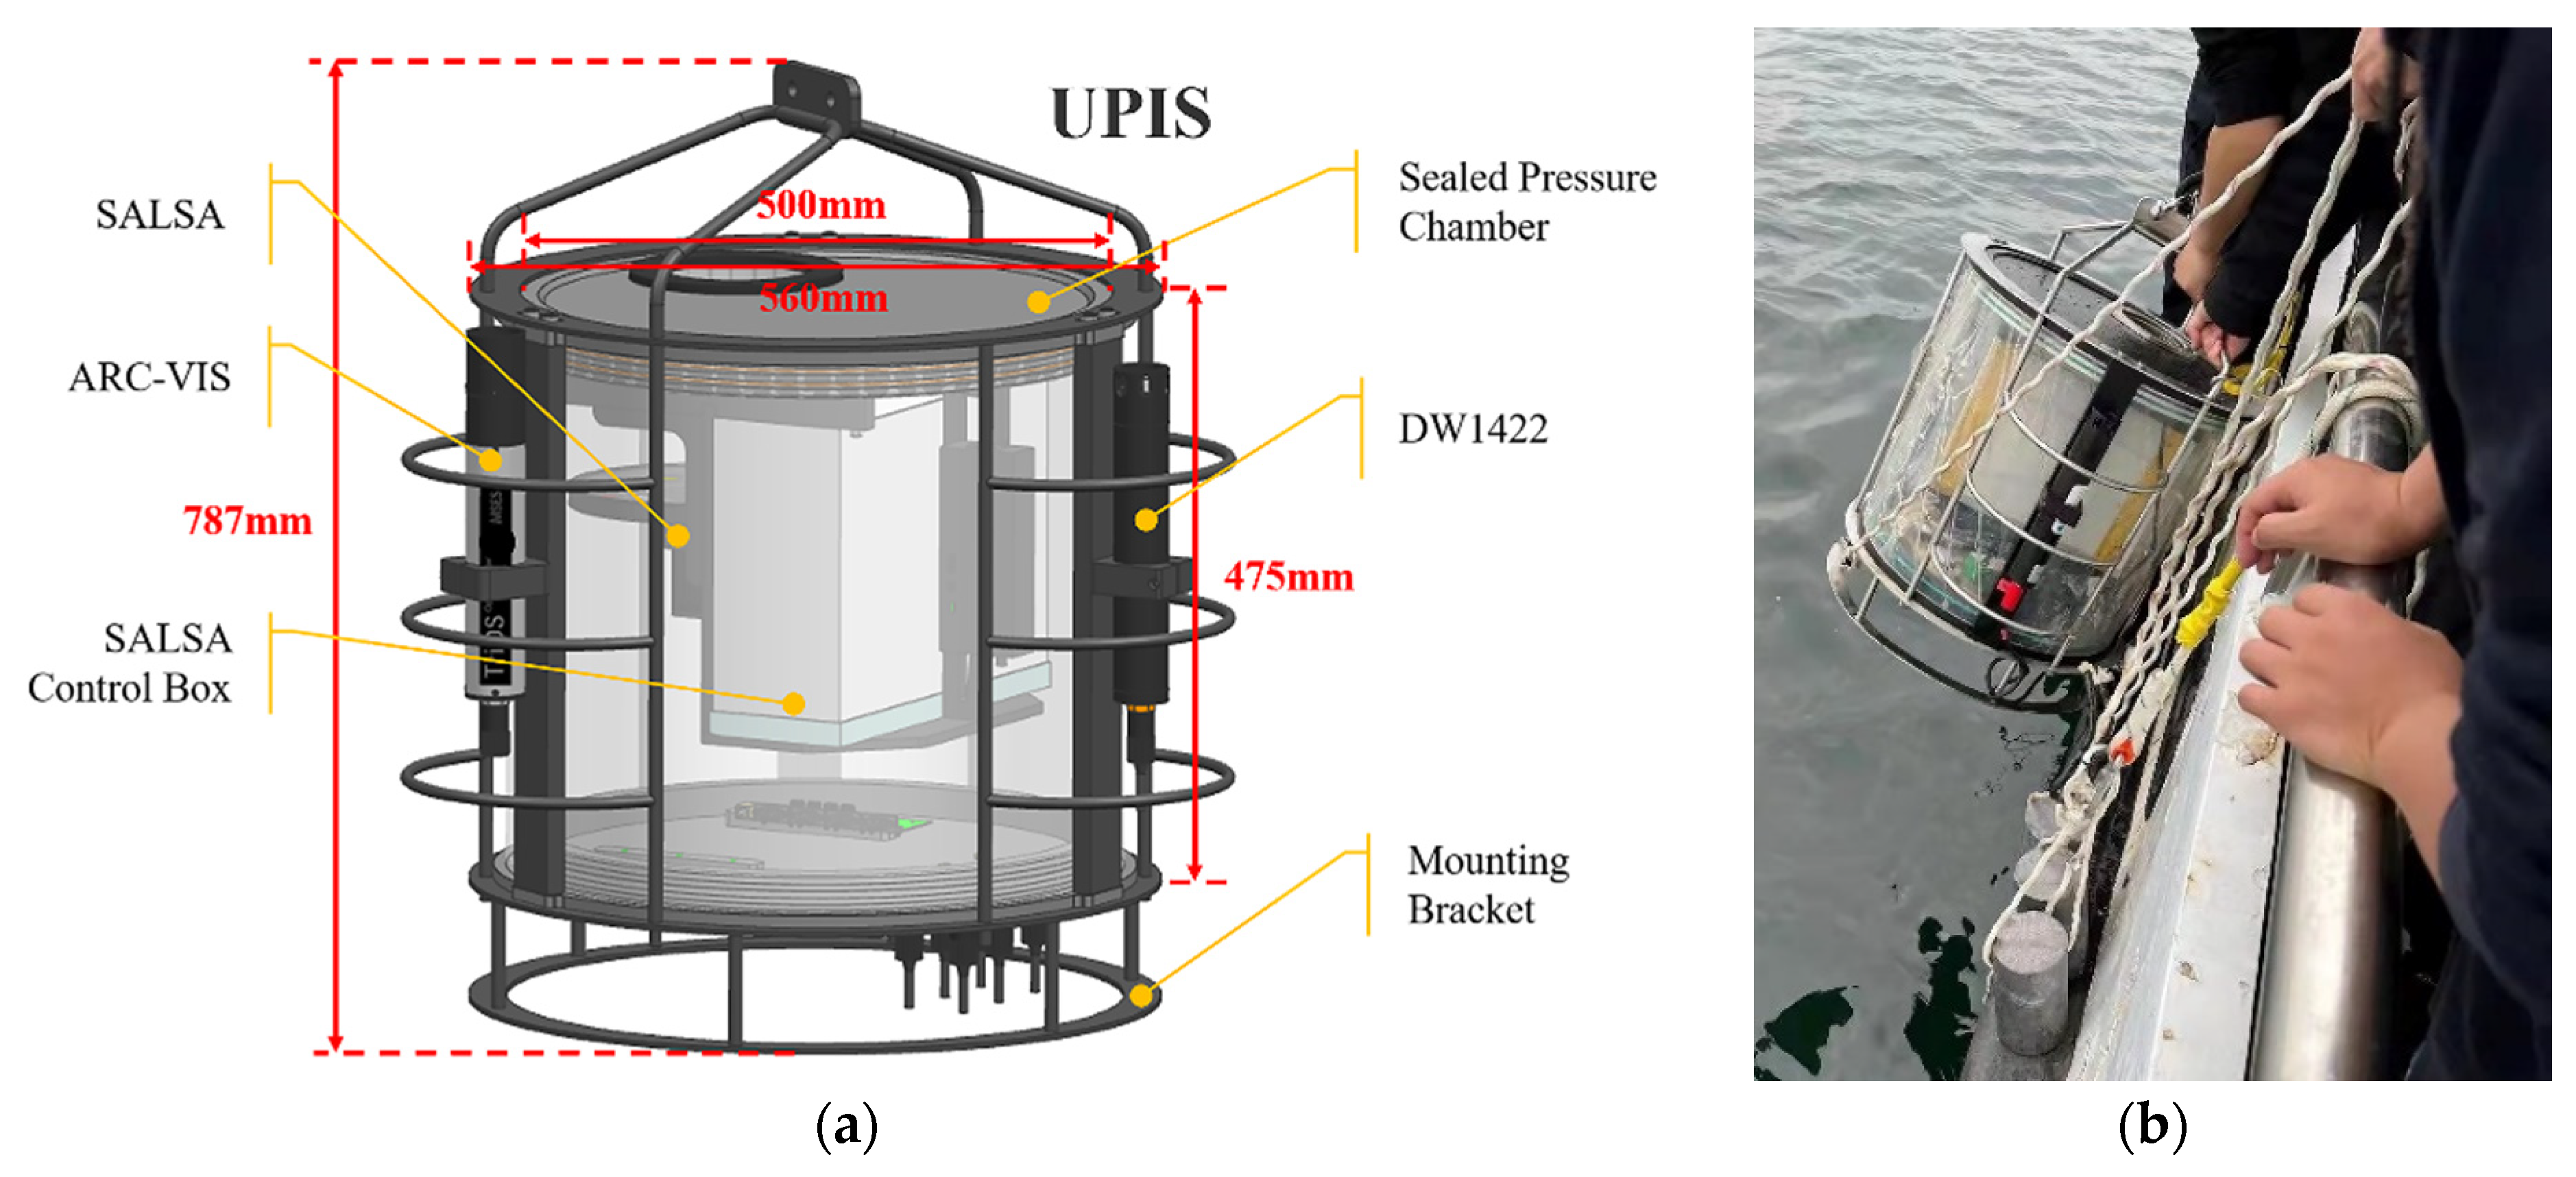
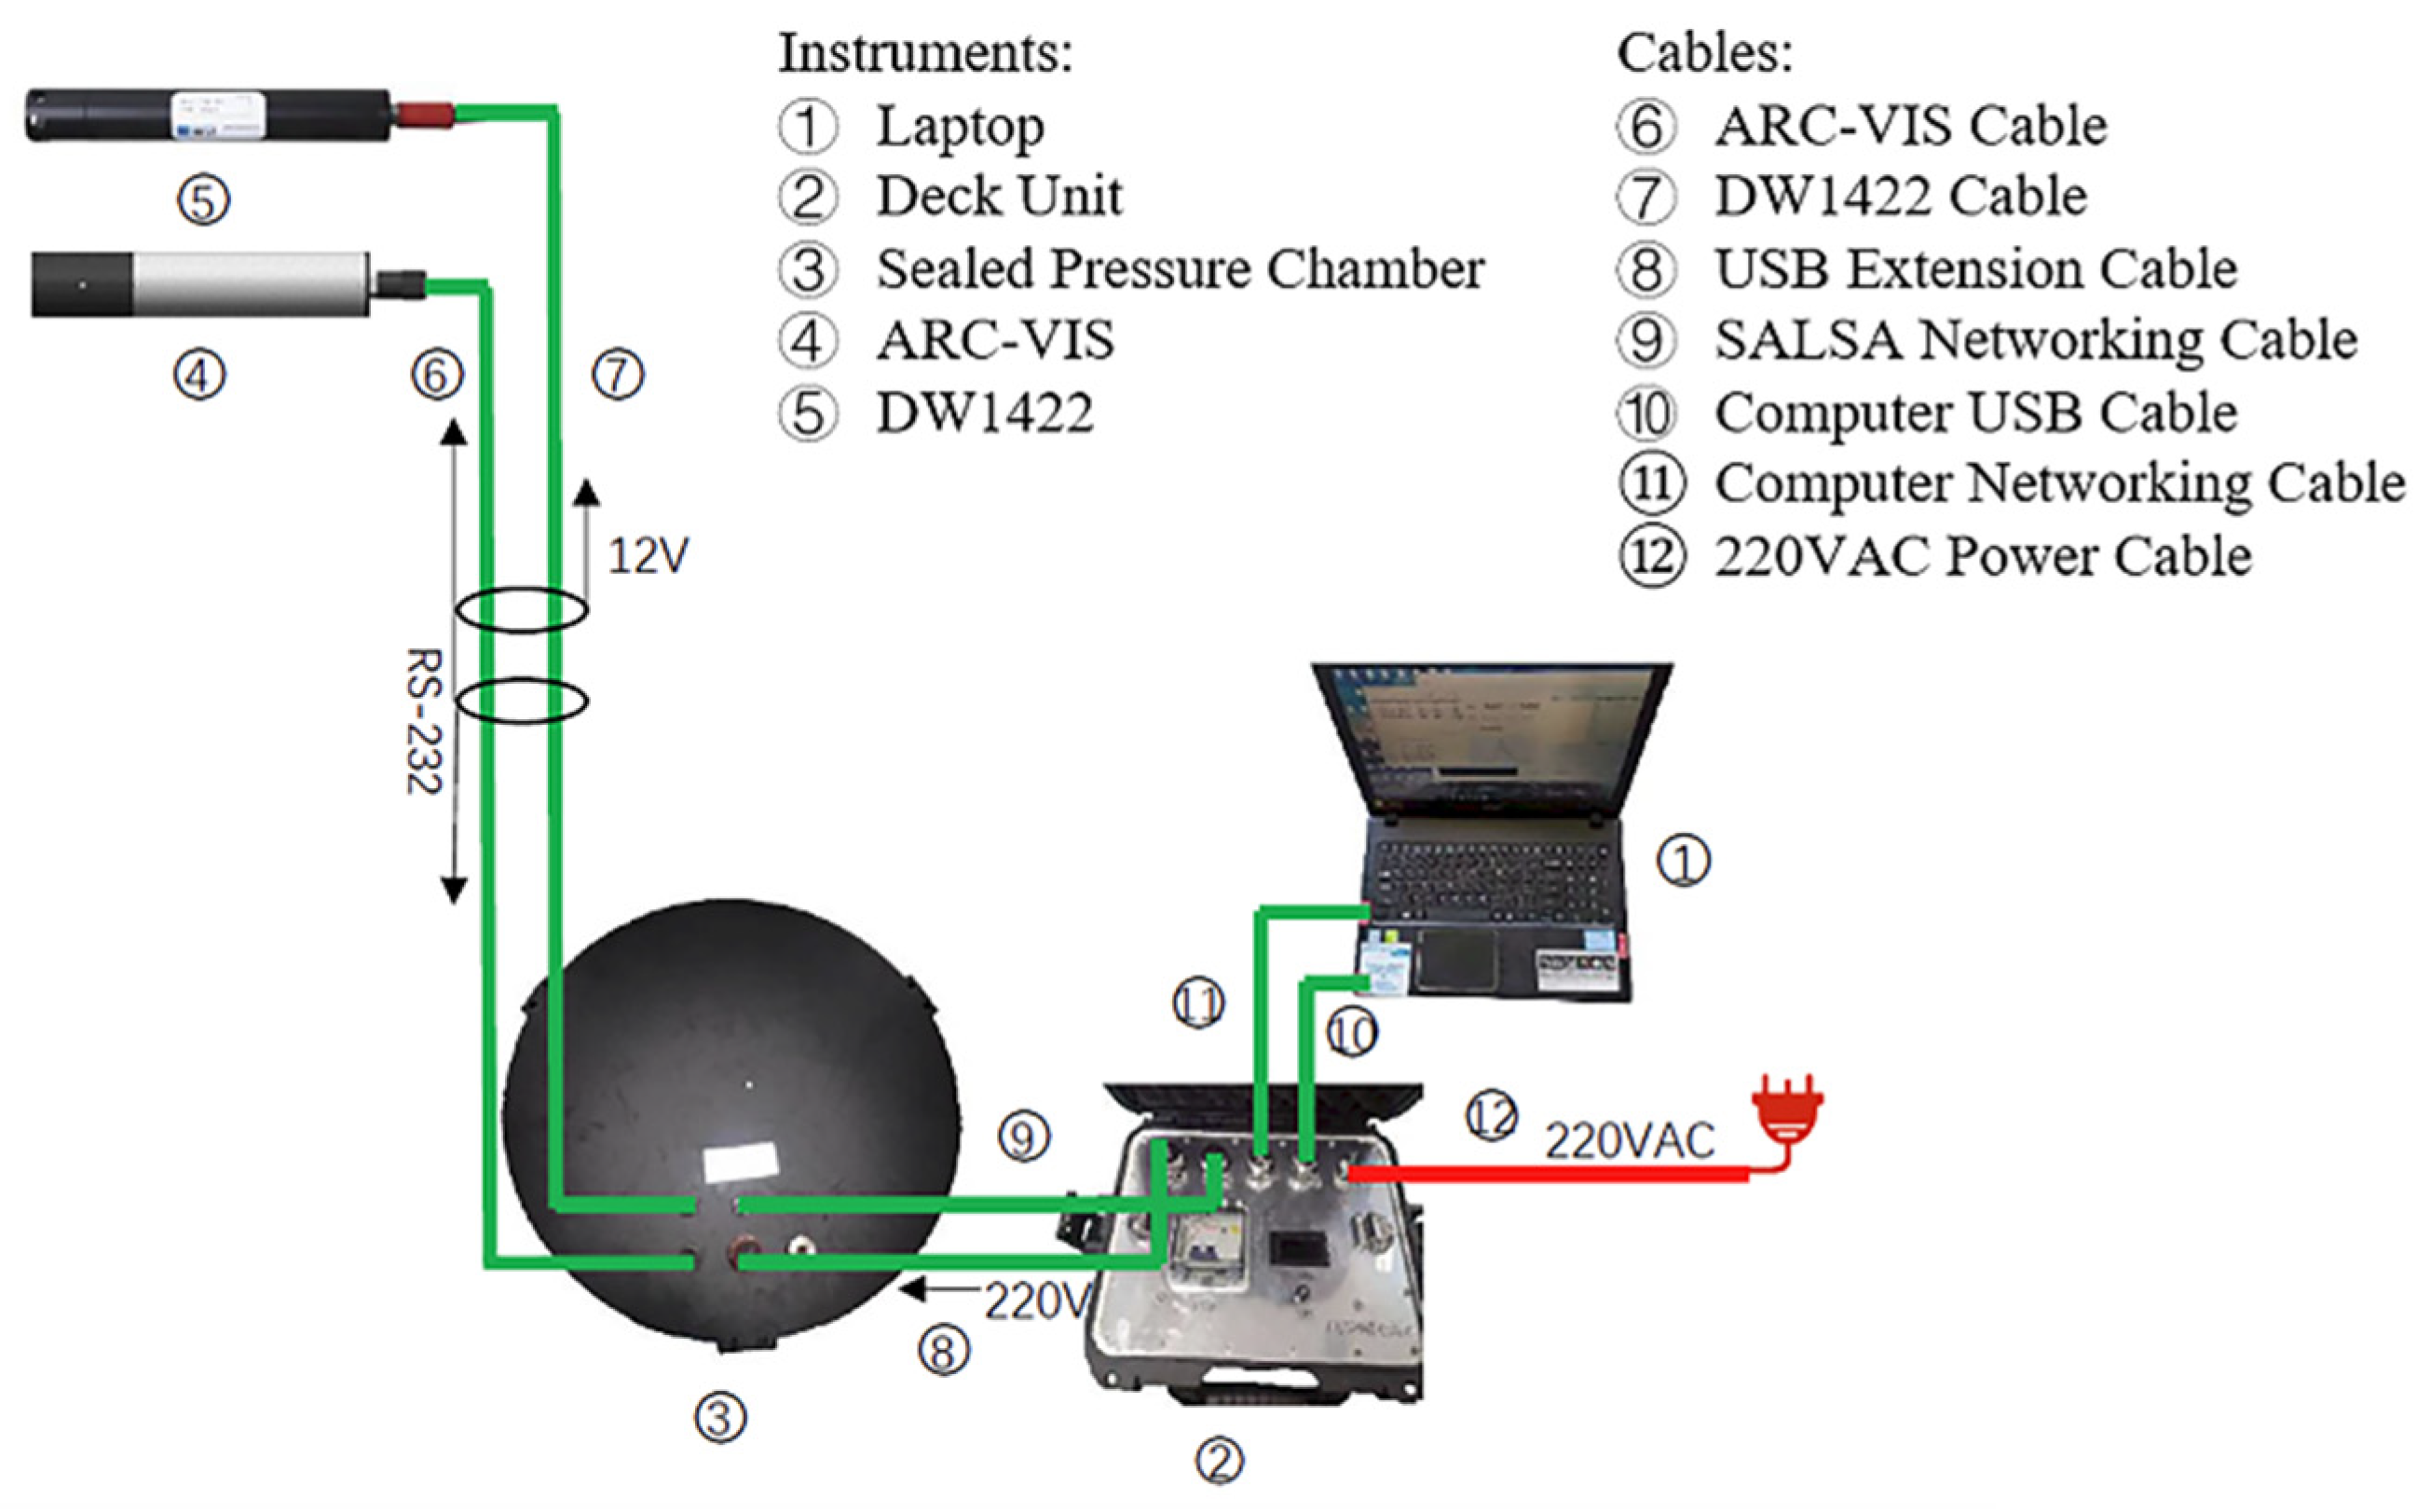
2.1. UPIS
2.2. Polarization Measurement Using the UPIS
- DOP represents the ratio of polarized part (linear polarization and circular polarization) to the total intensity of received light. It is calculated as follows:
- 2.
- DOLP refers to the ratio of the linearly polarized part to the total intensity of received light. It is calculated as follows:
- 3.
- DOCP refers to the ratio of the circularly polarized part to the total intensity of received light. It is calculated as follows:
- 4.
- AOP denotes the azimuthal angle relative to elliptical polarization when the light is partially or totally linearly polarized. It is calculated (in units of degrees) as follows:
- 5.
- ε denotes the elliptic angle relative to elliptical polarization when the light is partially or totally linearly polarized. It is calculated (in units of degrees) as follows:
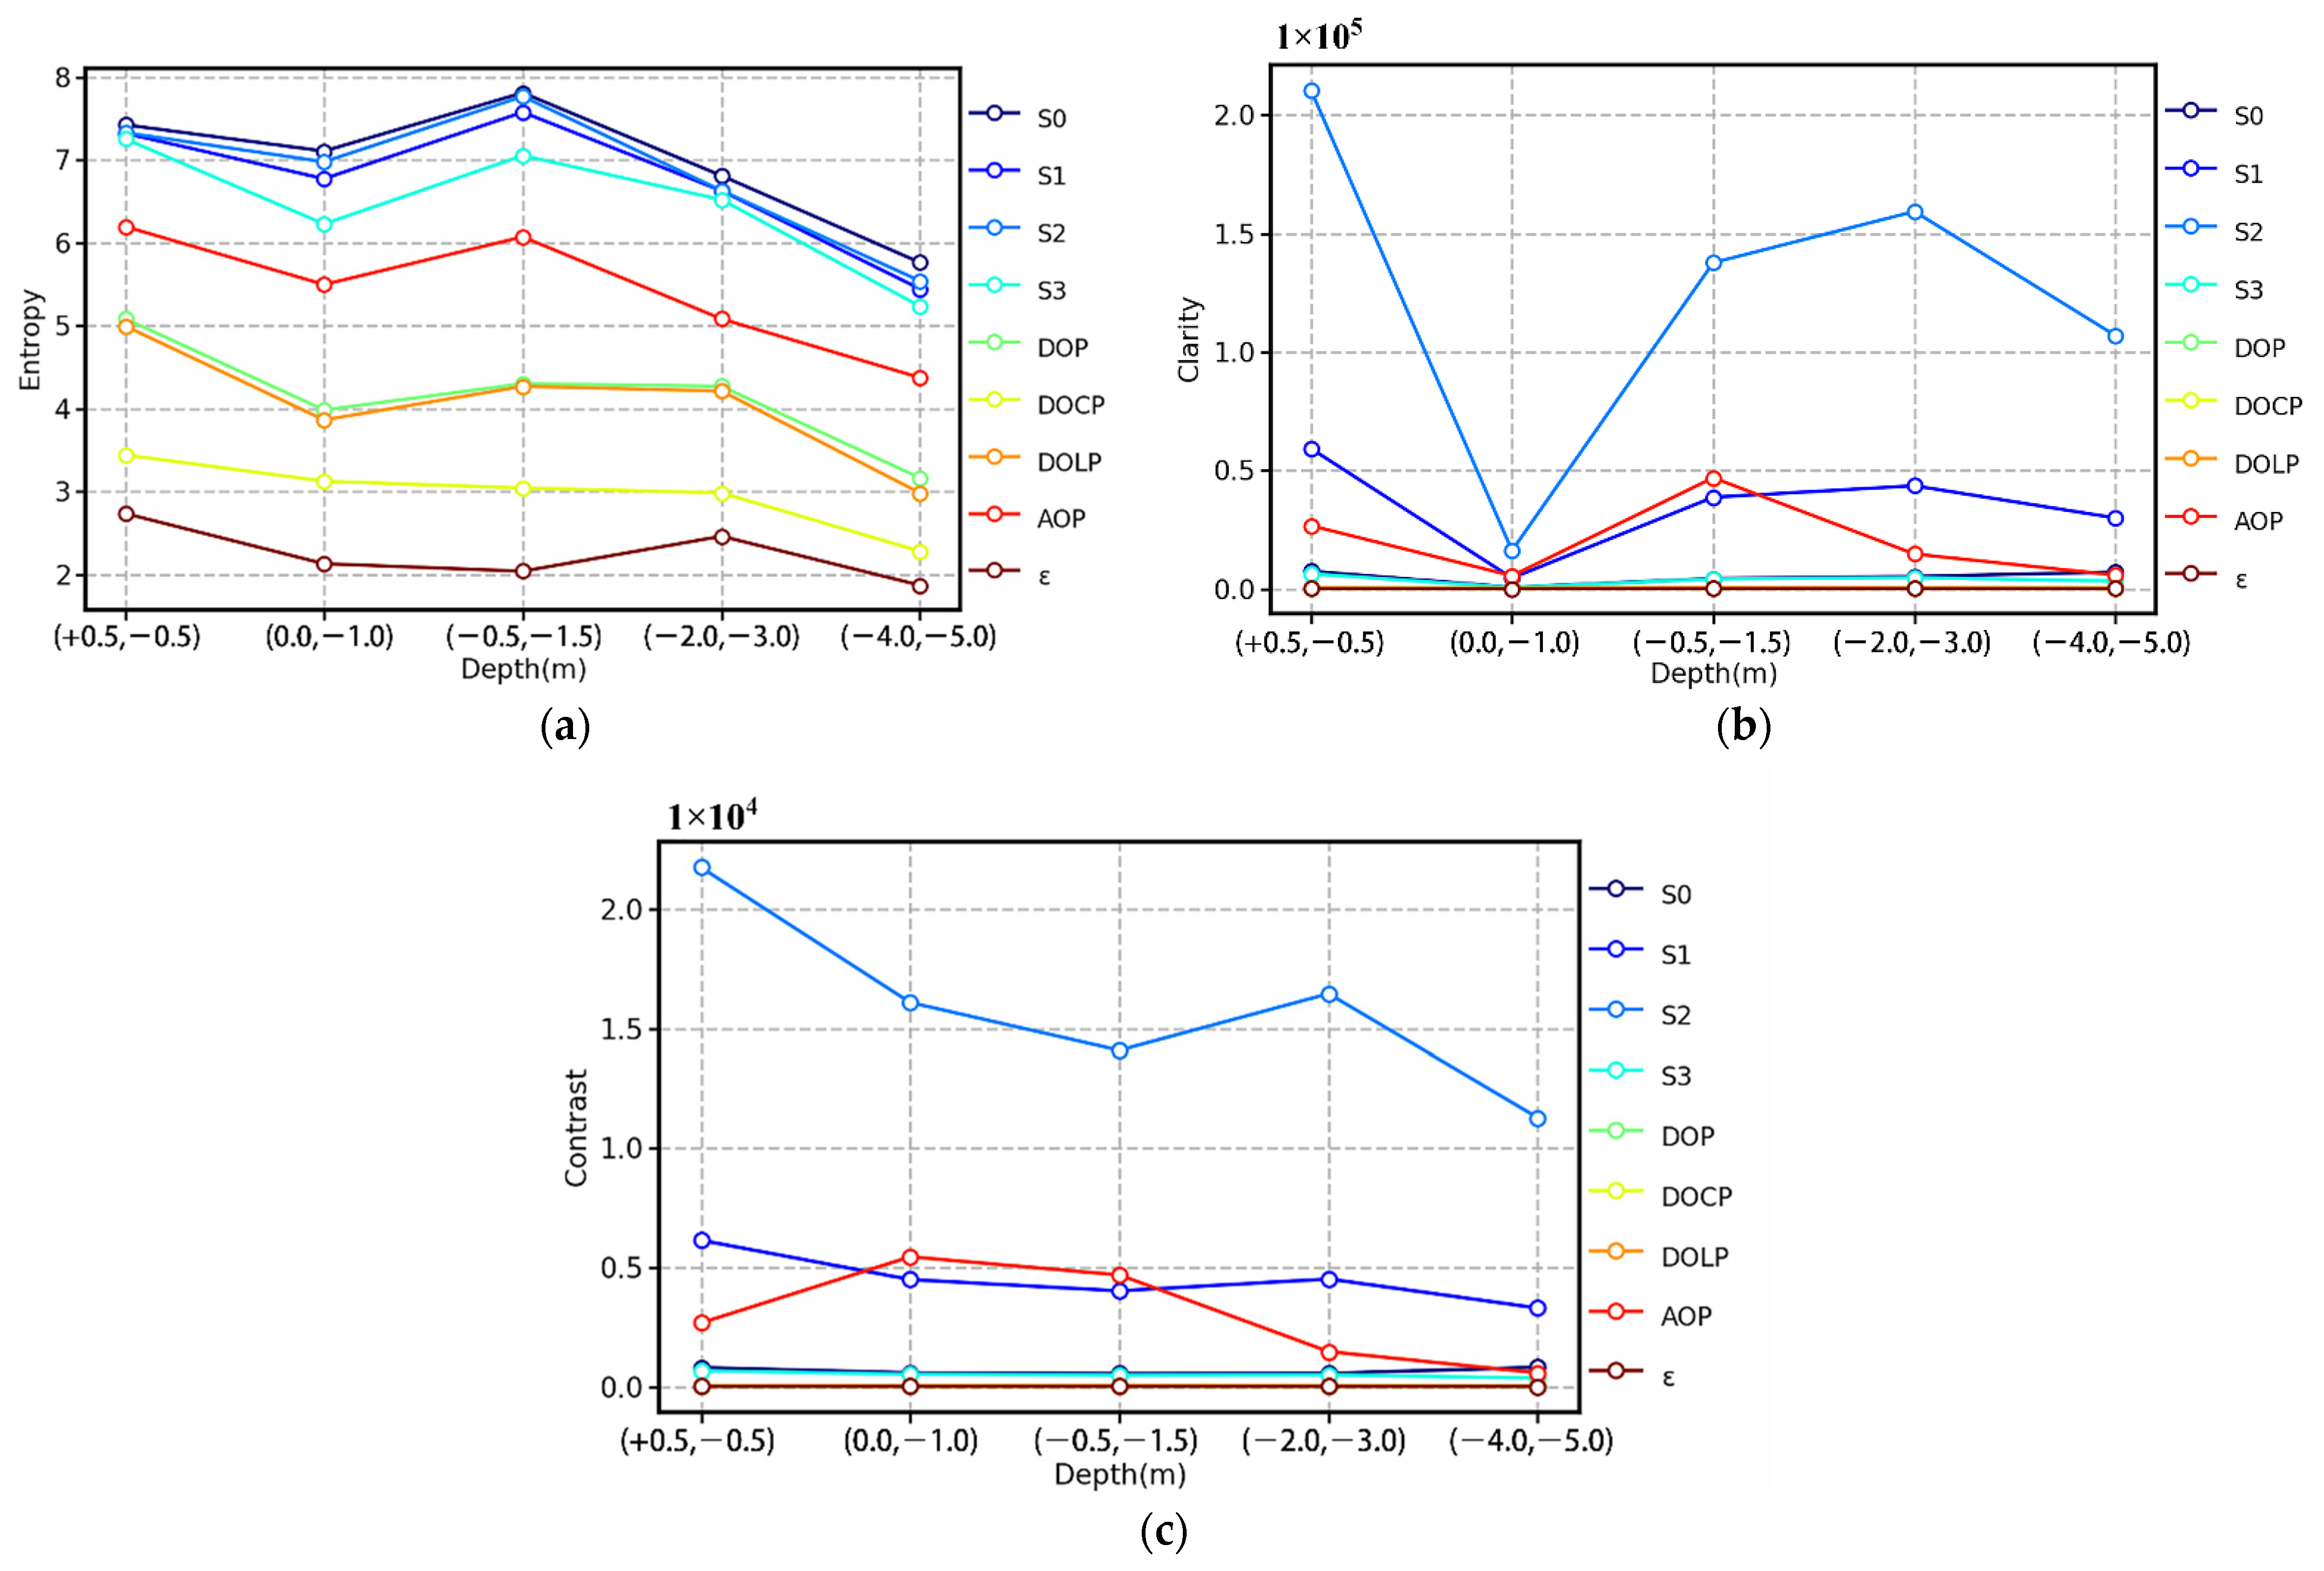
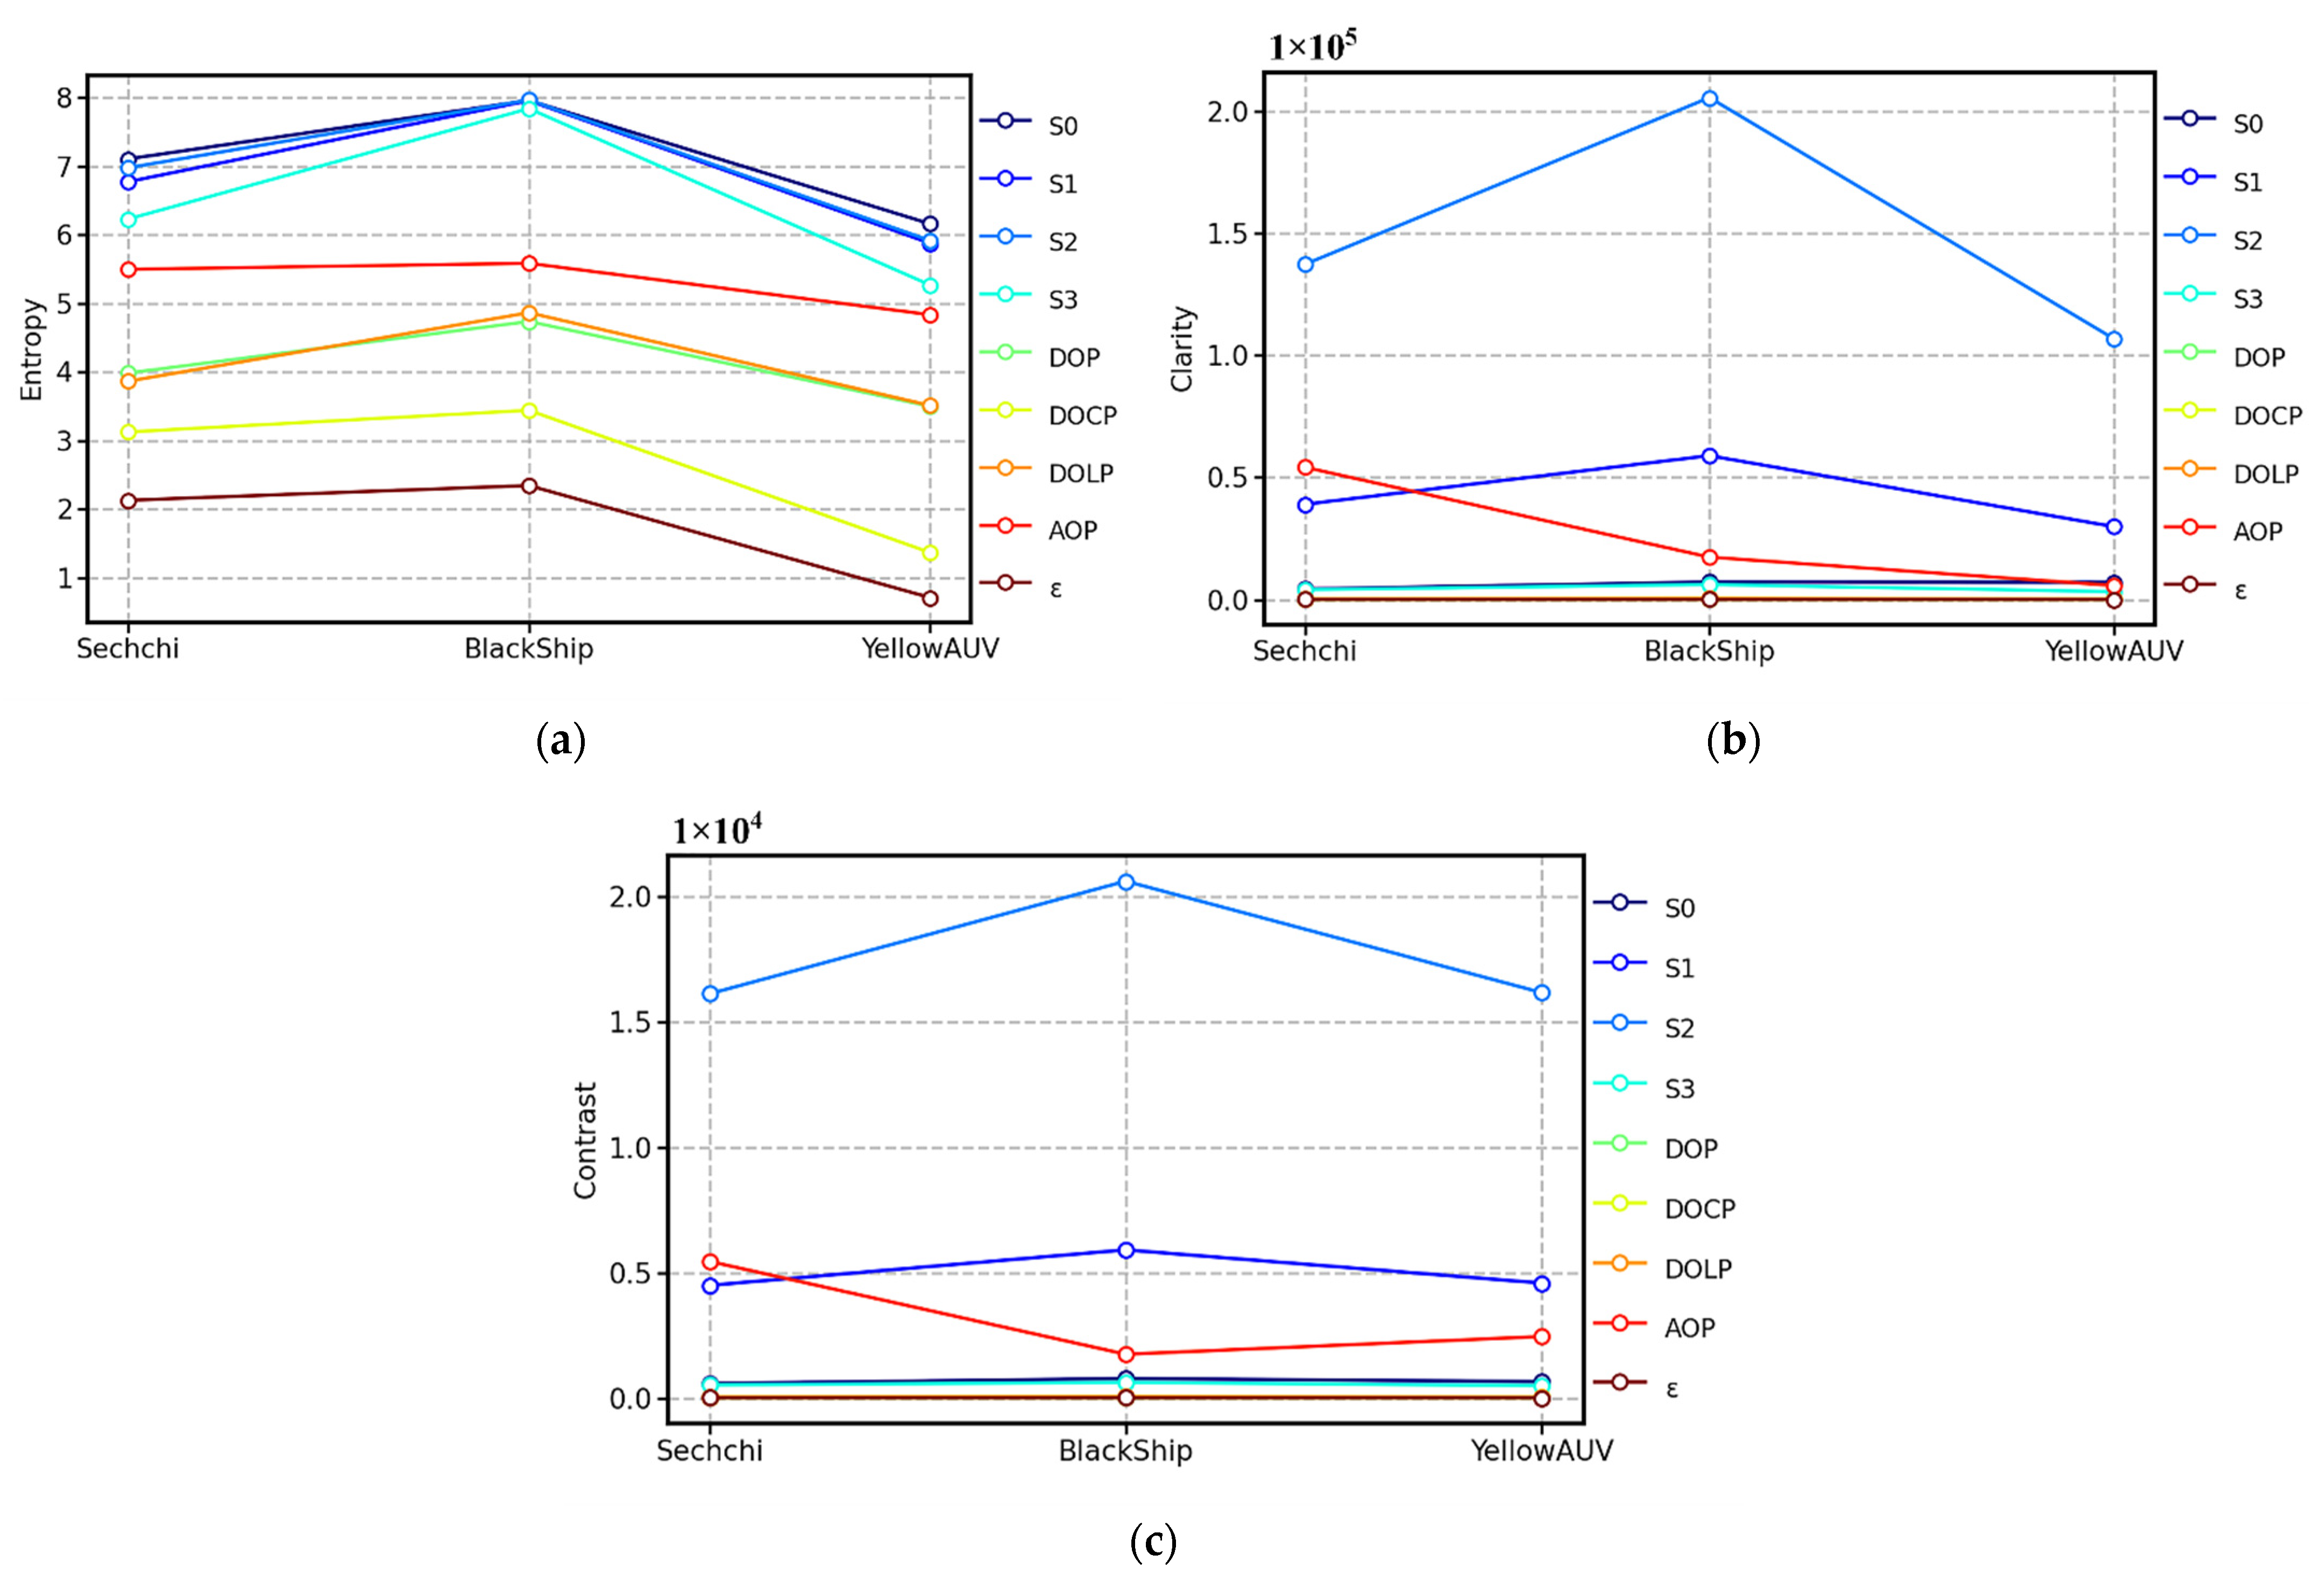
2.3. Evaluation Index of Image Quality
- Entropy. The entropy reflects the amount of information contained in the corresponding image. When the image has only one color, that is, the image contains only one gray value, the entropy of this image is 0. When the gray value of each pixel is different, the entropy is maximum. The entropy equation for a gray image is [24]:
- 2.
- Clarity. We obtain the gradient matrix G (x, y) by convoluting the Laplace operator and the gray value of each pixel in the image and taking the sum of squares of G (x, y) as the clarity evaluation function. Therefore, clarity can be written in terms of the gradient matrix G (x, y) as [25]:
- 3.
- Contrast. The evaluation index of different brightness levels of the image is contrast. The higher the brightness level, the higher the contrast. Contrast reflects the level at which the details in the image can be distinguished by the naked eye. The formula is as follows [26]:
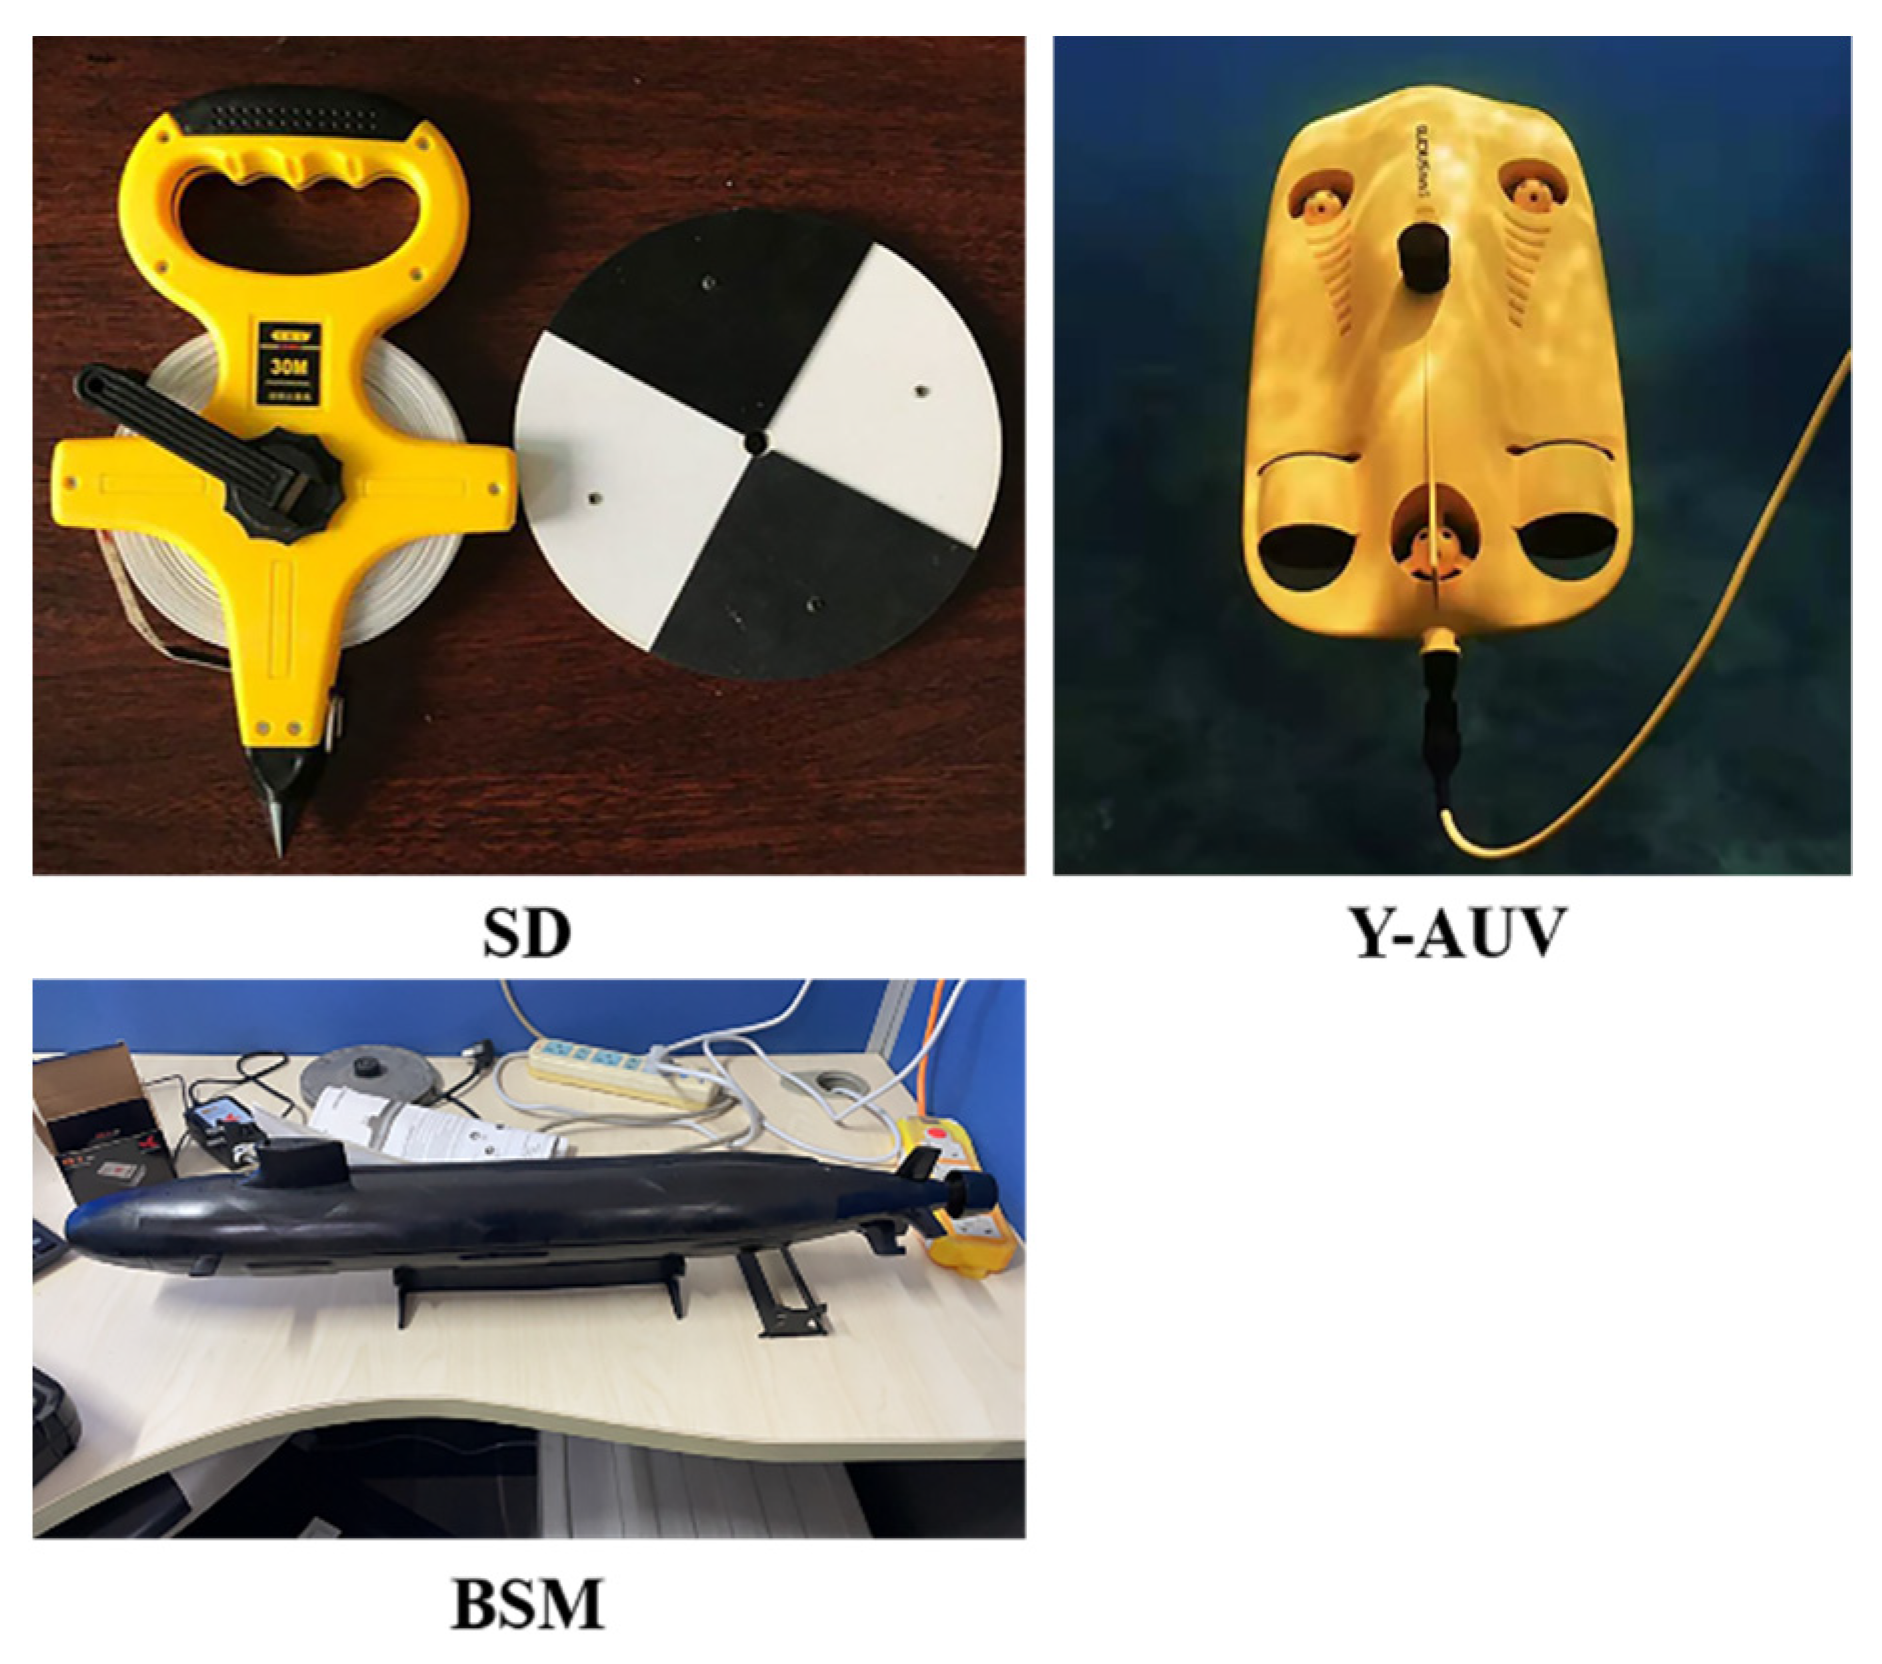
3. Underwater Target Detection Using the UPIS
4. Results
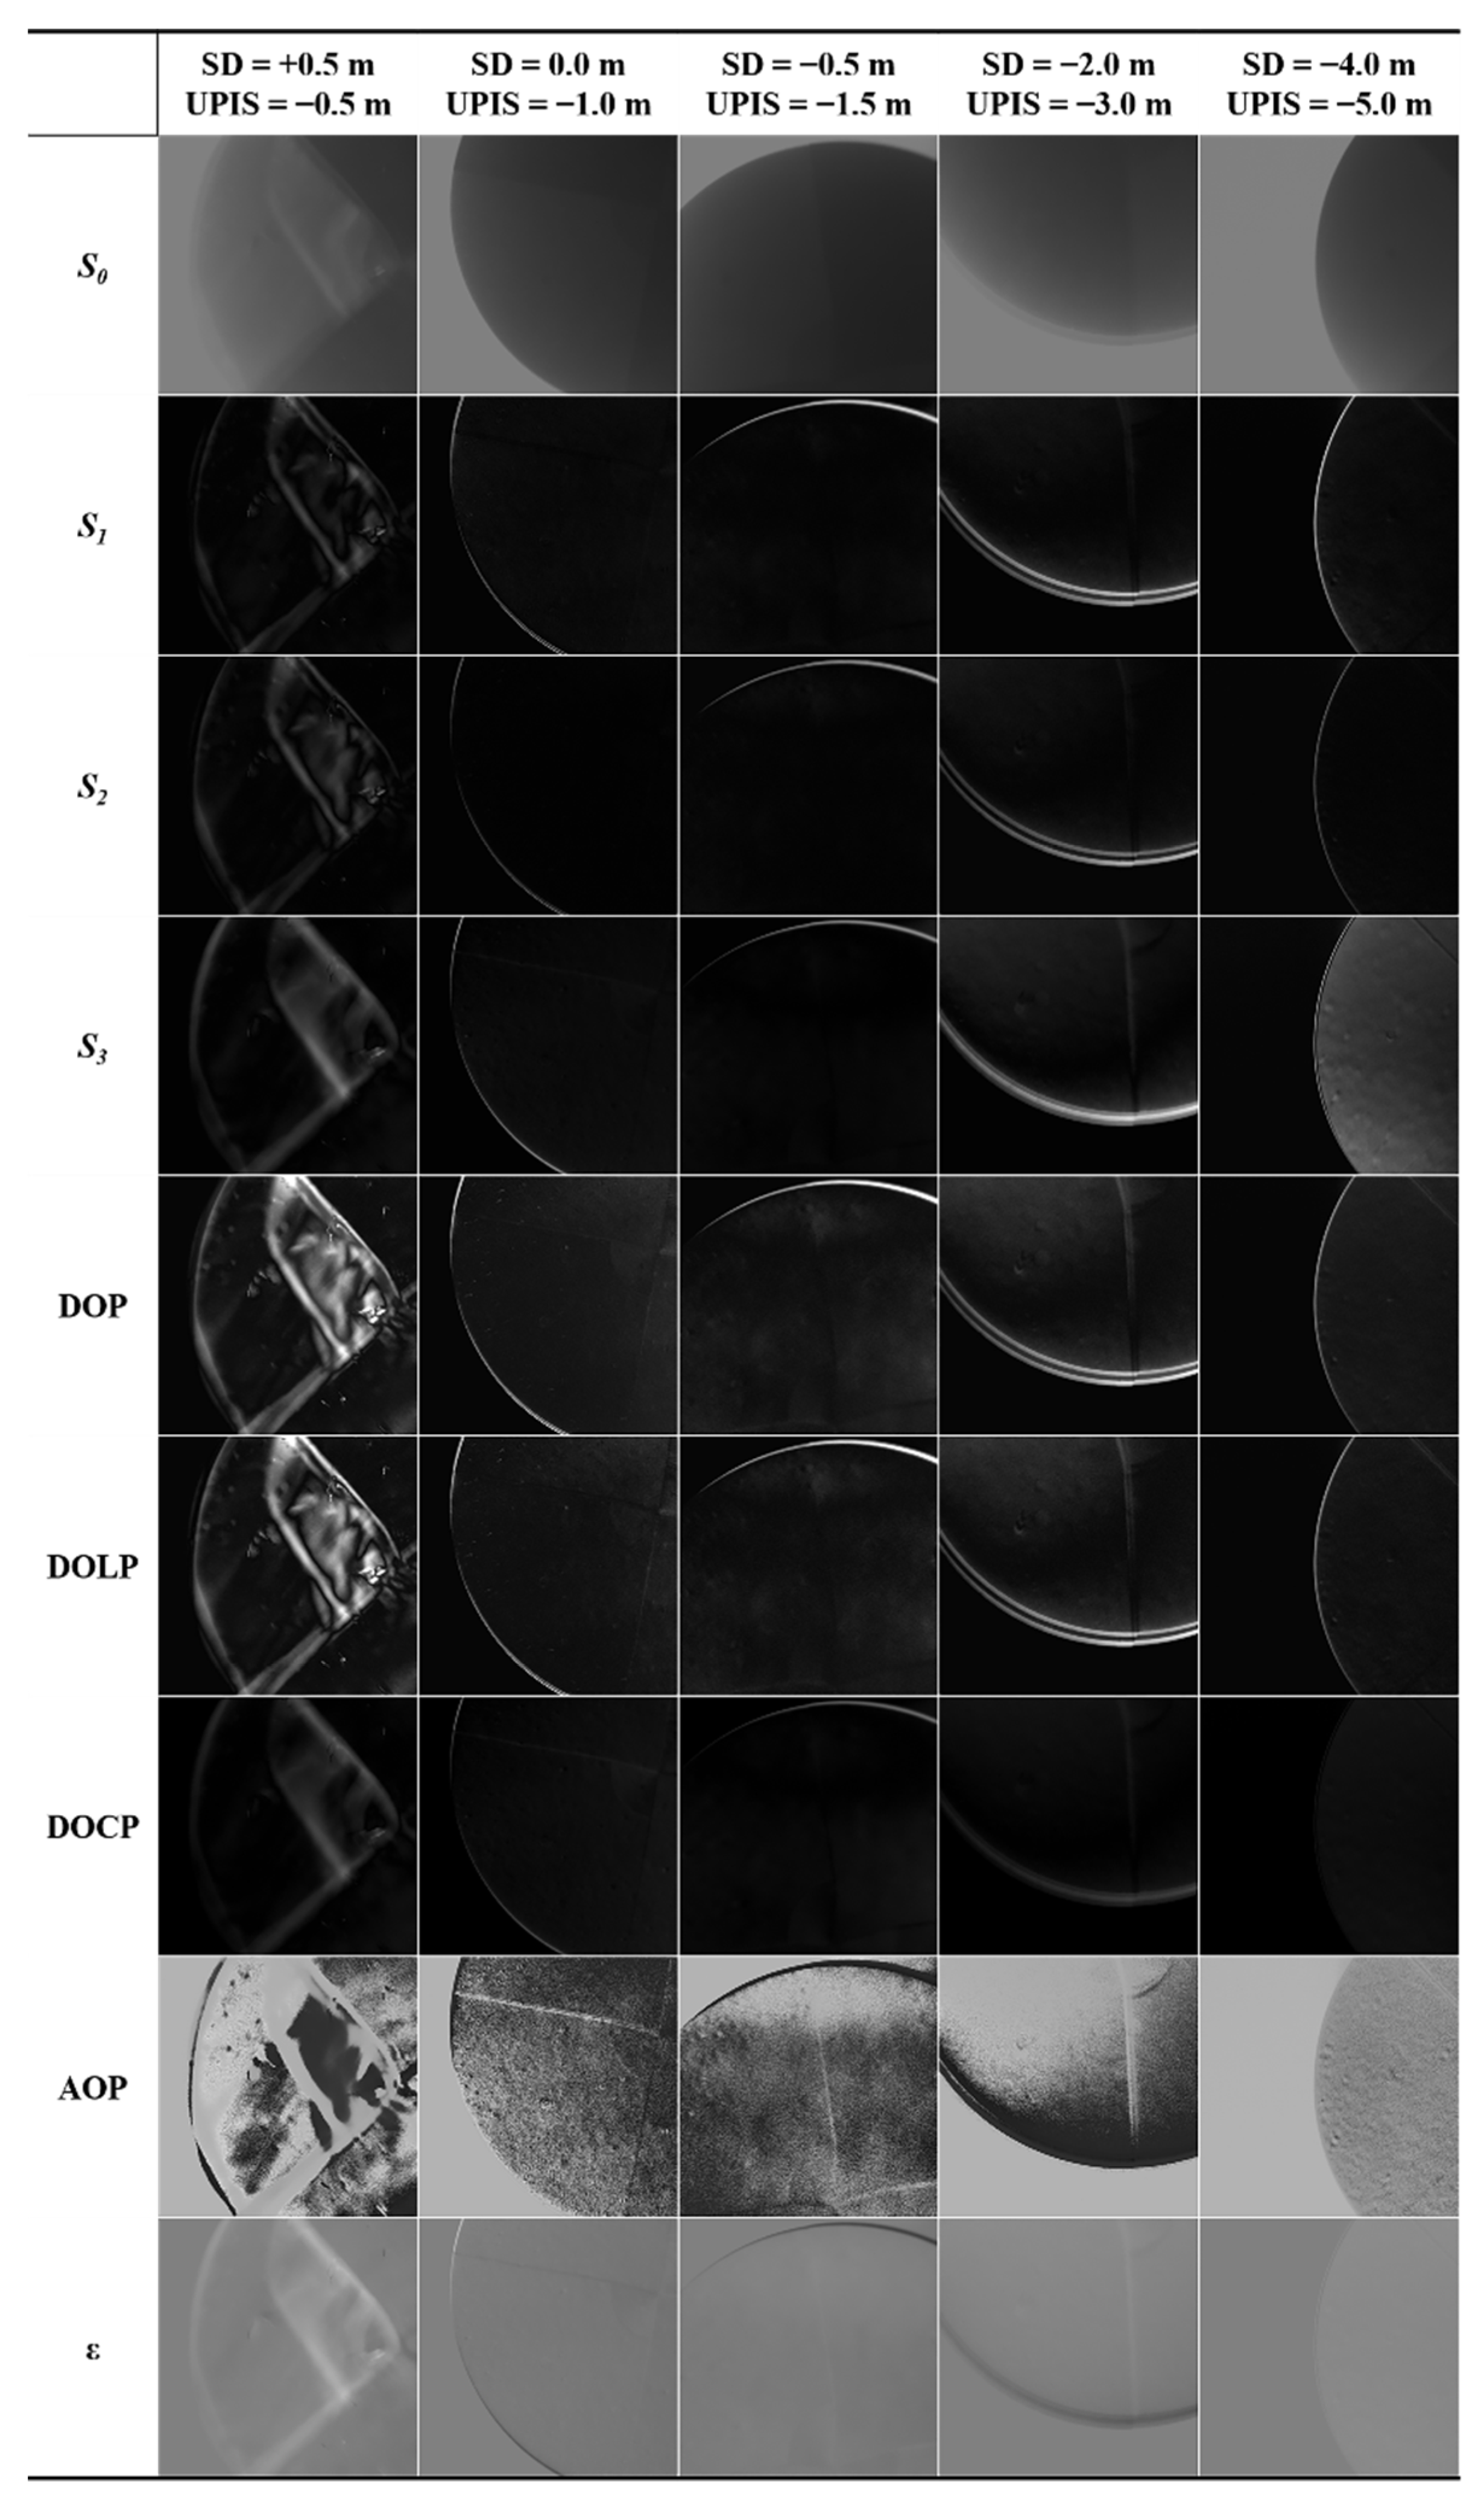
4.1. Same Target with Different Depths
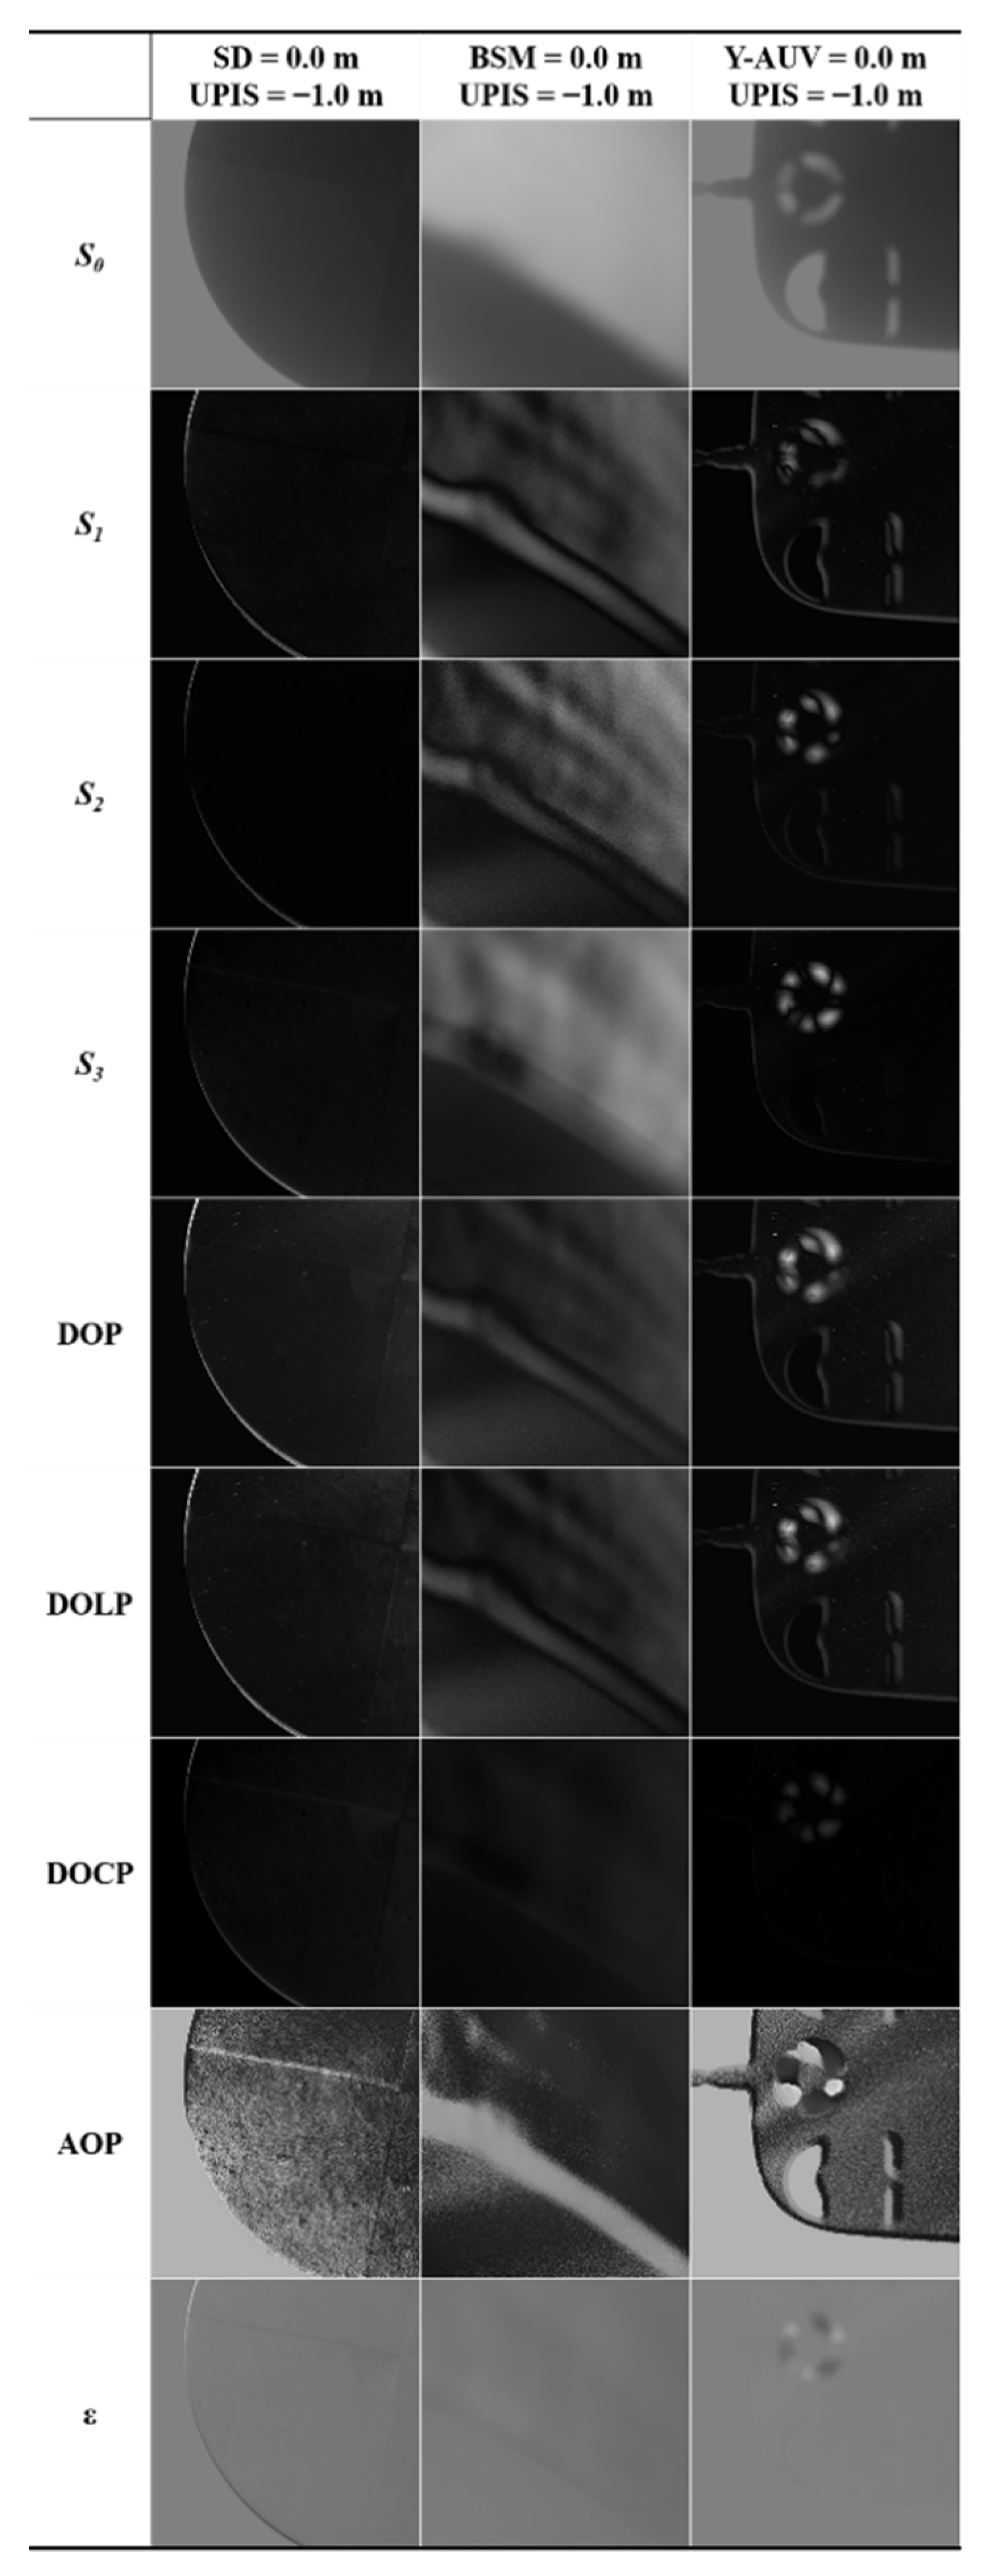
4.2. Different Targets with the Same Depth
5. Discussion
6. Conclusions
Author Contributions
Funding
Institutional Review Board Statement
Informed Consent Statement
Data Availability Statement
Acknowledgments
Conflicts of Interest
References
- Lavest, J.M.; Guichard, F.; Rousseau, C. Multi-view reconstruction combining underwater and air sensors. In Proceedings of the International Conference on Image Processing, Rochester, NY, USA, 22–25 September 2002; pp. 813–816. [Google Scholar]
- Chennu, A.; Farber, P.; De’ath, G.; de Beer, D.; Fabricius, K.E. A diver-operated hyperspectral imaging and topographic surveying system for automated mapping of benthic habitats. Sci. Rep. 2017, 7, 7122. [Google Scholar] [CrossRef] [PubMed]
- Panetta, K.; Gao, C.; Agaian, S. Human-Visual-System-Inspired Underwater Image Quality Measures. IEEE J. Ocean. Eng. 2016, 41, 541–551. [Google Scholar] [CrossRef]
- Schettini, R.; Corchs, S. Underwater Image Processing: State of the Art of Restoration and Image Enhancement Methods. EURASIP J. Adv. Signal Process. 2010, 2010, 746052. [Google Scholar] [CrossRef] [Green Version]
- Chiang, J.Y.; Chen, Y.C. Underwater image enhancement by wavelength compensation and dehazing. IEEE Trans. Image Process. 2012, 21, 1756–1769. [Google Scholar] [CrossRef] [PubMed]
- Tyo, J.S.; Rowe, M.P.; Pugh, E.N.; Engheta, N. Target detection in optically scattering media by polarization-difference imaging. Appl. Opt. 1996, 35, 1855–1870. [Google Scholar] [CrossRef]
- Liang, J.; Ren, L.; Ju, H.; Zhang, W.; Qu, E. Polarimetric dehazing method for dense haze removal based on distribution analysis of angle of polarization. Opt. Express 2015, 23, 26146–26157. [Google Scholar] [CrossRef]
- Amer, K.O.; Elbouz, M.; Alfalou, A.; Brosseau, C.; Hajjami, J. Enhancing underwater optical imaging by using a low-pass polarization filter. Opt. Express 2019, 27, 621–643. [Google Scholar] [CrossRef]
- van der Laan, J.D.; Scrymgeour, D.A.; Kemme, S.A.; Dereniak, E.L. Detection range enhancement using circularly polarized light in scattering environments for infrared wavelengths. Appl. Opt. 2015, 54, 2266–2274. [Google Scholar] [CrossRef] [PubMed]
- Cariou, J.; Le Jeune, B.; Lotrian, J.; Guern, Y. Polarization effects of seawater and underwater targets. Appl. Opt. 1990, 29, 1689–1695. [Google Scholar] [CrossRef] [PubMed]
- Jordan, D.L.; Lewis, G. Infrared polarization signatures. In Proceedings of the Atmospheric Propagation Effects through Natural and Man-Made Obscurants of Visible to MM-Wave Radiation, Vol.542 of AGARD Conference Proceedings (Advisory Group for Aerospace Research and Development), Paris, France, 1 November 1993; Available online: https://apps.dtic.mil/sti/pdfs/ADA276919.pdf#page=120 (accessed on 29 March 2022).
- McCoy, R.D.; Verbout, S.M.; Netishen, C.M.; Novak, L.M.; Tanenhaus, M.E. Polarimetric techniques for enhancing SAR imagery. In Proceedings of the Synthetic Aperture Radar; International Society for Optics and Photonics: Los Angeles, CA, USA, 1992; Volume 1630, pp. 141–173. [Google Scholar]
- Schechner, Y.Y.; Karpel, N. Clear underwater vision. In Proceedings of the 2004 IEEE Computer Society Conference on Computer Vision and Pattern Recognition, 2004. CVPR 2004, Washington, DC, USA, 27 June–2 July 2004; p. I. [Google Scholar]
- Yemelyanov, K.M.; Lin, S.-S.; Pugh, J.E.N.; Engheta, N. Adaptive algorithms for two-channel polarization sensing under various polarization statistics with nonuniform distributions. Appl. Opt. 2006, 45, 5504–5520. [Google Scholar] [CrossRef] [PubMed]
- Watkins, W.R.; Egan, W.G.; Clement, D.; Reynolds, W.R. Enhancement of optical detectability with polarization. In Proceedings of the Targets and Backgrounds: Characterization and Representation V, Orlando, FL, USA, 5–9 April 1999; pp. 38–48. [Google Scholar]
- Cooper, A.; Crittenden, E.; Milne, E.; Walker, P.; Moss, E.; Gregoris, D. Mid- and Far-Infrared Measurements of Sun Glint from the Sea Surface; SPIE: San Diego, CA, USA, 1992; Volume 1749. [Google Scholar]
- Lewis, G.D.; Jordan, D.L.; Roberts, P.J. Backscattering target detection in a turbid medium by polarization discrimination. Appl. Opt. 1999, 38, 3937–3944. [Google Scholar] [CrossRef] [PubMed]
- Tiwari, S.P.; Sarma, Y.V.B.; Kürten, B.; Ouhssain, M.; Jones, B.H. An Optical Algorithm to Estimate Downwelling Diffuse Attenuation Coefficient in the Red Sea. IEEE Trans. Geosci. Remote Sens. 2018, 56, 7174–7182. [Google Scholar] [CrossRef]
- Collett, E. Polarized Light. Fundamentals and Applications; Marcel Dekker: New York, NY, USA, 1993. [Google Scholar]
- Lefaudeux, N.; Lechocinski, N.; Breugnot, S.; Clemenceau, P. Compact and robust linear Stokes polarization camera. In Polarization: Measurement, Analysis, and Remote Sensing, 8th ed.; International Society for Optics and Photonics: Orlando, FL, USA, 2008; Volume 6972, p. 69720B. [Google Scholar]
- Vedel, M.; Lechocinski, N.; Breugnot, S. 3D Shape Reconstruction of Optical Element Using Polarization; SPIE: Orlando, FL, USA, 2010; Volume 7672. [Google Scholar]
- Vedel, M.; Lechocinski, N.; Breugnot, S. Compact and Robust Linear Stokes Polarization Camera. EPJ Web Conf. 2010, 5, 01005. [Google Scholar] [CrossRef] [Green Version]
- Chenault, D.B.; Goldstein, D.H.; El Ketara, M.; Vedel, M.; Breugnot, S. Acquisition method improvement for Bossa Nova Technologies’ full Stokes, passive polarization imaging camera SALSA. In Polarization: Measurement, Analysis, and Remote Sensing, 7th ed.; International Society for Optics and Photonics: Baltimore, MD, USA, 2016. [Google Scholar]
- Jiroušek, R.; Shenoy, P.P. A new definition of entropy of belief functions in the Dempster–Shafer theory. Int. J. Approx. Reason. 2018, 92, 49–65. [Google Scholar] [CrossRef] [Green Version]
- Zhang, C.; Su, B.; Tang, J.; Yang, H.; Su, Q.; Zhou, Z. Color Image Enhancement Algorithm Based on Edge Extraction; SPIE: Beijing, China, 2020; Volume 11438. [Google Scholar]
- Vijayalakshmi, D.; Nath, M.K.; Acharya, O.P. A Comprehensive Survey on Image Contrast Enhancement Techniques in Spatial Domain. Sens. Imaging 2020, 21, 40. [Google Scholar] [CrossRef]
- Luo, L.; Lan, J.; Wang, Y.; Li, H.; Wu, Z.; McBridge, C.; Zhou, H.; Liu, F.; Zhang, R.; Gong, F.; et al. A Novel Early Warning System (EWS) for Water Quality, Integrating a High-Frequency Monitoring Database with Efficient Data Quality Control Technology at a Large and Deep Lake (Lake Qiandao), China. Water 2022, 14, 602. [Google Scholar] [CrossRef]
- Li, T.; Zhu, B.; Cao, F.; Sun, H.; He, X.; Liu, M.; Gong, F.; Bai, Y. Monitoring Changes in the Transparency of the Largest Reservoir in Eastern China in the Past Decade, 2013–2020. Remote Sens. 2021, 13, 2570. [Google Scholar] [CrossRef]
- Chami, M.; Lafrance, B.; Fougnie, B.; Chowdhary, J.; Harmel, T.; Waquet, F. OSOAA: A vector radiative transfer model of coupled atmosphere-ocean system for a rough sea surface application to the estimates of the directional variations of the water leaving reflectance to better process multi-angular satellite sensors data over the ocean. Opt. Express 2015, 23, 27829–27852. [Google Scholar] [CrossRef] [PubMed] [Green Version]
- Shettle, E.P.; Fenn, R.W. Models for the Aerosols of the Lower Atmosphere and the Effects of Humidity Variations on Their Optical Properties; Air Force Geophysics Laboratory: Madison, MA, USA, 1979. [Google Scholar]
- Bickel, W.S.; Bailey, W.M. Stokes vectors, Mueller matrices, and polarized scattered light. Am. J. Phys. 1985, 53, 468–478. [Google Scholar] [CrossRef]
- Xiang, K.; Yang, K.; Wang, K. Polarization-driven semantic segmentation via efficient attention-bridged fusion. Opt. Express 2021, 29, 4802–4820. [Google Scholar] [CrossRef] [PubMed]


| Parameter | Value |
|---|---|
| Camera size (mm × mm × mm) | 80 × 80 × 100 |
| Resolution (pixel × pixel) | 782 × 582 to 1040 × 1040 |
| Frame rate (frame∙s−1) | 12 (12 bits); 20 (8 bits) |
| Bit number for each pixel | 8 or 12 |
| Access port | USB |
| Central wavelength for each band (nm) | 410, 443, 490, 520, 550, 620, 660, 685 |
| Lens focal length (mm) | 77 |
| Software | SALSA version 2.3.6 |
| Target Depth (m) | UPIS Depth (m) |
|---|---|
| +0.5 | −0.5 |
| 0.0 | −1.0 |
| −0.5 | −1.5 |
| −2.0 | −3.0 |
| −4.0 | −5.0 |
Publisher’s Note: MDPI stays neutral with regard to jurisdictional claims in published maps and institutional affiliations. |
© 2022 by the authors. Licensee MDPI, Basel, Switzerland. This article is an open access article distributed under the terms and conditions of the Creative Commons Attribution (CC BY) license (https://creativecommons.org/licenses/by/4.0/).
Share and Cite
Pan, T.; He, X.; Zhang, X.; Liu, J.; Bai, Y.; Gong, F.; Li, T. Experimental Study on Bottom-Up Detection of Underwater Targets Based on Polarization Imaging. Sensors 2022, 22, 2827. https://doi.org/10.3390/s22082827
Pan T, He X, Zhang X, Liu J, Bai Y, Gong F, Li T. Experimental Study on Bottom-Up Detection of Underwater Targets Based on Polarization Imaging. Sensors. 2022; 22(8):2827. https://doi.org/10.3390/s22082827
Chicago/Turabian StylePan, Tianfeng, Xianqiang He, Xuan Zhang, Jia Liu, Yan Bai, Fang Gong, and Teng Li. 2022. "Experimental Study on Bottom-Up Detection of Underwater Targets Based on Polarization Imaging" Sensors 22, no. 8: 2827. https://doi.org/10.3390/s22082827