
Deep Feature Fusion and Optimization-Based Approach for Stomach Disease Classification


Abstract
:1. Introduction
- Fine-tuning of pre-trained deep-learning models was performed with parameter modification for the derivation of high-level features by implementing the activation function at the average pooling layer.
- Deep features were concatenated using the parallel maximum covariance (PMC) method, and the resultant feature map was optimized using the nature-inspired modified binary dragonfly algorithm to reduce feature redundancy.
2. Related Work
3. Materials and Methods
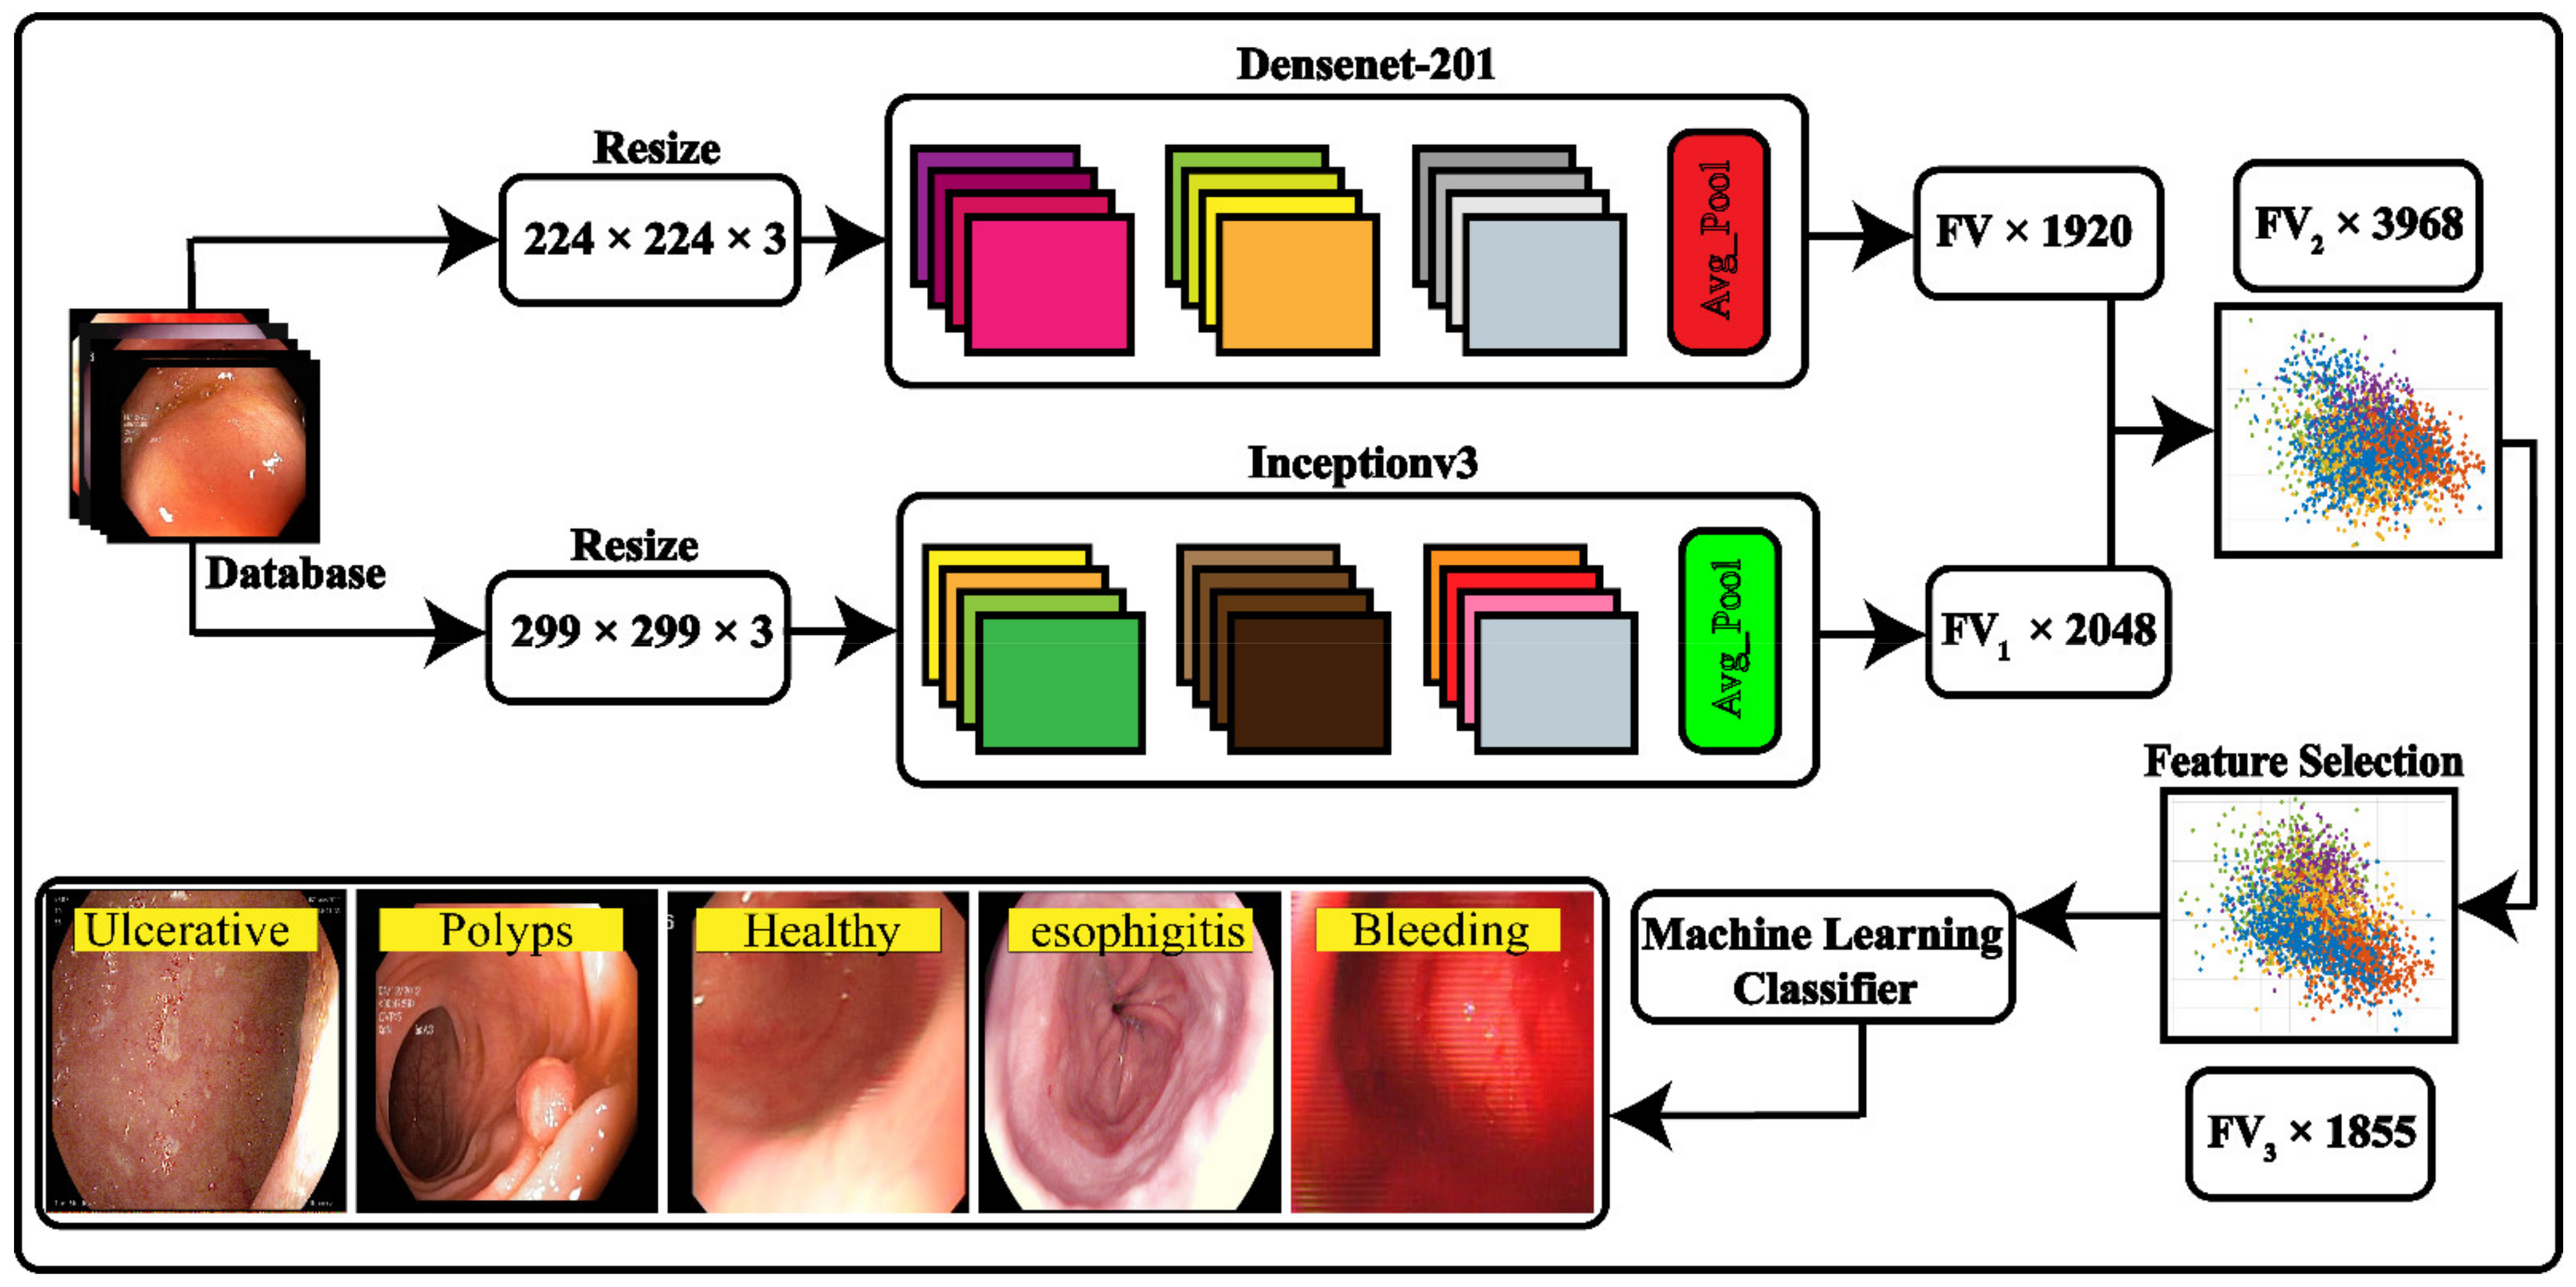
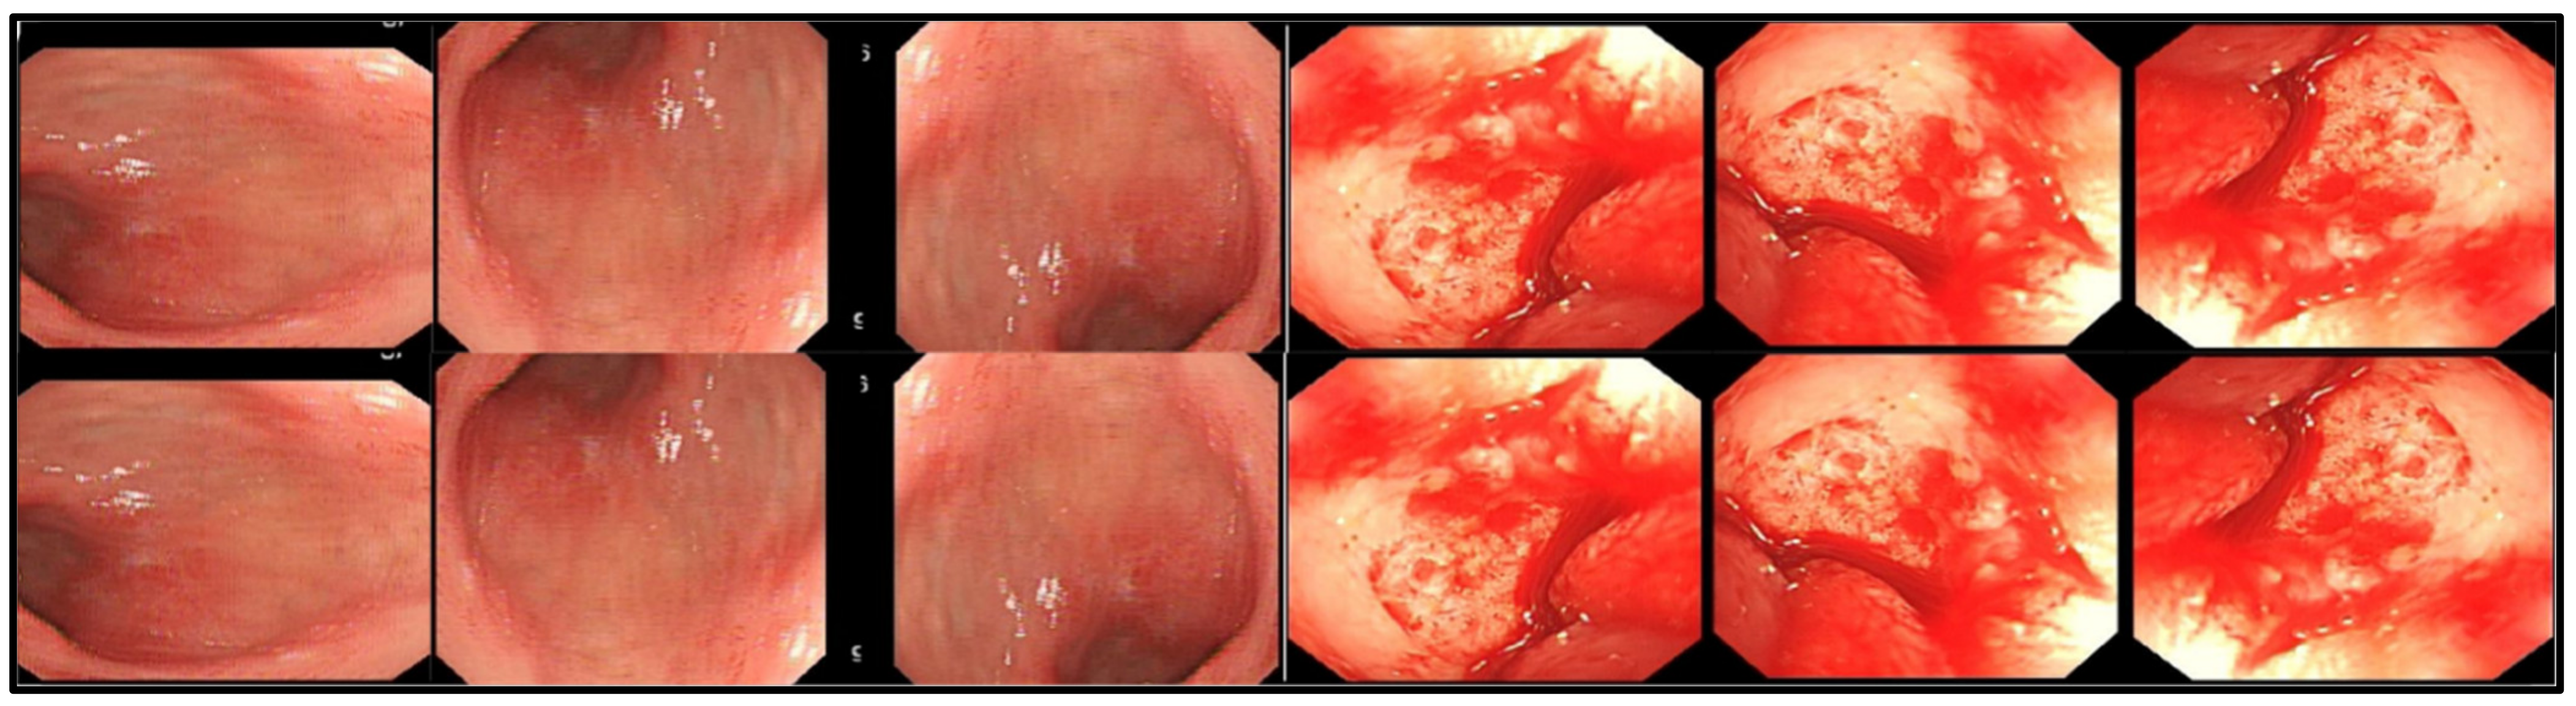
3.1. Data Acquisition and Preparation
3.2. Deep Feature Extraction
3.2.1. Inception v3
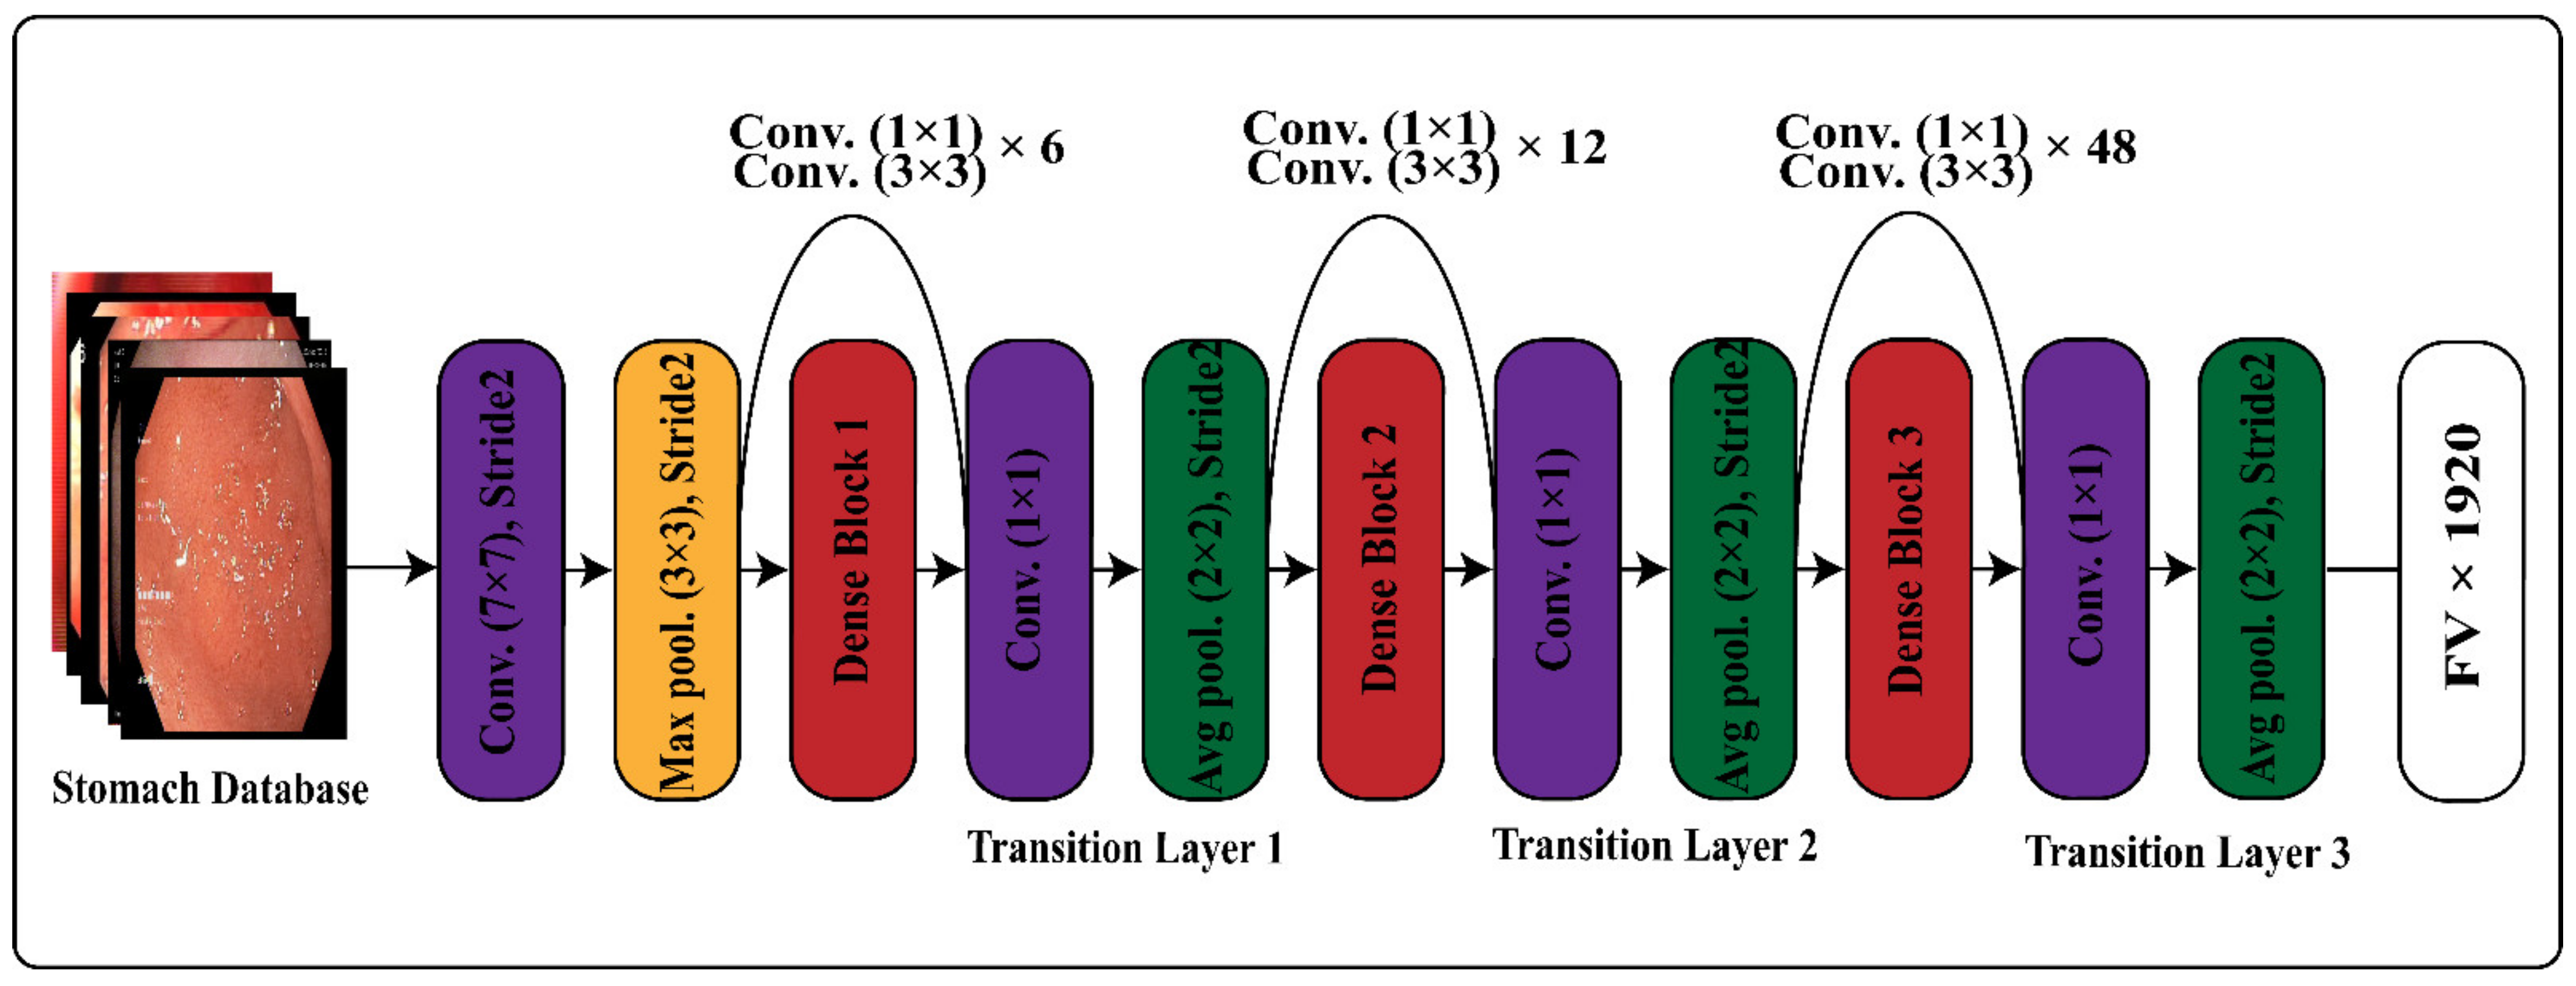
3.2.2. DenseNet-201
3.2.3. Feature Extraction Using Transfer Learning
3.3. Features Fusion
3.4. Features Optimization
| Algorithm 1: Pseudocode of the Dragonfly Algorithm (DA) |
|
Input: Feature Vector (
) Output: Selected Feature vector ( ) Maximum Iteration = 100 Step 1: Initializing the population Step 2: Initialize Step 3: while ( ) do
|
4. Results
4.1. Deep Feature Fusion Results
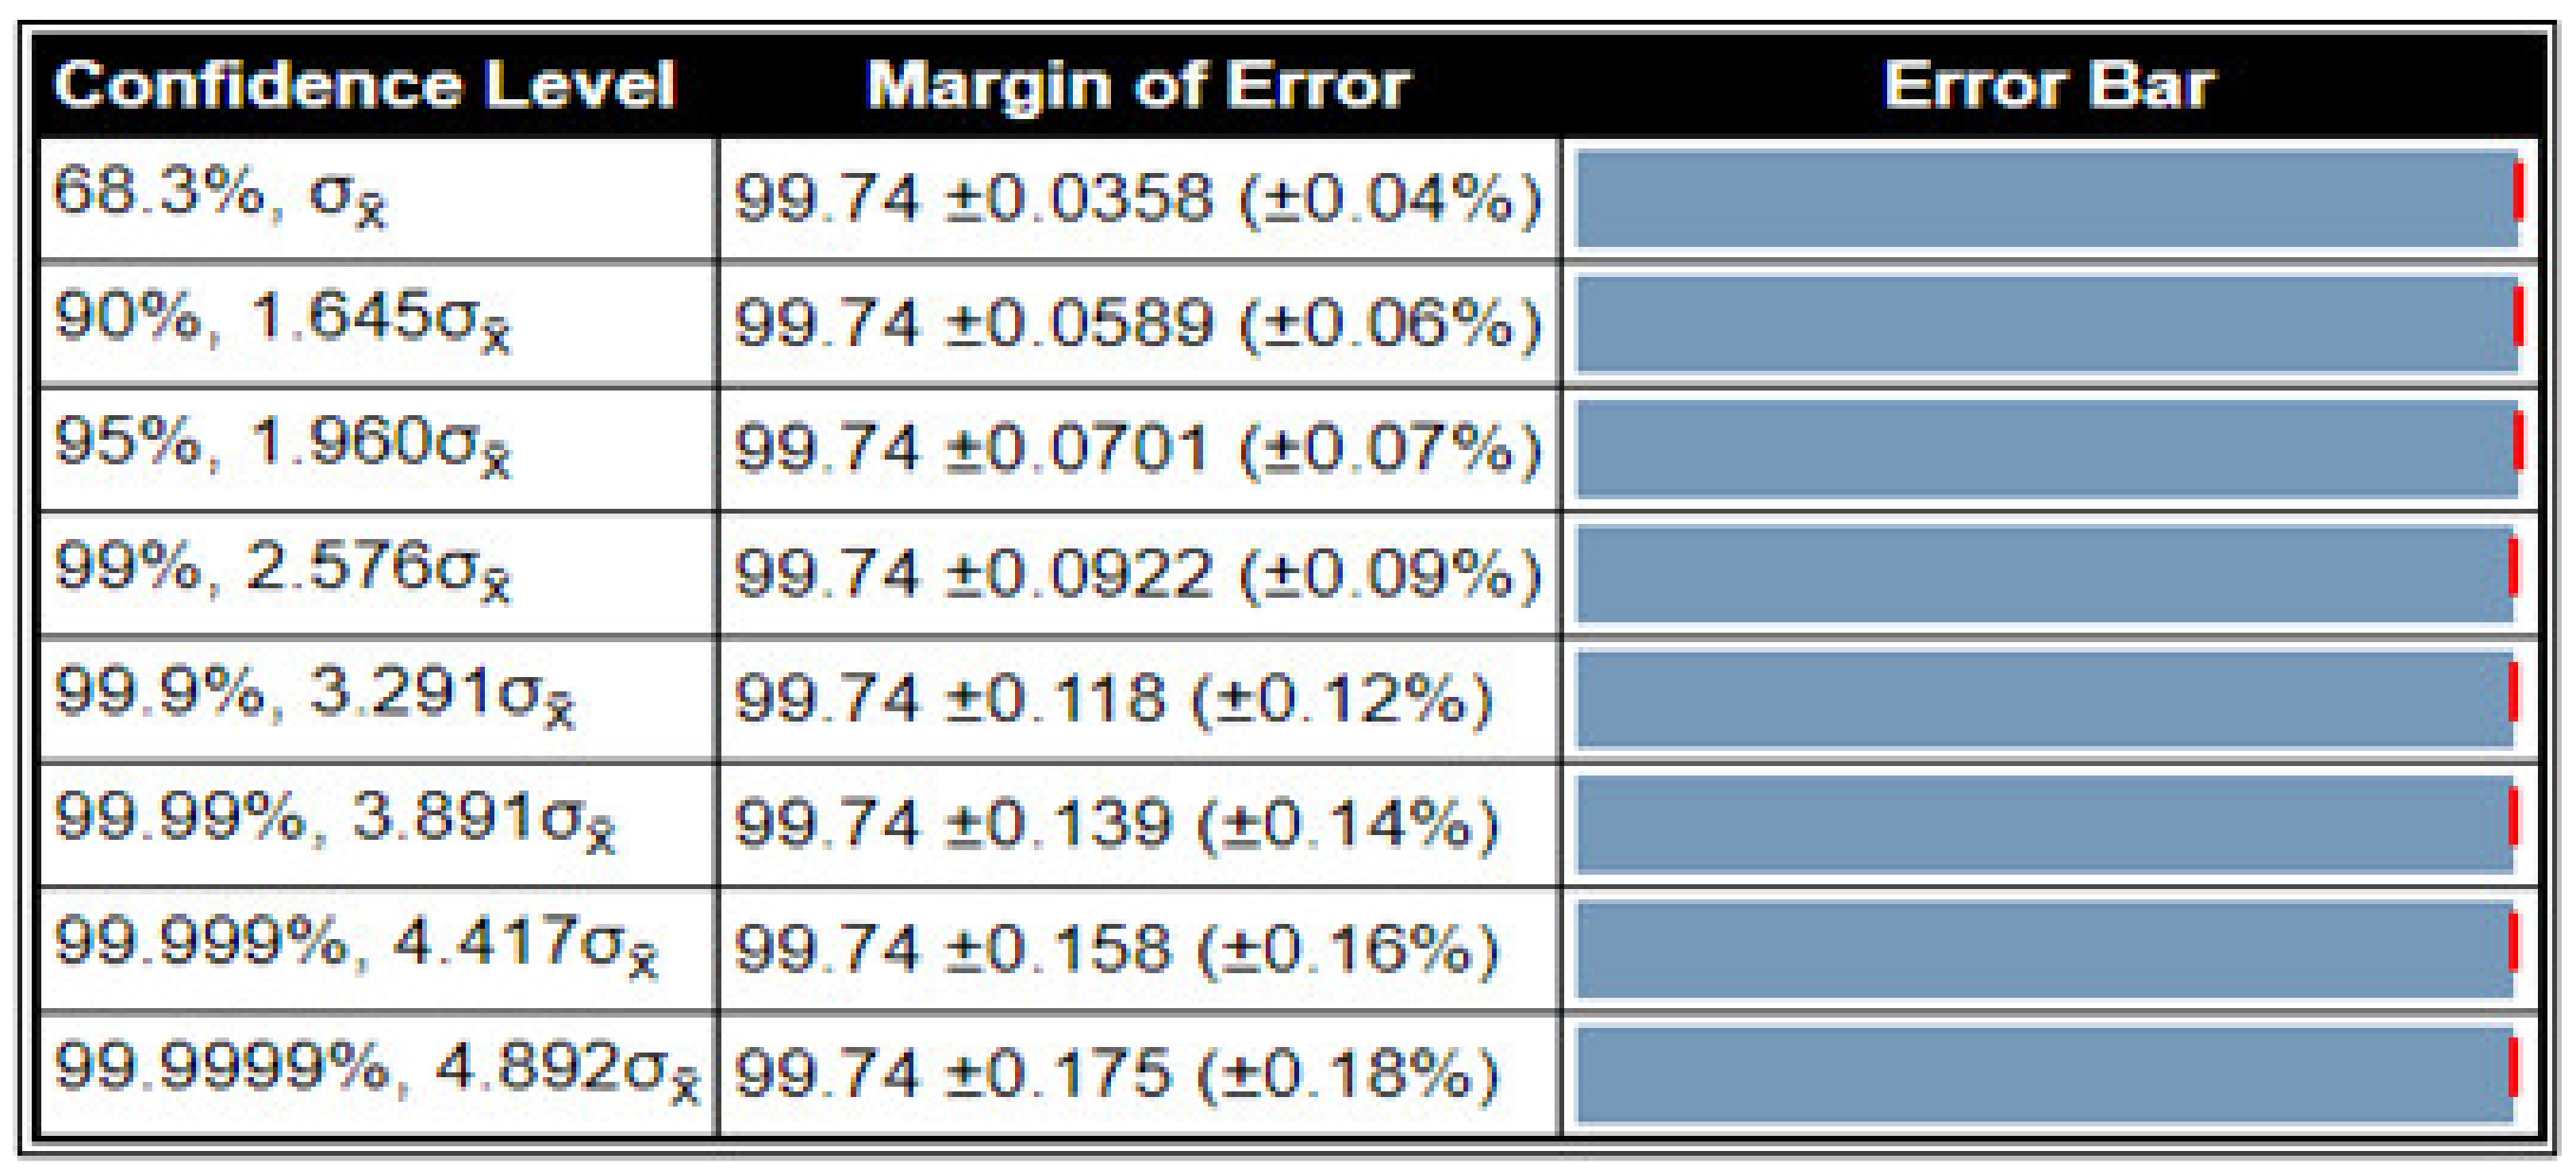
4.2. Deep Feature Optimization Results on (CV = 10)
4.3. Deep Feature Optimization Results on (CV = 15)
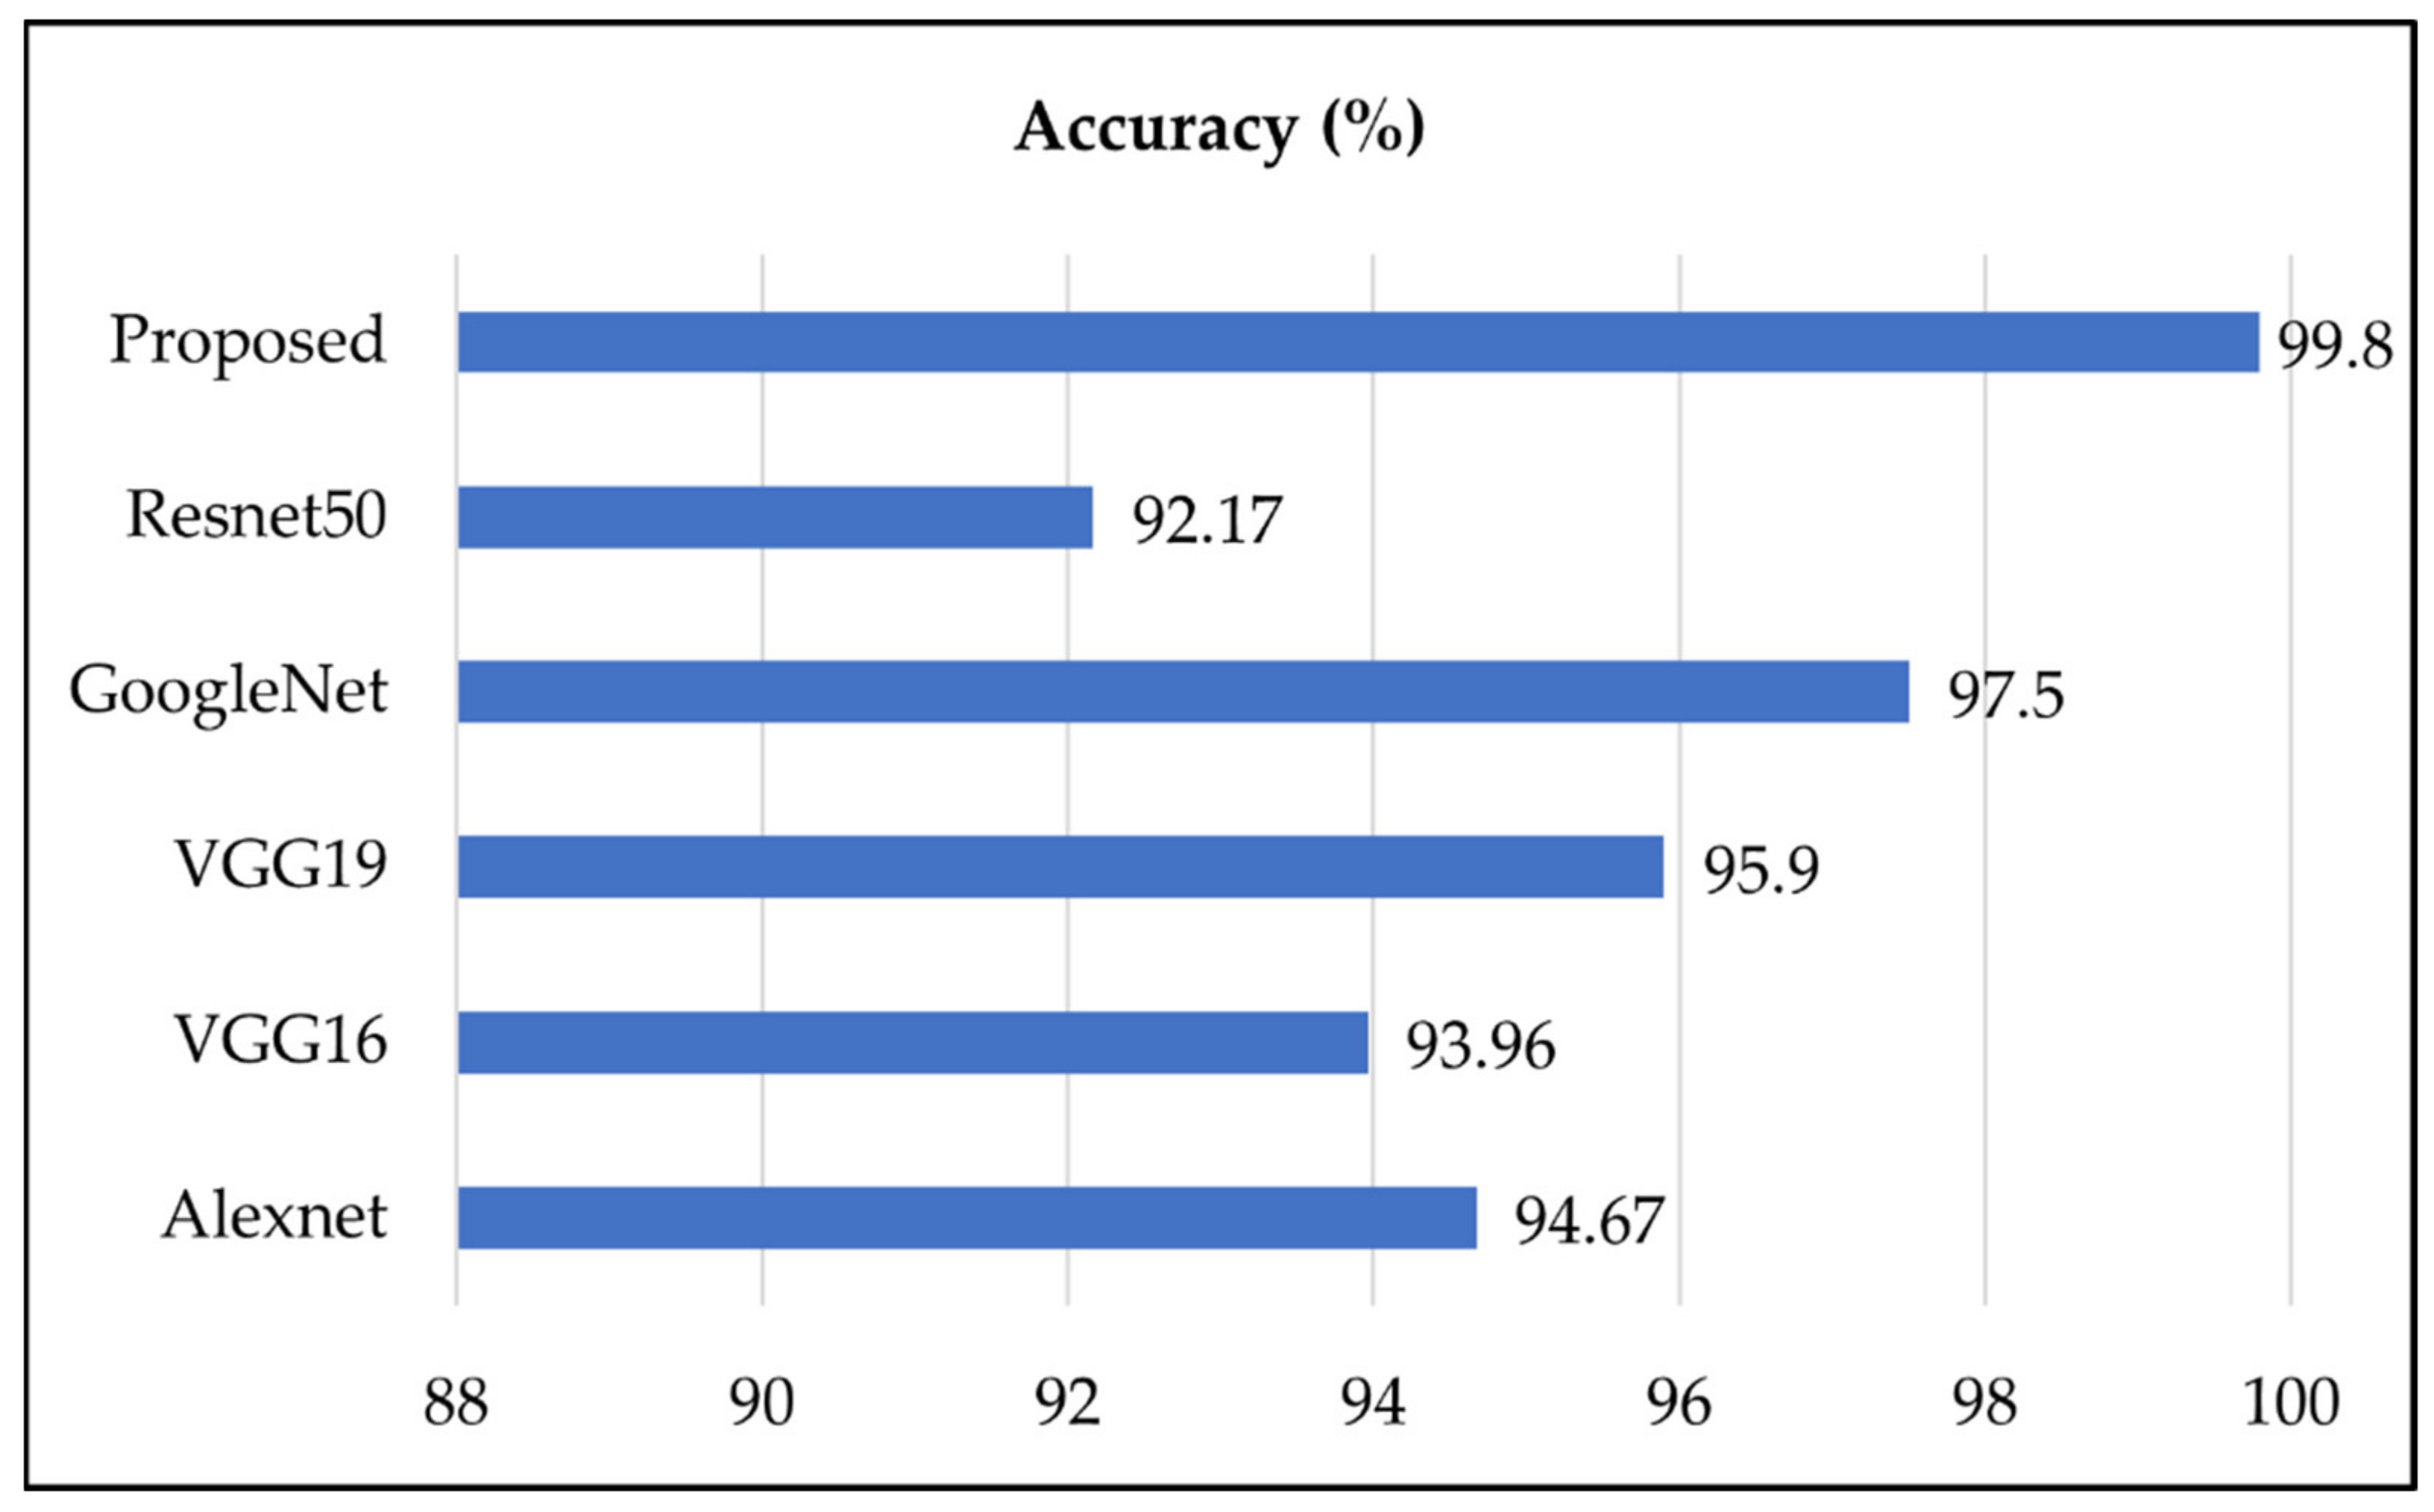
5. Discussion
6. Conclusions
Author Contributions
Funding
Institutional Review Board Statement
Informed Consent Statement
Data Availability Statement
Conflicts of Interest
References
- Sharif, M.; Attique Khan, M.; Rashid, M.; Yasmin, M.; Afza, F.; Tanik, U.J. Deep CNN and geometric features-based gastrointestinal tract diseases detection and classification from wireless capsule endoscopy images. J. Exp. Theor. Artif. Intell. 2021, 33, 577–599. [Google Scholar] [CrossRef]
- Khan, M.A.; Kadry, S.; Alhaisoni, M.; Nam, Y.; Zhang, Y.; Rajinikanth, V.; Sarfraz, M.S. Computer-aided gastrointestinal diseases analysis from wireless capsule endoscopy: A framework of best features selection. IEEE Access 2020, 8, 132850–132859. [Google Scholar] [CrossRef]
- Lee, J.H.; Kim, Y.J.; Kim, Y.W.; Park, S.; Choi, Y.I.; Kim, Y.J.; Park, D.K.; Kim, K.G.; Chung, J.W. Spotting malignancies from gastric endoscopic images using deep learning. Surg. Endosc. 2019, 33, 3790–3797. [Google Scholar] [CrossRef]
- Ghatwary, N.; Ye, X.; Zolgharni, M.J. Esophageal abnormality detection using densenet based faster r-cnn with gabor features. IEEE Access 2019, 7, 84374–84385. [Google Scholar] [CrossRef]
- Siegel, R.L.; Miller, K.D.; Fuchs, H.E.; Jemal, A.J. Cancer statistics, 2021. CA Cancer J. Clin. 2021, 71, 7–33. [Google Scholar] [CrossRef]
- Yabroff, K.R.; Wu, X.-C.; Negoita, S.; Stevens, J.; Coyle, L.; Zhao, J.; Mumphrey, B.J.; Jemal, A.; Ward, K.C. Association of the COVID-19 Pandemic with Patterns of Statewide Cancer Services. NCI J. Natl. Cancer Inst. 2021, djab122. [Google Scholar] [CrossRef] [PubMed]
- Masmoudi, Y.; Ramzan, M.; Khan, S.A.; Habib, M. Optimal feature extraction and ulcer classification from WCE image data using deep learning. Soft Comput. 2022, 1–14. [Google Scholar] [CrossRef]
- Fan, S.; Xu, L.; Fan, Y.; Wei, K.; Li, L. Computer-aided detection of small intestinal ulcer and erosion in wireless capsule endoscopy images. Phys. Med. Biol. 2018, 63, 165001. [Google Scholar] [CrossRef] [PubMed]
- Khan, M.A.; Rashid, M.; Sharif, M.; Javed, K.; Akram, T.J. Classification of gastrointestinal diseases of stomach from WCE using improved saliency-based method and discriminant features selection. Multimed. Tools Appl. 2019, 78, 27743–27770. [Google Scholar] [CrossRef]
- Charfi, S.; El Ansari, M.J. Computer-aided diagnosis system for colon abnormalities detection in wireless capsule endoscopy images. Multimed. Tools Appl. 2018, 77, 4047–4064. [Google Scholar] [CrossRef]
- Saito, H.; Aoki, T.; Aoyama, K.; Kato, Y.; Tsuboi, A.; Yamada, A.; Fujishiro, M.; Oka, S.; Ishihara, S.; Matsuda, T.J. Automatic detection and classification of protruding lesions in wireless capsule endoscopy images based on a deep convolutional neural network. Gastrointest. Endosc. 2020, 92, 144–151.e1. [Google Scholar] [CrossRef] [PubMed]
- Naz, J.; Sharif, M.; Yasmin, M.; Raza, M.; Khan, M.A.J. Detection and Classification of Gastrointestinal Diseases using Machine Learning. Curr. Med. Imaging 2021, 17, 479–490. [Google Scholar] [CrossRef] [PubMed]
- Suman, S.; Hussin, F.A.B.; Malik, A.S.; Pogorelov, K.; Riegler, M.; Ho, S.H.; Hilmi, I.; Goh, K.L. Detection and classification of bleeding region in WCE images using color feature. In Proceedings of the 15th International Workshop on Content-Based Multimedia Indexing, Firenze, Italy, 19–21 June 2017; pp. 1–6. [Google Scholar]
- Suman, S.; Hussin, F.A.; Malik, A.S.; Ho, S.H.; Hilmi, I.; Leow, A.H.-R.; Goh, K.-L.J. Feature selection and classification of ulcerated lesions using statistical analysis for WCE images. Appl. Sci. 2017, 7, 1097. [Google Scholar] [CrossRef] [Green Version]
- Li, B.; Meng, M.Q.-H.J. Tumor recognition in wireless capsule endoscopy images using textural features and SVM-based feature selection. IEEE Trans. 2012, 16, 323–329. [Google Scholar]
- Tuba, E.; Tuba, M.; Jovanovic, R. An algorithm for automated segmentation for bleeding detection in endoscopic images. In Proceedings of the 2017 International Joint Conference on Neural Networks (IJCNN), Anchorage, AK, USA, 14–19 May 2017; pp. 4579–4586. [Google Scholar]
- Charfi, S.; El Ansari, M. Computer-aided diagnosis system for ulcer detection in wireless capsule endoscopy videos. In Proceedings of the 2017 International Conference on Advanced Technologies for Signal and Image Processing (ATSIP), Fez, Morocco, 22–24 May 2017; pp. 1–5. [Google Scholar]
- Jamil, D. Diagnosis of Gastric Cancer Using Machine Learning Techniques in Healthcare Sector: A Survey. Informatica 2022, 45, 147–166. [Google Scholar] [CrossRef]
- Khan, M.A.; Sarfraz, M.S.; Alhaisoni, M.; Albesher, A.A.; Wang, S.; Ashraf, I.J. StomachNet: Optimal deep learning features fusion for stomach abnormalities classification. IEEE Access 2020, 8, 197969–197981. [Google Scholar] [CrossRef]
- Liaqat, A.; Khan, M.A.; Shah, J.H.; Sharif, M.; Yasmin, M.; Fernandes, S.L. Automated ulcer and bleeding classification from WCE images using multiple features fusion and selection. J. Mech. Med. Biol. 2018, 18, 1850038. [Google Scholar] [CrossRef]
- Zhao, R.; Zhang, R.; Tang, T.; Feng, X.; Li, J.; Liu, Y.; Zhu, R.; Wang, G.; Li, K.; Zhou, W.; et al. TriZ-a rotation-tolerant image feature and its application in endoscope-based disease diagnosis. Comput. Biol. Med. 2018, 99, 182–190. [Google Scholar] [CrossRef]
- Majid, A.; Khan, M.A.; Yasmin, M.; Rehman, A.; Yousafzai, A.; Tariq, U. Classification of stomach infections: A paradigm of convolutional neural network along with classical features fusion and selection. Microsc. Res. Tech. 2020, 83, 562–576. [Google Scholar] [CrossRef]
- Khan, M.A.; Majid, A.; Hussain, N.; Alhaisoni, M.; Zhang, Y.-D.; Kadry, S.; Nam, Y. Multiclass Stomach Diseases Classification Using Deep Learning Features Optimization. Comput. Mater. Contin. 2021, 67, 3381–3399. [Google Scholar] [CrossRef]
- Bora, K.; Bhuyan, M.; Kasugai, K.; Mallik, S.; Zhao, Z. Computational learning of features for automated colonic polyp classification. Sci. Rep. 2021, 11, 4347. [Google Scholar] [CrossRef] [PubMed]
- Ayyaz, M.S.; Lali, M.I.U.; Hussain, M.; Rauf, H.T.; Alouffi, B.; Alyami, H.; Wasti, S. Hybrid Deep Learning Model for Endoscopic Lesion Detection and Classification Using Endoscopy Videos. Diagnostics 2022, 12, 43. [Google Scholar] [CrossRef] [PubMed]
- He, K.; Zhang, X.; Ren, S.; Sun, J. Deep residual learning for image recognition. In Proceedings of the IEEE Conference on Computer Vision and Pattern Recognition, Las Vegas, NV, USA, 27–30 June 2016; pp. 770–778. [Google Scholar]
- Urban, G.; Tripathi, P.; Alkayali, T.; Mittal, M.; Jalali, F.; Karnes, W.; Baldi, P. Deep learning localizes and identifies polyps in real time with 96% accuracy in screening colonoscopy. Gastroenterology 2018, 155, 1069–1078.e8. [Google Scholar] [CrossRef] [PubMed]
- Simonyan, K.; Zisserman, A. Very deep convolutional networks for large-scale image recognition. arXiv 2014, arXiv:1409.1556. [Google Scholar]
- Russakovsky, O.; Deng, J.; Su, H.; Krause, J.; Satheesh, S.; Ma, S.; Huang, Z.; Karpathy, A.; Khosla, A.; Bernstein, M. Imagenet large scale visual recognition challenge. Int. J. Comput. Vis. 2015, 115, 211–252. [Google Scholar] [CrossRef] [Green Version]
- Khan, M.A.; Sharif, M.; Akram, T.; Yasmin, M.; Nayak, R.S. Stomach deformities recognition using rank-based deep features selection. J. Med. Syst. 2019, 43, 329. [Google Scholar] [CrossRef]
- Billah, M.; Waheed, S.; Rahman, M.M. An automatic gastrointestinal polyp detection system in video endoscopy using fusion of color wavelet and convolutional neural network features. Int. J. Biomed. Imaging 2017, 2017, 9545920. [Google Scholar] [CrossRef]
- Pogorelov, K.; Randel, K.R.; Griwodz, C.; Eskeland, S.L.; de Lange, T.; Johansen, D.; Spampinato, C.; Dang-Nguyen, D.-T.; Lux, M.; Schmidt, P.T. Kvasir: A multi-class image dataset for computer aided gastrointestinal disease detection. In Proceedings of the 8th ACM on Multimedia Systems Conference, Taipei Taiwan, 20–23 June 2017; pp. 164–169. [Google Scholar]
- Aisu, N.; Miyake, M.; Takeshita, K.; Akiyama, M.; Kawasaki, R.; Kashiwagi, K.; Sakamoto, T.; Oshika, T.; Tsujikawa, A. Regulatory-approved deep learning/machine learning-based medical devices in Japan as of 2020: A systematic review. PLOS Digit. Health 2022, 1, e0000001. [Google Scholar] [CrossRef]
- Szegedy, C.; Vanhoucke, V.; Ioffe, S.; Shlens, J.; Wojna, Z. Rethinking the inception architecture for computer vision. In Proceedings of the IEEE conference on computer vision and pattern recognition, Las Vegas, NV, USA, 27–30 June 2016; pp. 2818–2826. [Google Scholar]
- Deng, J.; Dong, W.; Socher, R.; Li, L.-J.; Li, K.; Fei-Fei, L. Imagenet: A large-scale hierarchical image database. In Proceedings of the 2009 IEEE Conference on Computer Vision and Pattern Recognition, Miami, FL, USA, 20–25 June 2009; pp. 248–255. [Google Scholar]
- Huang, G.; Liu, Z.; Van Der Maaten, L.; Weinberger, K.Q. Densely connected convolutional networks. In Proceedings of the 2017 IEEE Conference on Computer Vision and Pattern Recognition (CVPR), Honolulu, HI, USA, 21–26 July 2017; pp. 2261–2269. [Google Scholar]
- Khan, M.A.; Alhaisoni, M.; Tariq, U.; Hussain, N.; Majid, A.; Damaševičius, R.; Maskeliūnas, R. COVID-19 case recognition from chest CT images by deep learning, entropy-controlled firefly optimization, and parallel feature fusion. Sensors 2021, 21, 7286. [Google Scholar] [CrossRef]
- Mirjalili, S. Dragonfly algorithm: A new meta-heuristic optimization technique for solving single-objective, discrete, and multi-objective problems. Neural Comput. Appl. 2016, 27, 1053–1073. [Google Scholar] [CrossRef]
- Lonseko, Z.M.; Adjei, P.E.; Du, W.; Luo, C.; Hu, D.; Zhu, L.; Gan, T.; Rao, N. Gastrointestinal Disease Classification in Endoscopic Images Using Attention-Guided Convolutional Neural Networks. Appl. Sci. 2021, 11, 11136. [Google Scholar] [CrossRef]
- Ali, S.; Zhou, F.; Daul, C.; Braden, B.; Bailey, A.; Realdon, S.; East, J.; Wagnieres, G.; Loschenov, V.; Grisan, E. Endoscopy artifact detection (EAD 2019) challenge dataset. arXiv 2019, arXiv:1905.03209. [Google Scholar]
- Yogapriya, J.; Chandran, V.; Sumithra, M.; Anitha, P.; Jenopaul, P.; Suresh Gnana Dhas, C. Gastrointestinal tract disease classification from wireless endoscopy images using pretrained deep learning model. Comput. Math. Methods Med. 2021, 2021, 5940433. [Google Scholar] [CrossRef] [PubMed]
- Yu, X.; Tang, S.; Cheang, C.F.; Yu, H.H.; Choi, I.C. Multi-Task Model for Esophageal Lesion Analysis Using Endoscopic Images: Classification with Image Retrieval and Segmentation with Attention. Sensors 2022, 22, 283. [Google Scholar] [CrossRef] [PubMed]
- Wang, W.; Yang, X.; Li, X.; Tang, J. Convolutional-capsule network for gastrointestinal endoscopy image classification. Int. J. Intell. Syst. 2022. [Google Scholar] [CrossRef]
- Sutton, R.T.; Zaïane, O.R.; Goebel, R.; Baumgart, D.C. Artificial intelligence enabled automated diagnosis and grading of ulcerative colitis endoscopy images. Sci. Rep. 2022, 12, 2748. [Google Scholar] [CrossRef]


| Classifier | Evaluation Measures | ||
|---|---|---|---|
| Accuracy (%) | FNR (%) | Time (s) | |
| L-SVM | 96 | 4 | 514 |
| Q-SVM | 96.1 | 3.9 | 730 |
| C-SVM | 96.2 | 3.8 | 611 |
| MG-SVM | 95.6 | 4.4 | 1310 |
| CG-SVM | 95.2 | 4.8 | 1214 |
| GN-Bayes | 93.7 | 6.3 | 354 |
| ESD | 90.7 | 9.3 | 125 |
| C-KNN | 93.6 | 6.4 | 153 |
| LD | 91.5 | 8.5 | 272 |
| Classifier | Evaluation Measures | |||||
|---|---|---|---|---|---|---|
| Accuracy (%) | Precision (%) | FNR (%) | Recall (%) | F1_Score (%) | Time(s) | |
| L-SVM | 98.6 | 98.8 | 1.4 | 99.1 | 98.9 | 65.271 |
| Q-SVM | 99.1 | 99.2 | 0.8 | 98.3 | 98.7 | 69.563 |
| C-SVM | 99.8 | 99.8 | 0.2 | 99.4 | 99.6 | 33.18 |
| MG-SVM | 96.5 | 97 | 3.5 | 97.5 | 97.2 | 252.343 |
| CG-SVM | 95.6 | 95.6 | 4.4 | 96.6 | 96.1 | 102.235 |
| GN-Bayes | 92.6 | 92.7 | 7.3 | 93.7 | 93.2 | 89.102 |
| ESD | 94.2 | 94.3 | 5.8 | 95.2 | 94.7 | 125.36 |
| C-KNN | 97.4 | 98.4 | 2.6 | 98.4 | 98.4 | 27.151 |
| LD | 98.3 | 98.7 | 1.7 | 99.3 | 99 | 32.14 |
| Classifier | Evaluation Measures | |||||
|---|---|---|---|---|---|---|
| Accuracy (%) | Precision (%) | FNR (%) | Recall (%) | F1_Score (%) | Time(s) | |
| L-SVM | 99.5 | 98.4 | 0.5 | 99.1 | 98.7 | 67.271 |
| Q-SVM | 99.5 | 99.1 | 0.5 | 98.3 | 98.7 | 73.561 |
| C-SVM | 99.6 | 99.2 | 0.4 | 99.4 | 99.3 | 39.18 |
| MG-SVM | 99.4 | 99.3 | 0.6 | 99.5 | 99.4 | 286.393 |
| CG-SVM | 99.2 | 99 | 0.8 | 99.4 | 99.2 | 152.135 |
| GN-Bayes | 98.3 | 98.1 | 1.7 | 99.3 | 98.7 | 92.112 |
| ESD | 99.2 | 99.1 | 0.8 | 99.4 | 99.2 | 139.36 |
| C-KNN | 99.4 | 98.6 | 0.6 | 99.6 | 99.1 | 29.121 |
| LD | 98.9 | 98.4 | 1.1 | 99.3 | 98.8 | 35.11 |
| Stomach Disease | Stomach Diseases | ||||
|---|---|---|---|---|---|
| Healthy | Bleeding | Esophagitis | Polyps | Ulcerative-Colitis | |
| Healthy | 100% | ||||
| Bleeding | 100% | ||||
| Esophagitis | 100% | ||||
| Polyps | <1% | 99% | <1% | ||
| Ulcerative-Colitis | <1% | 99% | |||
| Ref. | Year | Dataset | No. of Images | Accuracy |
|---|---|---|---|---|
| [39] | 2021 | Kvasir V2 + EAD2019 | 12,147 | 93.19% |
| [41] | 2021 | Kvasir V2 | 6702 | 96.33% |
| [42] | 2022 | Kiang Wu Hospital dataset | 2006 | 96.76% |
| [43] | 2022 | Kvasir V2 | 8000 | 94.83% |
| [44] | 2022 | Kvasir + Kvasir V2 | 3482 | 87.50% |
| Proposed | 2022 | Kvasir + Kvasir V2 + Healthy + Bleeding | 17,500 | 99.8% |
Publisher’s Note: MDPI stays neutral with regard to jurisdictional claims in published maps and institutional affiliations. |
© 2022 by the authors. Licensee MDPI, Basel, Switzerland. This article is an open access article distributed under the terms and conditions of the Creative Commons Attribution (CC BY) license (https://creativecommons.org/licenses/by/4.0/).
Share and Cite
Mohammad, F.; Al-Razgan, M. Deep Feature Fusion and Optimization-Based Approach for Stomach Disease Classification. Sensors 2022, 22, 2801. https://doi.org/10.3390/s22072801
Mohammad F, Al-Razgan M. Deep Feature Fusion and Optimization-Based Approach for Stomach Disease Classification. Sensors. 2022; 22(7):2801. https://doi.org/10.3390/s22072801
Chicago/Turabian StyleMohammad, Farah, and Muna Al-Razgan. 2022. "Deep Feature Fusion and Optimization-Based Approach for Stomach Disease Classification" Sensors 22, no. 7: 2801. https://doi.org/10.3390/s22072801