
MFDroid: A Stacking Ensemble Learning Framework for Android Malware Detection


Abstract
:1. Introduction
- We constructed a real-world Android malware dataset and conducted a comprehensive analysis for the dataset, showing the differences between malicious and benign applications.
- We combined the results of seven feature selection algorithms and fed them into the model for training. The results show that the F1-score of our method is significantly higher than other feature selection algorithms.
- We propose an Android malware detection framework based on stacking ensemble learning—MFDroid.
2. Related Work
2.1. Construction of Dataset
2.2. Static Analysis
2.3. Machine Learning
2.4. Ensemble Learning
3. Dataset
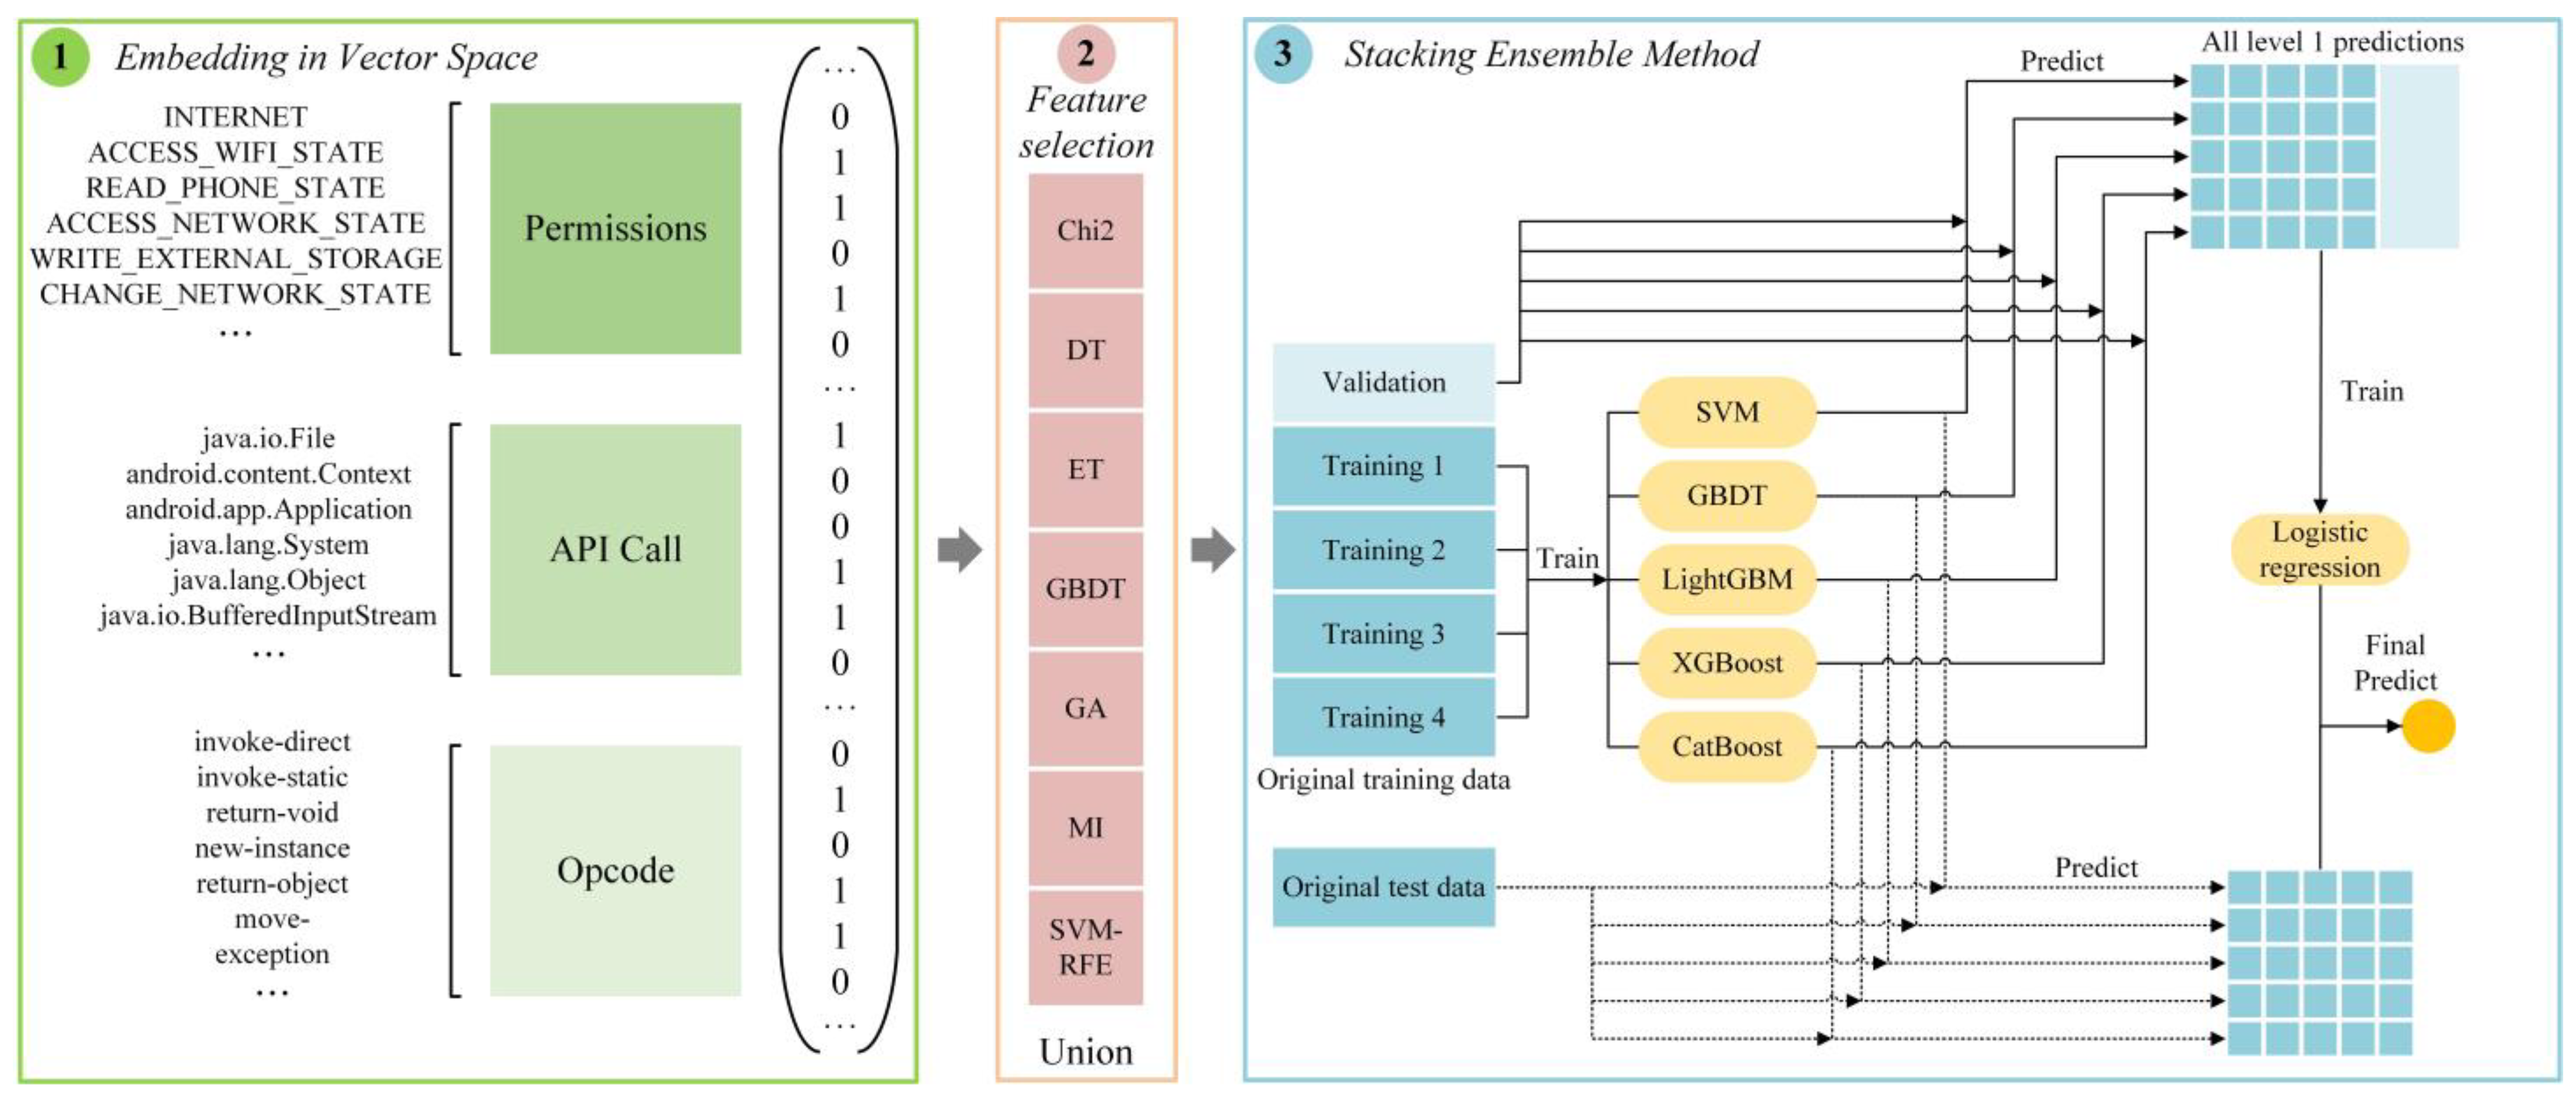
4. MFDroid
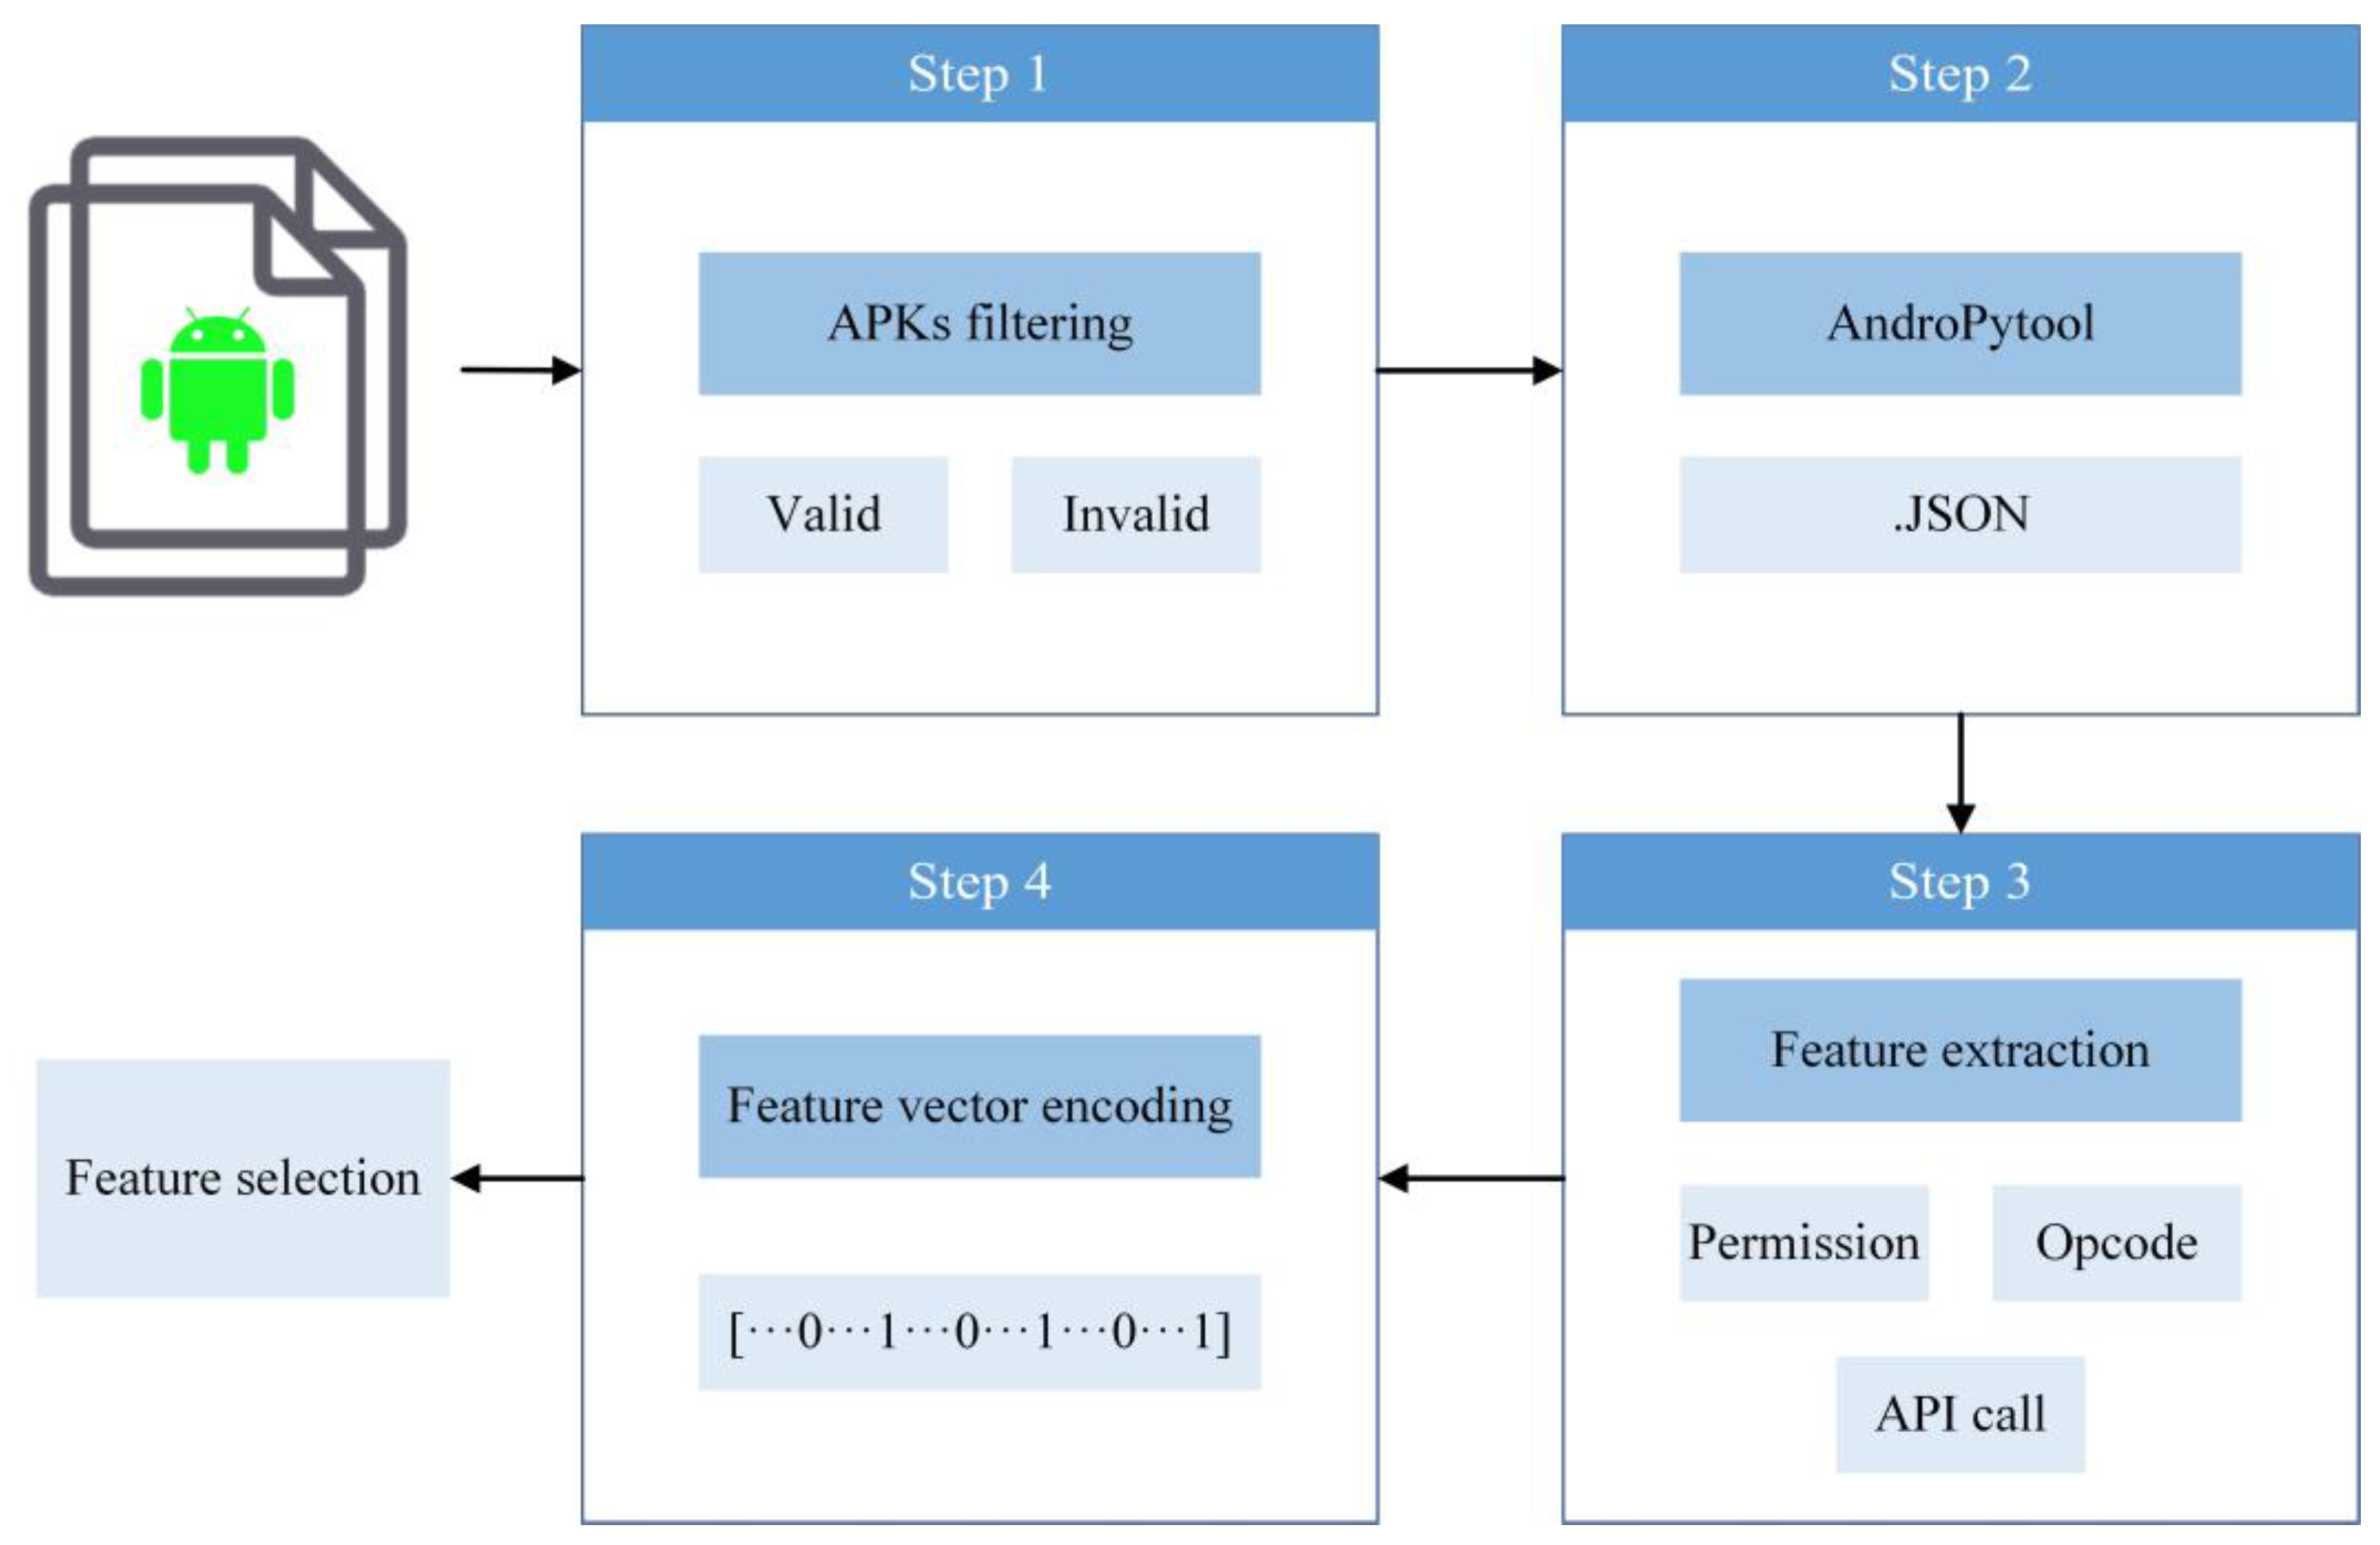
4.1. Data Preprocessing
4.2. Feature Selection Methods
4.2.1. Feature Selection Algorithms
4.2.2. Union of Feature Selection Results
4.3. Stacking Ensemble Method
4.3.1. Base Learners
4.3.2. Meta-Classifier
4.3.3. Ensemble of Classifiers
- Divide the original dataset into two parts: the original training set D and the original testing set T.
- Perform K-fold cross-validation on the base learner: randomly divide the original training set D into K equivalents , and each base learner uses one of them as the K-fold test set, and the rest the K-1 copies are used as the K-fold training set. Each base learner is trained using the K-fold training set, and predictions are made on the K-fold test set, and the prediction results of each base learner are combined as the training set of the secondary learner.
- Each base learner makes predictions on the original test set T, and the prediction results are averaged as the validation set of the secondary learners.
- The secondary learner obtains the new dataset generated from the base learner: the training set and the validation set , and then performs learning and training, and outputs the final prediction result.
| Algorithm 1 Stacking with K-fold Cross Validation |
| Input: training data Output: an ensemble classifier H 1: Step 1: adopt cross validation approach in preparing a training set for second-level classifier 2: Randomly split into K equal-size subsets: 3: for k = 1 to K do 4: Step 1.1: learn first-level classifiers 5: for t = 1 to T do 6: 7: end for 8: Step 1.2: construct a training set for second-level classifier 9: do 10: , where 11: end for 12: end for 13: Step 2: learn a second-level classifier 14: Learn a new classifier from the collection of 15: Step 3: relearn first-level classifiers 16: for t = 1 to T do 17: 18: end for 19: |
4.4. Evaluation Metrics
5. Experiments and Results
5.1. Dataset Analysis
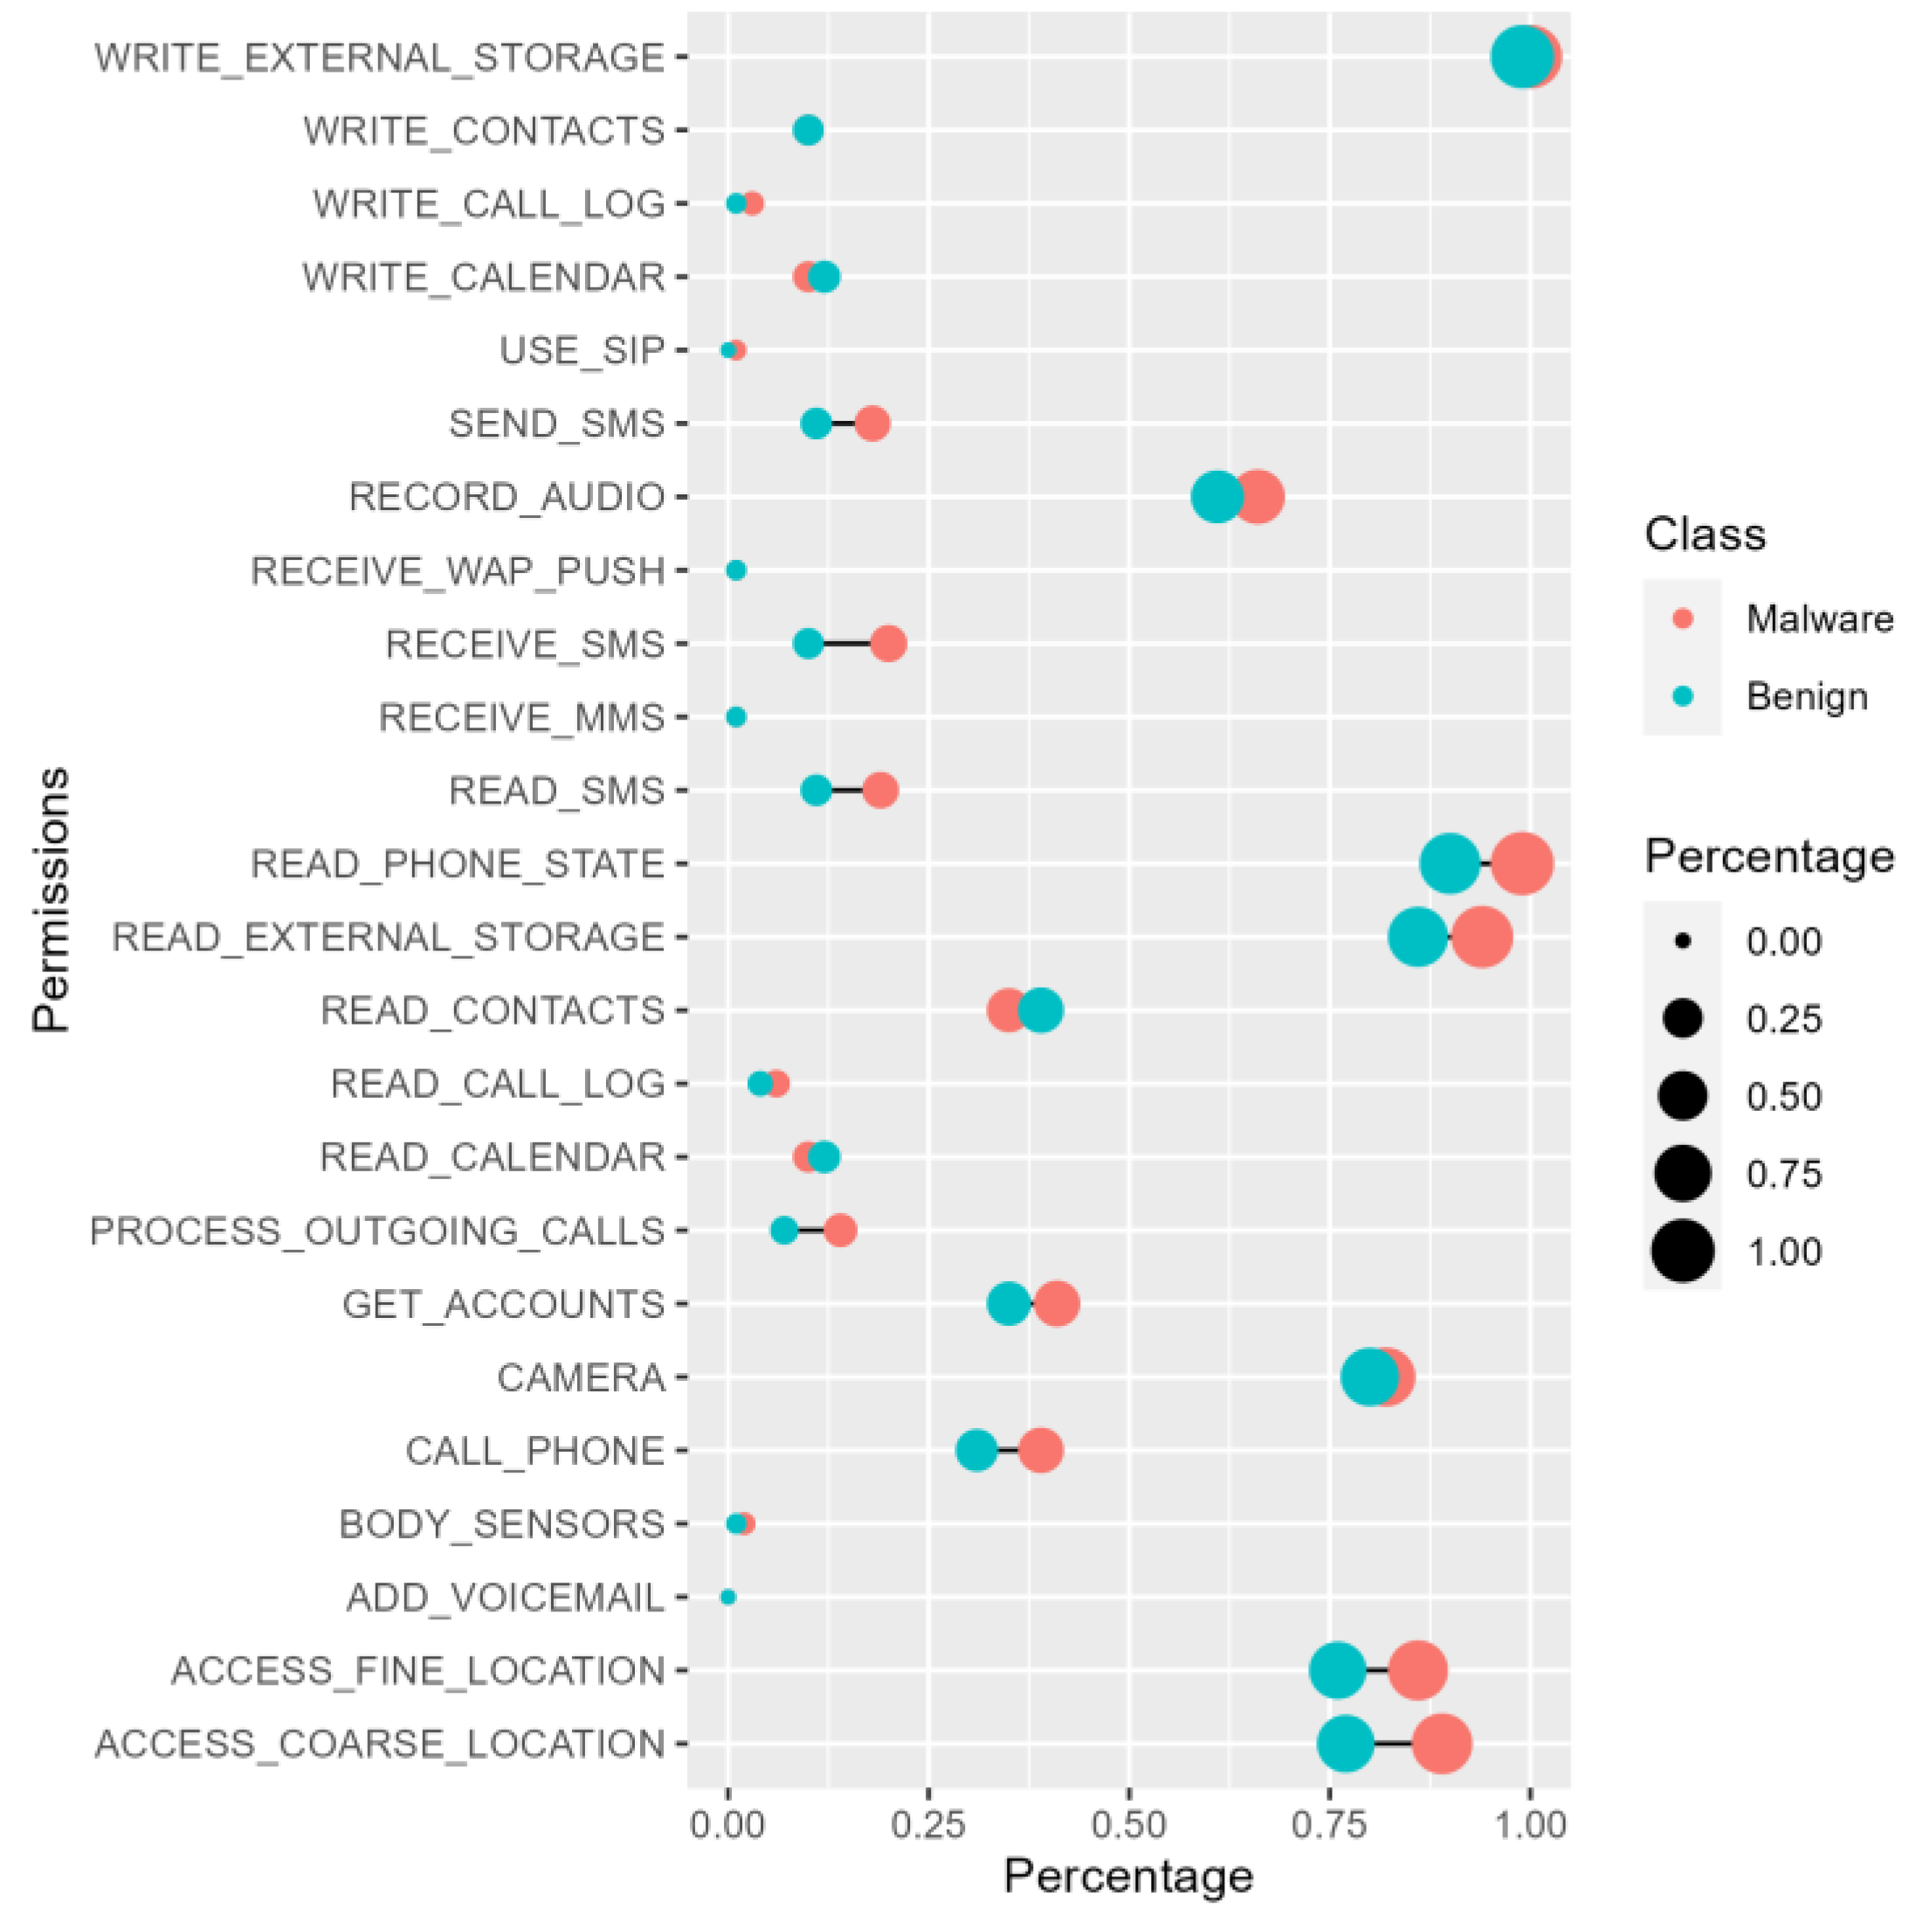
5.1.1. Permissions Required Analysis
5.1.2. API Calls Analysis
5.1.3. Opcodes Analysis
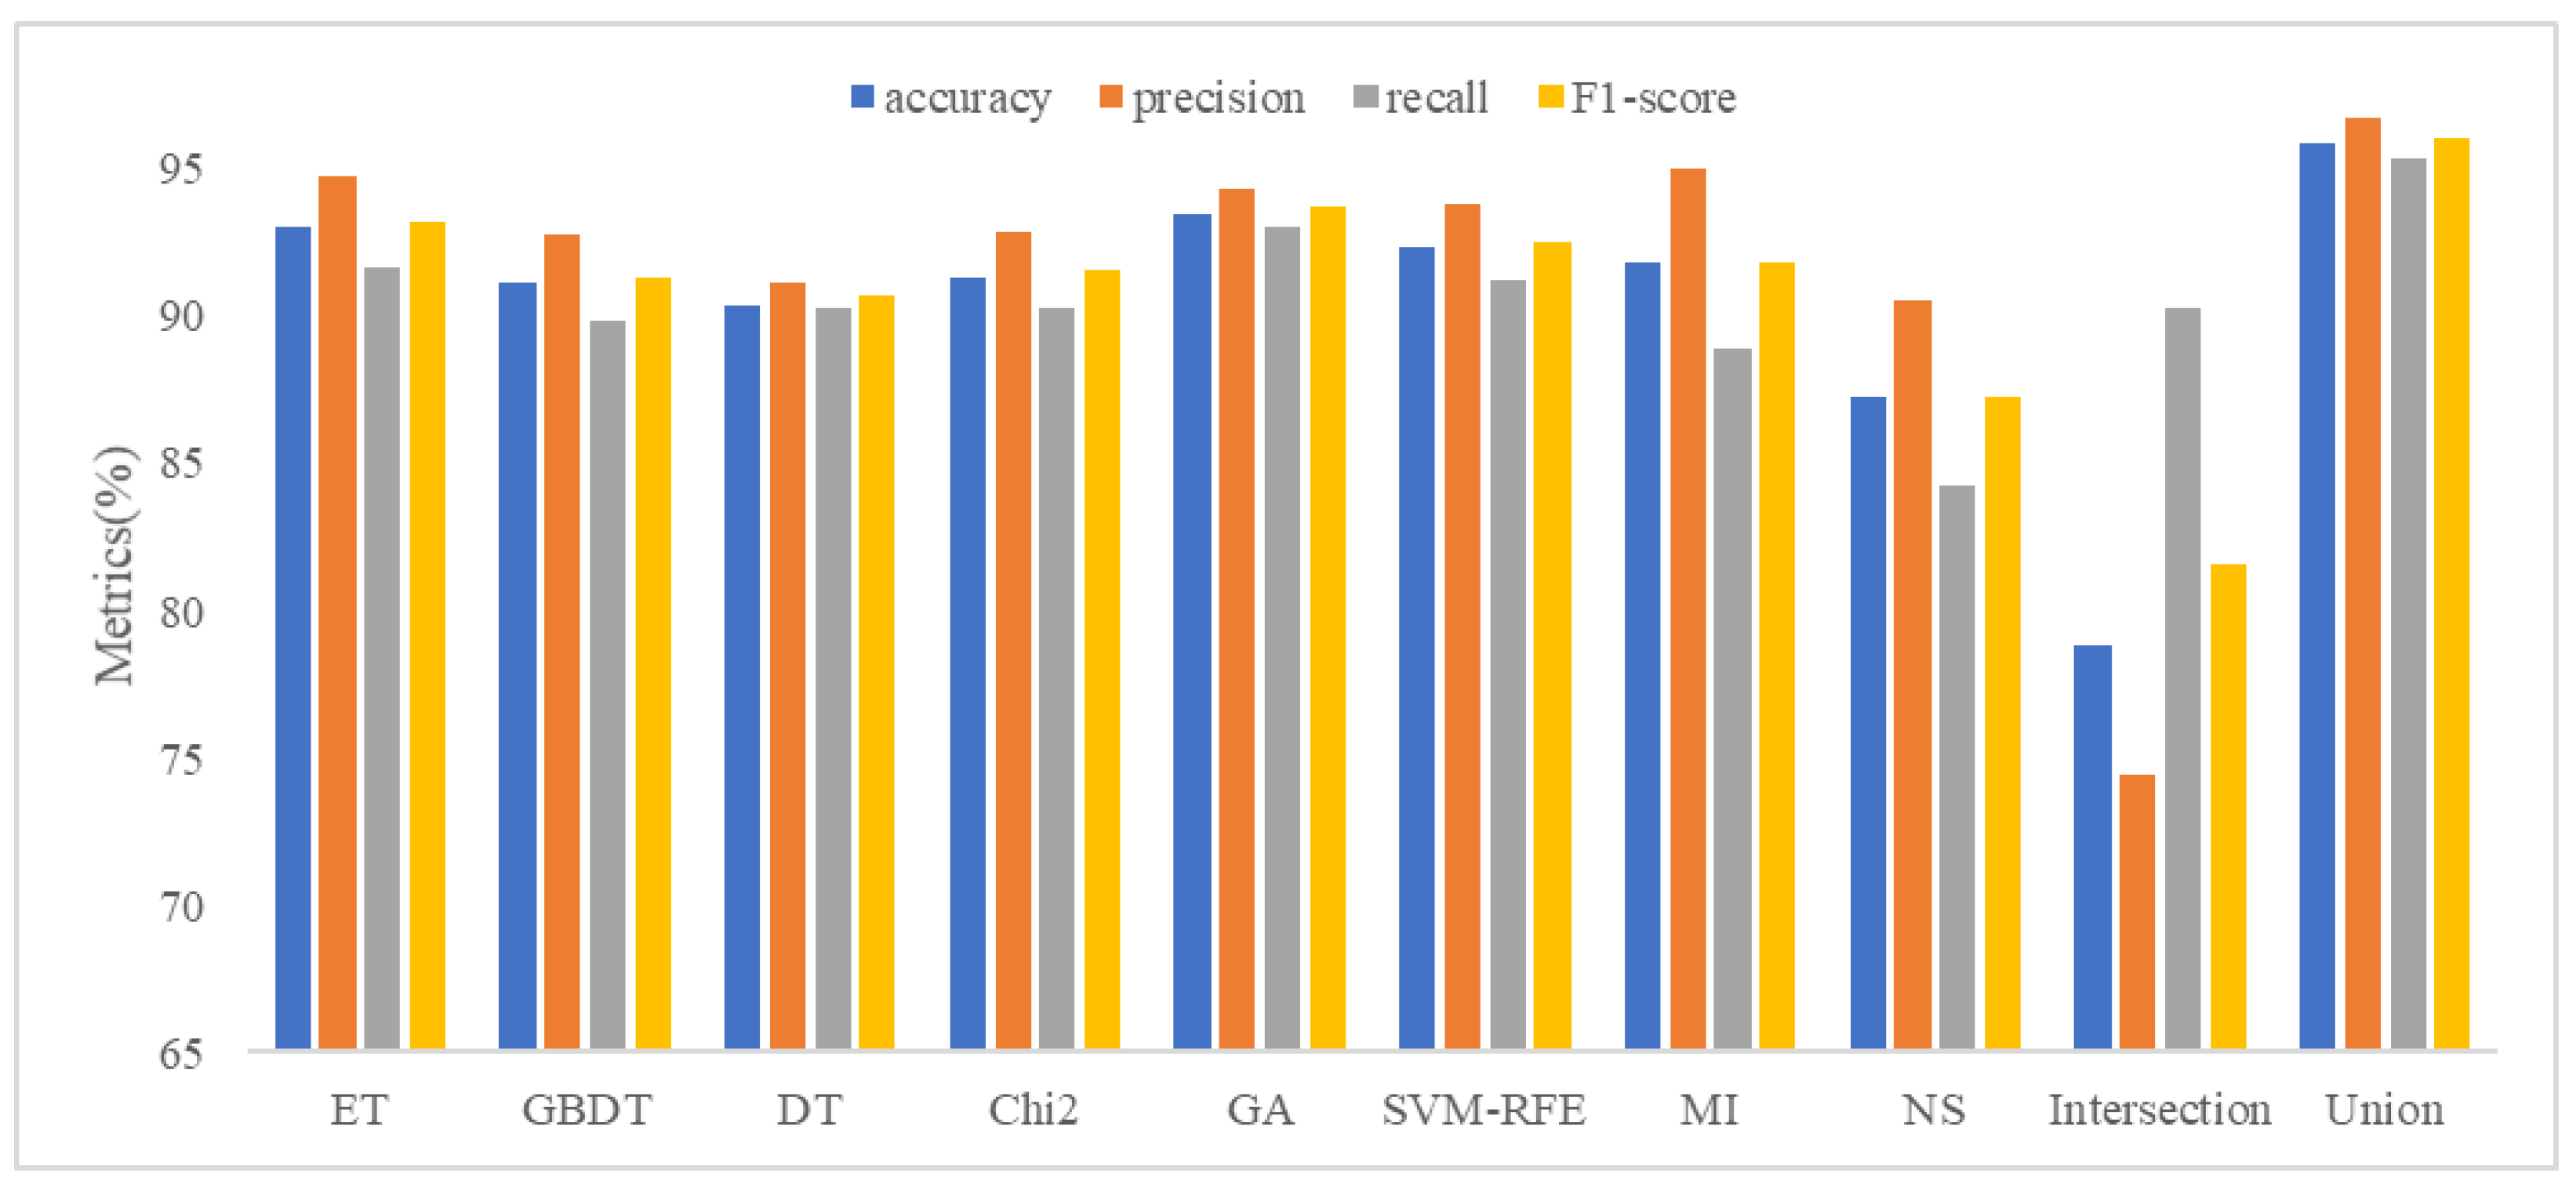
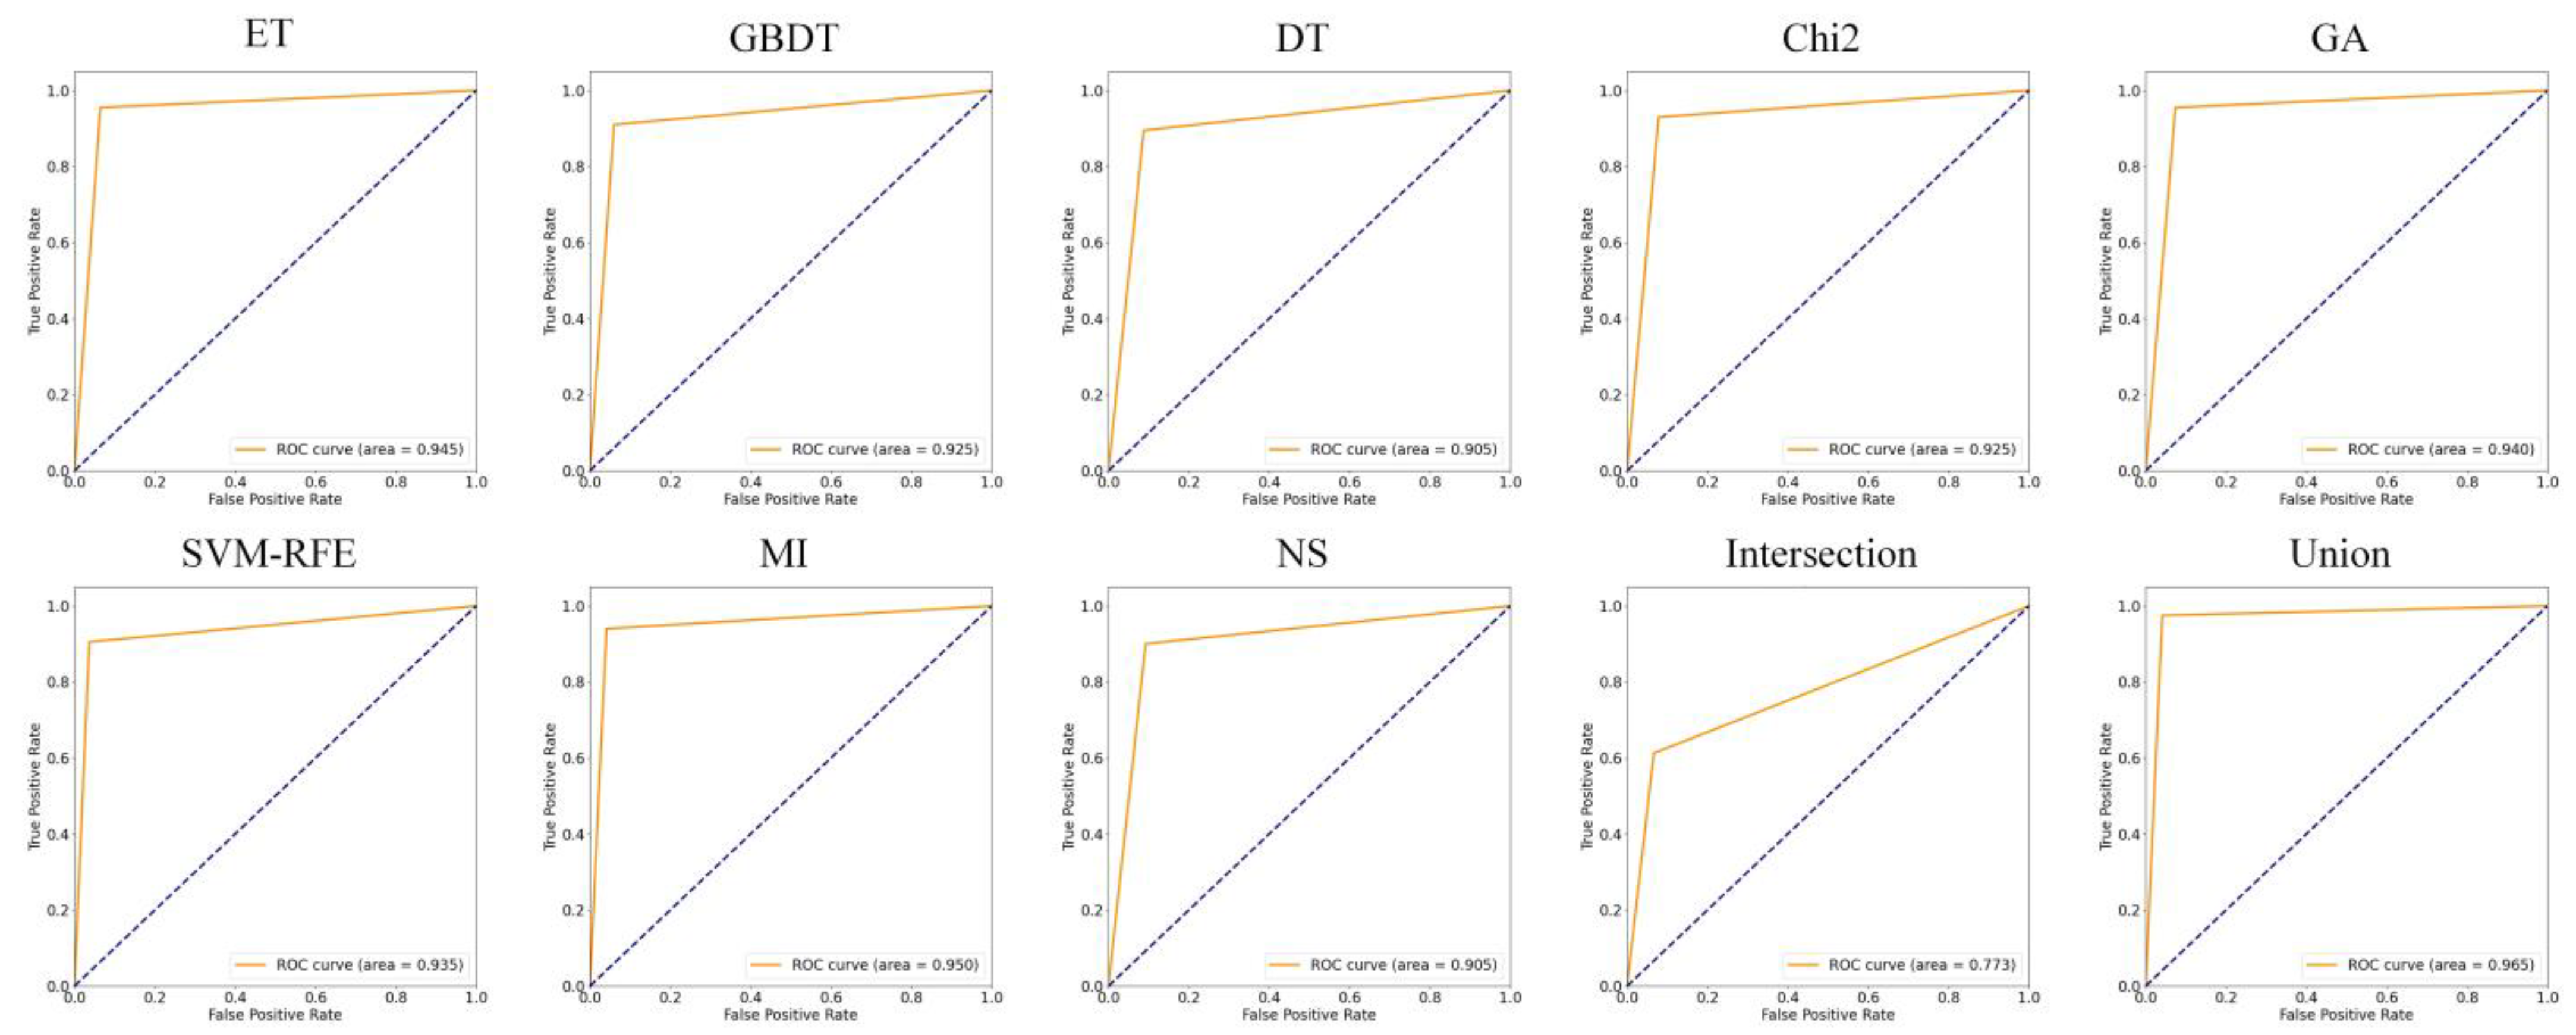
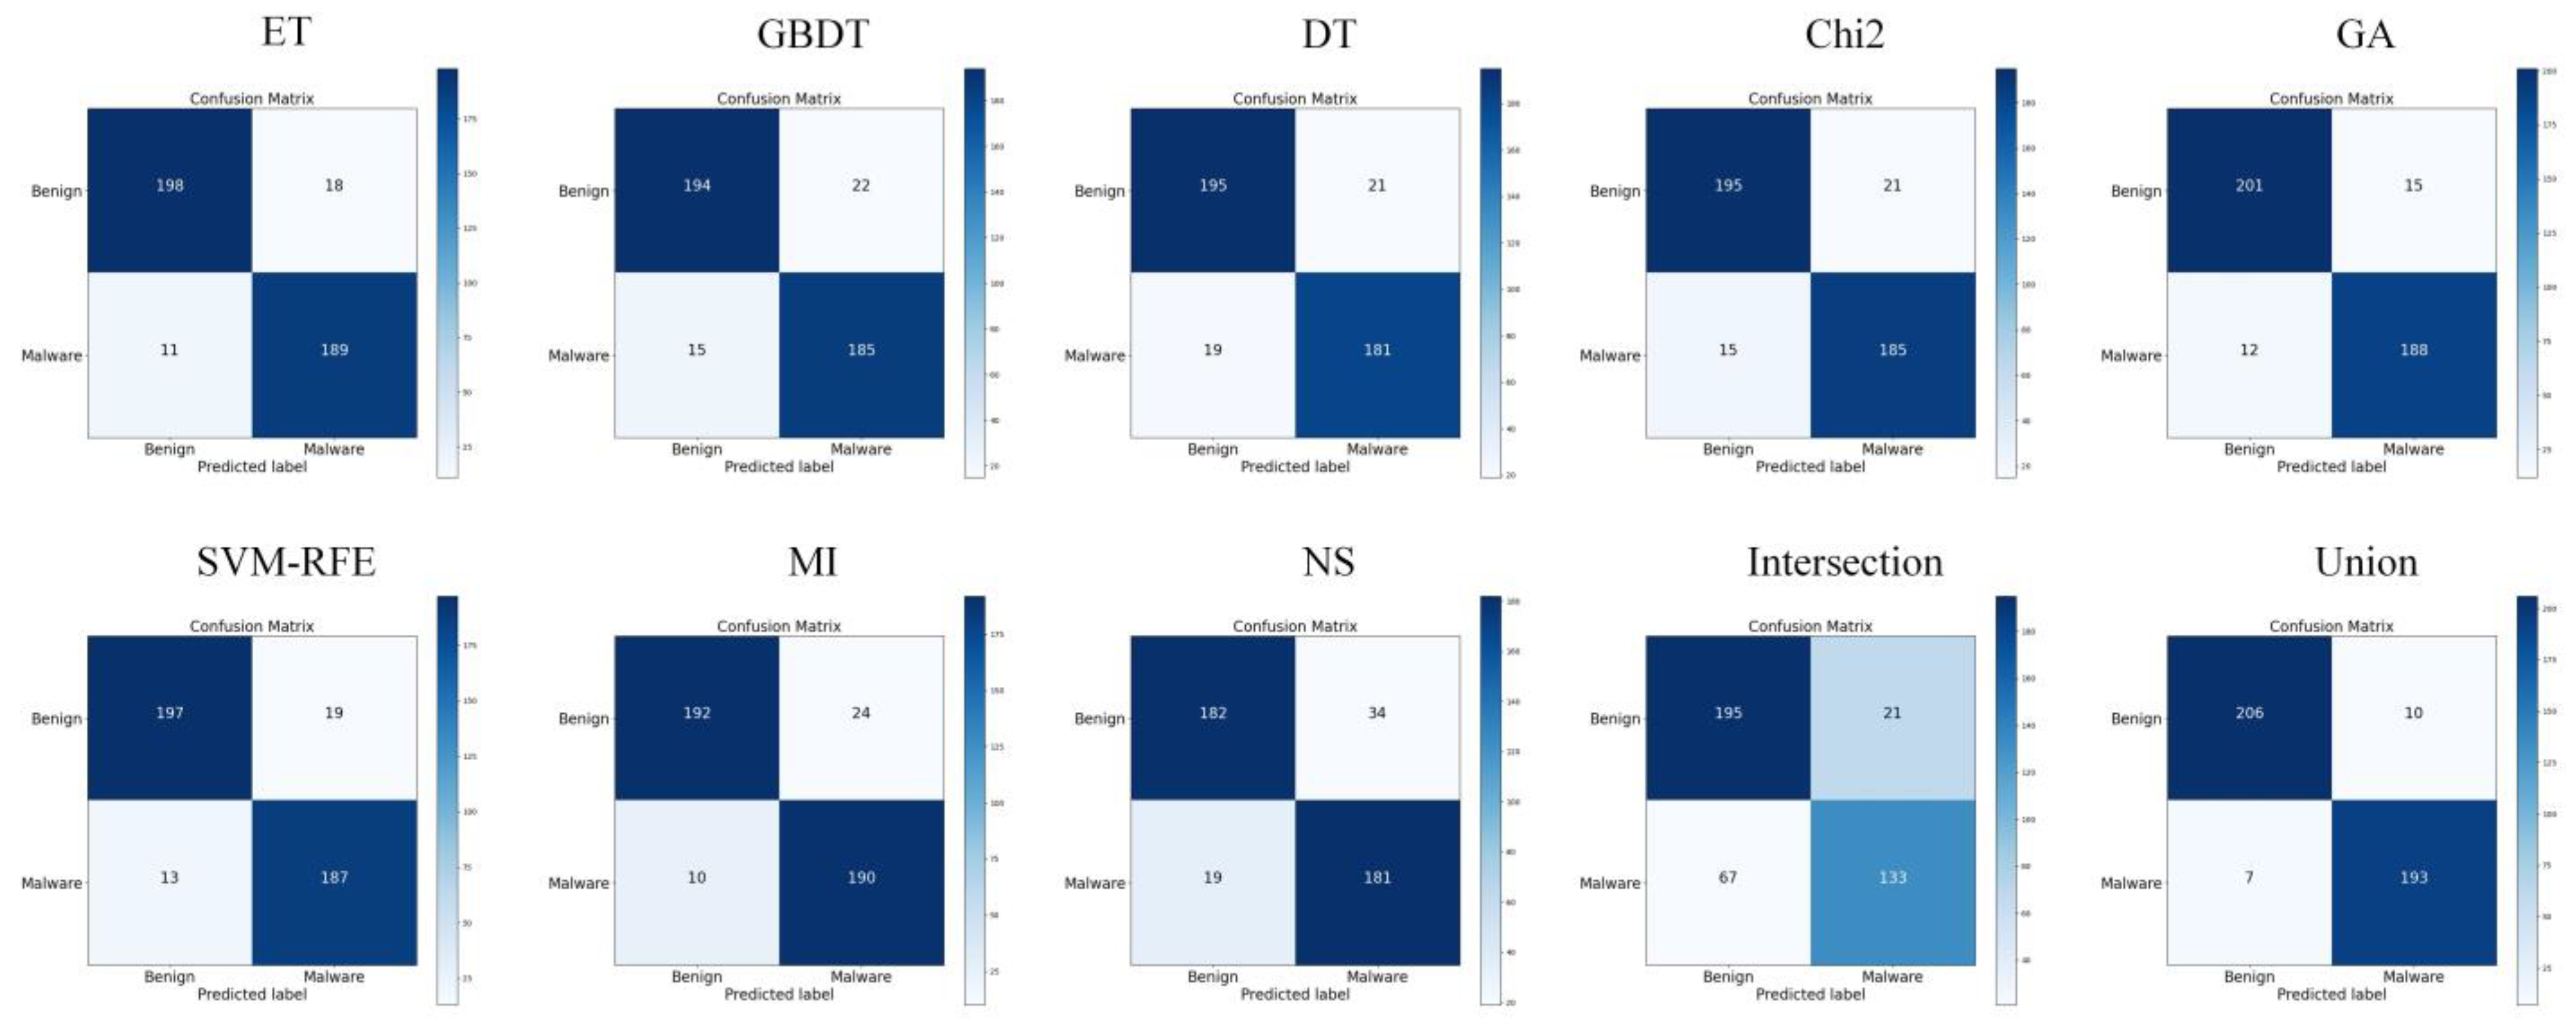
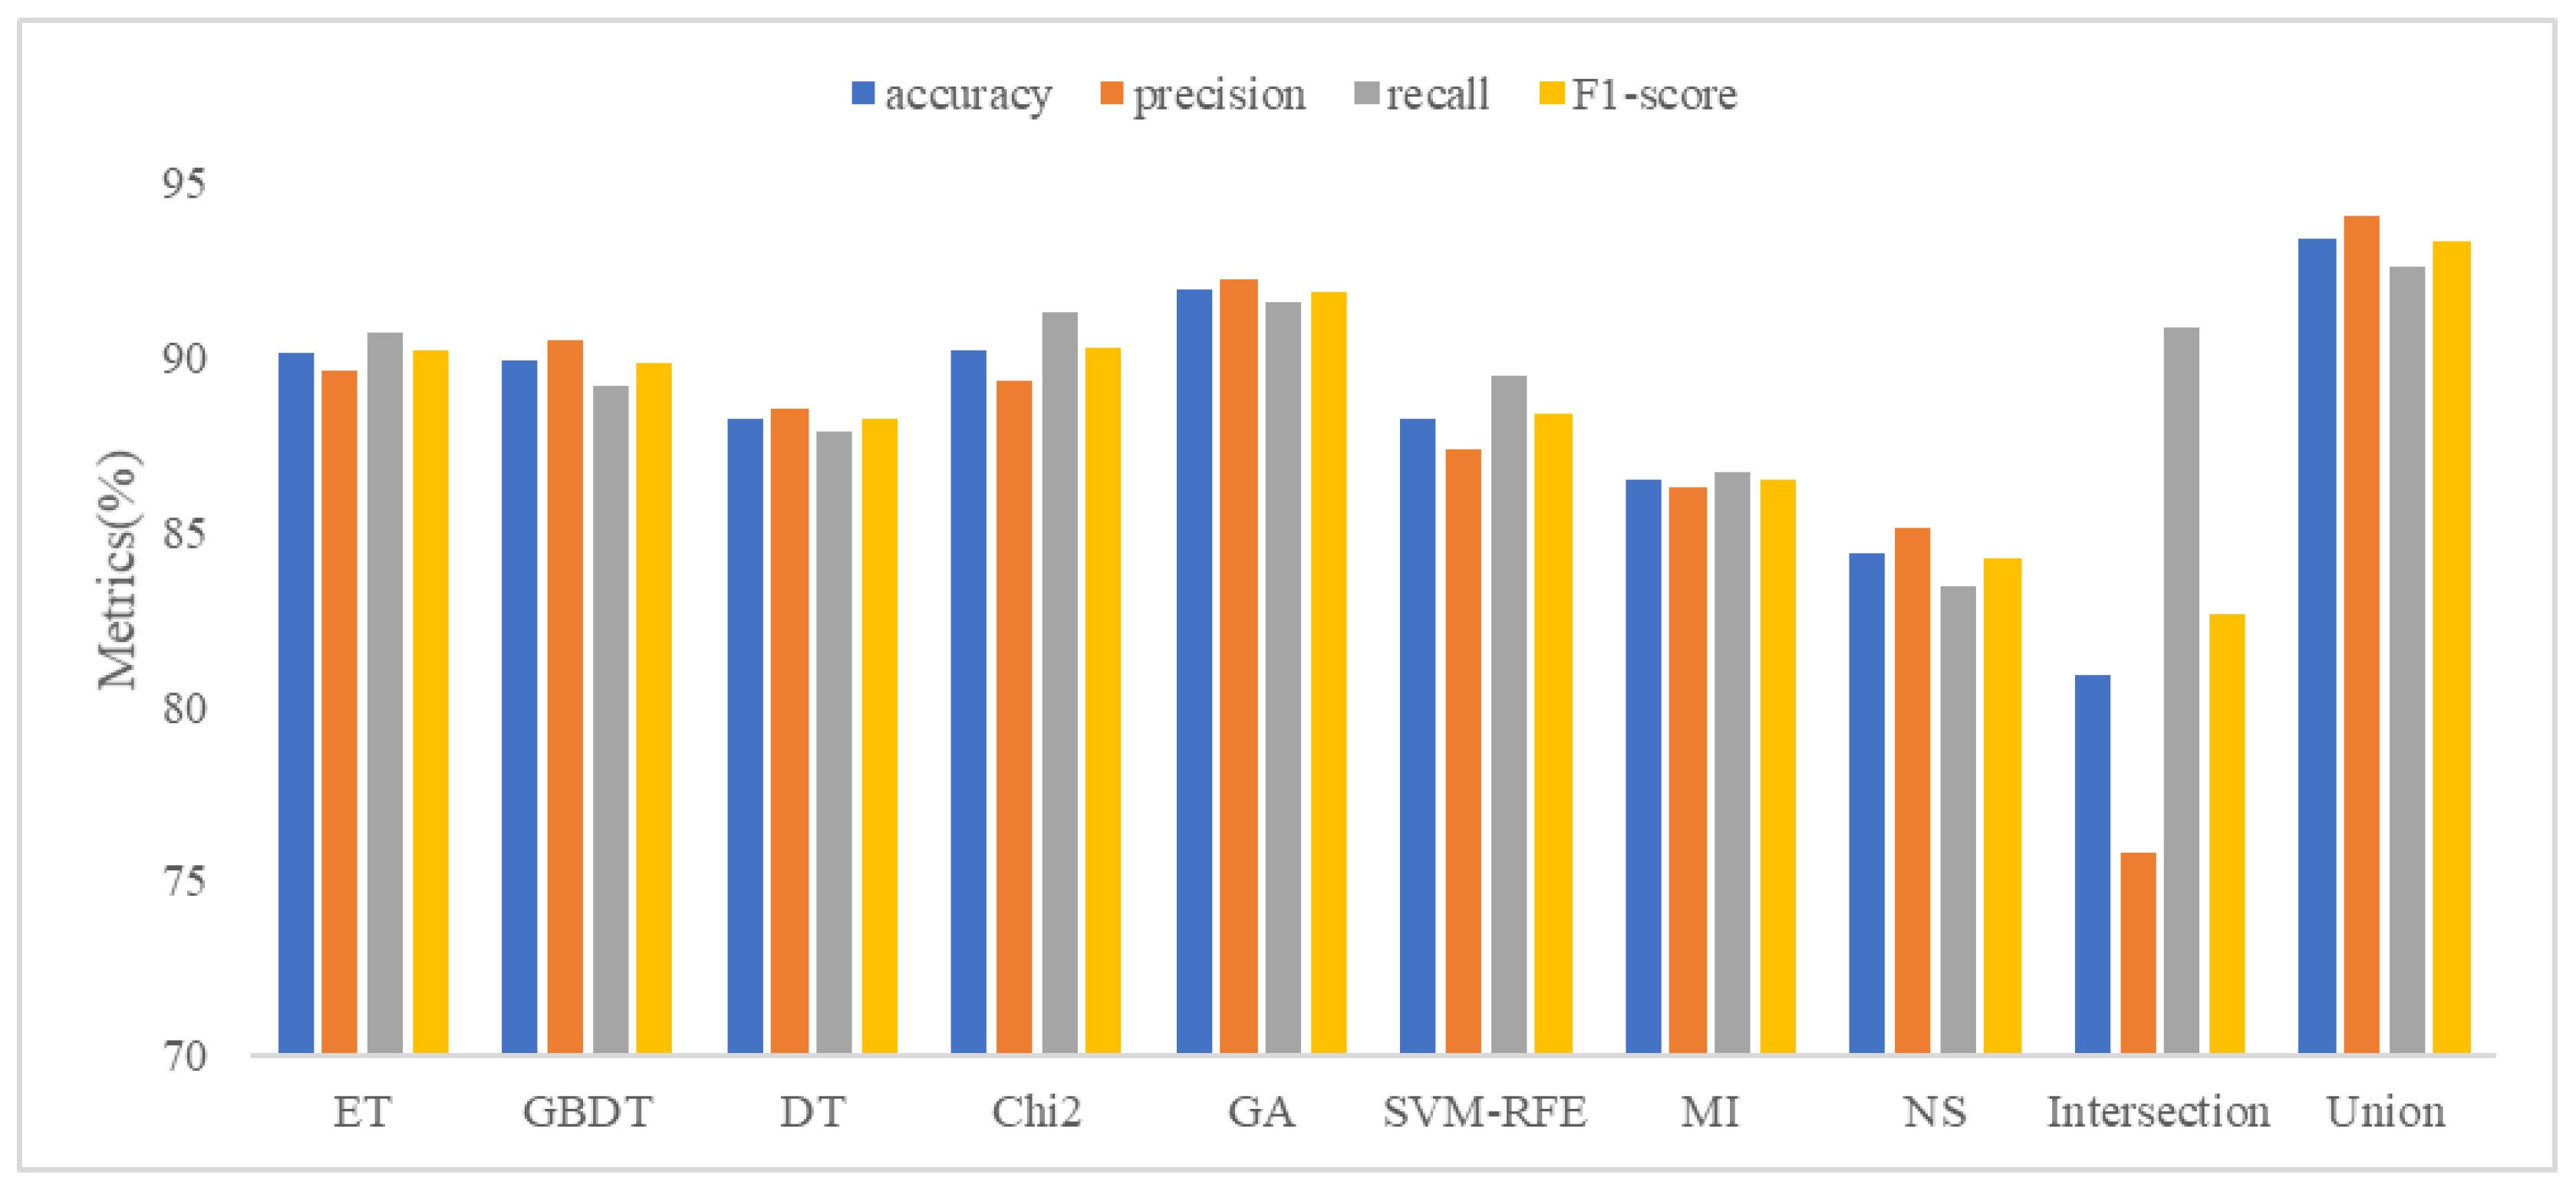
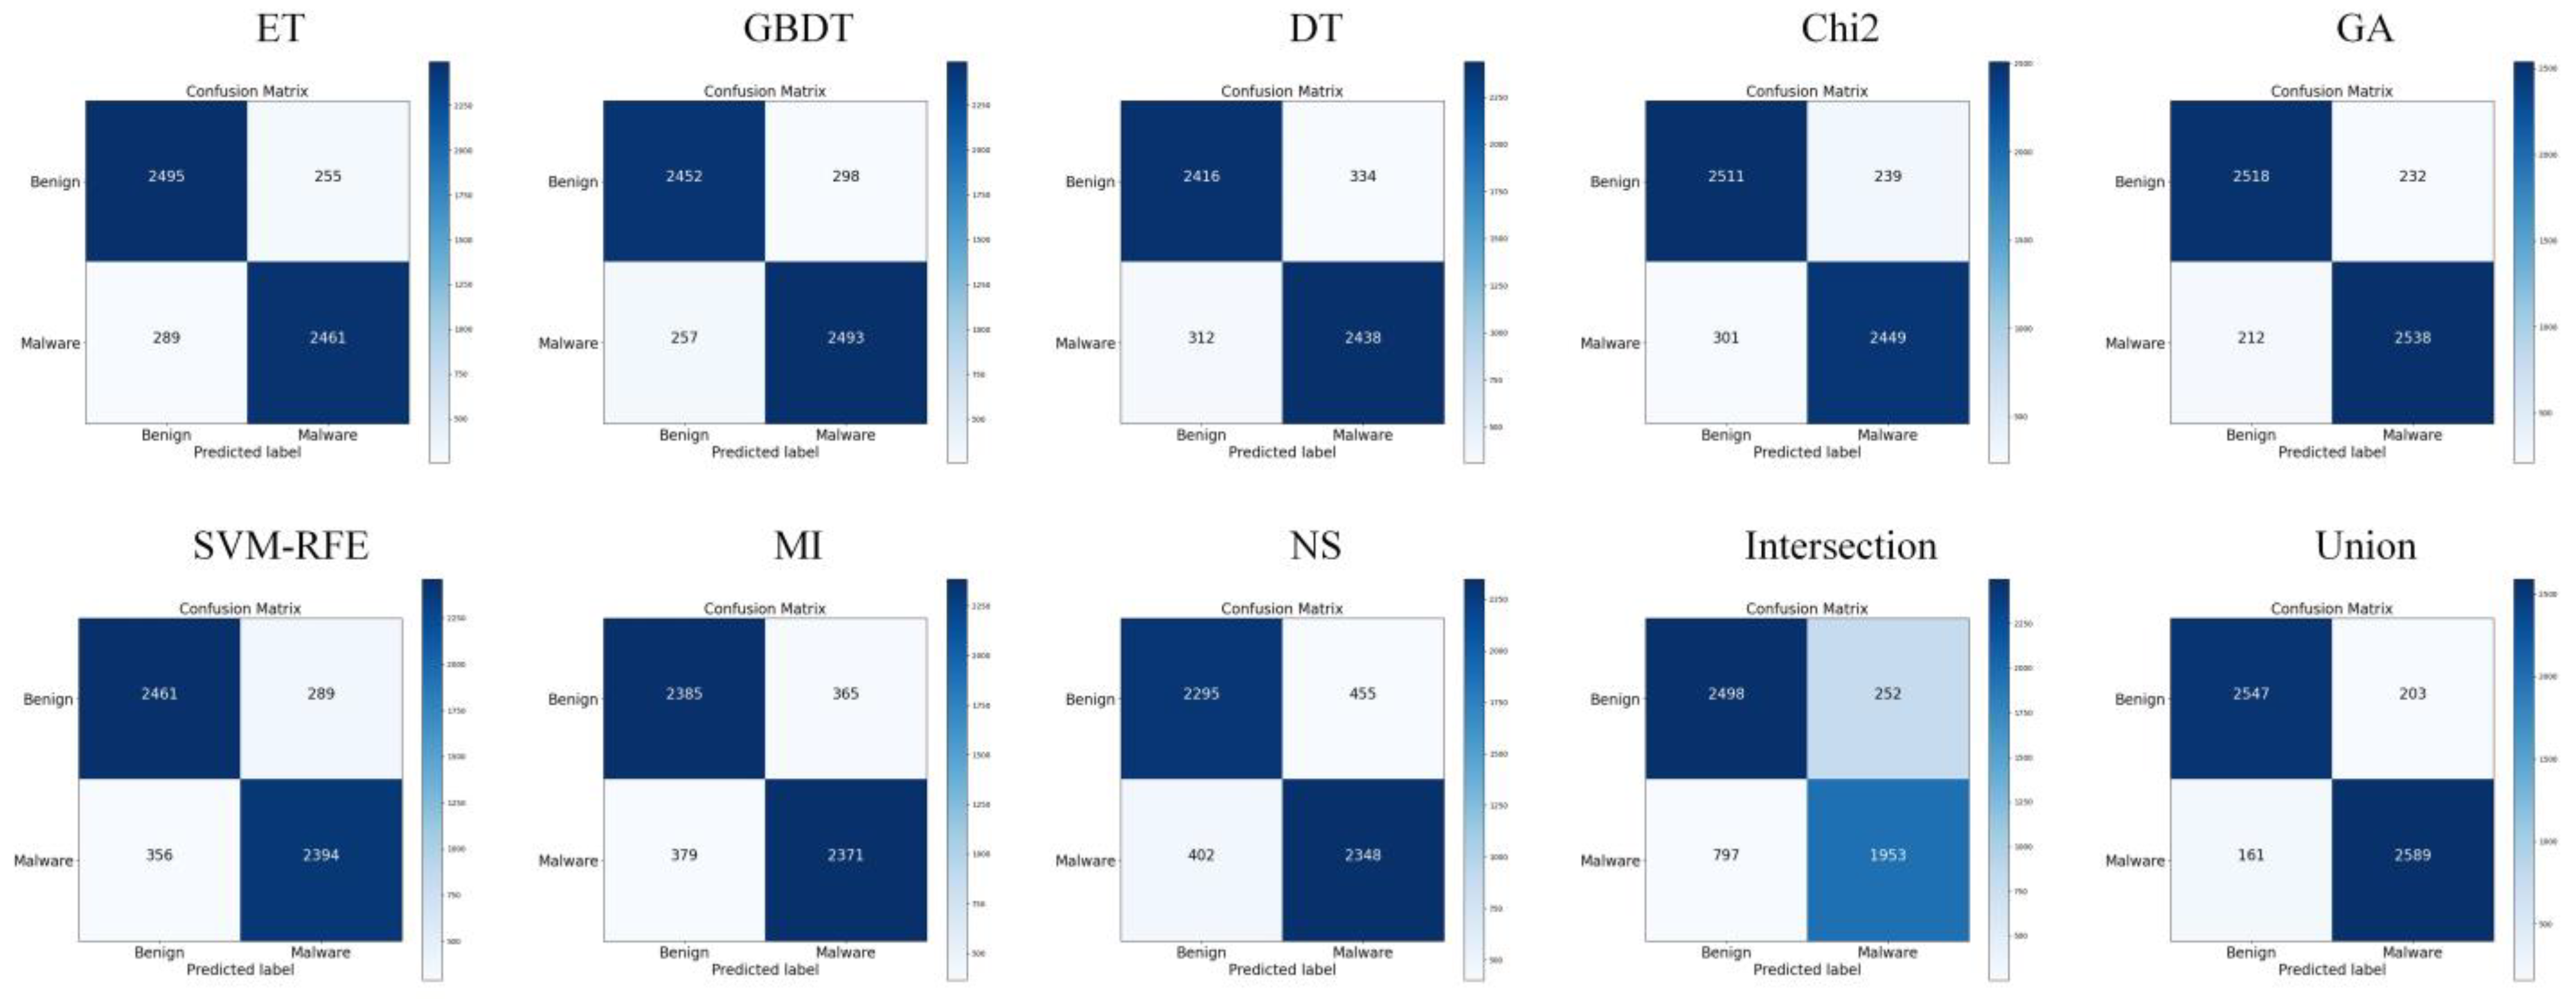
5.2. Analysis of Feature Selection Results
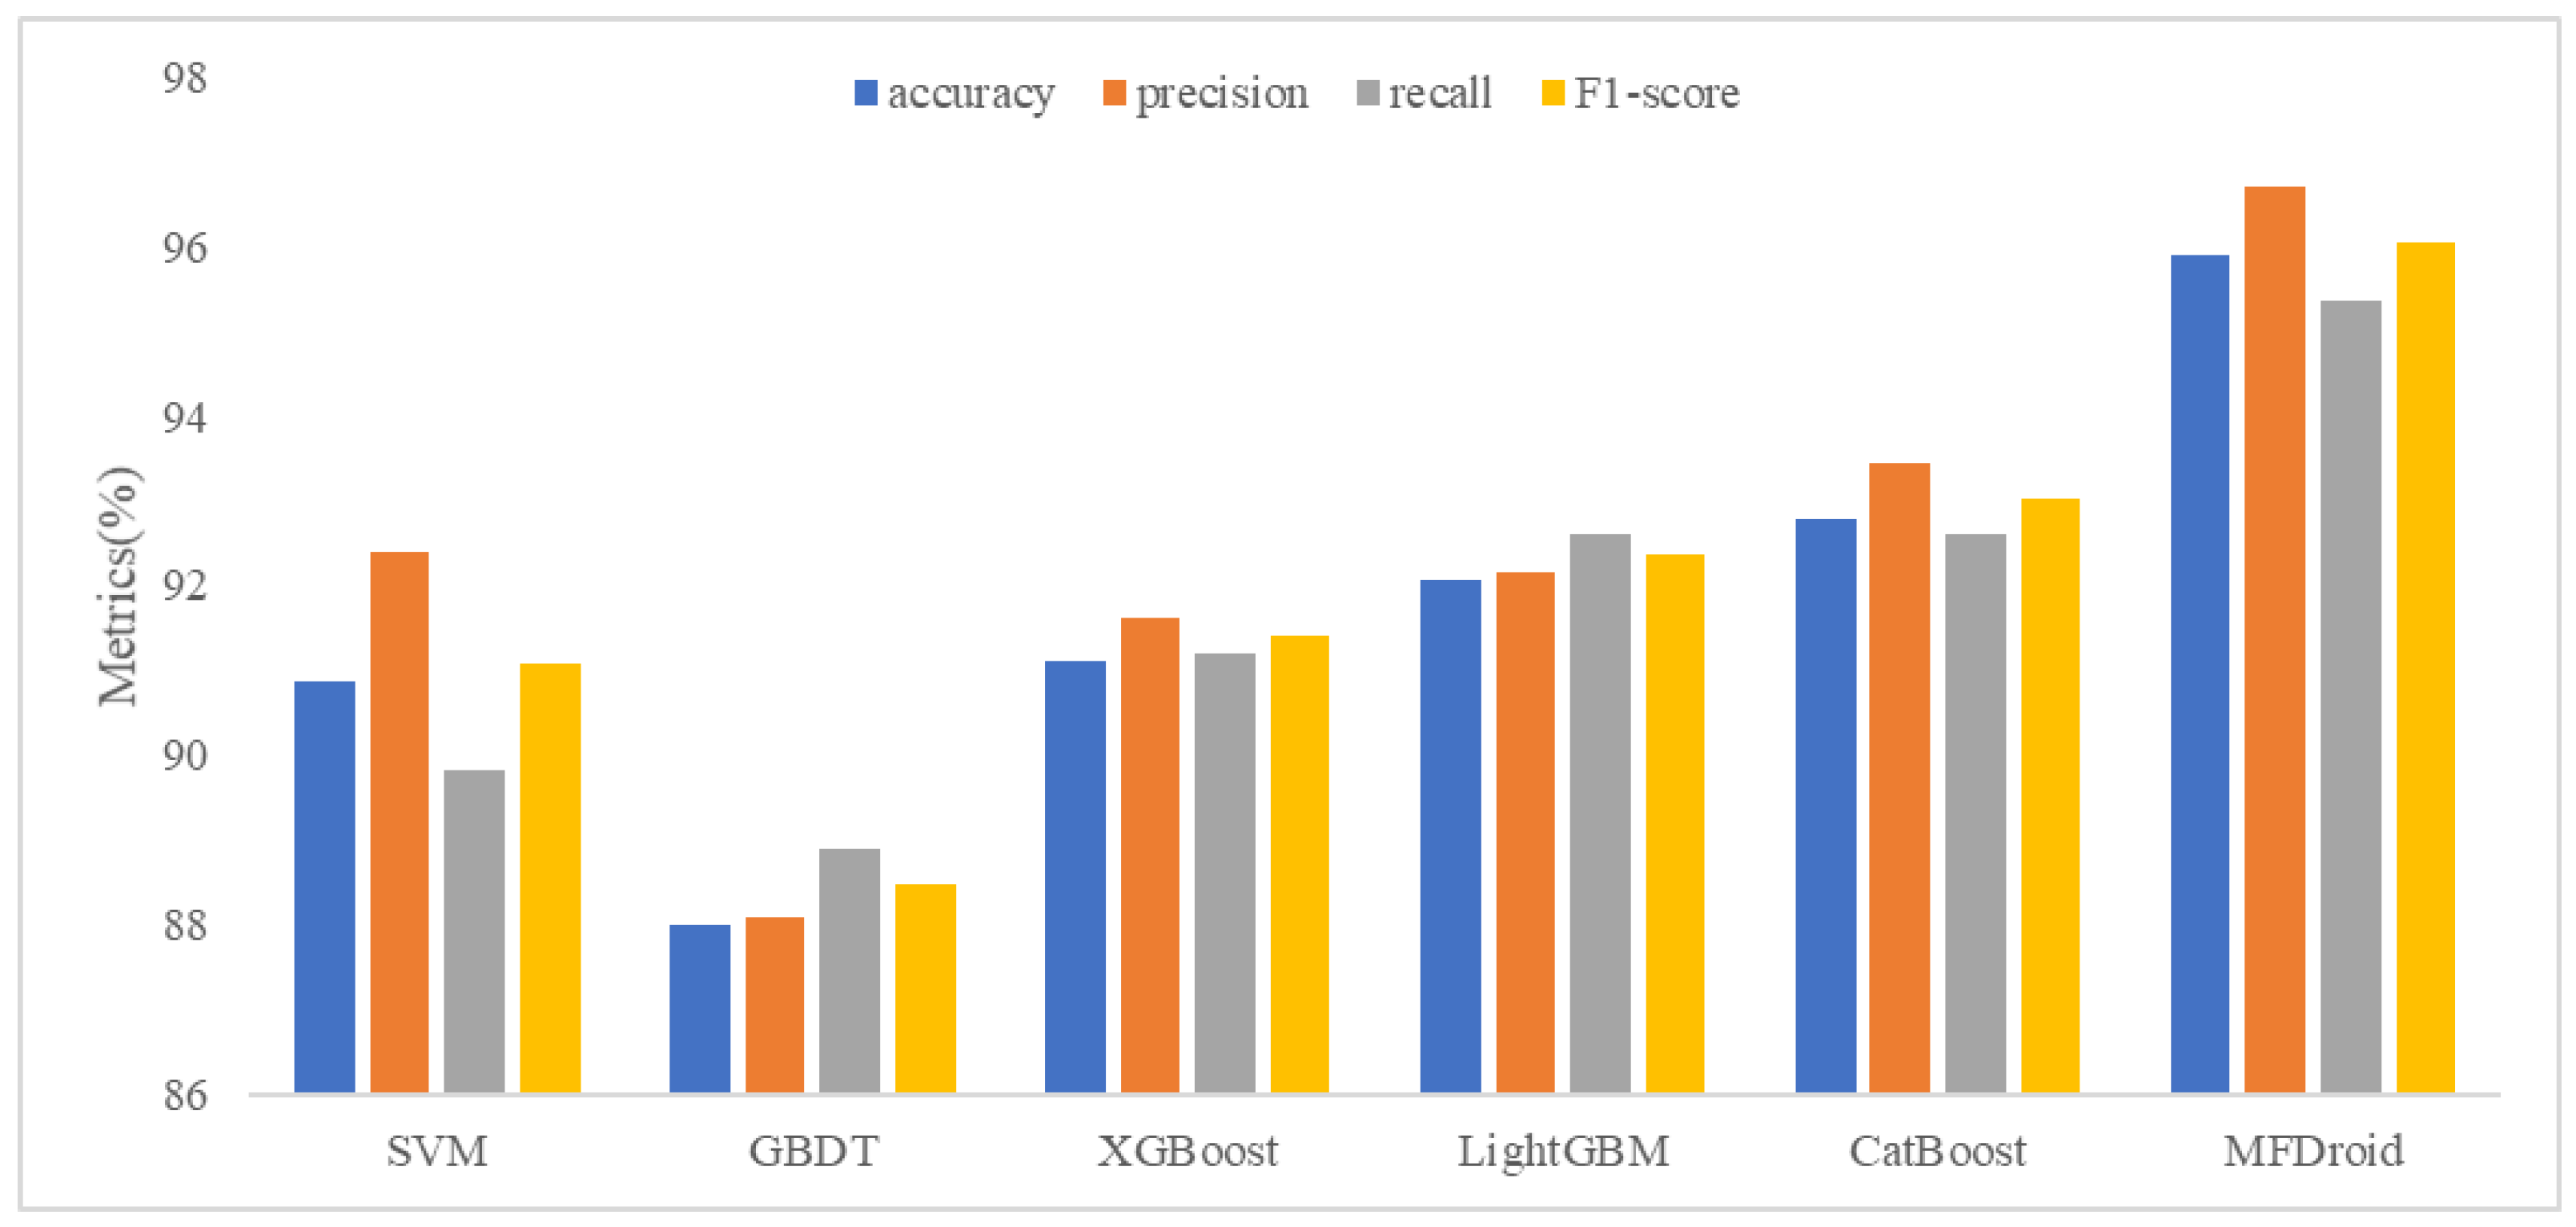
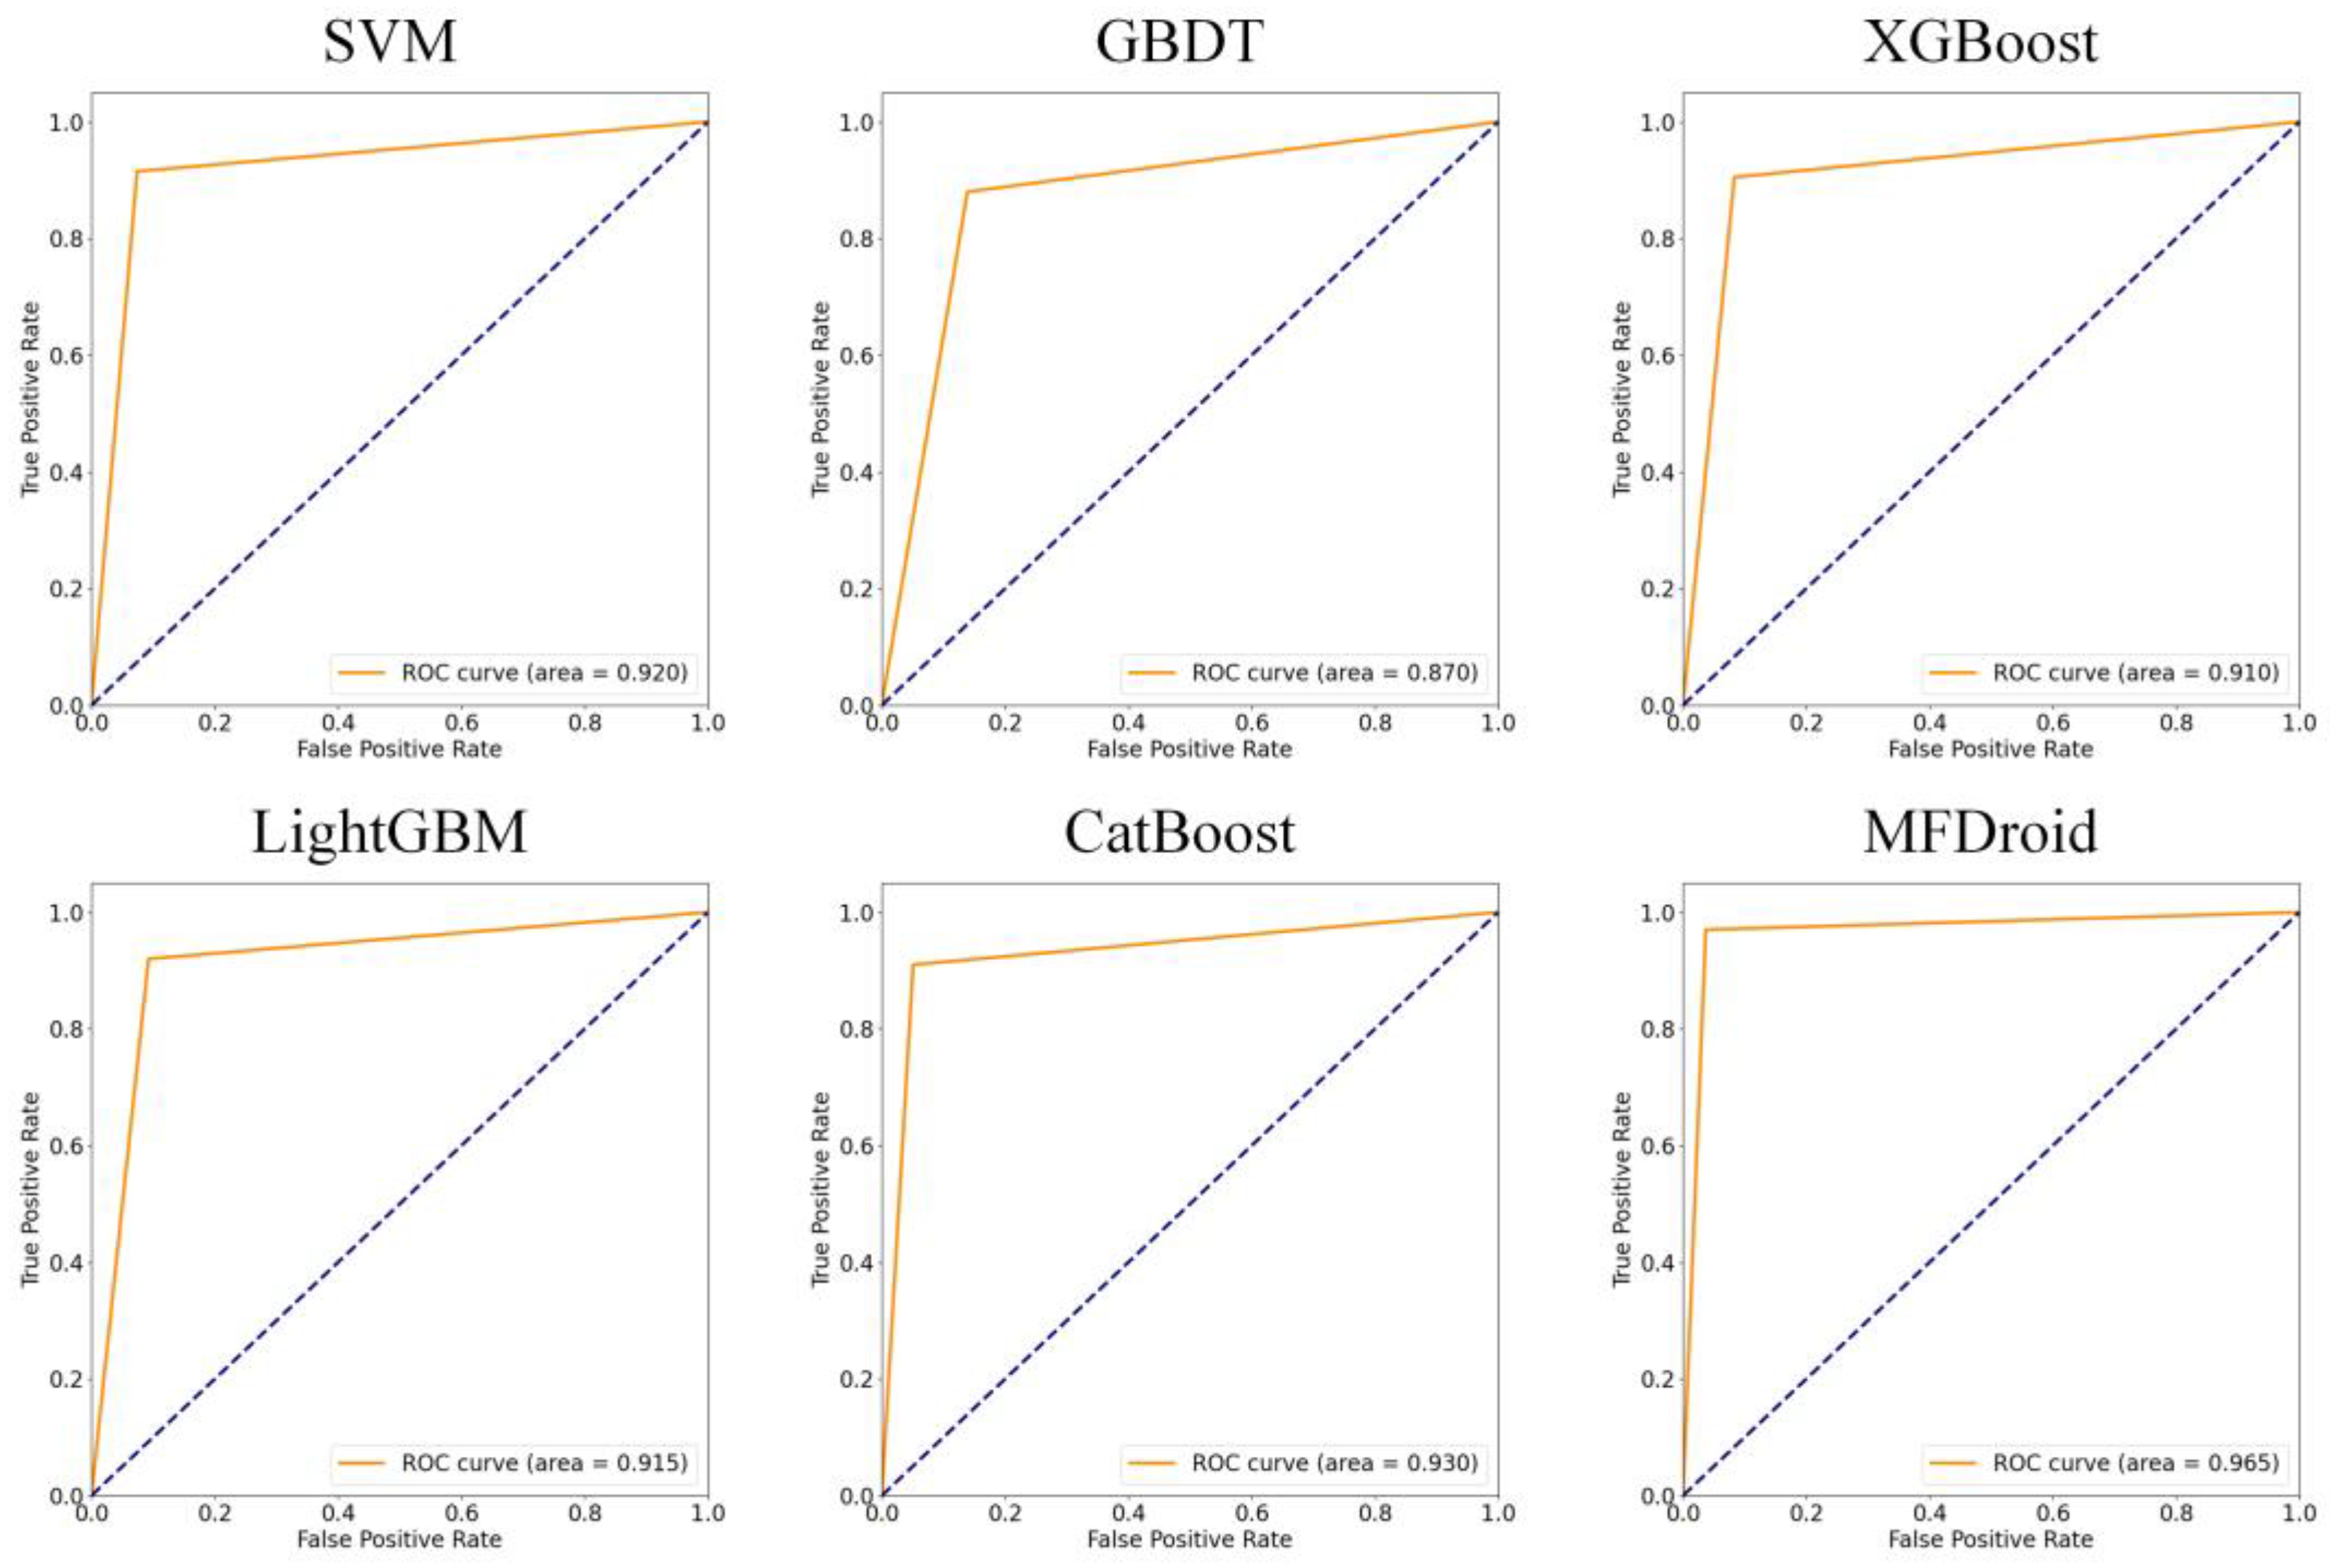
5.3. Detection Performance Evaluation of MFDroid
6. Conclusions and Future Work
Author Contributions
Funding
Institutional Review Board Statement
Informed Consent Statement
Data Availability Statement
Conflicts of Interest
References
- Statcounter. Mobile Operating System Market Share Worldwide. Available online: https://gs.statcounter.com/os-market-share/mobile/worldwide/ (accessed on 13 January 2022).
- AV-Comparatives. Mobile Security Review 2021. Available online: https://www.av-comparatives.org/tests/mobile-security-review-2021/#google-android (accessed on 13 January 2022).
- Yuan, W.; Jiang, Y.; Li, H.; Cai, M. A Lightweight On-Device Detection Method for Android Malware. IEEE Trans.Syst. ManCybern. Syst. 2021, 51, 5600–5611. [Google Scholar] [CrossRef]
- Vinod, P.; Zemmari, A.; Conti, M. A machine learning based approach to detect malicious android apps using discriminant system calls. Future Gener. Comput. Syst. 2019, 94, 333–350. [Google Scholar]
- Wong, M.Y.; Lie, D. IntelliDroid: A Targeted Input Generator for the Dynamic Analysis of Android Malware. In Proceedings of the Network and Distributed System Security Symposium (NDSS), San Diego, CA, USA, 21–24 February 2016; pp. 21–24. [Google Scholar]
- Mcdonald, J.; Herron, N.; Glisson, W.; Benton, R. Machine Learning-Based Android Malware Detection Using Manifest Permissions. In Proceedings of the 54th Hawaii International Conference on System Sciences, Hawaii, HI, USA, 4–8 January 2021; pp. 69–76. [Google Scholar]
- Arp, D.; Spreitzenbarth, M.; Hubner, M.; Gascon, H.; Rieck, K. DREBIN: Effective and Explainable Detection of Android Malware in Your Pocket. In Proceedings of the Network and Distributed System Security Symposium (NDSS), San Diego, CA, USA, 23–26 February 2014; pp. 1–12. [Google Scholar]
- Allix, K.; Bissyandé, T.F.; Klein, J.; Le Traon, Y. Androzoo: Collecting millions of android apps for the research community. In Proceedings of the 13th IEEE/ACM Working Conference on Mining Software Repositories (MSR), Austin, TX, USA, 14–15 May 2016; pp. 468–471. [Google Scholar]
- Martín, A.; Lara-Cabrera, R.; Camacho, D. Android malware detection through hybrid features fusion and ensemble classifiers: The AndroPyTool framework and the OmniDroid dataset. Inf. Fusion 2019, 52, 128–142. [Google Scholar] [CrossRef]
- Li, J.; Sun, L.; Yan, Q.; Li, Z.; Srisa-an, W.; Ye, H. Significant Permission Identification for Machine-Learning-Based Android Malware Detection. IEEE Trans. Ind. Inform. 2018, 14, 3216–3225. [Google Scholar] [CrossRef]
- Tao, G.; Zheng, Z.; Guo, Z.; Lyu, M.R. MalPat: Mining patterns of malicious and benign Android apps via permission-related APIs. IEEE Trans. Reliab. 2017, 67, 355–369. [Google Scholar] [CrossRef]
- Alazab, M.; Alazab, M.; Shalaginov, A.; Mesleh, A.; Awajan, A. Intelligent mobile malware detection using permission requests and API calls. Future Gener. Comput. Syst. 2020, 107, 509–521. [Google Scholar] [CrossRef]
- Gaviria de la Puerta, J.; Sanz, B. Using Dalvik opcodes for malware detection on android. Logic. J. IGPL 2017, 25, 938–948. [Google Scholar] [CrossRef] [Green Version]
- Cai, L.; Li, Y.; Xiong, Z. JOWMDroid: Android malware detection based on feature weighting with joint optimization of weight-mapping and classifier parameters. Comput. Secur. 2021, 100, 102086. [Google Scholar] [CrossRef]
- Mahindru, A.; Sangal, A.L. MLDroid—Framework for Android malware detection using machine learning techniques. Neural Comput. Appl. 2021, 33, 5183–5240. [Google Scholar] [CrossRef]
- Jannat, U.S.; Hasnayeen, S.M.; Shuhan, M.K.B.; Ferdous, M.S. Analysis and Detection of Malware in Android Applications Using Machine Learning. In Proceedings of the 2019 International Conference on Electrical, Computer and Communication Engineering (ECCE), Cox’s Bazar, Bangladesh, 7–9 February 2019; pp. 1–7. [Google Scholar]
- Aboaoja, F.A.; Zainal, A.; Ghaleb, F.A.; Al-rimy, B.A.S. Toward an Ensemble Behavioral-based Early Evasive Malware Detection Framework. In Proceedings of the 2021 International Conference on Data Science and Its Applications (ICoDSA), Bandung, Indonesia, 6–7 October 2021; pp. 181–186. [Google Scholar]
- Zhu, H.; Li, Y.; Li, R.; Li, J.; You, Z.; Song, H. SEDMDroid: An Enhanced Stacking Ensemble Framework for Android Malware Detection. IEEE Trans. Netw. Sci. Eng. 2021, 8, 984–994. [Google Scholar] [CrossRef]
- Idrees, F.; Rajarajan, M.; Conti, M.; Chen, T.M.; Rahulamathavan, Y. PIndroid: A novel Android malware detection system using ensemble learning methods. Comput. Secur. 2017, 68, 36–46. [Google Scholar] [CrossRef] [Green Version]
- Rana, M.S.; Sung, A.H. Evaluation of Advanced Ensemble Learning Techniques for Android Malware Detection. Vietnam. J. Comput. Sci. 2020, 7, 145–159. [Google Scholar] [CrossRef] [Green Version]
- VirusTotal. VirusTotal: Free Online Virus, Malware and URL Scanner. Available online: https://www.virustotal.com/ (accessed on 13 January 2022).
- Wang, X.; Wang, W.; He, Y.; Liu, J.; Han, Z.; Zhang, X. Characterizing Android apps’ behavior for effective detection of malapps at large scale. Future Gener. Comput. Syst. 2017, 75, 30–45. [Google Scholar] [CrossRef] [Green Version]
- Lee, J.; Jang, H.; Ha, S.; Yoon, Y. Android Malware Detection Using Machine Learning with Feature Selection Based on the Genetic Algorithm. Mathematics 2021, 9, 2813. [Google Scholar] [CrossRef]
- Fatima, A.; Maurya, R.; Dutta, M.K.; Burget, R.; Masek, J. Android Malware Detection Using Genetic Algorithm based Optimized Feature Selection and Machine Learning. In Proceedings of the 42nd International Conference on Telecommunications and Signal Processing (TSP), Budapest, Hungary, 1–3 July 2019; pp. 220–223. [Google Scholar]
- Takahashi, T.; Ban, T. Android Application Analysis Using Machine Learning Techniques. AI Cybersecur. 2019, 151, 181–205. [Google Scholar]
- Macedo, F.; Oliveira, M.R.; Pacheco, A.; Valadas, R. Theoretical foundations of forward feature selection methods based on mutual information. Neurocomputing 2019, 325, 67–89. [Google Scholar] [CrossRef] [Green Version]
- Han, H.; Lim, S.; Suh, K.; Park, S.; Cho, S.-J.; Park, M. Enhanced android malware detection: An svm-based machine learning approach. In Proceedings of the IEEE International Conference on Big Data and Smart Computing (BigComp), Busan, Korea, 19–22 February 2020; pp. 75–81. [Google Scholar]
- Chen, T.; Guestrin, C. XGBoost: A Scalable Tree Boosting System. In Proceedings of the 22nd ACM SIGKDD International Conference on Knowledge Discovery and Data Mining, San Francisco, CA, USA, 13–17 August 2016; pp. 785–794. [Google Scholar]
- Ke, G.; Meng, Q.; Finley, T.; Wang, T.; Chen, W.; Ma, W.; Ye, Q.; Liu, T.-Y. Lightgbm: A highly efficient gradient boosting decision tree. Adv. Neural Inf. Process. Syst. 2017, 30, 3146–3154. [Google Scholar]
- Dorogush, A.V.; Ershov, V.; Gulin, A. CatBoost: Gradient boosting with categorical features support. arXiv 2018, arXiv:1810.11363. [Google Scholar]
- Rodrigo, C.; Pierre, S.; Beaubrun, R.; El Khoury, F. BrainShield: A Hybrid Machine Learning-Based Malware Detection Model for Android Devices. Electronics 2021, 10, 2948. [Google Scholar] [CrossRef]


| Category | Count |
|---|---|
| Malware | 806 |
| Benign | 858 |
| Total | 1664 |
| Feature | Count |
|---|---|
| Permission | 146 |
| Opcode | 218 |
| API call | 3183 |
| Activity | 4071 |
| Service | 3219 |
| Receiver | 4633 |
| apiPackage | 212 |
| Feature | Category | Amount | Combined Vector |
|---|---|---|---|
| Permission | 0–1 | 146 | The three features formed a 3547-dimensional vector |
| Opcode | 0–1 | 218 | |
| API call | 0–1 | 3183 |
| Algorithm | ET | GBDT | DT | Chi2 | GA | SVM-RFE | MI |
|---|---|---|---|---|---|---|---|
| Amount | 1452 | 1319 | 1500 | 1500 | 1687 | 1893 | 1366 |
| Predicted | Actual | Positive | Negative |
|---|---|---|---|
| Positive | True Positive (TP) | False Positive (FP) | |
| Negative | False Negative (FN) | True Negative (TN) | |
| Malware | Benign | ||
|---|---|---|---|
| Permission | % | Permission | % |
| INTERNET | 100% | INTERNET | 99% |
| ACCESS_NETWORK_STATE | 100% | WRITE_EXTERNAL_STORAGE | 99% |
| WRITE_EXTERNAL_STORAGE | 100% | ACCESS_NETWORK_STATE | 99% |
| ACCESS_WIFI_STATE | 100% | ACCESS_WIFI_STATE | 94% |
| READ_PHONE_STATE | 99% | READ_PHONE_STATE | 90% |
| READ_EXTERNAL_STORAGE | 94% | READ_EXTERNAL_STORAGE | 86% |
| WAKE_LOCK | 90% | WAKE_LOCK | 82% |
| ACCESS_COARSE_LOCATION | 89% | VIBRATE | 81% |
| GET_TASKS | 88% | CAMERA | 80% |
| VIBRATE | 88% | ACCESS_COARSE_LOCATION | 77% |
| CHANGE_WIFI_STATE | 87% | ACCESS_FINE_LOCATION | 76% |
| ACCESS_FINE_LOCATION | 86% | CHANGE_WIFI_STATE | 72% |
| CAMERA | 82% | GET_TASKS | 71% |
| WRITE_SETTINGS | 79% | RECEIVE_BOOT_COMPLETED | 65% |
| SYSTEM_ALERT_WINDOW | 76% | REQUEST_INSTALL_PACKAGES | 64% |
| MOUNT_UNMOUNT_FILESYSTEMS | 74% | WRITE_SETTINGS | 64% |
| RECEIVE_BOOT_COMPLETED | 72% | RECORD_AUDIO | 61% |
| CHANGE_NETWORK_STATE | 70% | SYSTEM_ALERT_WINDOW | 60% |
| REQUEST_INSTALL_PACKAGES | 67% | MOUNT_UNMOUNT_FILESYSTEMS | 59% |
| RECORD_AUDIO | 66% | CHANGE_NETWORK_STATE | 58% |
| Attacks | API Calls | Malware | Benign |
|---|---|---|---|
| Telephone | Android/telephony/TelephonyManager | 87% | 46% |
| Location | Android/telephony/gsm/GsmCellLocation | 62% | 34% |
| Android/location/Address | 80% | 38% | |
| Android/location/Location | 80% | 39% | |
| Android/location/LocationManager | 77% | 39% | |
| Camera | Android/hardware/Camera | 57% | 29% |
| Storage | Android/os/Environment | 90% | 45% |
| Android/content/Context/getExternalFilesDir | 75% | 36% | |
| Java/Io/Bytearrayoutputstream | 94% | 47% |
| Malware | Benign | ||
|---|---|---|---|
| Opcode | % | Opcode | % |
| const/16 | 100% | const-wide/16 | 100% |
| const/4 | 100% | const/16 | 100% |
| goto | 100% | const/4 | 100% |
| if-eqz | 100% | goto | 100% |
| if-nez | 100% | if-eqz | 100% |
| invoke-direct | 100% | if-nez | 100% |
| invoke-static | 100% | invoke-direct | 100% |
| invoke-super | 100% | invoke-static | 100% |
| invoke-virtual | 100% | invoke-super | 100% |
| move-exception | 100% | invoke-virtual | 100% |
| move-result | 100% | move-exception | 100% |
| move-result-object | 100% | move-result | 100% |
| new-array | 100% | move-result-object | 100% |
| new-instance | 100% | new-array | 100% |
| return-object | 100% | new-instance | 100% |
| return-void | 100% | return-void | 100% |
| sget-object | 100% | sget-object | 100% |
| sput-object | 100% | sput-object | 100% |
| aput-object | 100% | throw | 100% |
| const-wide/16 | 100% | move-object | 100% |
| No. | Algorithm | Accuracy | Precision | Recall | F1-Score | ||||
|---|---|---|---|---|---|---|---|---|---|
| Ours | OmniDroid | Ours | OmniDroid | Ours | OmniDroid | Ours | OmniDroid | ||
| 1 | ET | 0.930 | 0.901 | 0.947 | 0.896 | 0.917 | 0.907 | 0.932 | 0.902 |
| 2 | GBDT | 0.911 | 0.899 | 0.928 | 0.905 | 0.898 | 0.892 | 0.913 | 0.898 |
| 3 | DT | 0.904 | 0.883 | 0.911 | 0.886 | 0.903 | 0.879 | 0.908 | 0.882 |
| 4 | Chi2 | 0.914 | 0.902 | 0.929 | 0.893 | 0.903 | 0.913 | 0.916 | 0.903 |
| 5 | GA | 0.935 | 0.920 | 0.944 | 0.922 | 0.931 | 0.916 | 0.937 | 0.919 |
| 6 | SVM-RFE | 0.923 | 0.883 | 0.938 | 0.874 | 0.927 | 0.895 | 0.925 | 0.884 |
| 7 | MI | 0.918 | 0.865 | 0.951 | 0.863 | 0.889 | 0.867 | 0.919 | 0.865 |
| 8 | NS | 0.873 | 0.844 | 0.905 | 0.851 | 0.843 | 0.835 | 0.873 | 0.843 |
| 9 | Intersection | 0.788 | 0.809 | 0.744 | 0.758 | 0.903 | 0.908 | 0.815 | 0.882 |
| 10 | Union | 0.959 | 0.934 | 0.967 | 0.941 | 0.954 | 0.926 | 0.960 | 0.933 |
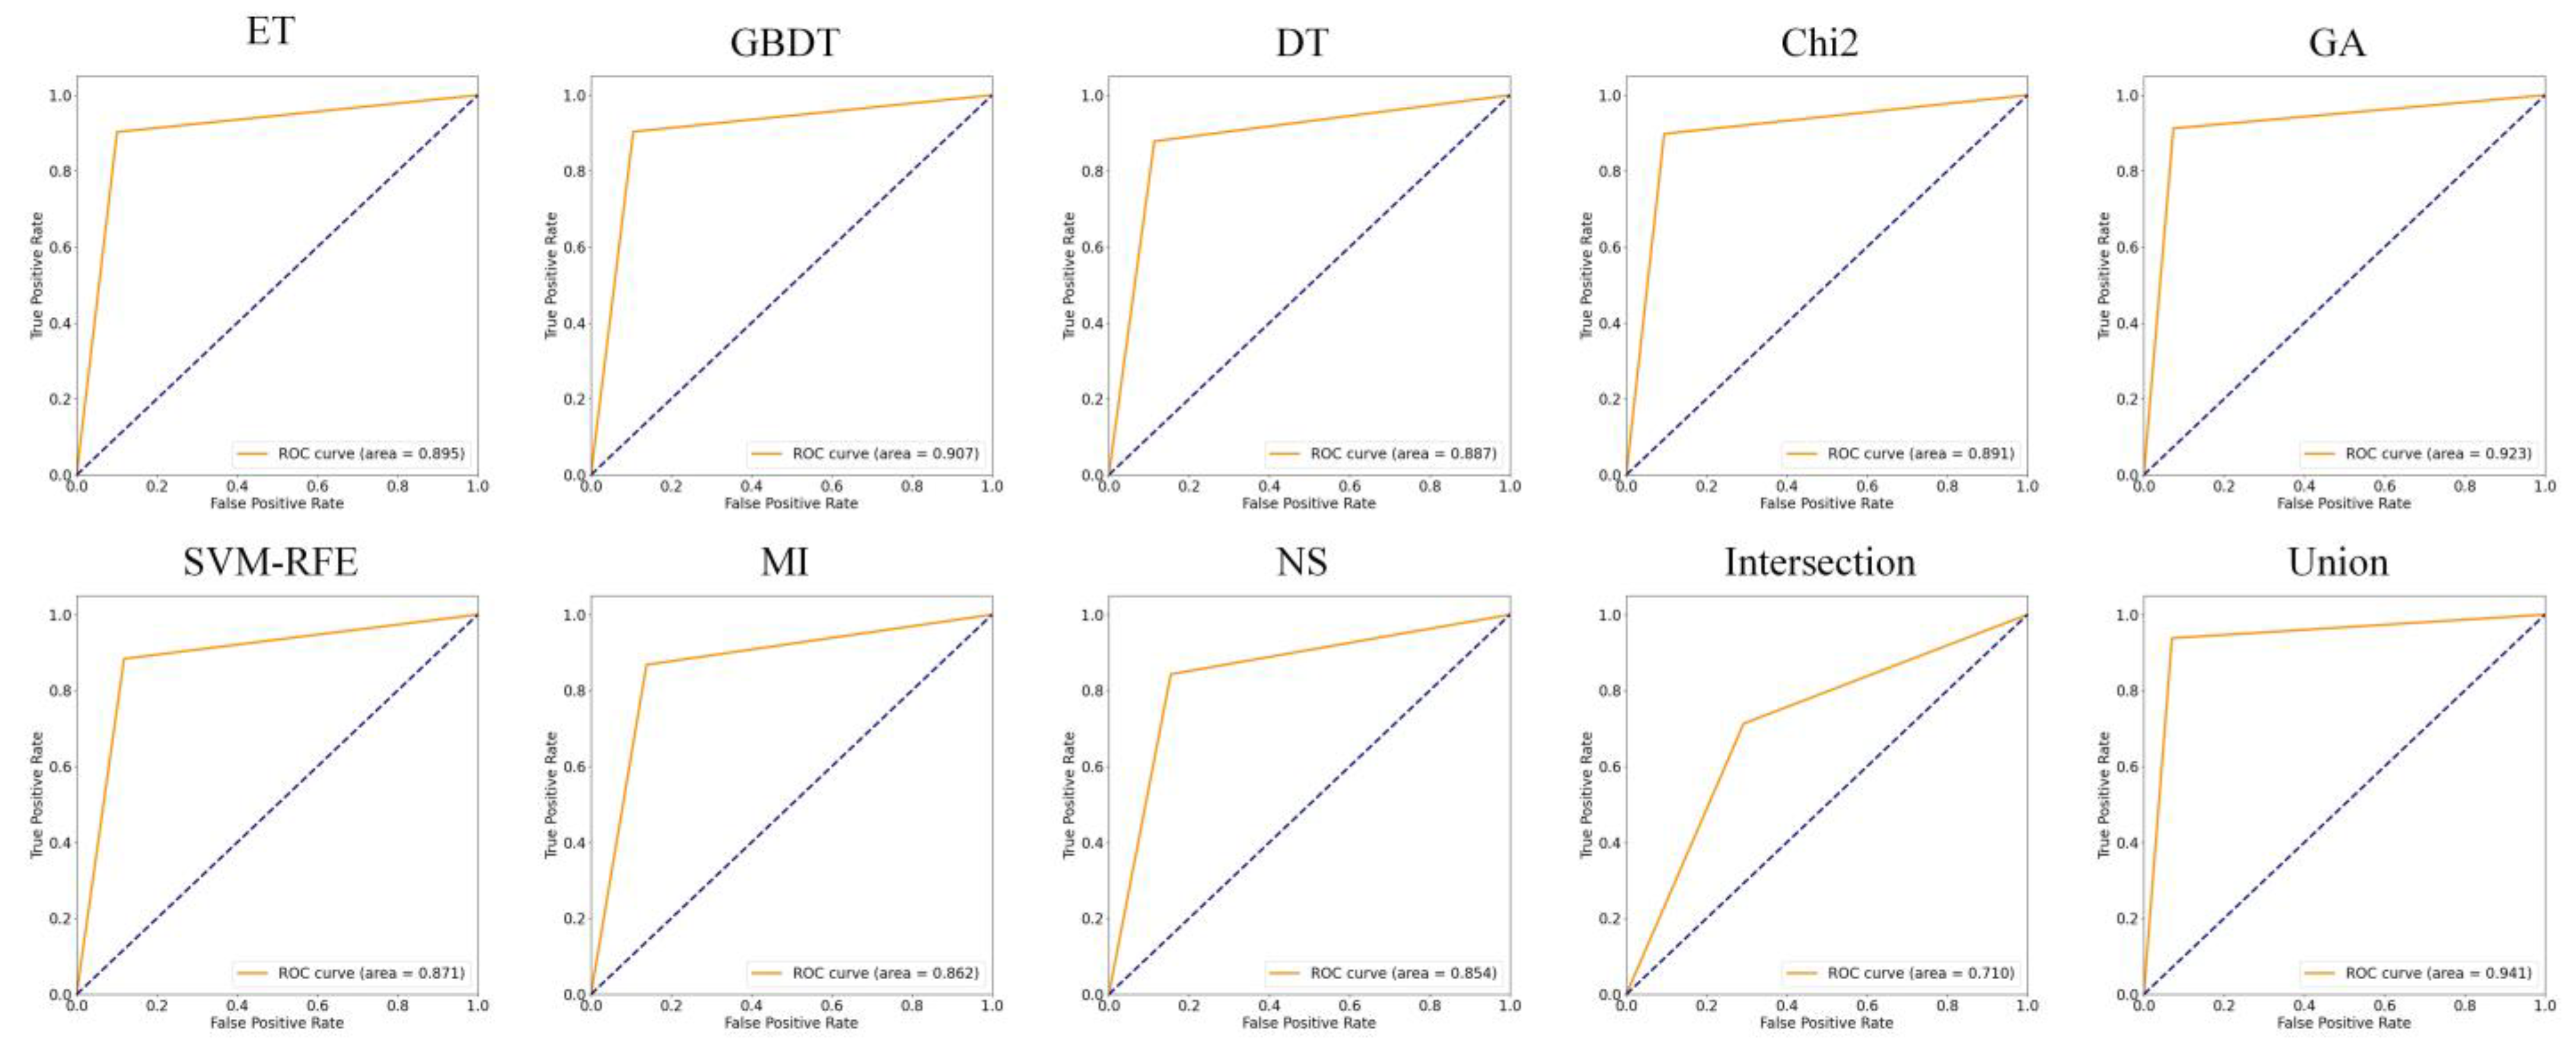
| No. | Model | Accuracy | Precision | Recall | F1-Score |
|---|---|---|---|---|---|
| 1 | SVM | 0.908 | 0.924 | 0.898 | 0.911 |
| 2 | GBDT | 0.880 | 0.881 | 0.889 | 0.886 |
| 3 | XGBoost | 0.911 | 0.916 | 0.912 | 0.914 |
| 4 | LightGBM | 0.921 | 0.922 | 0.926 | 0.924 |
| 5 | CatBoost | 0.928 | 0.935 | 0.926 | 0.930 |
| 6 | MFDroid | 0.959 | 0.967 | 0.954 | 0.960 |
Publisher’s Note: MDPI stays neutral with regard to jurisdictional claims in published maps and institutional affiliations. |
© 2022 by the authors. Licensee MDPI, Basel, Switzerland. This article is an open access article distributed under the terms and conditions of the Creative Commons Attribution (CC BY) license (https://creativecommons.org/licenses/by/4.0/).
Share and Cite
Wang, X.; Zhang, L.; Zhao, K.; Ding, X.; Yu, M. MFDroid: A Stacking Ensemble Learning Framework for Android Malware Detection. Sensors 2022, 22, 2597. https://doi.org/10.3390/s22072597
Wang X, Zhang L, Zhao K, Ding X, Yu M. MFDroid: A Stacking Ensemble Learning Framework for Android Malware Detection. Sensors. 2022; 22(7):2597. https://doi.org/10.3390/s22072597
Chicago/Turabian StyleWang, Xusheng, Linlin Zhang, Kai Zhao, Xuhui Ding, and Mingming Yu. 2022. "MFDroid: A Stacking Ensemble Learning Framework for Android Malware Detection" Sensors 22, no. 7: 2597. https://doi.org/10.3390/s22072597