
Equivalent Circuit Model Extraction for a SAW Resonator: Below and above Room Temperature

 , , , and
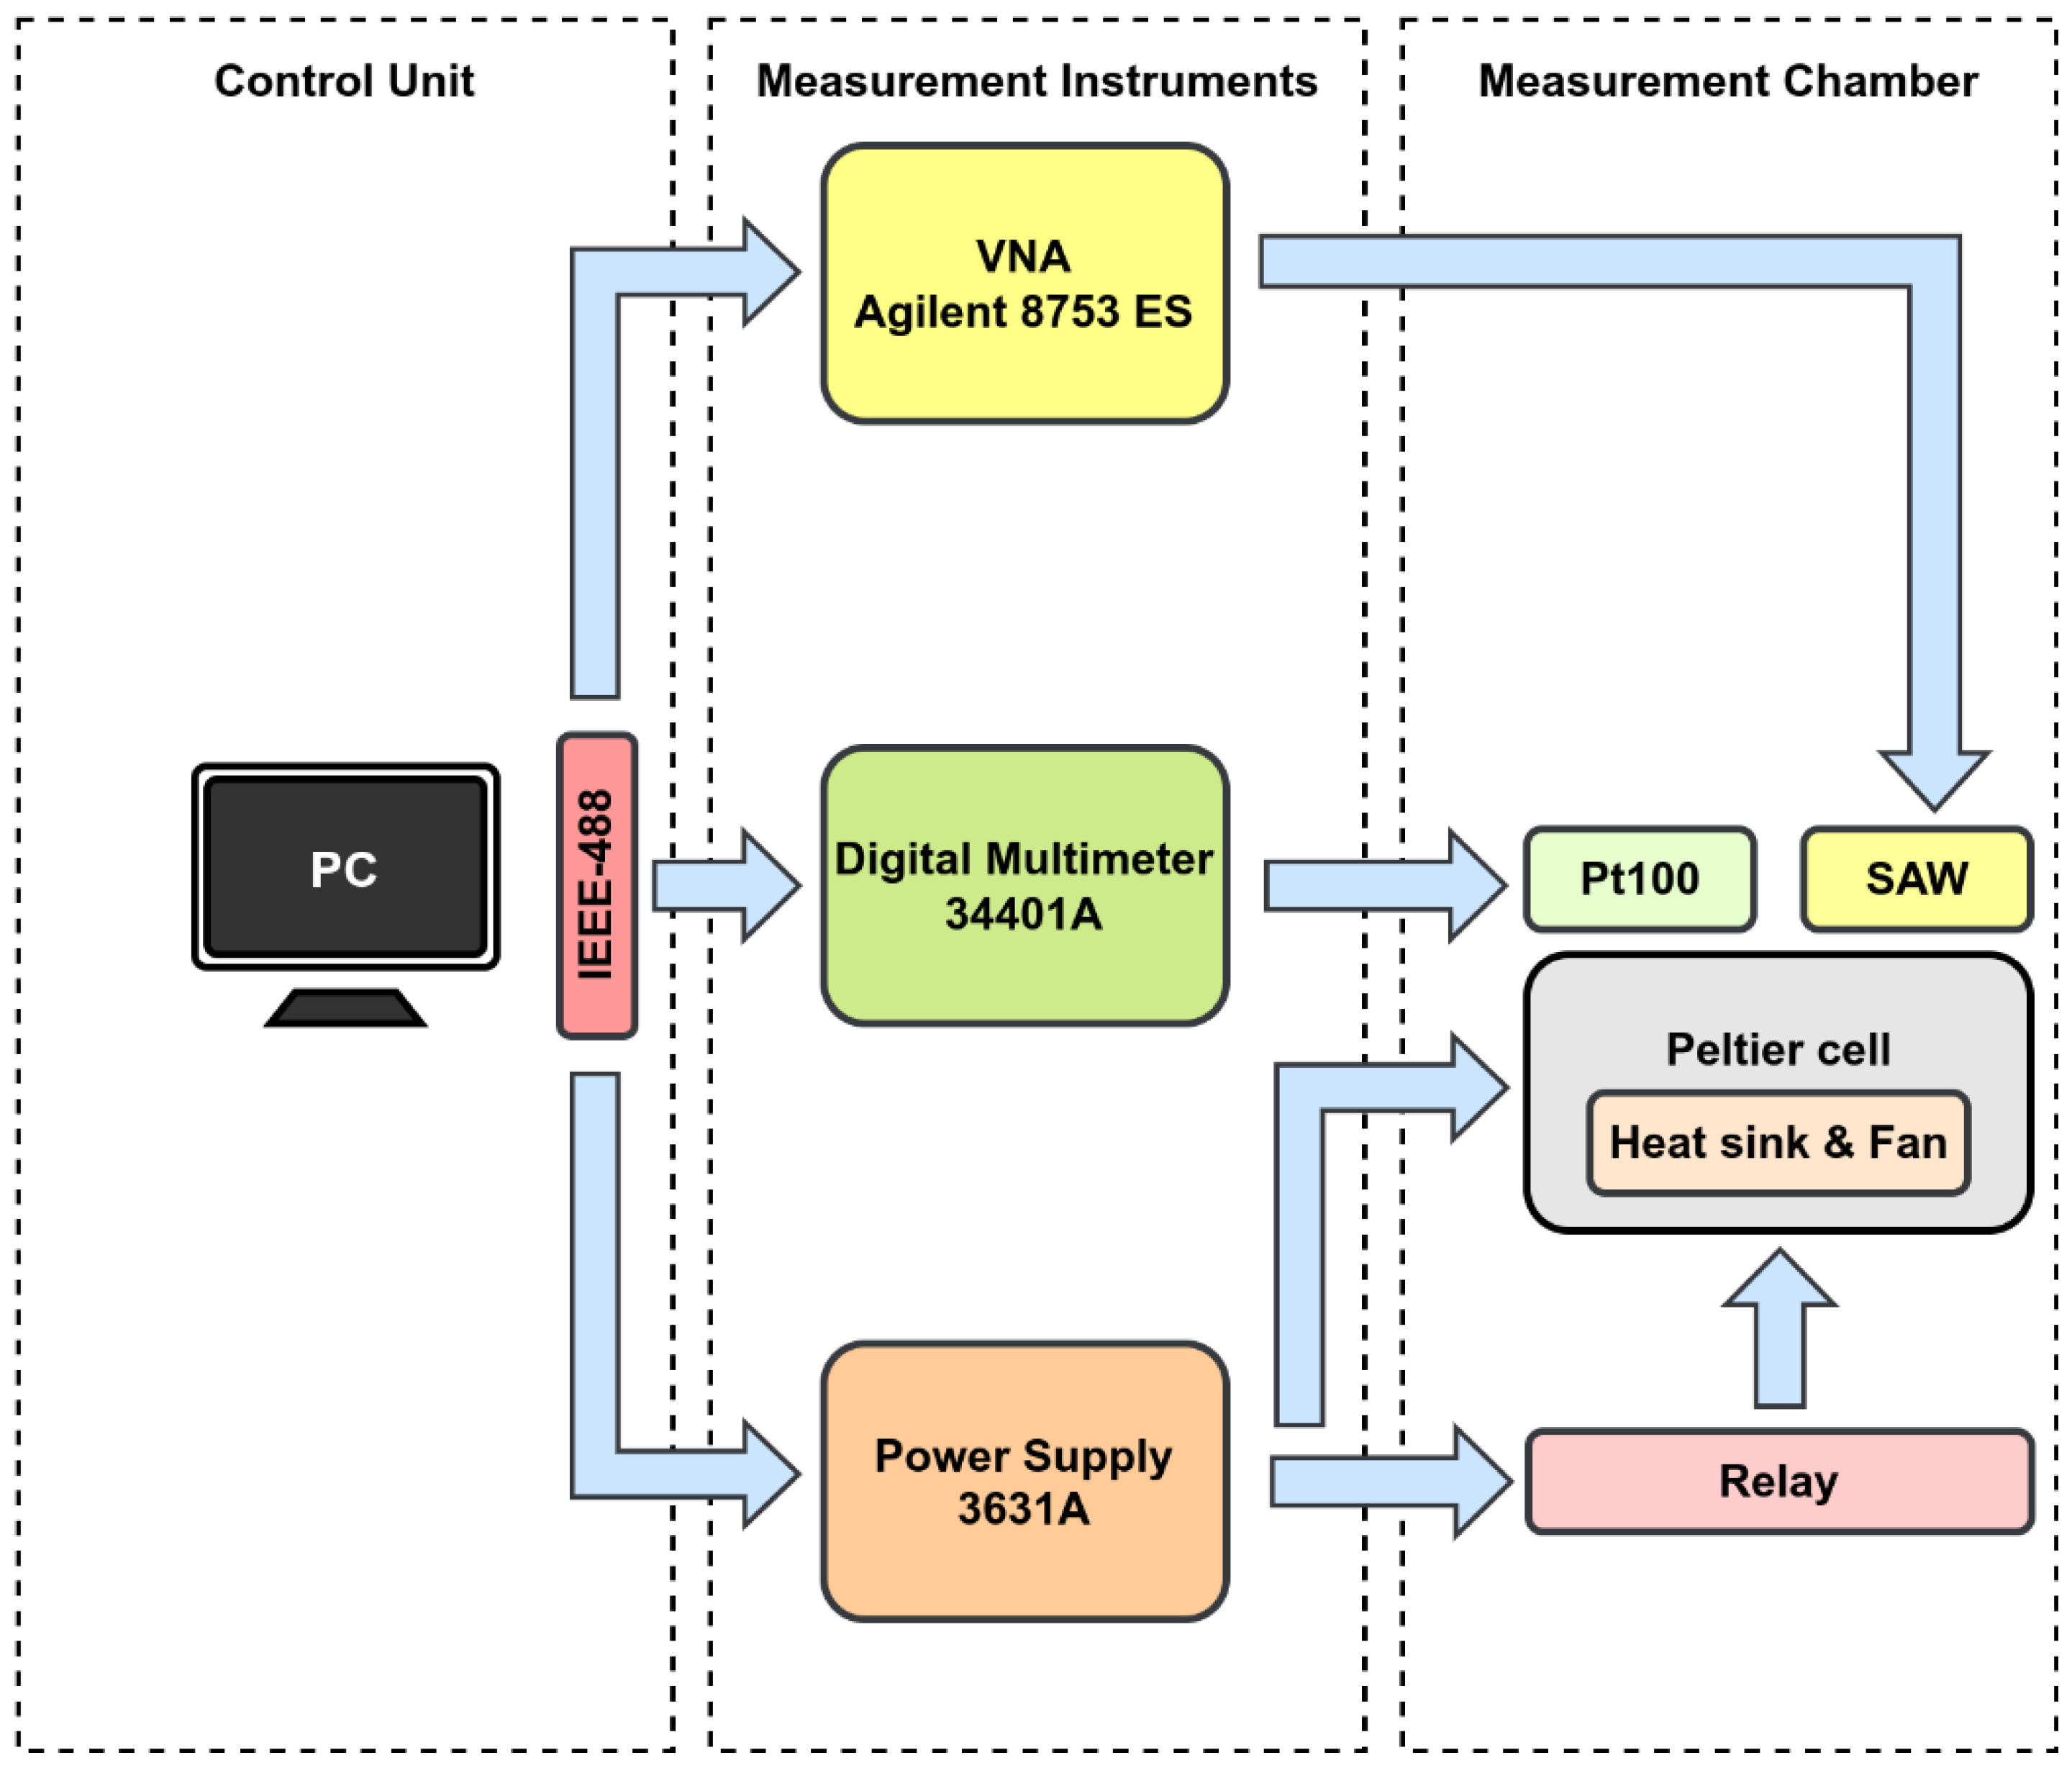
Abstract
:1. Introduction
2. Materials and Methods
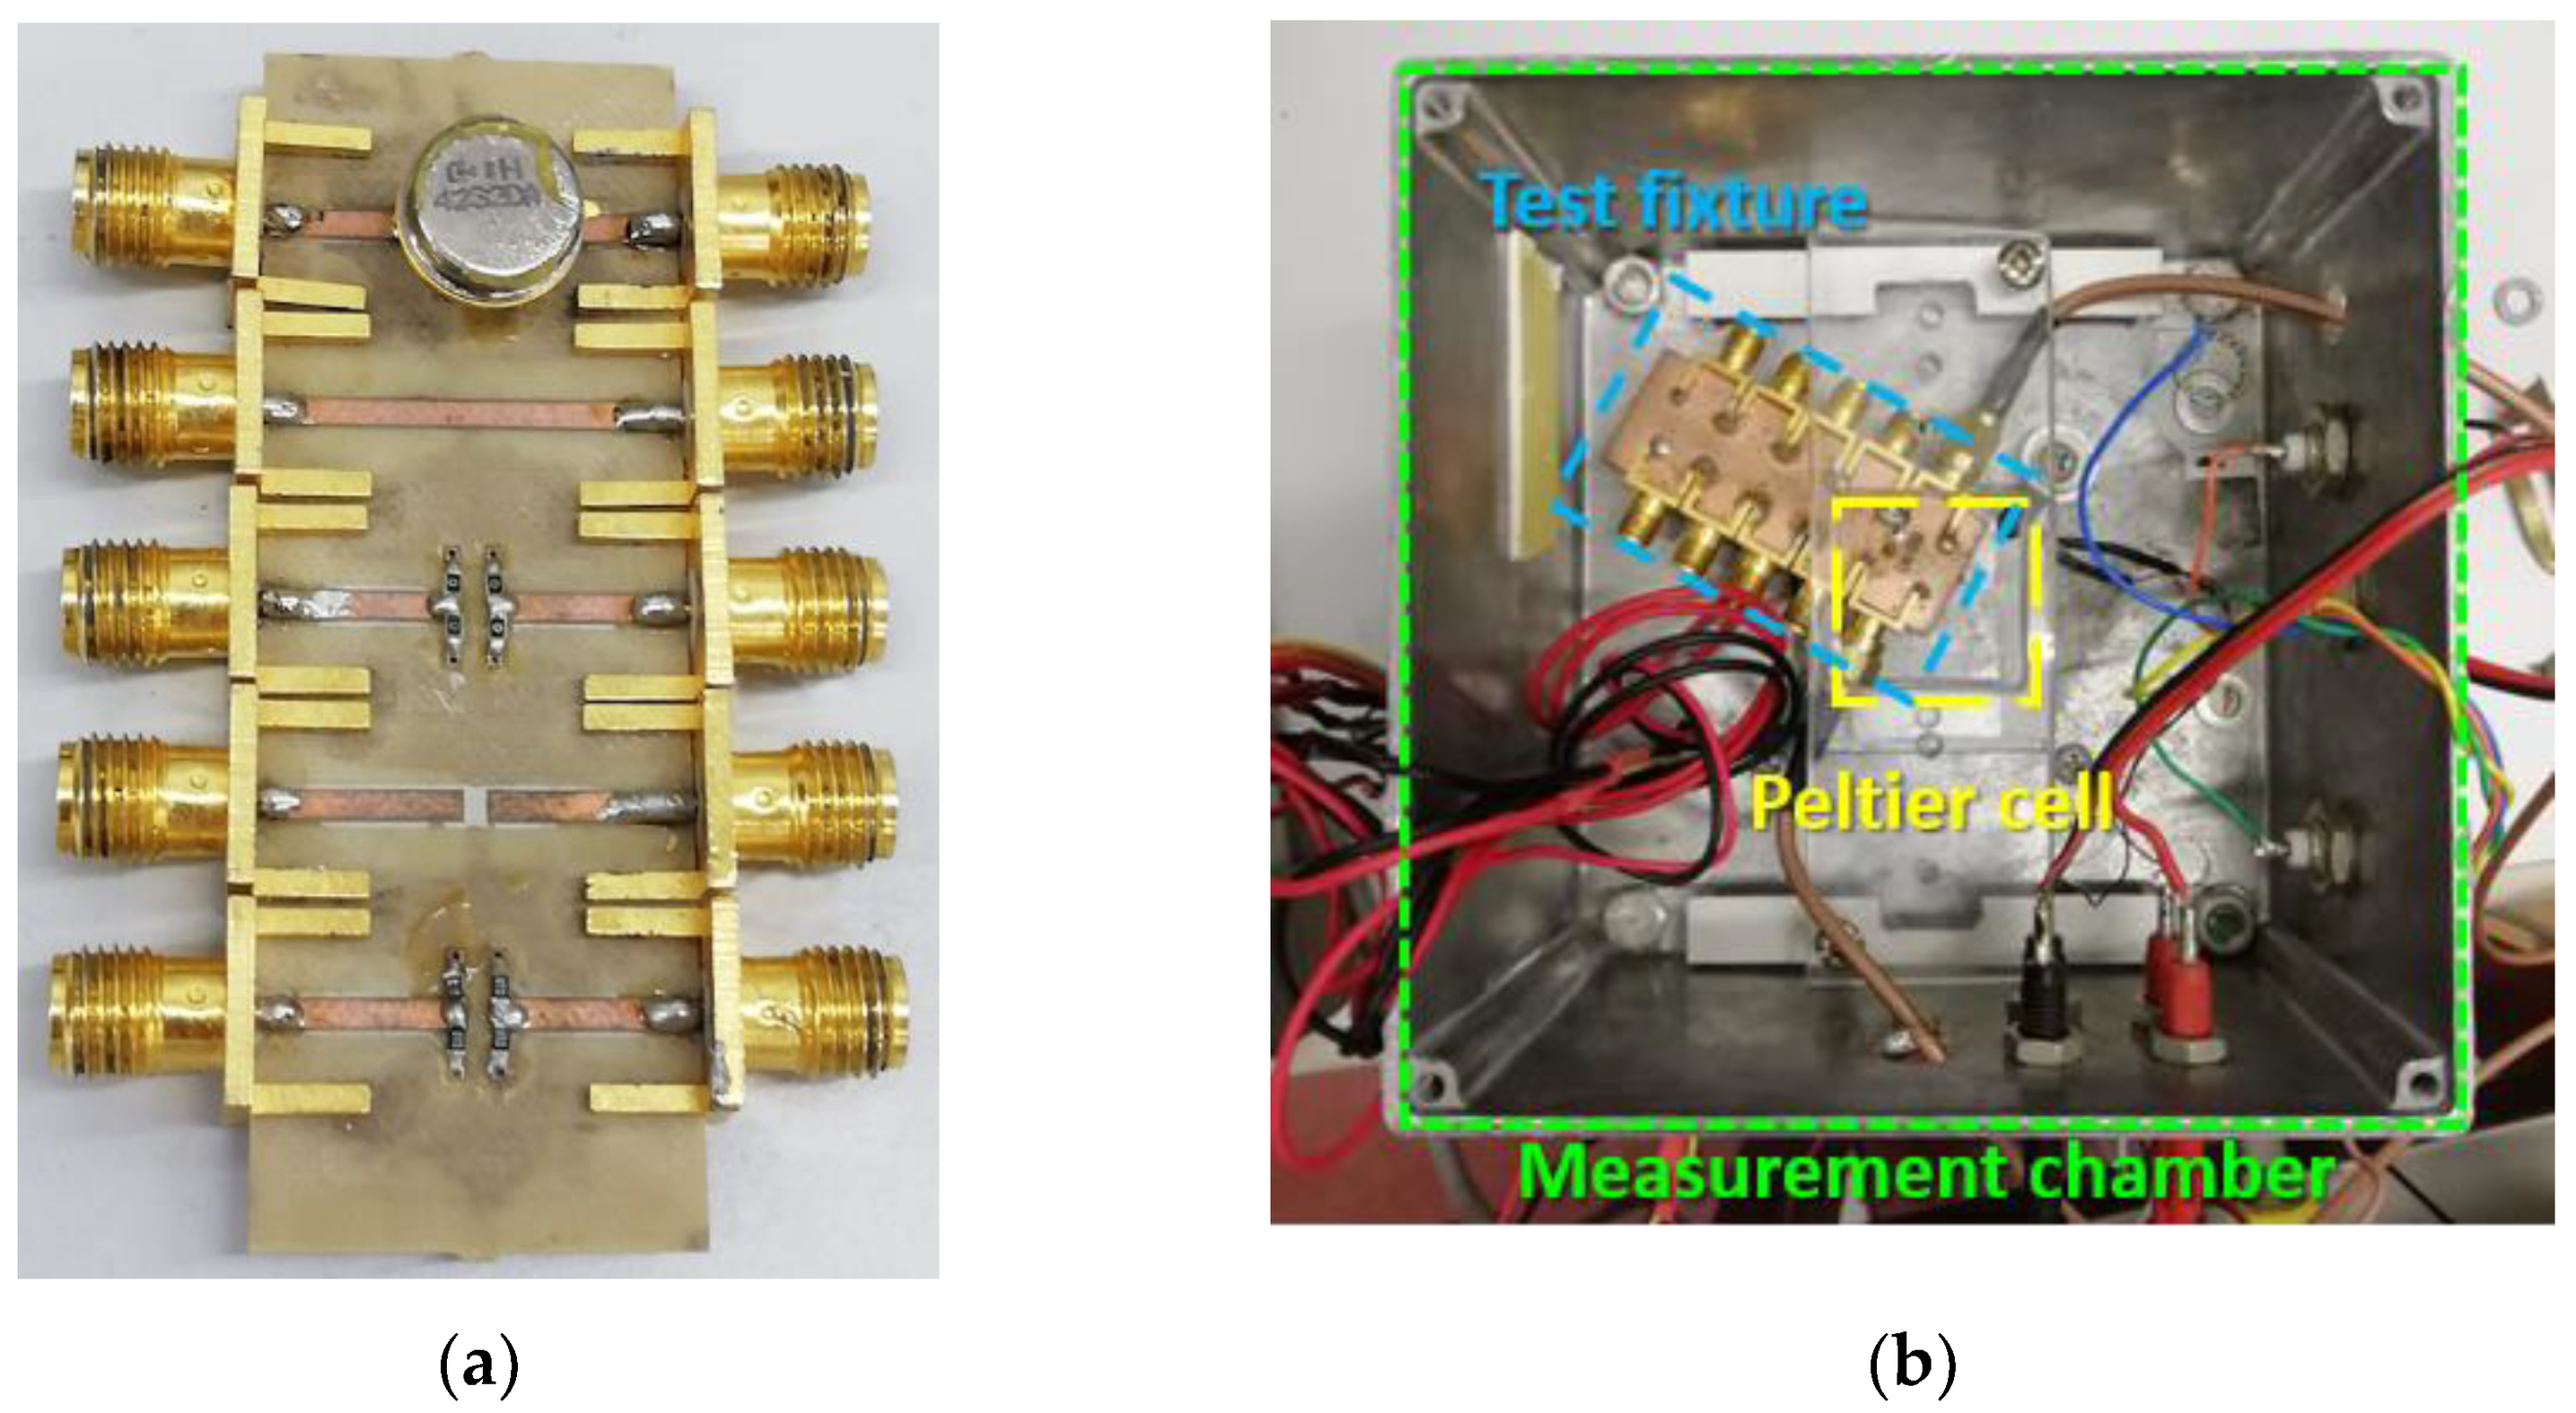
2.1. Measurement Setup
- Measurement chamber: It includes a Peltier cell and a Pt100 thermoresistance, used for the temperature actuation and control, and a polarity-reversal relay. It is also equipped with all the connections needed by the device under test.
- Measurement instruments: These include all the instrumentation involved in the measurement process. The Agilent E3631A power supply is used to provide the supply voltage to the Peltier cell and its cooling fan. The Agilent 34401A digital multimeter is used to measure the Pt100 resistance and convert it into a temperature unit as a feedback signal for the control system. Finally, the Agilent 8753ES VNA is employed for the electrical characterization, in terms of Y- parameters, of the microwave device under test.
- Control system unit: Each measurement instrument included in the control chain loop is connected to a desktop PC that acts as a central control unit. It represents the third and last part of the measurement system. Through the IEEE 488.2 GPIB interface, the PC is able to set the right power supply for the Peltier cell and acquire the Pt100 resistance value and the S- parameters from the VNA. In addition, a custom-developed software allows not only the real-time data acquisition and processing, but also allows saving measurements on files for post-processing analysis.
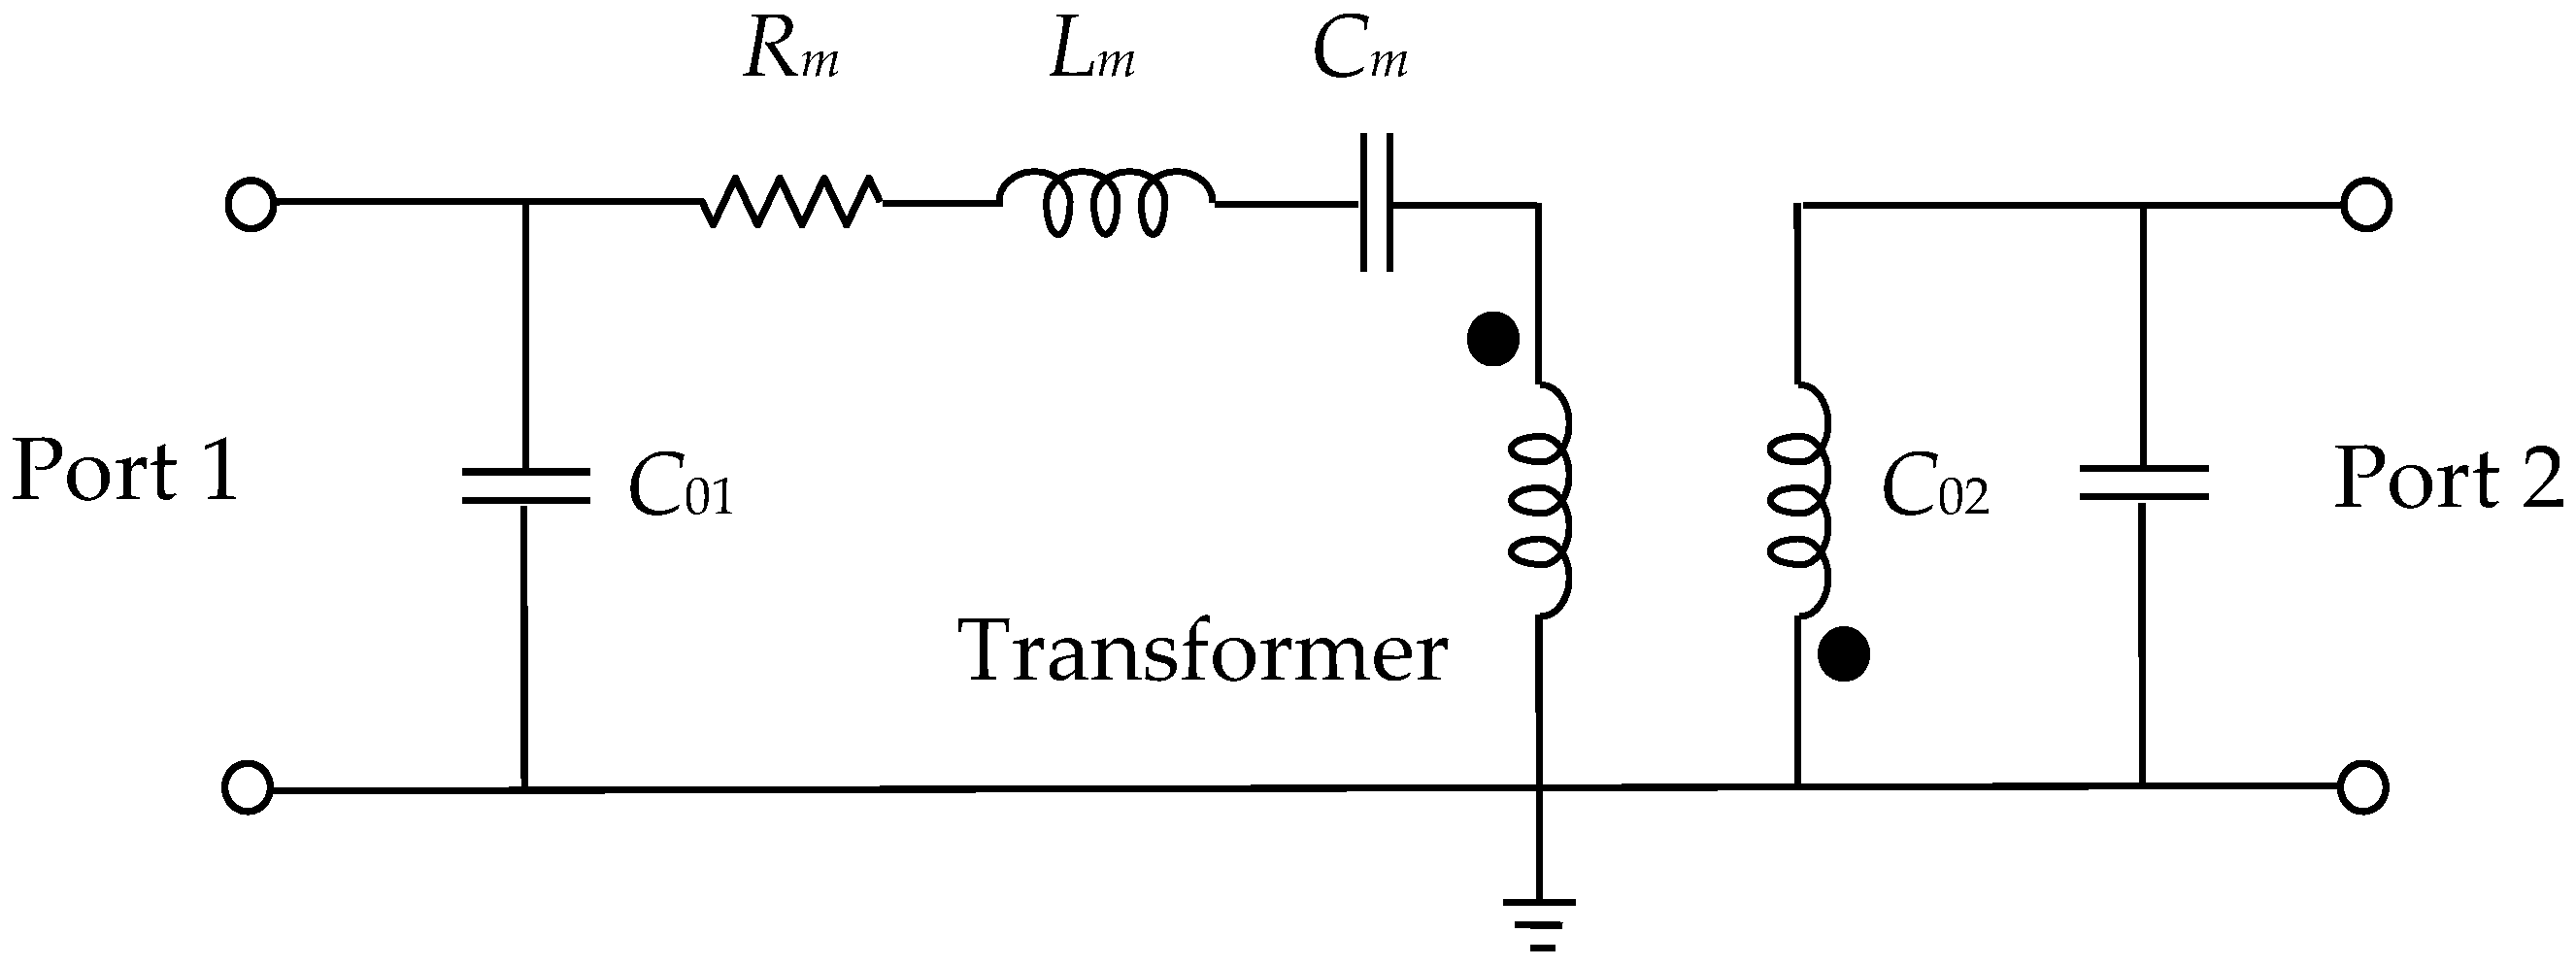
2.2. Equivalent-Circuit Model
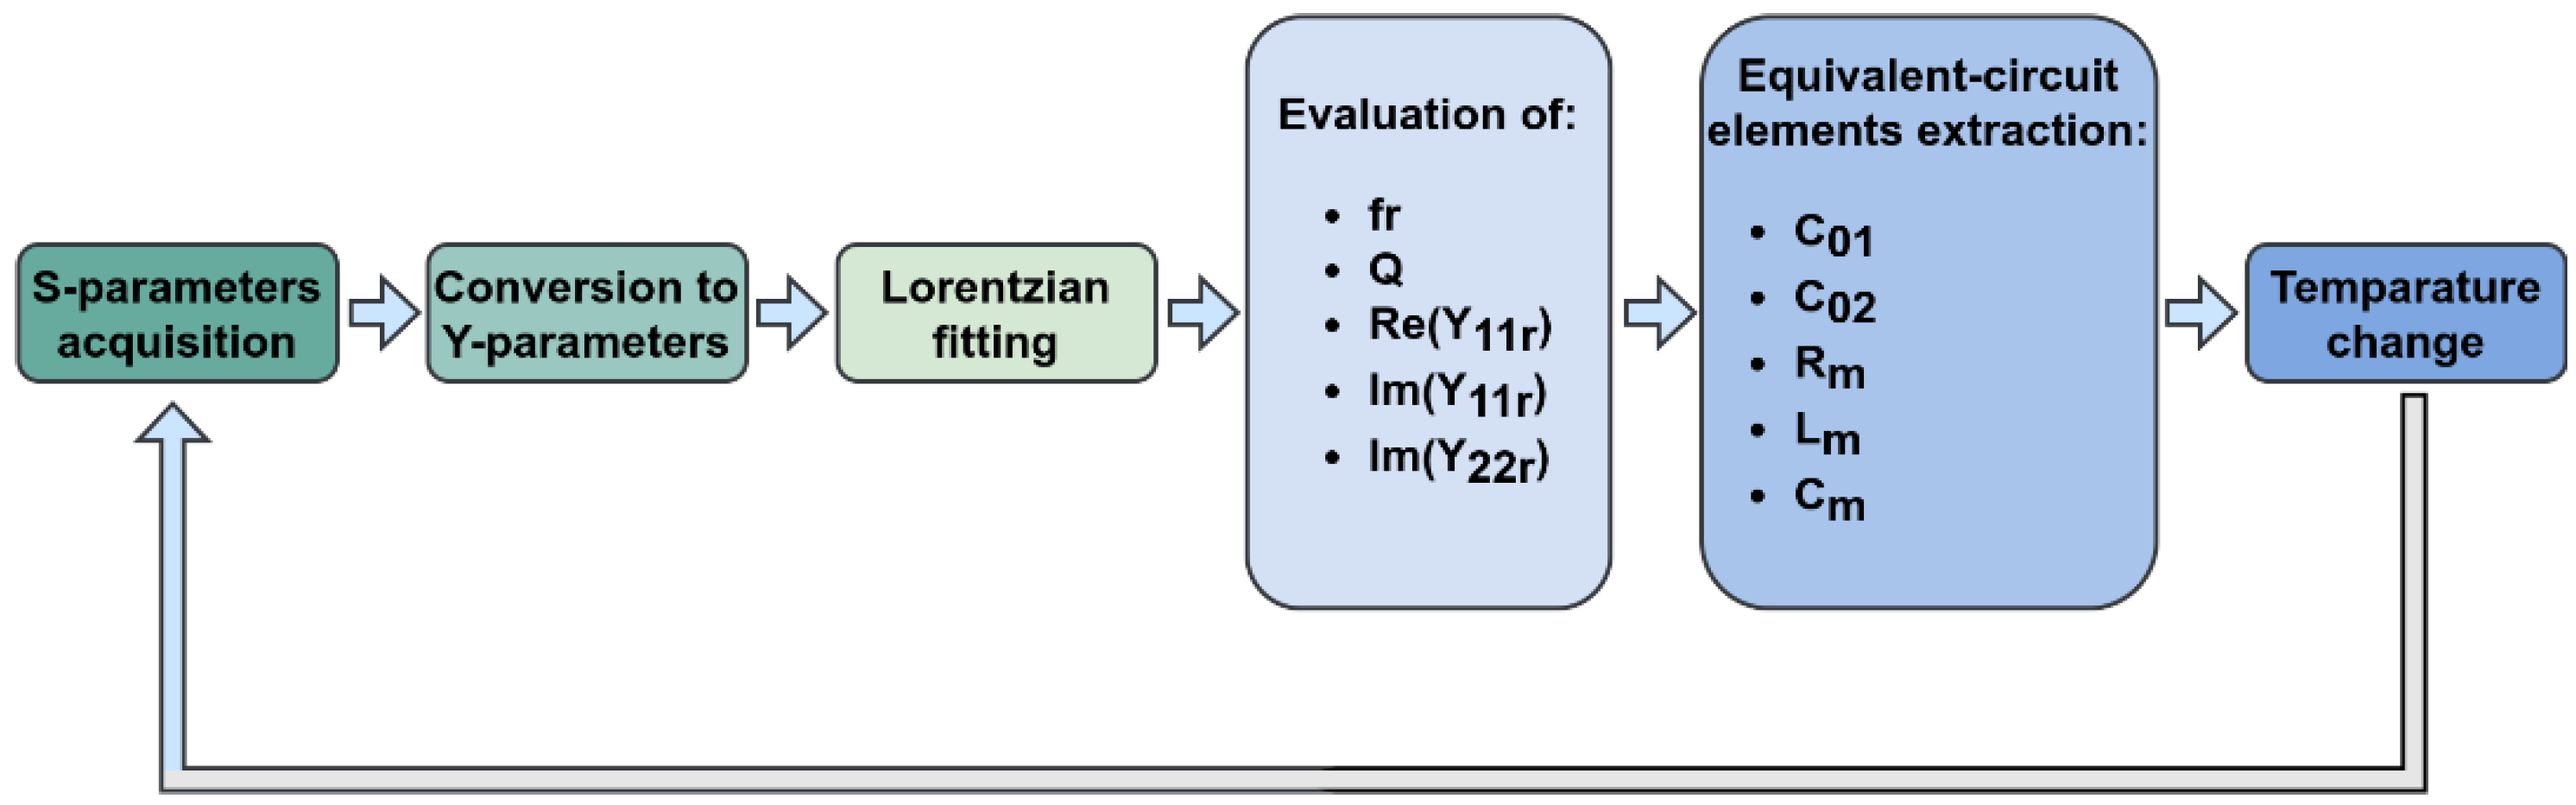
2.3. Equivalent-Circuit Parameter Extraction
3. Results and Discussion
4. Conclusions
Author Contributions
Funding
Institutional Review Board Statement
Informed Consent Statement
Data Availability Statement
Conflicts of Interest
References
- Rayleigh, L. On Waves Propagated along the Plane Surface of an Elastic Solid. Proc. Lond. Math. Soc. 1885, S1–17, 4–11. [Google Scholar] [CrossRef]
- White, R.M.; Voltmer, F.W. Direct Piezoelectric Coupling to Surface Elastic Waves. Appl. Phys. Lett. 1965, 7, 314–316. [Google Scholar] [CrossRef]
- Yasuhara, Y.; Yamaji, N.; Kurokawa, T.; Takahashi, K. Surface Acoustic Wave Devices for Consumer Use. IEEE Trans. Consum. Electron. 1982, CE-28, 475–481. [Google Scholar] [CrossRef]
- Kalinin, V. Wireless Physical SAW Sensors for Automotive Applications. In Proceedings of the 2011 IEEE International Ultrasonics Symposium, Orlando, FL, USA, 18–21 October 2011; pp. 212–221. [Google Scholar]
- Lu, X.; Galipeau, J.; Mouthaan, K.; Briot, E.H.; Abbott, B. Reconfigurable Multiband SAW Filters for LTE Applications. In Proceedings of the 2013 IEEE Radio and Wireless Symposium, Austin, TX, USA, 20–23 January 2013; pp. 253–255. [Google Scholar]
- Jeng, M.-J.; Sharma, M.; Li, Y.-C.; Lu, Y.-C.; Yu, C.-Y.; Tsai, C.-L.; Huang, S.-F.; Chang, L.-B.; Lai, C.-S. Surface Acoustic Wave Sensor for C-Reactive Protein Detection. Sensors 2020, 20, 6640. [Google Scholar] [CrossRef]
- Zou, L.; McLeod, C.; Bahmanyar, M.R. Wireless Interrogation of Implantable SAW Sensors. IEEE Trans. Biomed. Eng. 2020, 67, 1409–1417. [Google Scholar] [CrossRef]
- Wilson, W.C.; Malocha, D.C.; Kozlovski, N.; Gallagher, D.R.; Fisher, B.; Pavlina, J.; Saldanha, N.; Puccio, D.; Atkinson, G.M. Orthogonal Frequency Coded SAW Sensors for Aerospace SHM Applications. IEEE Sens. J. 2009, 9, 1546–1556. [Google Scholar] [CrossRef]
- Seifert, F.; Stocker, H.; Franz, O. The First SAW Based IFF System and Its Operation in Austrian Aerospace Defence. In Proceedings of the 2008 IEEE History of Telecommunications Conference, Paris, France, 11–12 September 2008; pp. 160–163. [Google Scholar]
- Scheiner, B.; Probst, F.; Michler, F.; Weigel, R.; Koelpin, A.; Lurz, F. Miniaturized Hybrid Frequency Reader for Contactless Measurement Scenarios Using Resonant Surface Acoustic Wave Sensors. Sensors 2021, 21, 2367. [Google Scholar] [CrossRef] [PubMed]
- Hage-Ali, S. Surface Acoustic Wave Sensors for Industrial and Biomedical Applications. In Proceedings of the 2020 Global Congress on Electrical Engineering (GC-ElecEng), Valencia, Spain, 4–6 September 2020; p. XXII. [Google Scholar]
- Moutoulas, E.; Hamidullah, M.; Prodromakis, T. Surface Acoustic Wave Resonators for Wireless Sensor Network Applications in the 433.92 MHz ISM Band. Sensors 2020, 20, 4294. [Google Scholar] [CrossRef]
- Aubert, T.; Elmazria, O.; Assouar, M.B. Wireless and Batteryless Surface Acoustic Wave Sensors for High Temperature Environments. In Proceedings of the 2009 9th International Conference on Electronic Measurement & Instruments, Beijing, China, 16–19 August 2009; pp. 2-890–2-898. [Google Scholar]
- Hauser, R.; Fachberger, R.; Bruckner, G.; Smetana, W.; Reicher, R.; Stelzer, A.; Scheiblhofer, S.; Schuster, S. A Wireless SAW-Based Temperature Sensor for Harsh Environment. In Proceedings of the Proceedings of IEEE Sensors, Vienna, Austria, 24–27 October 2004; pp. 860–863. [Google Scholar]
- Bruckner, G.; Bardong, J. Wireless Readout of Multiple SAW Temperature Sensors. Sensors 2019, 19, 3077. [Google Scholar] [CrossRef] [Green Version]
- Nicolay, P.; Lenzhofer, M. A Wireless and Passive Low-Pressure Sensor. Sensors 2014, 14, 3065–3076. [Google Scholar] [CrossRef] [Green Version]
- Campobello, G.; Segreto, A.; Donato, N. A New Frequency Estimation Algorithm for IIoT Applications and Low-Cost Instrumentation. In Proceedings of the 2020 IEEE International Instrumentation and Measurement Technology Conference (I2MTC), Dubrovnik, Croatia, 25–28 May 2020; pp. 1–5. [Google Scholar]
- Campobello, G.; Cannatà, G.; Donato, N.; Galeano, M.; Serrano, S. An Accurate and Simple Frequency Estimation Method for Sensor Applications. In Sensors and Microsystems; Lecture Notes in Electrical Engineering; D’Amico, A., Di Natale, C., Mosiello, L., Zappa, G., Eds.; Springer: Boston, MA, USA, 2012; Volume 109. [Google Scholar] [CrossRef]
- Li, X.; Wang, W.; Fan, S.; Yin, Y.; Jia, Y.; Liang, Y.; Liu, M. Optimization of SAW Devices with LGS/Pt Structure for Sensing Temperature. Sensors 2020, 20, 2441. [Google Scholar] [CrossRef] [PubMed]
- Stroganov, K.; Kronidov, T.; Luylin, B.; Kalinin, V.; Plessky, V. SAW Temperature Sensors for Electric Power Transmission Lines. In Proceedings of the 2014 European Frequency and Time Forum (EFTF), Neuchatel, Switzerland, 23–26 June 2014; pp. 157–159. [Google Scholar]
- Kawalec, A.; Pasternak, M. A New High-Frequency Surface Acoustic Wave Sensor for Humidity Measurement. IEEE Trans. Instrum. Meas. 2008, 57, 2019–2023. [Google Scholar] [CrossRef]
- Binder, A.; Bruckner, G.; Schobernig, N.; Schmitt, D. Wireless Surface Acoustic Wave Pressure and Temperature Sensor with Unique Identification Based on LiNbO3. IEEE Sens. J. 2013, 13, 1801–1805. [Google Scholar] [CrossRef]
- Nicolay, P.; Chambon, H.; Bruckner, G.; Gruber, C.; Ballandras, S.; Courjon, E.; Stadler, M. A LN/Si-Based SAW Pressure Sensor. Sensors 2018, 18, 3482. [Google Scholar] [CrossRef] [PubMed] [Green Version]
- Cai, H.; Zhou, C.; Zhang, Y.; Yang, Y.; Ren, T.; Guo, C.; Liu, J. SAW Based Mass-Loading Biosensor for DNA Detection. In Proceedings of the 2013 IEEE International Conference of Electron Devices and Solid-State Circuits, Hong Kong, 3–5 June 2013; pp. 1–2. [Google Scholar]
- Šetka, M.; Bahos, F.A.; Matatagui, D.; Gràcia, I.; Figueras, E.; Drbohlavová, J.; Vallejos, S. Love Wave Sensors with Silver Modified Polypyrrole Nanoparticles for VOCs Monitoring. Sensors 2020, 20, 1432. [Google Scholar] [CrossRef] [PubMed] [Green Version]
- Gugliandolo, G.; Aloisio, D.; Leonardi, S.G.; Campobello, G.; Donato, N. Resonant Devices and Gas Sensing: From Low Frequencies to Microwave Range. In Proceedings of the 2019 14th International Conference on Advanced Technologies, Systems and Services in Telecommunications (TELSIKS), Nis, Serbia, 23–25 October 2019; pp. 21–28. [Google Scholar]
- Shu, L.; Jiang, T.; Xia, Y.; Wang, X.; Yan, D.; Wu, W. The Investigation of a SAW Oxygen Gas Sensor Operated at Room Temperature, Based on Nanostructured ZnxFeyO Films. Sensors 2019, 19, 3025. [Google Scholar] [CrossRef] [PubMed] [Green Version]
- Constantinoiu, I.; Viespe, C. Hydrogen Detection with SAW Polymer/Quantum Dots Sensitive Films. Sensors 2019, 19, 4481. [Google Scholar] [CrossRef] [Green Version]
- Gugliandolo, G.; Capra, P.P.; Campobello, G.; Donato, N. Cryogenic Characterization of SAW Resonators. In Proceedings of the 2019 14th International Conference on Advanced Technologies, Systems and Services in Telecommunications (TELSIKS), Nis, Serbia, 23–25 October 2019; pp. 311–314. [Google Scholar]
- Pereira da Cunha, M.; Maskay, A.; Lad, R.J.; Frankel, D.J.; Moulzolf, S.; Call, M.; Bernhardt, G. Pt-Ni/Pt-Zr Electrodes for Stable SAW Resonator Operation during Repeated Temperature Cycling up to 1000 °C. In Proceedings of the 2015 IEEE International Ultrasonics Symposium (IUS), Taipei, Taiwan, 21–24 October 2015; pp. 1–4. [Google Scholar]
- Marinkovic, Z.; Gugliandolo, G.; Campobello, G.; Crupi, G.; Donato, N. Application of Artificial Neural Networks for Modeling of the Frequency-Dependent Performance of Surface Acoustic Wave Resonators. In Proceedings of the 2021 56th International Scientific Conference on Information, Communication and Energy Systems and Technologies (ICEST), Sozopol, Bulgaria, 16–18 June 2021; pp. 145–148. [Google Scholar]
- Marinković, Z.; Gugliandolo, G.; Quattrocchi, A.; Crupi, G.; Donato, N. Neural Modeling of the Surface Acoustic Wave Resonator Admittance Parameters. In Proceedings of the 15th International Conference on Advanced Technologies, Systems and Services in Telecommunications, Nis, Serbia, 20–22 October 2021. [Google Scholar]
- Marinković, Z.; Gugliandolo, G.; Campobello, G.; Crupi, G.; Donato, N. Extraction of the Resonant Parameters for Surface Acoustic Wave Resonators: ANNs versus Lorentzian Fitting Method. In Proceedings of the IEEE 32nd International Conference on Microelectronics, Nis, Serbia, 12–14 September 2021. [Google Scholar]
- Crupi, G.; Gugliandolo, G.; Campobello, G.; Donato, N. Measurement-Based Extraction and Analysis of a Temperature-Dependent Equivalent-Circuit Model for a SAW Resonator: From Room Down to Cryogenic Temperatures. IEEE Sens. J. 2021, 21, 12202–12211. [Google Scholar] [CrossRef]
- Campobello, G.; Crupi, G.; Donato, N. Cryogenic Electrical Characterization and Equivalent-Circuit Modeling of SAW Resonators. In Proceedings of the 2020 IEEE International Instrumentation and Measurement Technology Conference (I2MTC), Dubrovnik, Croatia, 25–28 May 2020; pp. 1–5. [Google Scholar]
- Gugliandolo, G.; Marinković, Z.; Campobello, G.; Crupi, G.; Donato, N. On the Performance Evaluation of Commercial SAW Resonators by Means of a Direct and Reliable Equivalent-Circuit Extraction. Micromachines 2021, 12, 303. [Google Scholar] [CrossRef]
- SAW RP1298-2 Datasheet; Murata Electronics North America, Inc.: Tbilisi, GA, USA, 2015.
- SAR Series Datasheet, Saw Resonators Specifications: Features and Applications; Murata Electronics North America, Inc.: Tbilisi, GA, USA, 1999; pp. 53–54.
- Donato, N.; Aloisio, D. Development of a SOLT Calibration Setup for SAW Sensor Characterization. In Sensors and Microsystems; Lecture Notes in Electrical Engineering; Springer: Boston, MA, USA, 2012; Volume 19, pp. 265–269. [Google Scholar]
- Hashimoto, K. Surface Acoustic Wave Devices in Telecommunications; Springer: Berlin/Heidelberg, Germany, 2000; ISBN 978-3-642-08659-5. [Google Scholar]
- Kshetrimayum, R.; Yadava, R.D.S.; Tandon, R.P. Modeling Electrical Response of Polymer-Coated SAW Resonators by Equivalent Circuit Representation. Ultrasonics 2011, 51, 547–553. [Google Scholar] [CrossRef]
- Sisniega, B.; Gutiérrez, J.; Muto, V.; García-Arribas, A. Improved Determination of Q Quality Factor and Resonance Frequency in Sensors Based on the Magnetoelastic Resonance through the Fitting to Analytical Expressions. Materials 2020, 13, 4708. [Google Scholar] [CrossRef] [PubMed]
- Torokhtii, K.; Pompeo, N.; Silva, E.; Alimenti, A. Optimization of Q-factor and resonance frequency measurements in partially calibrated resonant systems. Meas. Sens. 2021, 18, 100314. [Google Scholar] [CrossRef]
- Torokhtii, K.; Alimenti, A.; Pompeo, N.; Silva, E. Estimation of microwave resonant measurements uncertainty from uncalibrated data. Acta IMEKO 2020, 9, 47. [Google Scholar] [CrossRef]
- Ramella, C.; Corbellini, S.; Pirola, M.; Yu, L.; Fernicola, V.C. Investigations on instability effects in a sapphire-based whispering gallery mode thermometer. In Proceedings of the 2017 IEEE International Instrumentation and Measurement Technology Conference (I2MTC), Turin, Italy, 22–25 May 2017; pp. 1–6. [Google Scholar] [CrossRef]
- Gugliandolo, G.; Tabandeh, S.; Rosso, L.; Smorgon, D.; Fernicola, V. Whispering Gallery Mode Resonators for Precision Temperature Metrology Applications. Sensors 2021, 21, 2844. [Google Scholar] [CrossRef] [PubMed]
- Donato, N.; Neri, G.; Leonardi, S.G.; Fusco, Z.; Tricoli, A. High Performance Flame-Made Ultraporous ZnO-Based QCM Sensor For Acetaldehyde. In Proceedings of the 2019 IEEE International Instrumentation and Measurement Technology Conference (I2MTC), Auckland, New Zealand, 22–23 May 2019; pp. 1–5. [Google Scholar] [CrossRef]


Publisher’s Note: MDPI stays neutral with regard to jurisdictional claims in published maps and institutional affiliations. |
© 2022 by the authors. Licensee MDPI, Basel, Switzerland. This article is an open access article distributed under the terms and conditions of the Creative Commons Attribution (CC BY) license (https://creativecommons.org/licenses/by/4.0/).
Share and Cite
Gugliandolo, G.; Marinković, Z.; Crupi, G.; Campobello, G.; Donato, N. Equivalent Circuit Model Extraction for a SAW Resonator: Below and above Room Temperature. Sensors 2022, 22, 2546. https://doi.org/10.3390/s22072546
Gugliandolo G, Marinković Z, Crupi G, Campobello G, Donato N. Equivalent Circuit Model Extraction for a SAW Resonator: Below and above Room Temperature. Sensors. 2022; 22(7):2546. https://doi.org/10.3390/s22072546
Chicago/Turabian StyleGugliandolo, Giovanni, Zlatica Marinković, Giovanni Crupi, Giuseppe Campobello, and Nicola Donato. 2022. "Equivalent Circuit Model Extraction for a SAW Resonator: Below and above Room Temperature" Sensors 22, no. 7: 2546. https://doi.org/10.3390/s22072546