
Force Sensing on Cells and Tissues by Atomic Force Microscopy

 ,
,  , , and
Abstract
:
1. Introduction
2. Materials and Methods
2.1. Sample Preparation
2.1.1. Human Tissues
2.1.2. Decellularized Extracellular Matrices
2.1.3. Cells
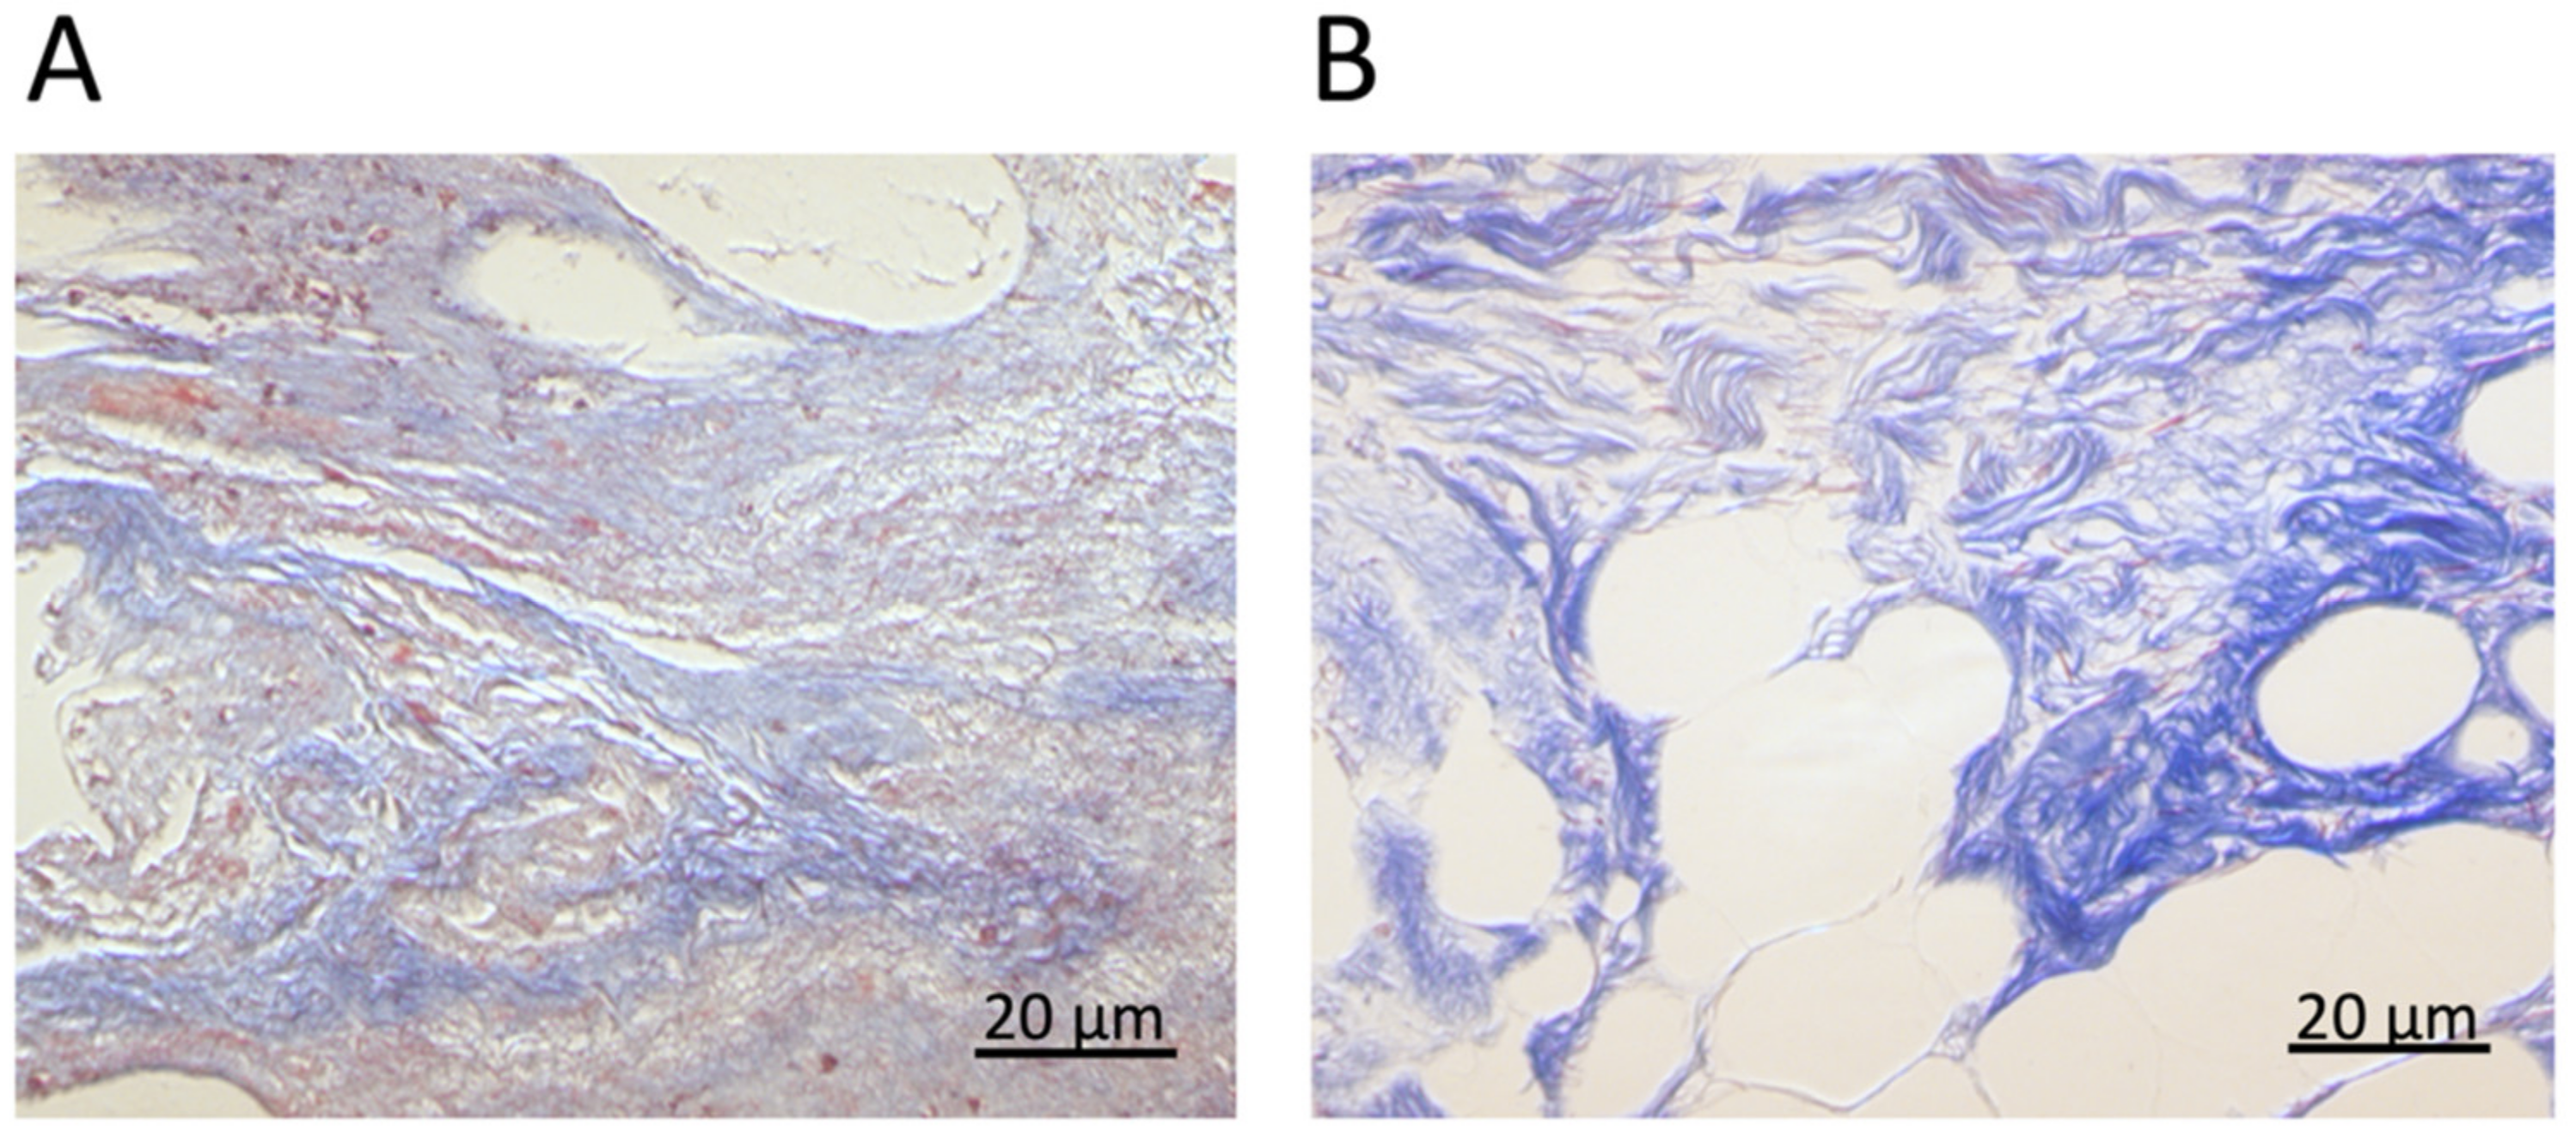
2.2. Histochemistry
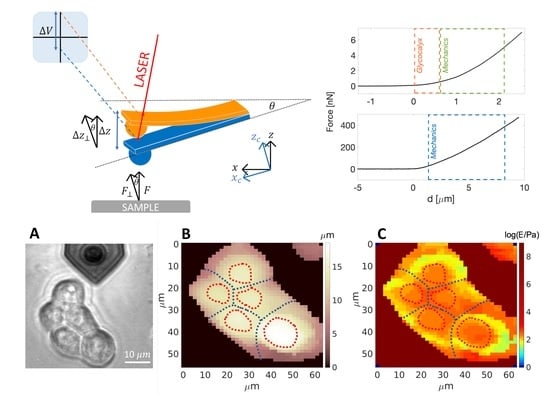
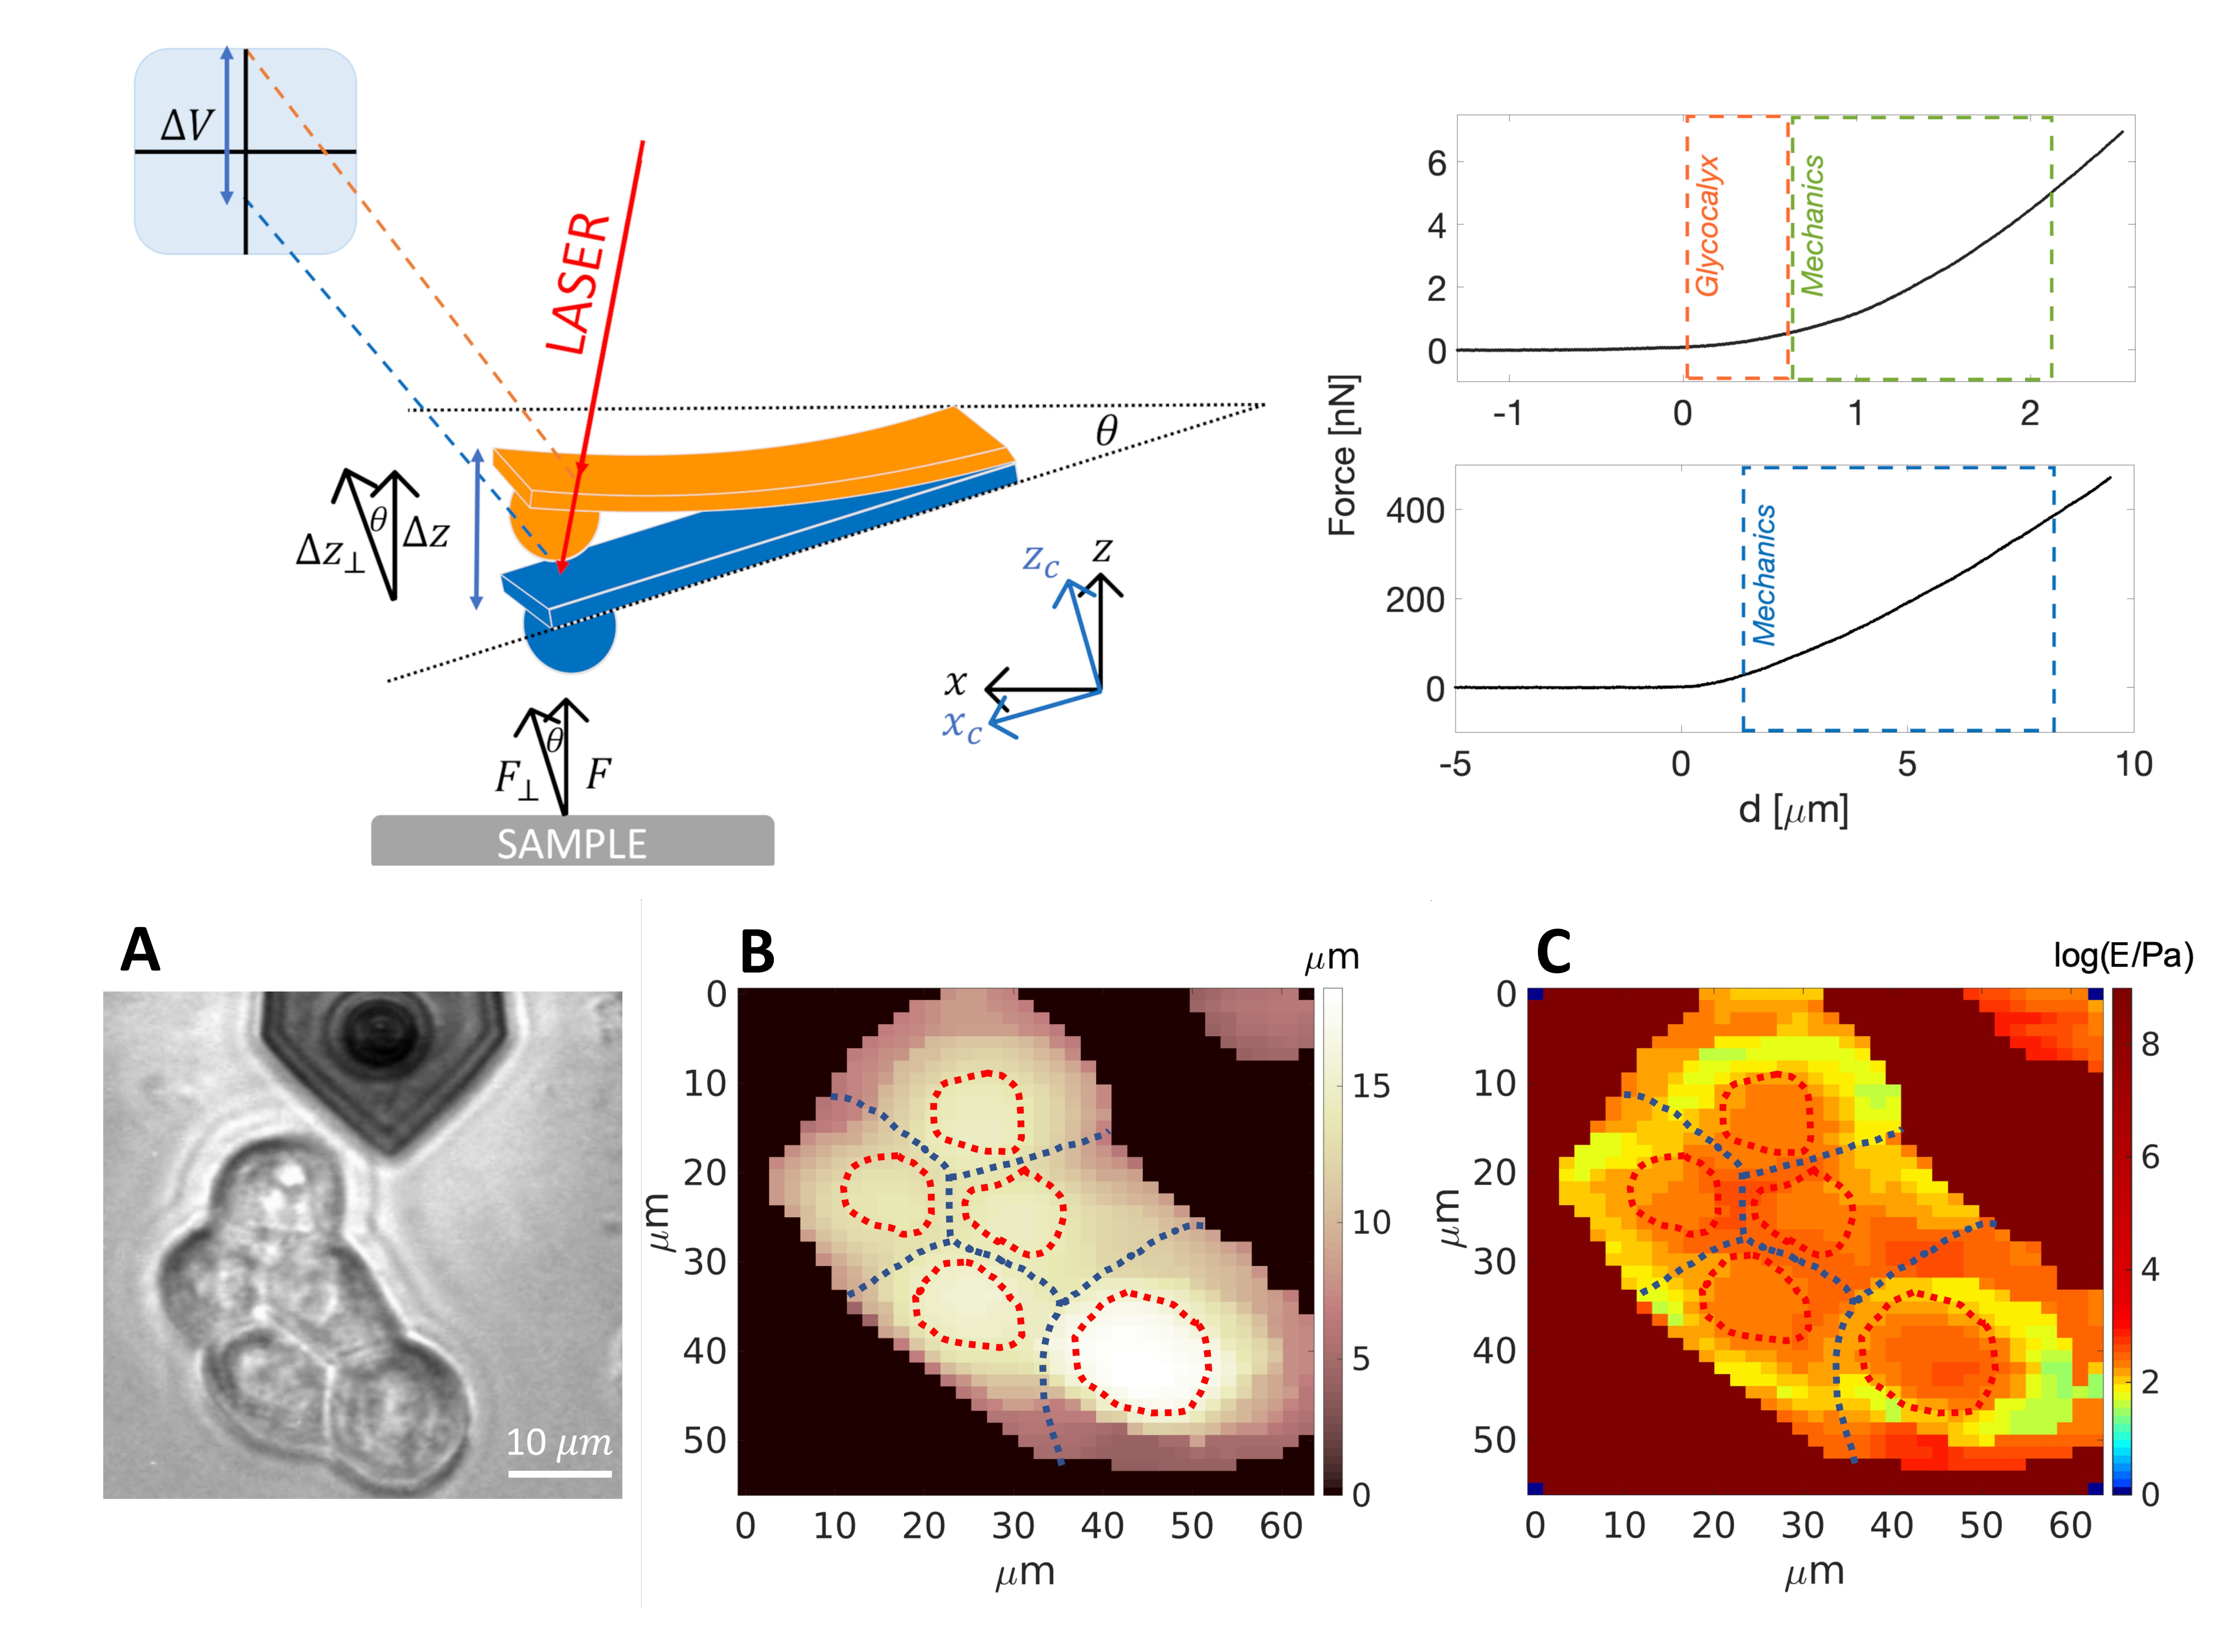
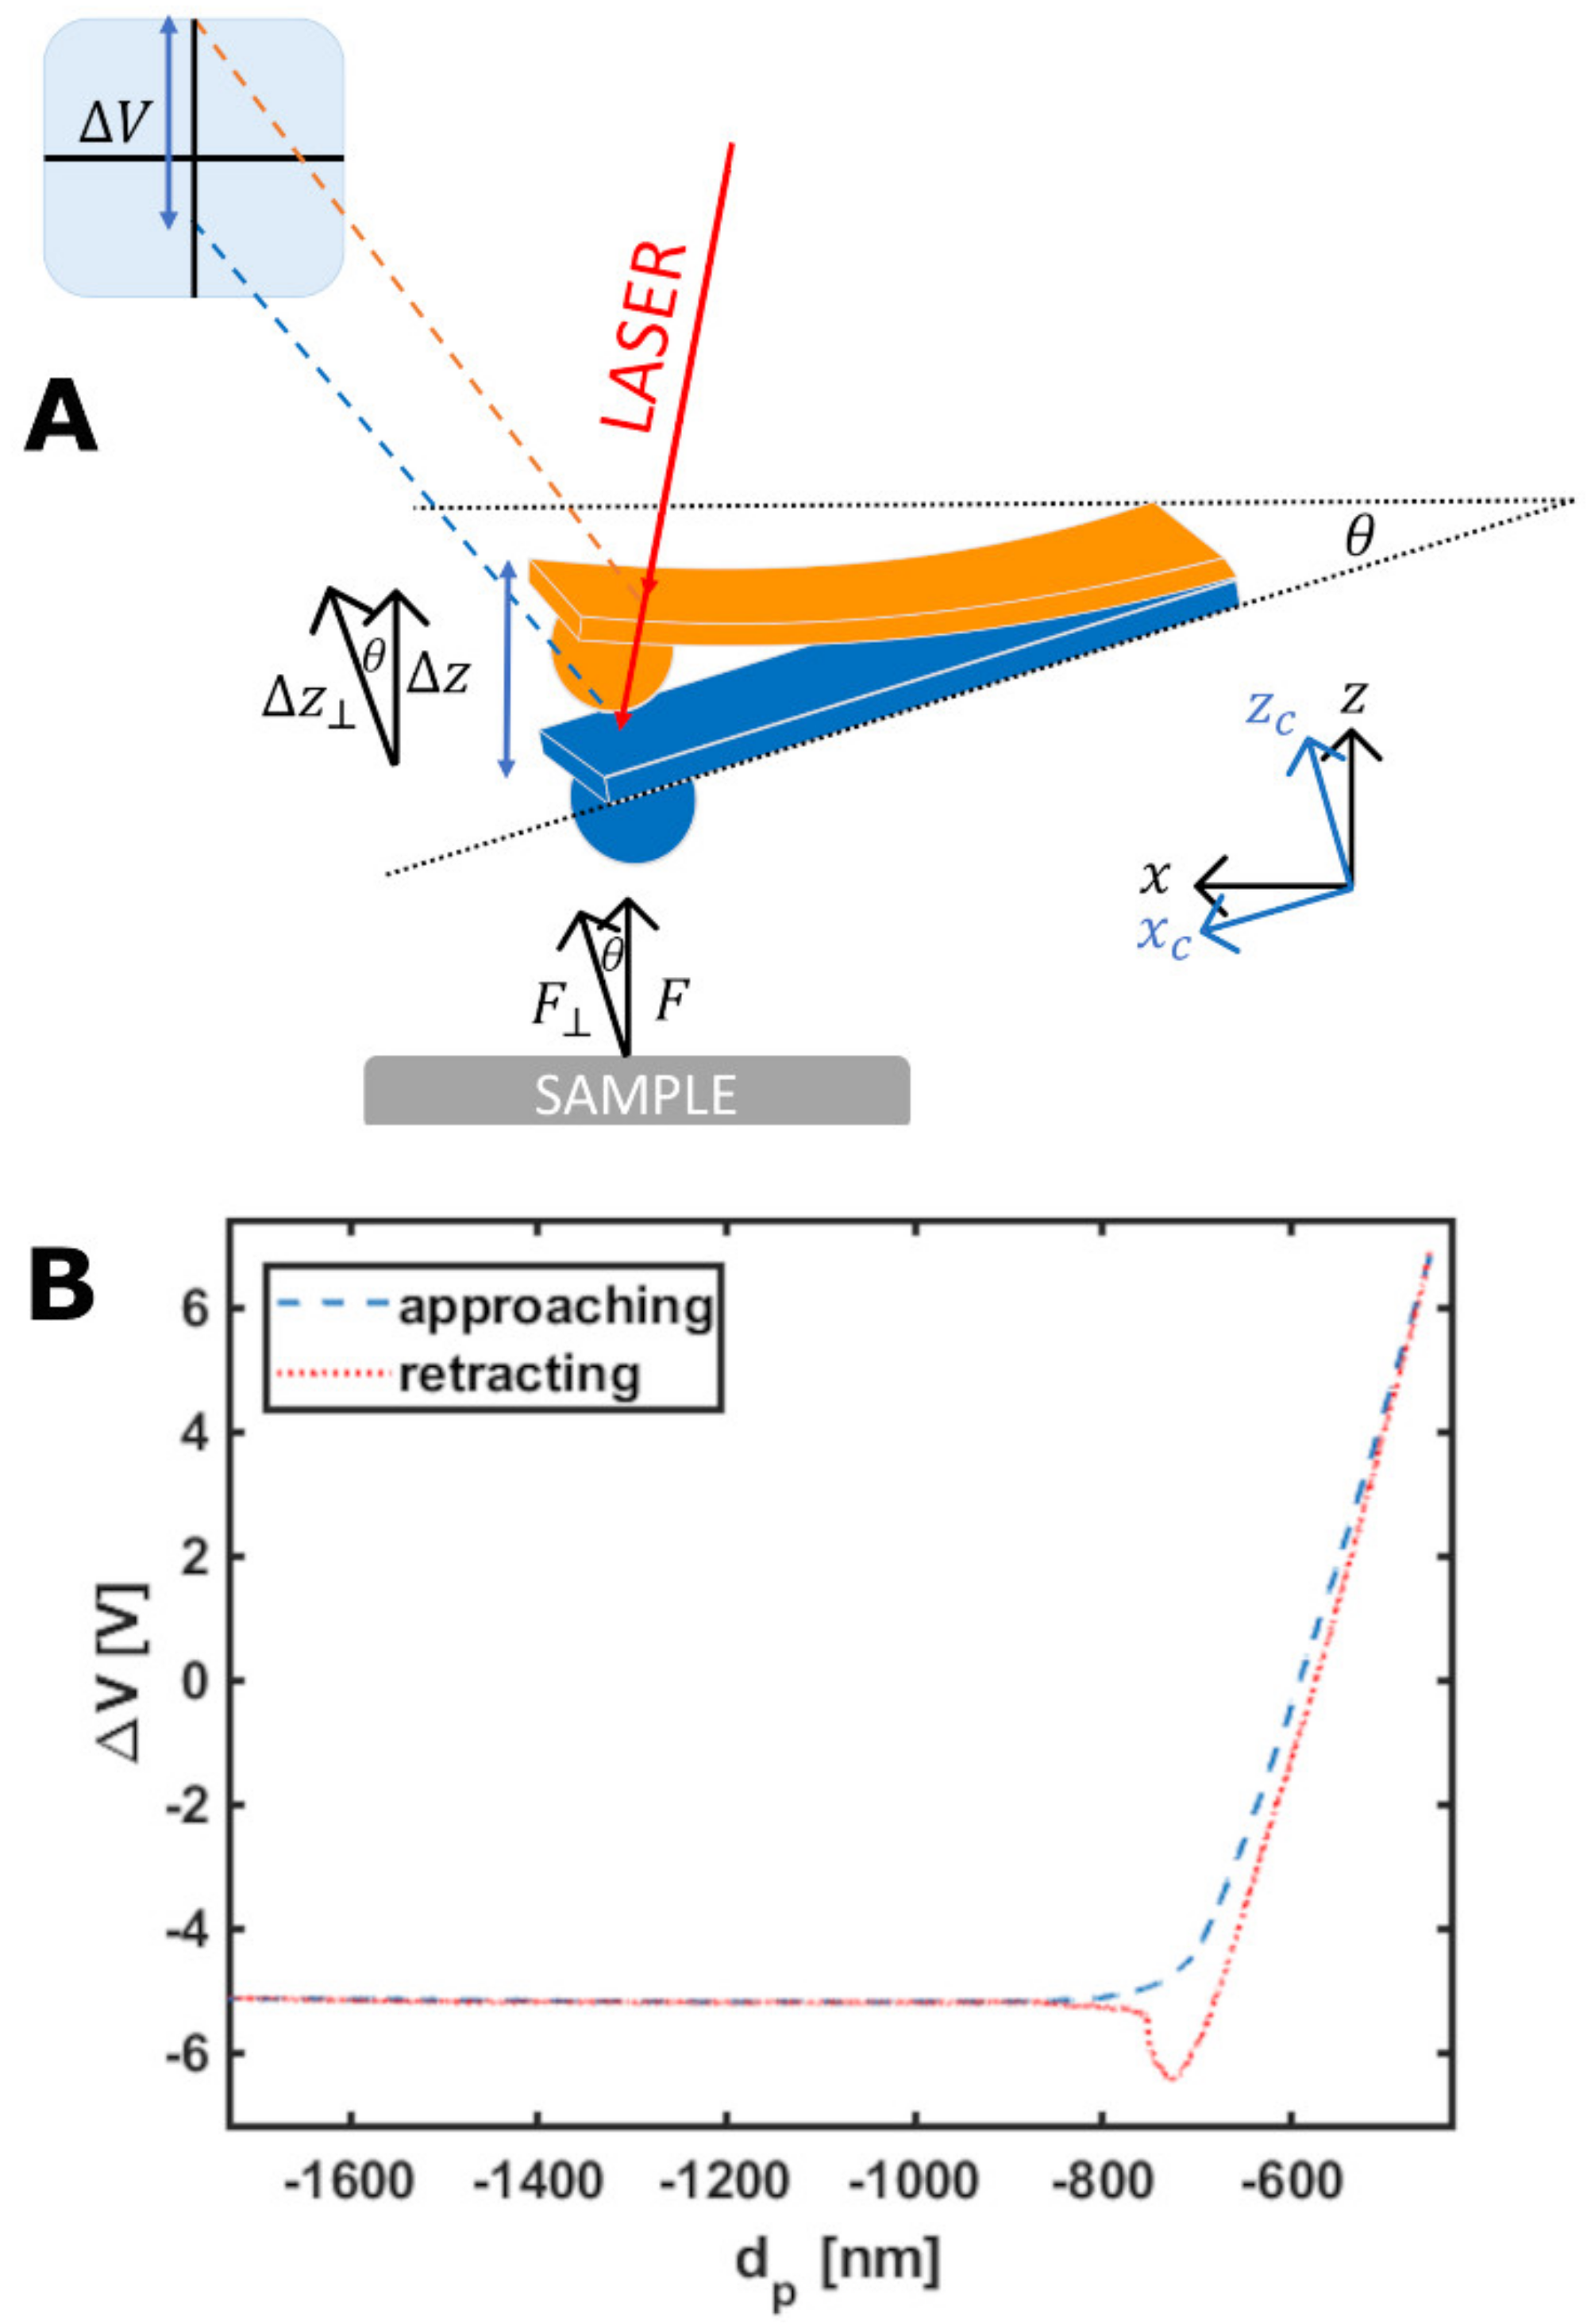
2.3. Force Sensing with the AFM
Indentation of Living Cells and ECMs by AFM
- Cells
- Glycocalyx thickness
- ECM
2.4. Statistics
3. Results
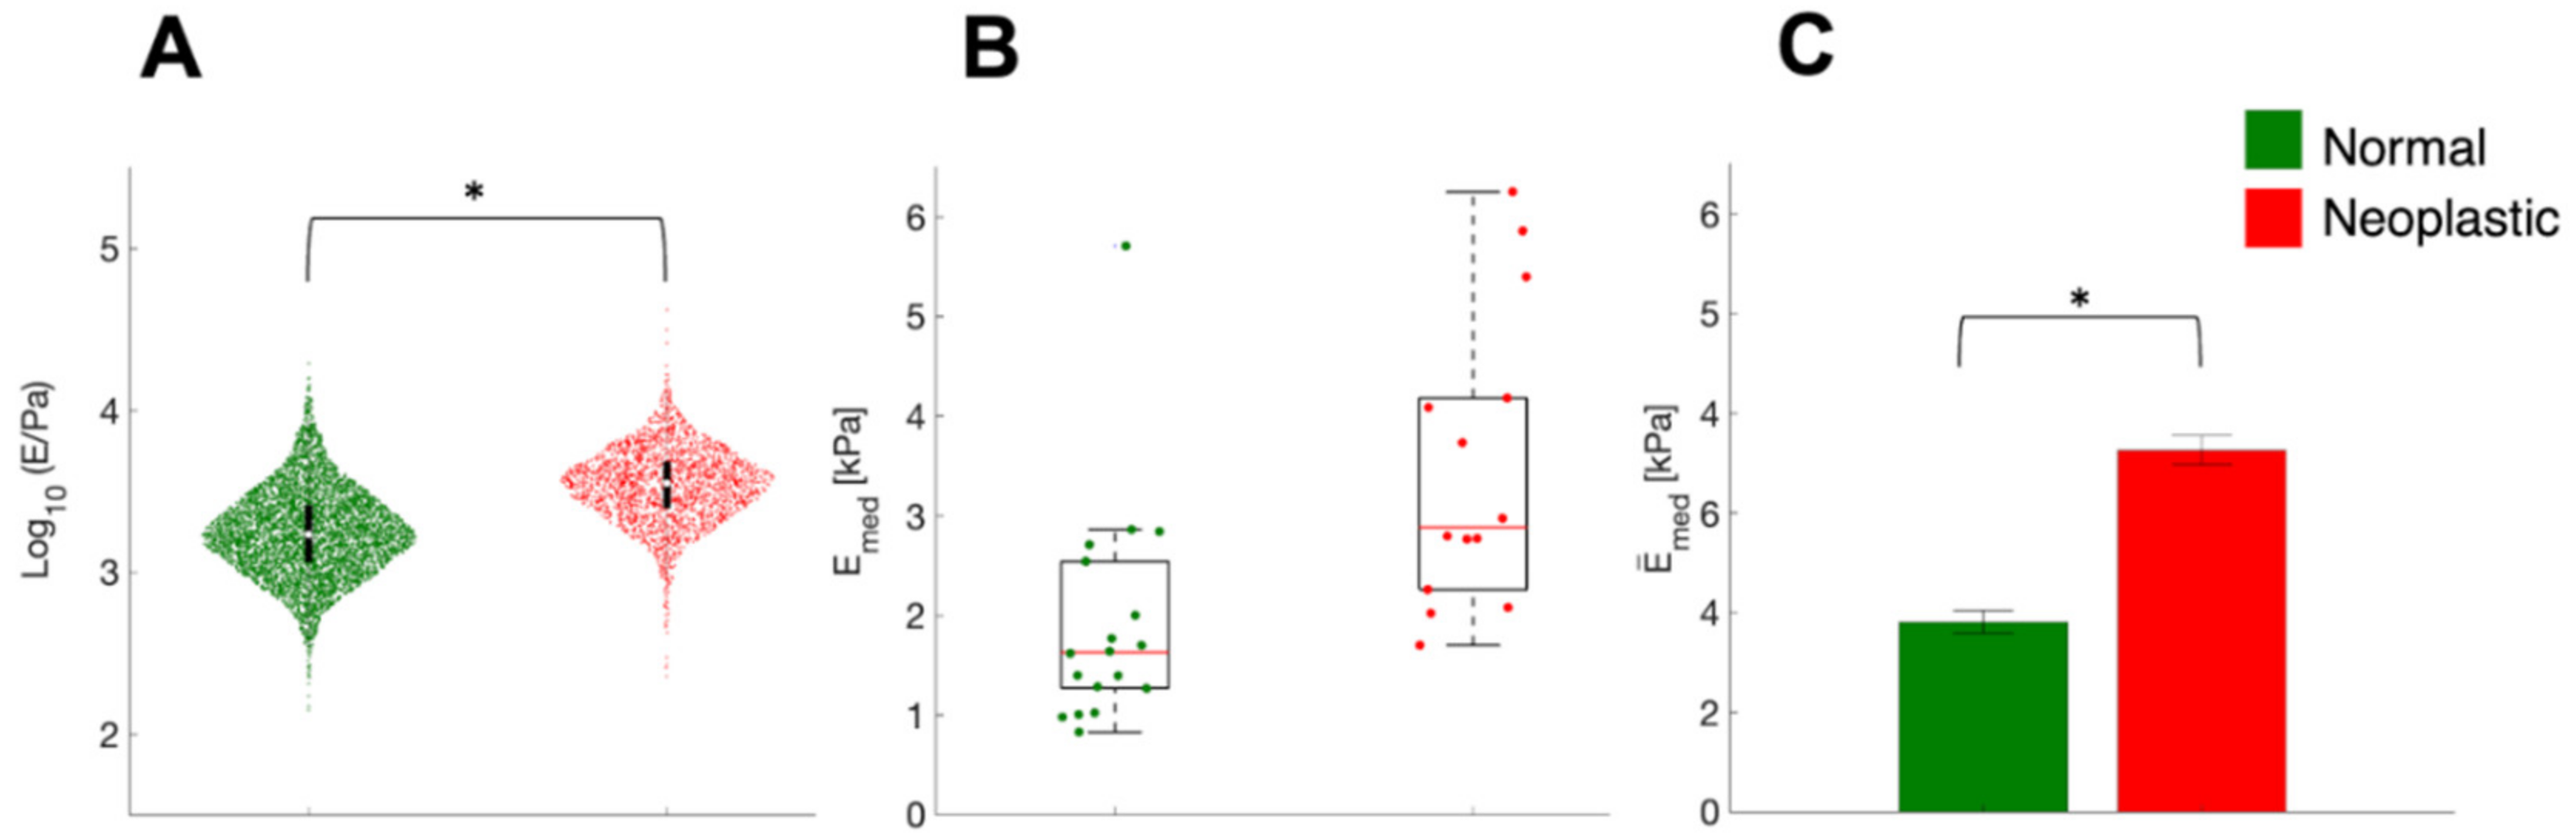
3.1. AFM at the Microscale: Mechanical Properties of ECMs
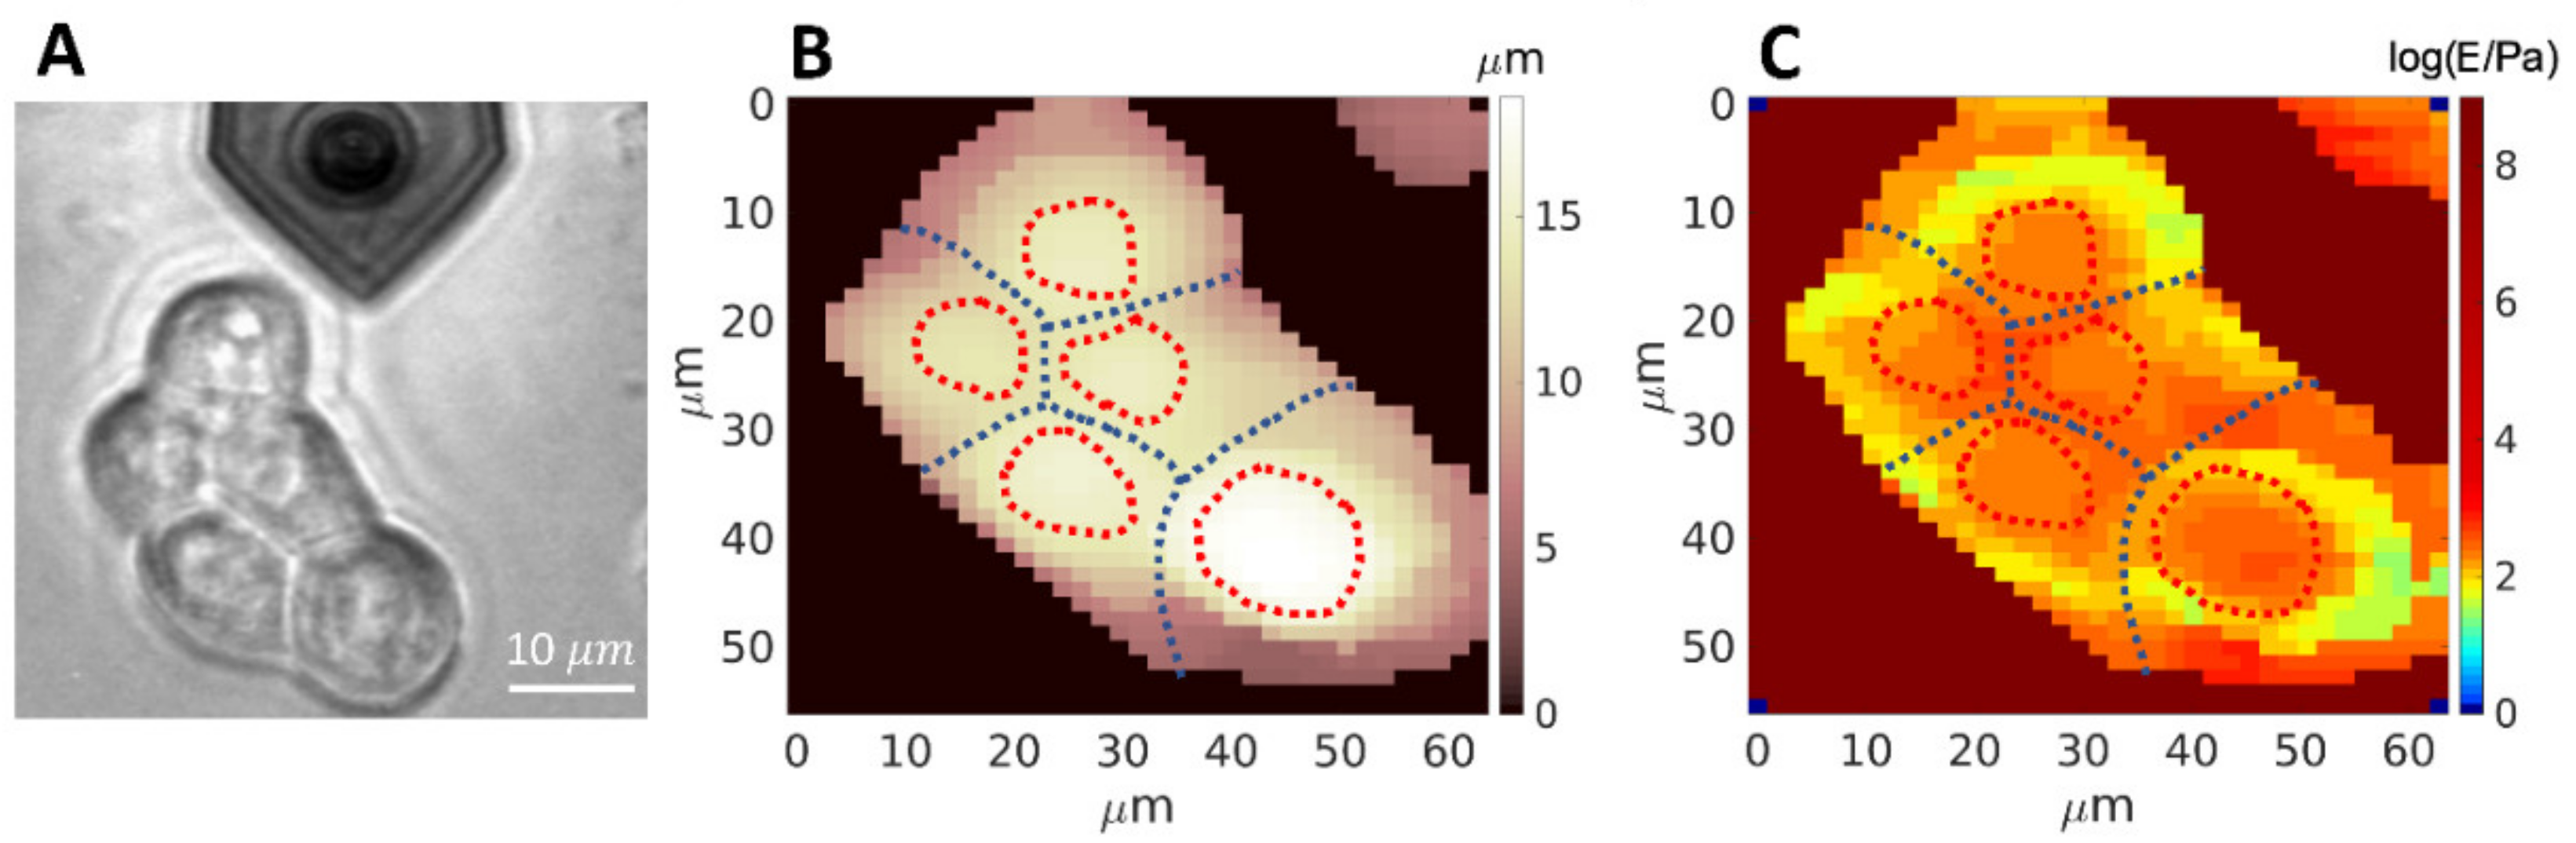
3.2. Mechanics of Cell, down to Cellular Components
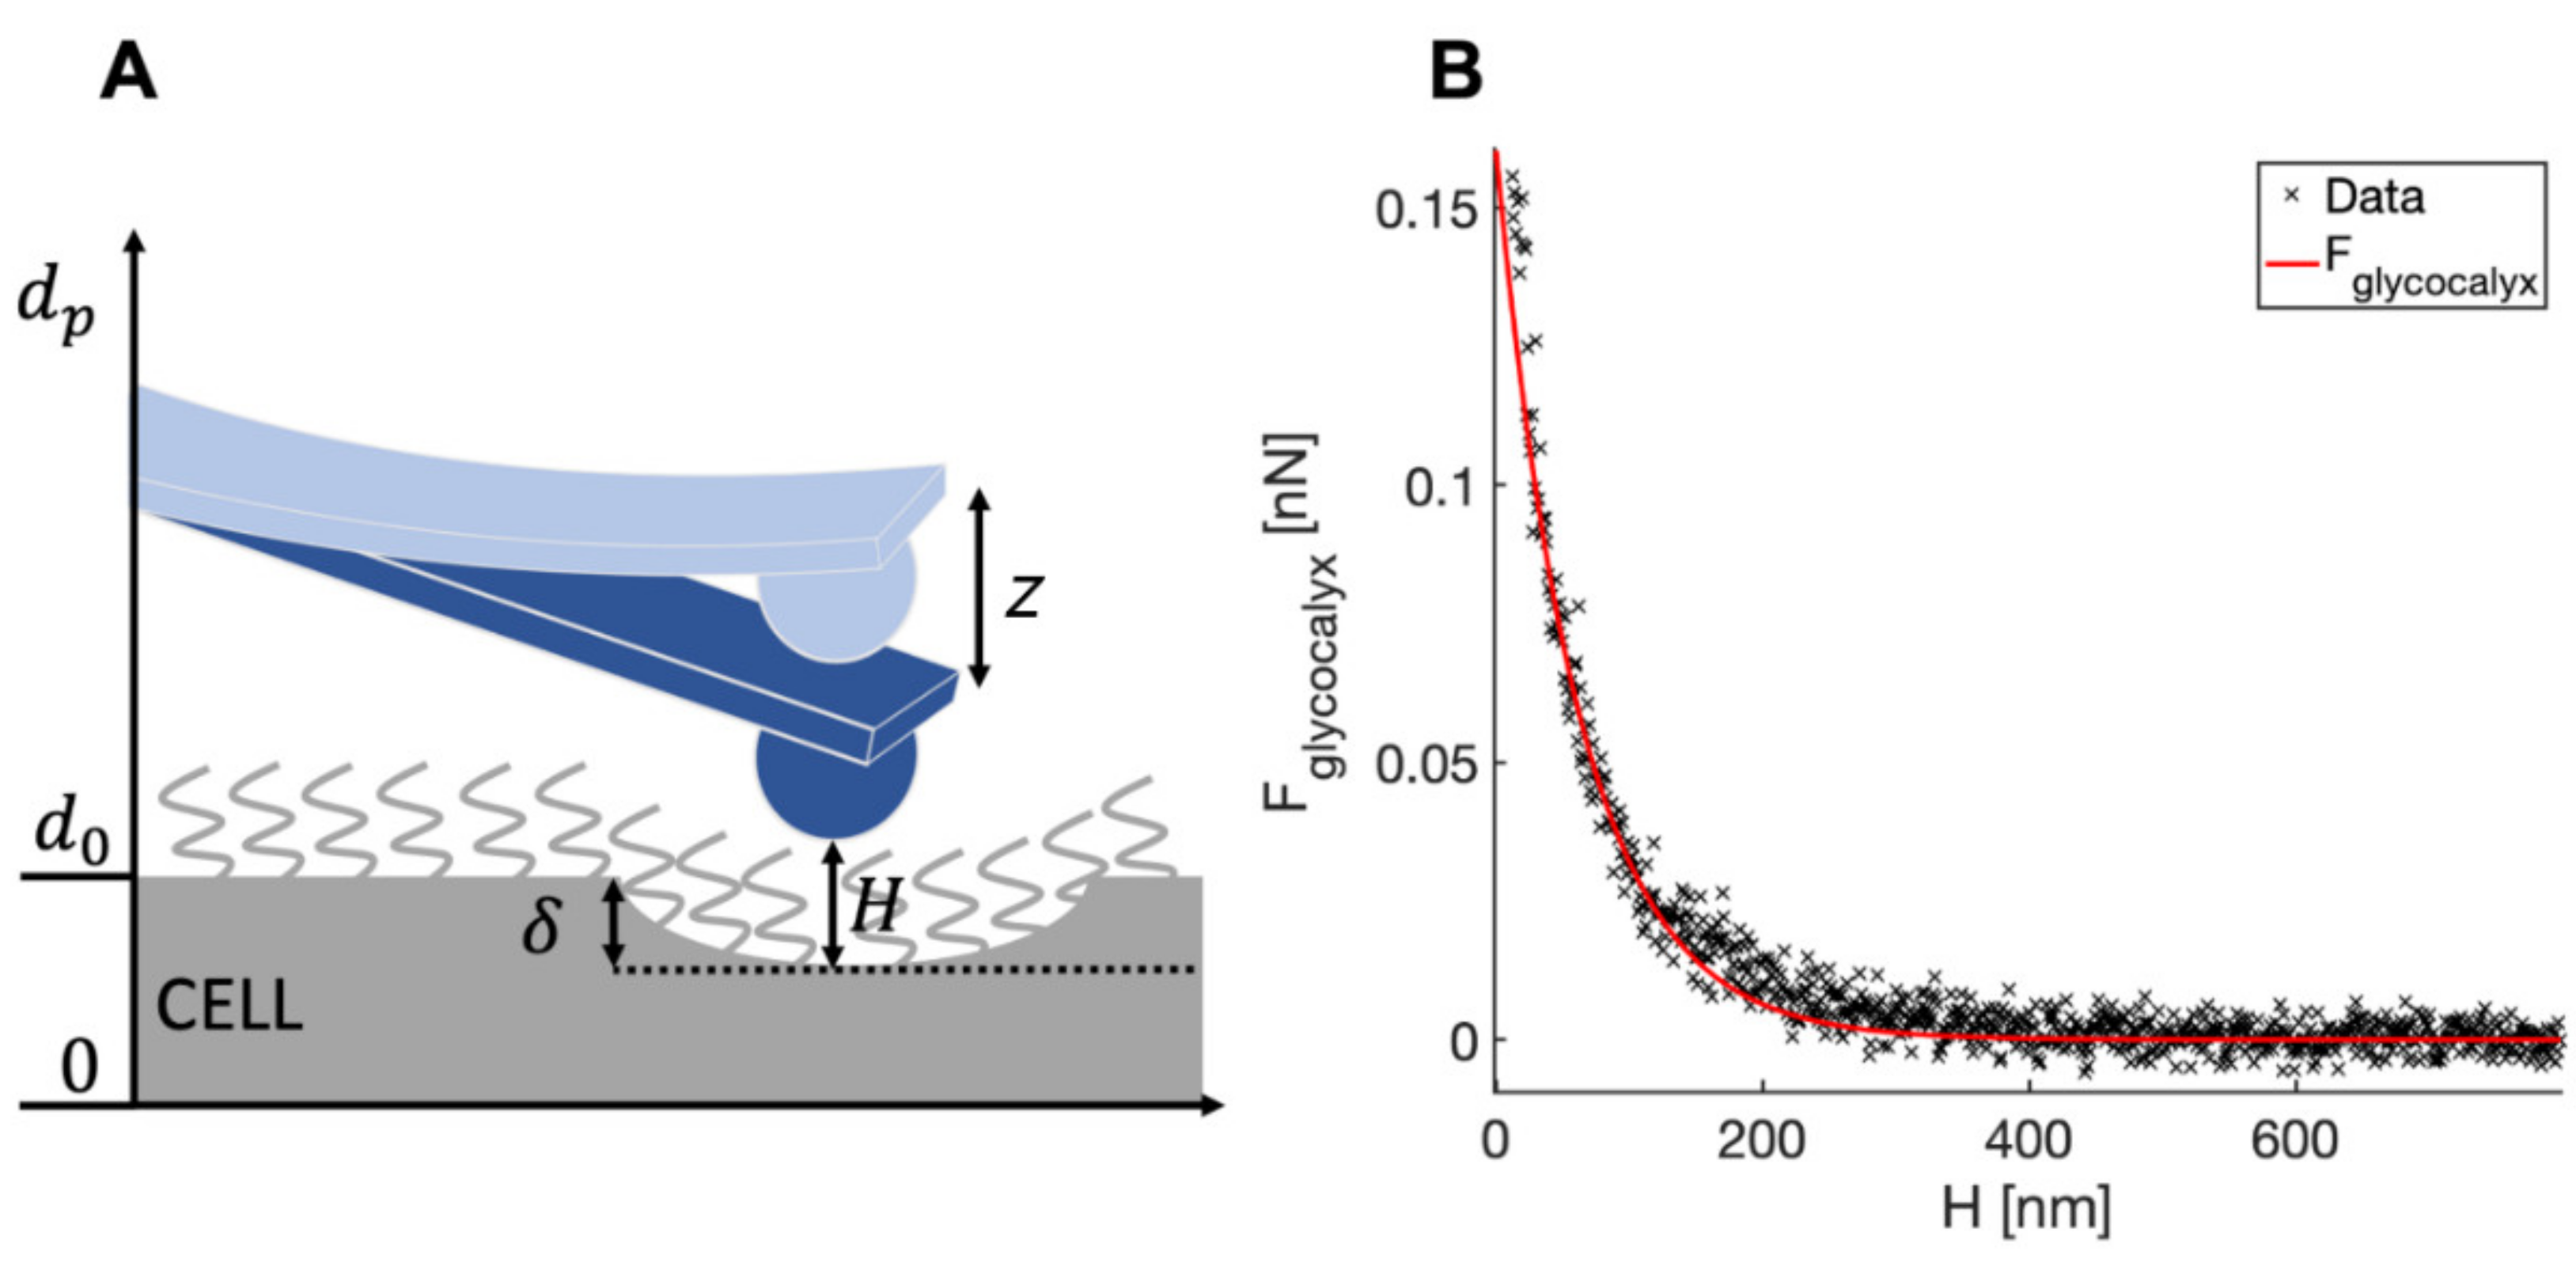
3.3. Down to the Nanoscale: Characterization of the Glycocalyx
4. Conclusions
Author Contributions
Funding
Institutional Review Board Statement
Informed Consent Statement
Data Availability Statement
Acknowledgments
Conflicts of Interest
References
- Frantz, C.; Stewart, K.M.; Weaver, V.M. The Extracellular Matrix at a Glance. J. Cell Sci. 2010, 123, 4195–4200. [Google Scholar] [CrossRef] [PubMed] [Green Version]
- Cox, T.R. The Matrix in Cancer. Nat. Rev. Cancer 2021, 21, 217–238. [Google Scholar] [CrossRef] [PubMed]
- Winkler, J.; Abisoye-Ogunniyan, A.; Metcalf, K.J.; Werb, Z. Concepts of Extracellular Matrix Remodelling in Tumour Progression and Metastasis. Nat. Commun. 2020, 11, 5120. [Google Scholar] [CrossRef] [PubMed]
- Engler, A.J.; Sen, S.; Sweeney, H.L.; Discher, D.E. Matrix Elasticity Directs Stem Cell Lineage Specification. Cell 2006, 126, 677–689. [Google Scholar] [CrossRef] [PubMed] [Green Version]
- Nebuloni, M.; Albarello, L.; Andolfo, A.; Magagnotti, C.; Genovese, L.; Locatelli, I.; Tonon, G.; Longhi, E.; Zerbi, P.; Allevi, R.; et al. Insight on Colorectal Carcinoma Infiltration by Studying Perilesional Extracellular Matrix. Sci. Rep. 2016, 6, 22522. [Google Scholar] [CrossRef]
- Lu, P.; Weaver, V.M.; Werb, Z. The Extracellular Matrix: A Dynamic Niche in Cancer Progression. J. Cell Biol. 2012, 196, 395–406. [Google Scholar] [CrossRef]
- Babu, P.K.V.; Radmacher, M. Mechanics of Brain Tissues Studied by Atomic Force Microscopy: A Perspective. Front. Neurosci. 2019, 13, 600. [Google Scholar] [CrossRef] [Green Version]
- Muiznieks, L.D.; Keeley, F.W. Molecular Assembly and Mechanical Properties of the Extracellular Matrix: A Fibrous Protein Perspective. Biochim. Biophys. Acta Mol. Basis Dis. 2013, 1832, 866–875. [Google Scholar] [CrossRef] [Green Version]
- Najafi, M.; Farhood, B.; Mortezaee, K. Extracellular Matrix (ECM) Stiffness and Degradation as Cancer Drivers. J. Cell. Biochem. 2019, 120, 2782–2790. [Google Scholar] [CrossRef]
- Oxnard, G.R. The Cellular Origins of Drug Resistance in Cancer. Nat. Med. 2016, 22, 232–234. [Google Scholar] [CrossRef]
- Giroldi, L.A.; Bringuier, P.-P.; Shimazui, T.; Jansen, K.; Schalken, J.A. Changes in Cadherins-Catenin Complexes in the Progression of Human Bladder Carcinoma. J. Cancer 1999, 82, 70–76. [Google Scholar] [CrossRef]
- Yeh, Y.-T.; Hur, S.S.; Chang, J.; Wang, K.-C.; Chiu, J.-J.; Li, Y.-S.; Chien, S. Matrix Stiffness Regulates Endothelial Cell Proliferation through Septin 9. PLoS ONE 2012, 7, e46889. [Google Scholar] [CrossRef] [PubMed] [Green Version]
- Jaalouk, D.E.; Lammerding, J. Mechanotransduction Gone Awry. Nat. Rev. Mol. Cell Biol. 2009, 10, 63–73. [Google Scholar] [CrossRef] [PubMed] [Green Version]
- Bissell, M.J.; Hines, W.C. Why Don’t We Get More Cancer? A Proposed Role of the Microenvironment in Restraining Cancer Progression. Nat. Med. 2011, 17, 320–329. [Google Scholar] [CrossRef] [PubMed] [Green Version]
- Chaudhuri, O.; Koshy, S.T.; Branco Da Cunha, C.; Shin, J.W.; Verbeke, C.S.; Allison, K.H.; Mooney, D.J. Extracellular Matrix Stiffness and Composition Jointly Regulate the Induction of Malignant Phenotypes in Mammary Epithelium. Nat. Mater. 2014, 13, 970–978. [Google Scholar] [CrossRef] [PubMed]
- Alberts, B. Essential Cell Biology, 2nd ed.; Garland Science Pub.: New York, NY, USA, 1998; Volume 51, ISBN 9780815334804. [Google Scholar]
- Lansky, Z.; Mutsafi, Y.; Houben, L.; Ilani, T.; Armony, G.; Wolf, S.G.; Fass, D. 3D Mapping of Native Extracellular Matrix Reveals Cellular Responses to the Microenvironment. J. Struct. Biol. X 2019, 1, 100002. [Google Scholar] [CrossRef]
- Alcaraz, J.; Otero, J.; Jorba, I.; Navajas, D. Bidirectional Mechanobiology between Cells and Their Local Extracellular Matrix Probed by Atomic Force Microscopy. Semin. Cell Dev. Biol. 2018, 73, 71–81. [Google Scholar] [CrossRef]
- Liu, H.; Wen, J.; Xiao, Y.; Liu, J.; Hopyan, S.; Radisic, M.; Simmons, C.A.; Sun, Y. In Situ Mechanical Characterization of the Cell Nucleus by Atomic Force Microscopy. ACS Nano 2014, 8, 3821–3828. [Google Scholar] [CrossRef]
- Gao, L.; Lipowsky, H.H. Composition of the Endothelial Glycocalyx and Its Relation to Its Thickness and Diffusion of Small Solutes. Microvasc. Res. 2010, 80, 394–401. [Google Scholar] [CrossRef] [Green Version]
- Chighizola, F.M.; Dini, T.; Marcotti, S.; Urso, M.D.; Piazzoni, C.; Borghi, F.; Previdi, A.; Ceriani, L.; Folliero, C.; Stramer, B.; et al. The glycocalyx affects the mechanotransductive perception of the topographical microenvironment. bioRxiv 2022. [Google Scholar] [CrossRef]
- Fu, B.M.; Tarbell, J.M. Mechano-Sensing and Transduction by Endothelial Surface Glycocalyx: Composition, Structure, and Function. Wiley Interdiscip. Rev. Syst. Biol. Med. 2013, 5, 381–390. [Google Scholar] [CrossRef] [PubMed] [Green Version]
- Kechagia, J.Z.; Ivaska, J.; Roca-Cusachs, P. Integrins as Biomechanical Sensors of the Microenvironment. Nat. Rev. Mol. Cell Biol. 2019, 20, 457–473. [Google Scholar] [CrossRef] [PubMed]
- Paszek, M.J.; Boettiger, D.; Weaver, V.M.; Hammer, D.A. Integrin Clustering Is Driven by Mechanical Resistance from the Glycocalyx and the Substrate. PLoS Comput. Biol. 2009, 5, e1000604. [Google Scholar] [CrossRef] [Green Version]
- Paszek, M.J.; Dufort, C.C.; Rossier, O.; Bainer, R.; Mouw, J.K.; Godula, K.; Hudak, J.E.; Lakins, J.N.; Wijekoon, A.C.; Cassereau, L.; et al. The Cancer Glycocalyx Mechanically Primes Integrin-Mediated Growth and Survival. Nature 2014, 511, 319–325. [Google Scholar] [CrossRef] [PubMed] [Green Version]
- Cosgun, Z.C.; Fels, B.; Kusche-Vihrog, K. Nanomechanics of the Endothelial Glycocalyx: From Structure to Function. Am. J. Pathol. 2020, 190, 732–741. [Google Scholar] [CrossRef] [PubMed]
- Iyer, S.; Gaikwad, R.M.; Subba-Rao, V.; Woodworth, C.D.; Sokolov, I. Atomic Force Microscopy Detects Differences in the Surface Brush of Normal and Cancerous Cells. Nat. Nanotechnol. 2009, 4, 389–393. [Google Scholar] [CrossRef] [PubMed] [Green Version]
- Schmidt, S.; Weigelin, B.; te Riet, J.; te Boekhorst, V.; te Lindert, M.; Wijers-Rouw, M.; Lelli, B.; Rognoni, L.; Krause-Vortmeyer, M.; Messent, A.; et al. Glycocalyx-Mediated Cell Adhesion and Migration. bioRxiv 2022. [Google Scholar] [CrossRef]
- Kuo, J.C.-H.; Gandhi, J.G.; Zia, R.N.; Paszek, M.J. Physical Biology of the Cancer Cell Glycocalyx. Nat. Phys. 2018, 14, 658–669. [Google Scholar] [CrossRef]
- Buffone, A.; Weaver, V.M. Don’t Sugarcoat It: How Glycocalyx Composition Influences Cancer Progression. J. Cell Biol. 2020, 219. [Google Scholar] [CrossRef]
- Sokolov, I.; Iyer, S.; Subba-Rao, V.; Gaikwad, R.M.; Woodworth, C.D. Detection of Surface Brush on Biological Cells in Vitro with Atomic Force Microscopy. Appl. Phys. Lett. 2007, 91, 023902. [Google Scholar] [CrossRef] [Green Version]
- Tarbell, J.M.; Cancel, L.M. The Glycocalyx and Its Significance in Human Medicine. J. Intern. Med. 2016, 280, 97–113. [Google Scholar] [CrossRef] [PubMed] [Green Version]
- Mitchell, M.J.; King, M.R. Physical Biology in Cancer. 3. The Role of Cell Glycocalyx in Vascular Transport of Circulating Tumor Cells. Am. J. Physiol. Cell Physiol. 2014, 306, C89–C97. [Google Scholar] [CrossRef] [PubMed] [Green Version]
- Qi, S.; Yi, C.; Yang, M. Biosensors Using Atomic Force Microscopes. In Encyclopedia of Microfluidics and Nanofluidics; Springer US: Boston, MA, USA, 2008; pp. 106–114. [Google Scholar]
- Zhou, G.; Zhang, B.; Tang, G.; Yu, X.F.; Galluzzi, M. Cells Nanomechanics by Atomic Force Microscopy: Focus on Interactions at Nanoscale. Adv. Phys. X 2021, 6, 1866668. [Google Scholar] [CrossRef]
- Alessandrini, A.; Facci, P. AFM: A Versatile Tool in Biophysics. Meas. Sci. Technol. 2005, 16, R65–R92. [Google Scholar] [CrossRef]
- Müller, D.J.; Dumitru, A.C.; lo Giudice, C.; Gaub, H.E.; Hinterdorfer, P.; Hummer, G.; de Yoreo, J.J.; Dufrêne, Y.F.; Alsteens, D. Atomic Force Microscopy-Based Force Spectroscopy and Multiparametric Imaging of Biomolecular and Cellular Systems. Chem. Rev. 2021, 121, 11701–11725. [Google Scholar] [CrossRef]
- Alexander, S.; Hellemans, L.; Marti, O.; Schneir, J.; Elings, V.; Hansma, P.K.; Longmire, M.; Gurley, J. An Atomic-resolution Atomic-force Microscope Implemented Using an Optical Lever. J. Appl. Phys. 1998, 65, 164–167. [Google Scholar] [CrossRef]
- Meyer, G.; Amer, N.M. Optical-Beam-Deflection Atomic Force Microscopy: The NaCl (001) Surface. Appl. Phys. Lett. 1990, 56, 2100–2101. [Google Scholar] [CrossRef]
- Putman, C.A.J.; de Grooth, B.G.; van Hulst, N.F.; Greve, J. A Theoretical Comparison between Interferometric and Optical Beam Deflection Technique for the Measurement of Cantilever Displacement in AFM. Ultramicroscopy 1992, 42, 1509–1513. [Google Scholar] [CrossRef] [Green Version]
- Erlandsson, R.; McClelland, G.M.; Mate, C.M.; Chiang, S. Atomic Force Microscopy Using Optical Interferometry. J. Vac. Sci. Technol. A Vac. Surf. Film. 1988, 6, 266–270. [Google Scholar] [CrossRef]
- Chighizola, M.; Puricelli, L.; Bellon, L.; Podestà, A. Large Colloidal Probes for Atomic Force Microscopy: Fabrication and Calibration Issues. J. Mol. Recognit. 2021, 34, e2879. [Google Scholar] [CrossRef]
- Butt, H.J.; Jaschke, M. Calculation of Thermal Noise in Atomic Force Microscopy. Nanotechnology 1995, 6, 1. [Google Scholar] [CrossRef]
- Hutter, J.L.; Bechhoefer, J. Calibration of Atomic-Force Microscope Tips. Rev. Sci. Instrum. 1993, 64, 1868–1873. [Google Scholar] [CrossRef] [Green Version]
- Viani, M.B.; Schäffer, T.E.; Chand, A.; Rief, M.; Gaub, H.E.; Hansma, P.K. Small Cantilevers for Force Spectroscopy of Single Molecules. J. Appl. Phys. 1999, 86, 2258–2262. [Google Scholar] [CrossRef]
- Smith, D.P.E. Limits of Force Microscopy. Rev. Sci. Instrum. 1995, 66, 3191–3195. [Google Scholar] [CrossRef]
- Butt, H.J.; Cappella, B.; Kappl, M. Force Measurements with the Atomic Force Microscope: Technique, Interpretation and Applications. Surf. Sci. Rep. 2005, 59, 1–152. [Google Scholar] [CrossRef] [Green Version]
- Genovese, L.; Zawada, L.; Tosoni, A.; Ferri, A.; Zerbi, P.; Allevi, R.; Nebuloni, M.; Alfano, M. Cellular Localization, Invasion, and Turnover Are Differently Influenced by Healthy and Tumor-Derived Extracellular Matrix. Tissue Eng. Part A 2014, 20, 2005–2018. [Google Scholar] [CrossRef] [Green Version]
- Varinelli, L.; Guaglio, M.; Brich, S.; Zanutto, S.; Belfiore, A.; Zanardi, F.; Iannelli, F.; Oldani, A.; Costa, E.; Chighizola, M.; et al. Decellularized Normal and Tumor Extracellular Matrix as Scaffold for Cancer Organoid Cultures of Colorectal Peritoneal Metastases. bioRxiv 2021. [Google Scholar] [CrossRef]
- Franks, L.M.; Rigby, C.; Nelson-Rees, W.A. HeLa Cells and RT4 Cells. Science 1975, 188, 168. [Google Scholar] [CrossRef] [Green Version]
- Bubeník, J.; Barešová, M.; Viklický, V.; Jakoubková, J.; Sainerová, H.; Donner, J. Established Cell Line of Urinary Bladder Carcinoma (T24) Containing Tumour-specific Antigen. Int. J. Cancer 1973, 11, 765–773. [Google Scholar] [CrossRef]
- Indrieri, M.; Podestà, A.; Bongiorno, G.; Marchesi, D.; Milani, P. Adhesive-Free Colloidal Probes for Nanoscale Force Measurements: Production and Characterization. Rev. Sci. Instrum. 2011, 82, 023708. [Google Scholar] [CrossRef] [Green Version]
- Kontomaris, S.-V. The Hertz Model in AFM Nanoindentation Experiments: Applications in Biological Samples and Biomaterials. Micro Nanosyst. 2018, 10, 11–22. [Google Scholar] [CrossRef]
- Hertz, H. Ueber Die Berührung Fester Elastischer Körper. J. Fur Die Reine Angew. Math. 1881, 1881, 156–171. [Google Scholar] [CrossRef]
- Puricelli, L.; Galluzzi, M.; Schulte, C.; Podestà, A.; Milani, P. Nanomechanical and Topographical Imaging of Living Cells by Atomic Force Microscopy with Colloidal Probes. Rev. Sci. Instrum. 2015, 86, 33705. [Google Scholar] [CrossRef] [PubMed] [Green Version]
- Gavara, N. Combined Strategies for Optimal Detection of the Contact Point in AFM Force-Indentation Curves Obtained on Thin Samples and Adherent Cells. Sci. Rep. 2016, 6, 1–13. [Google Scholar] [CrossRef] [PubMed] [Green Version]
- Laurent, J.; Steinberger, A.; Bellon, L. Functionalized AFM Probes for Force Spectroscopy: Eigenmode Shapes and Stiffness Calibration through Thermal Noise Measurements. Nanotechnology 2013, 24, 225504. [Google Scholar] [CrossRef] [PubMed] [Green Version]
- Schillers, H.; Rianna, C.; Schäpe, J.; Luque, T.; Doschke, H.; Wälte, M.; Uriarte, J.J.; Campillo, N.; Michanetzis, G.P.A.; Bobrowska, J.; et al. Standardized Nanomechanical Atomic Force Microscopy Procedure (SNAP) for Measuring Soft and Biological Samples. Sci. Rep. 2017, 7, 5117. [Google Scholar] [CrossRef] [Green Version]
- Dimitriadis, E.K.; Horkay, F.; Maresca, J.; Kachar, B.; Chadwick, R.S. Determination of Elastic Moduli of Thin Layers of Soft Material Using the Atomic Force Microscope. Biophys. J. 2002, 82, 2798–2810. [Google Scholar] [CrossRef] [Green Version]
- Garcia, P.D.; Garcia, R. Determination of the Elastic Moduli of a Single Cell Cultured on a Rigid Support by Force Microscopy. Biophys. J. 2018, 114, 2923–2932. [Google Scholar] [CrossRef] [Green Version]
- Gavara, N.; Chadwick, R.S. Determination of the Elastic Moduli of Thin Samples and Adherent Cells Using Conical Atomic Force Microscope Tips. Nat. Nanotechnol. 2012, 7, 733–736. [Google Scholar] [CrossRef] [Green Version]
- Kubiak, A.; Chighizola, M.; Schulte, C.; Bryniarska, N.; Wesolowska, J.; Pudelek, M.; Lasota, M.; Ryszawy, D.; Basta-Kaim, A.; Laidler, P.; et al. Stiffening of DU145 Prostate Cancer Cells Driven by Actin Filaments-Microtubule Crosstalk Conferring Resistance to Microtubule-Targeting Drugs. Nanoscale 2021, 13, 6212–6226. [Google Scholar] [CrossRef]
- Giergiel, M.; Malek-Zietek, K.E.; Konior, J.; Targosz-Korecka, M. Endothelial Glycocalyx Detection and Characterization by Means of Atomic Force Spectroscopy: Comparison of Various Data Analysis Approaches. Micron 2021, 151, 103153. [Google Scholar] [CrossRef] [PubMed]
- Dokukin, M.; Ablaeva, Y.; Kalaparthi, V.; Seluanov, A.; Gorbunova, V.; Sokolov, I. Pericellular Brush and Mechanics of Guinea Pig Fibroblast Cells Studied with AFM. Biophys. J. 2016, 111, 236–246. [Google Scholar] [CrossRef] [PubMed] [Green Version]
- Dokukin, M.E.; Kuroki, H.; Minko, S.; Sokolov, I. AFM Study of Polymer Brush Grafted to Deformable Surfaces: Quantitative Properties of the Brush and Substrate Mechanics. Macromolecules 2017, 50, 275–282. [Google Scholar] [CrossRef]
- Sokolov, I.; Dokukin, M.E.; Guz, N.V. Method for Quantitative Measurements of the Elastic Modulus of Biological Cells in AFM Indentation Experiments. Methods 2013, 60, 202–213. [Google Scholar] [CrossRef]
- Alper, J.S.; Gelb, R.I. Standard Errors and Confidence Intervals in Nonlinear Regression: Comparison of Monte Carlo and Parametric Statistics. J. Phys. Chem. 1990, 94, 4747–4751. [Google Scholar] [CrossRef]
- Viji Babu, P.K.; Rianna, C.; Mirastschijski, U.; Radmacher, M. Nano-Mechanical Mapping of Interdependent Cell and ECM Mechanics by AFM Force Spectroscopy. Sci. Rep. 2019, 9, 1–19. [Google Scholar] [CrossRef]
- Jorba, I.; Beltrán, G.; Falcones, B.; Suki, B.; Farré, R.; García-Aznar, J.M.; Navajas, D. Nonlinear Elasticity of the Lung Extracellular Microenvironment Is Regulated by Macroscale Tissue Strain. Acta Biomater. 2019, 92, 265–276. [Google Scholar] [CrossRef]
- Jorba, I.; Uriarte, J.J.; Campillo, N.; Farré, R.; Navajas, D. Probing Micromechanical Properties of the Extracellular Matrix of Soft Tissues by Atomic Force Microscopy. J. Cell. Physiol. 2017, 232, 19–26. [Google Scholar] [CrossRef]
- Luque, T.; Melo, E.; Garreta, E.; Cortiella, J.; Nichols, J.; Farré, R.; Navajas, D. Local Micromechanical Properties of Decellularized Lung Scaffolds Measured with Atomic Force Microscopy. Acta Biomater. 2013, 9, 6852–6859. [Google Scholar] [CrossRef]
- Liu, F.; Mih, J.D.; Shea, B.S.; Kho, A.T.; Sharif, A.S.; Tager, A.M.; Tschumperlin, D.J. Feedback Amplification of Fibrosis through Matrix Stiffening and COX-2 Suppression. J. Cell Biol. 2010, 190, 693–706. [Google Scholar] [CrossRef] [Green Version]
- Limpert, E.; Stahel, W.A. Problems with Using the Normal Distribution—and Ways to Improve Quality and Efficiency of Data Analysis. PLoS ONE 2011, 6, e21403. [Google Scholar] [CrossRef] [PubMed] [Green Version]
- Deville, S.S.; Cordes, N. The Extracellular, Cellular, and Nuclear Stiffness, a Trinity in the Cancer Resistome—A Review. Front. Oncol. 2019, 9, 1376. [Google Scholar] [CrossRef] [PubMed]
- Grasset, E.M.; Bertero, T.; Bozec, A.; Friard, J.; Bourget, I.; Pisano, S.; Lecacheur, M.; Maiel, M.; Bailleux, C.; Emelyanov, A.; et al. Matrix Stiffening and EGFR Cooperate to Promote the Collective Invasion of Cancer Cells. Cancer Res. 2018, 78, 5229–5242. [Google Scholar] [CrossRef] [PubMed] [Green Version]
- Handorf, A.M.; Zhou, Y.; Halanski, M.A.; Li, W.J. Tissue Stiffness Dictates Development, Homeostasis, and Disease Progression. Organogenesis 2015, 11, 1–15. [Google Scholar] [CrossRef] [PubMed] [Green Version]
- Rotsch, C.; Radmacher, M. Drug-Induced Changes of Cytoskeletal Structure and Mechanics in Fibroblasts: An Atomic Force Microscopy Study. Biophys. J. 2000, 78, 520–535. [Google Scholar] [CrossRef] [Green Version]
- Liu, H.; Tan, Q.; Geddie, W.R.; Jewett, M.A.S.; Phillips, N.; Ke, D.; Simmons, C.A.; Sun, Y. Biophysical Characterization of Bladder Cancer Cells with Different Metastatic Potential. Cell Biochem. Biophys. 2014, 68, 241–246. [Google Scholar] [CrossRef]
- Tang, G.; Galluzzi, M.; Zhang, B.; Shen, Y.-L.L.; Stadler, F.J. Biomechanical Heterogeneity of Living Cells: Comparison between Atomic Force Microscopy and Finite Element Simulation. Langmuir 2019, 35, 7578–7587. [Google Scholar] [CrossRef]
- Ramos, J.R.; Pabijan, J.; Garcia, R.; Lekka, M. The Softening of Human Bladder Cancer Cells Happens at an Early Stage of the Malignancy Process. Beilstein J. Nanotechnol. 2014, 5, 447–457. [Google Scholar] [CrossRef]
- Xu, W.; Mezencev, R.; Kim, B.; Wang, L.; McDonald, J.; Sulchek, T. Cell Stiffness Is a Biomarker of the Metastatic Potential of Ovarian Cancer Cells. PLoS ONE 2012, 7, 46609. [Google Scholar] [CrossRef] [Green Version]
- Cross, S.E.; Jin, Y.S.; Rao, J.; Gimzewski, J.K. Nanomechanical Analysis of Cells from Cancer Patients. Nat. Nanotechnol. 2007, 2, 780–783. [Google Scholar] [CrossRef]
- Plodinec, M.; Loparic, M.; Monnier, C.A.; Obermann, E.C.; Zanetti-Dallenbach, R.; Oertle, P.; Hyotyla, J.T.; Aebi, U.; Bentires-Alj, M.; Lim, R.Y.H.; et al. The Nanomechanical Signature of Breast Cancer. Nat. Nanotechnol. 2012, 7, 757–765. [Google Scholar] [CrossRef] [PubMed]
- Mialhe, A.; Levacher, G.; Champelovier, P.; Martel, V.; Serres, M.; Knudsen, K.; Seigneurin, D. Expression of E-, P-, N-Cadherins and Catenins in Human Bladder Carcinoma Cell Lines. J. Urol. 2000, 164, 826–835. [Google Scholar] [CrossRef]
- Oberleithner, H.; Peters, W.; Kusche-Vihrog, K.; Korte, S.; Schillers, H.; Kliche, K.; Oberleithner, K. Salt Overload Damages the Glycocalyx Sodium Barrier of Vascular Endothelium. Pflug. Arch. Eur. J. Physiol. 2011, 462, 519–528. [Google Scholar] [CrossRef] [PubMed] [Green Version]
- Gould, S.A.C.; Drake, B.; Prater, C.B.; Weisenhorn, A.L.; Manne, S.; Kelderman, G.L.; Butt, H.J.; Hansma, H.; Hansma, P.K.; Magonov, S.; et al. The Atomic Force Microscope: A Tool for Science and Industry. Ultramicroscopy 1990, 33, 93–98. [Google Scholar] [CrossRef]
- Müller, D.J.; Dufrêne, Y.F. Atomic Force Microscopy as a Multifunctional Molecular Toolbox in Nanobiotechnology. Nanosci. Technol. A Collect. Rev. Nat. J. 2008, 3, 261–269. [Google Scholar] [CrossRef]
- Krieg, M.; Fläschner, G.; Alsteens, D.; Gaub, B.M.; Roos, W.H.; Wuite, G.J.L.; Gaub, H.E.; Gerber, C.; Dufrêne, Y.F.; Müller, D.J. Atomic Force Microscopy-Based Mechanobiology. Nat. Rev. Phys. 2019, 1, 41–57. [Google Scholar] [CrossRef]
- Li, M.; Dang, D.; Liu, L.; Xi, N.; Wang, Y. Atomic Force Microscopy in Characterizing Cell Mechanics for Biomedical Applications: A Review. IEEE Trans. Nanobioscience 2017, 16, 523–540. [Google Scholar] [CrossRef]
- Lamontagne, C.-A.; Cuerrier, C.M.; Grandbois, M. AFM as a Tool to Probe and Manipulate Cellular Processes. Pflügers Arch. Eur. J. Physiol. 2008, 456, 61–70. [Google Scholar] [CrossRef] [Green Version]


| Cell Line | Specie/Organ | Morphology | Tumor |
|---|---|---|---|
| RT4 | Human Bladder | Epithelial | Papilloma, transitional cell (Grade I) |
| RT112 | Human Bladder | Epithelial | Papilloma, transitional cell (Grade II) |
| T24 | Human Bladder | Epithelial | Carcinoma, transitional cell (Grade III) |
| Experiment | Colloidal Probe Radius (μm) | Spring Constant (N/m) |
|---|---|---|
| Mechanics of the ECM | 20 | 5 |
| Mechanics of cells | 5 | 0.01 |
| Glycocalyx characterization | 5 | 0.01 |
Publisher’s Note: MDPI stays neutral with regard to jurisdictional claims in published maps and institutional affiliations. |
© 2022 by the authors. Licensee MDPI, Basel, Switzerland. This article is an open access article distributed under the terms and conditions of the Creative Commons Attribution (CC BY) license (https://creativecommons.org/licenses/by/4.0/).
Share and Cite
Holuigue, H.; Lorenc, E.; Chighizola, M.; Schulte, C.; Varinelli, L.; Deraco, M.; Guaglio, M.; Gariboldi, M.; Podestà, A. Force Sensing on Cells and Tissues by Atomic Force Microscopy. Sensors 2022, 22, 2197. https://doi.org/10.3390/s22062197
Holuigue H, Lorenc E, Chighizola M, Schulte C, Varinelli L, Deraco M, Guaglio M, Gariboldi M, Podestà A. Force Sensing on Cells and Tissues by Atomic Force Microscopy. Sensors. 2022; 22(6):2197. https://doi.org/10.3390/s22062197
Chicago/Turabian StyleHoluigue, Hatice, Ewelina Lorenc, Matteo Chighizola, Carsten Schulte, Luca Varinelli, Marcello Deraco, Marcello Guaglio, Manuela Gariboldi, and Alessandro Podestà. 2022. "Force Sensing on Cells and Tissues by Atomic Force Microscopy" Sensors 22, no. 6: 2197. https://doi.org/10.3390/s22062197