Article

On-Orbit Absolute Radiometric Calibration and Validation of ZY3-02 Satellite Multispectral Sensor

1
School of Earth and Space Sciences, Peking University, Beijing 100871, China
2
Land Satellite Remote Sensing Application Center, Ministry of Natural Resources, Beijing 100094, China
3
College of Geoscience and Surveying Engineering, China University of Mining and Technology, Beijing 100083, China
*
Author to whom correspondence should be addressed.
Sensors 2022, 22(5), 2066; https://doi.org/10.3390/s22052066
Submission received: 22 December 2021 / Revised: 3 March 2022 / Accepted: 5 March 2022 / Published: 7 March 2022
(This article belongs to the Collection Remote Sensing Image Processing)

Abstract

:
This study described the on-orbit vicarious radiometric calibration of Chinese civilian high-resolution stereo mapping satellite ZY3-02 multispectral imager (MUX). The calibration was based on gray-scale permanent artificial targets, and multiple radiometric calibration tarpaulins (tarps) using a reflectance-based approach between July and September 2016 at Baotou calibration site in China was described. The calibration results reveal a good linear relationship between DN and TOA radiances of ZY3-02 MUX. The uncertainty of this radiometric calibration was 4.33%, indicating that radiometric coefficients of ZY3-02 MUX are reliable. A detailed discussion on the validation analysis of the comparison results between the different radiometric calibration coefficients is presented in this paper. To further validate the reliability of the three coefficients, the calibrated ZY3-02 MUX was compared with Landsat-8 Operational Land Imager (OLI). The results also indicate that radiometric characteristics of ZY3-02 MUX imagery are reliable and highly accurate for quantitative applications.

1. Introduction

The Ziyuan-3 (ZY3) satellite constellation is China’s civilian high-resolution stereo mapping satellite system, consisting of four satellites: ZY3-01, ZY3-02, ZY3-03, and ZY3-04. The ZY3-01 satellite was launched into orbit on 14 January 2012, is the first operational satellite of the ZY3 series, and completed its official mission and stopped operation in 2017. As its continuation, ZY3-02 was successfully launched at Taiyuan Satellite Launch Center on 30 May 2016, and is still in operation. ZY3-02 carried a multispectral imager (MUX) and three panchromatic cameras (TLC). The multispectral imagery provides repetitive acquisition of multispectral data with a high resolution of 5.8 m, while panchromatic imagery of 2.1-m resolution is mainly used for 1:50,000 scale topographic mapping. The primary purpose of the ZY3 satellite constellation is to satisfy China’s need for satellite imagery for surveying and mapping and the geographic information system industry. Most studies of the ZY3-01 and ZY3-02 satellites have focused on geometric calibration, and minimal work has been performed on the radiometric calibration and validation, while quantitative applications such as surface albedo retrieval and aerosol parameter retrievals of ZY-01 and ZY-03 images require reliable radiometric information. Since the launch of ZY3-02, ZY3 satellite products have successfully played an important role in China’s environmental, agricultural, and other quantitative applications, which require reliable radiometric information.
The on-orbit absolute radiometric calibration of the satellite sensor is a critical activity in providing highly accurate quantitative measurements of the Earth’s surface [1]. Although the technical parameters of the satellite sensor have been accurately measured in the laboratory before launch, data from satellites are sensitive to post-launch changes, regardless of the quality of the calibration data. The absolute radiometric calibration of a satellite sensor is essential for maintaining stable satellite data quality and for identifying the relationship between the image digital number (DN) and at-sensor radiance [2,3]. Reflectance-based vicarious calibration was recognized as one of the most reliable approaches for on-orbit absolute radiometric calibration of satellite sensors [4]. This approach has been employed for on-orbit absolute radiometric calibration of numerous satellite sensors, such as Moderate Resolution Imaging Spectroradiometer (MODIS), Landsat-7 Enhanced Thematic Mapper Plus (ETM+), Landsat-8 Operational Land Imager (OLI), and the sensors loaded on IKONOS and SPOT satellites, as well as the multispectral cameras on board China’s Fengyun (FY), Ziyuan (CBERS), and Huanjing (HJ) satellites [5,6,7,8,9,10,11,12].
In this paper, we describe the methods and results of a reflectance-based vicarious calibration campaign that was conducted between July and September 2016 at Baotou Site, located in Inner Mongolia, China. A series of gray-scale permanent artificial targets and infrastructure has been built in the Baotou site to provide effective support for satellite sensor on-orbit calibration. A set of several radiometric calibration tarpaulins with nominal reflectance of 5%, 20%, 40%, and 60% were designed for the on-orbit absolute radiometric evaluation of the ZY3-02 satellite multispectral imager. The reflectance-based vicarious calibration approach relies on the synchronous measurement of the surface spectral reflectance and atmospheric parameters. In this campaign, the synchronous measurements of surface and atmospheric conditions (including aerosol optical depth, amount of water vapor, aerosol inversion products) at the Baotou site at the time of ZY3-02 satellite overpass. The synchronous measurement of the surface spectral reflectance and atmospheric parameters is coupled with exoatmospheric solar irradiance spectrum and relative spectral response of the sensor as inputs into a radiative transfer model to compute the at-sensor spectral radiance. The relationship between the at-sensor radiance and the DN recorded in the ZY3-02 satellite image is identified. We can obtain several different radiometric calibration coefficients determined with different target regions, such as gray-scale permanent artificial targets or radiometric calibration tarps with nominal reflectance. A detailed discussion on the validation analysis of the comparison results between the different radiometric calibration coefficients is presented in this paper. The aim of our study is to obtain a reliable and high-accuracy radiometric calibration coefficient for the ZY3-02 satellite sensor.

2. Materials

2.1. Overview of ZY3-02 Satellite

The ZY3-02 satellite was launched into a sun-synchronous orbit on 30 May 2016. It covers the global region every 59 days. The ZY3 satellite carries a multispectral imager (MUX) and three-line panchromatic cameras (TLC). The multispectral imagery provides repetitive acquisition of multispectral data with a high resolution of 5.8 m at ground sample distance (GSD), while the panchromatic imagery of 2.1 m resolution at GSD is mainly used for topographic purposes and is not discussed in this paper (Table 1).

2.2. ZY3-02 Multispectral Imager (MUX)

The ZY3-02 multispectral imager produces a GSD equal to 5.8 m at nadir in all four multispectral bands and a swath width of 51 km from a nominal altitude of 506 km. The normalized spectral response function of ZY3-02 MUX is shown in Figure 1. Several of the key characteristics of ZY3-02 MUX are listed in Table 2.

2.3. Calibration Site and Targets

2.3.1. Baotou Calibration Site

In 2013, the Committee on Earth Observation Satellites (CEOS) Working Group on Calibration and Validation (WGCV) Infrared and Visible Optical Sensors Subgroup (IVOS) established the Radiometric Calibration Network (RadCalNet), consisting of four international test sites located in the continental United States, France, China, and Namibia, providing automated in situ measurements and estimates of propagated top of atmosphere (TOA) reflectance [13]. The RadCalNet Baotou site (BTCN) is located in Inner Mongolia, China, about 50 km from Baotou city, as shown in Figure 2 (in red circle). It covers a flat area of approximately 300 km2. The site is dominated by sand and bare soil. A series of targets and infrastructure has been built in the Baotou site to provide effective support for sensor aerial test flights, satellite sensor on-orbit calibration and performance evaluation, and remote-sensing product validation [14,15].

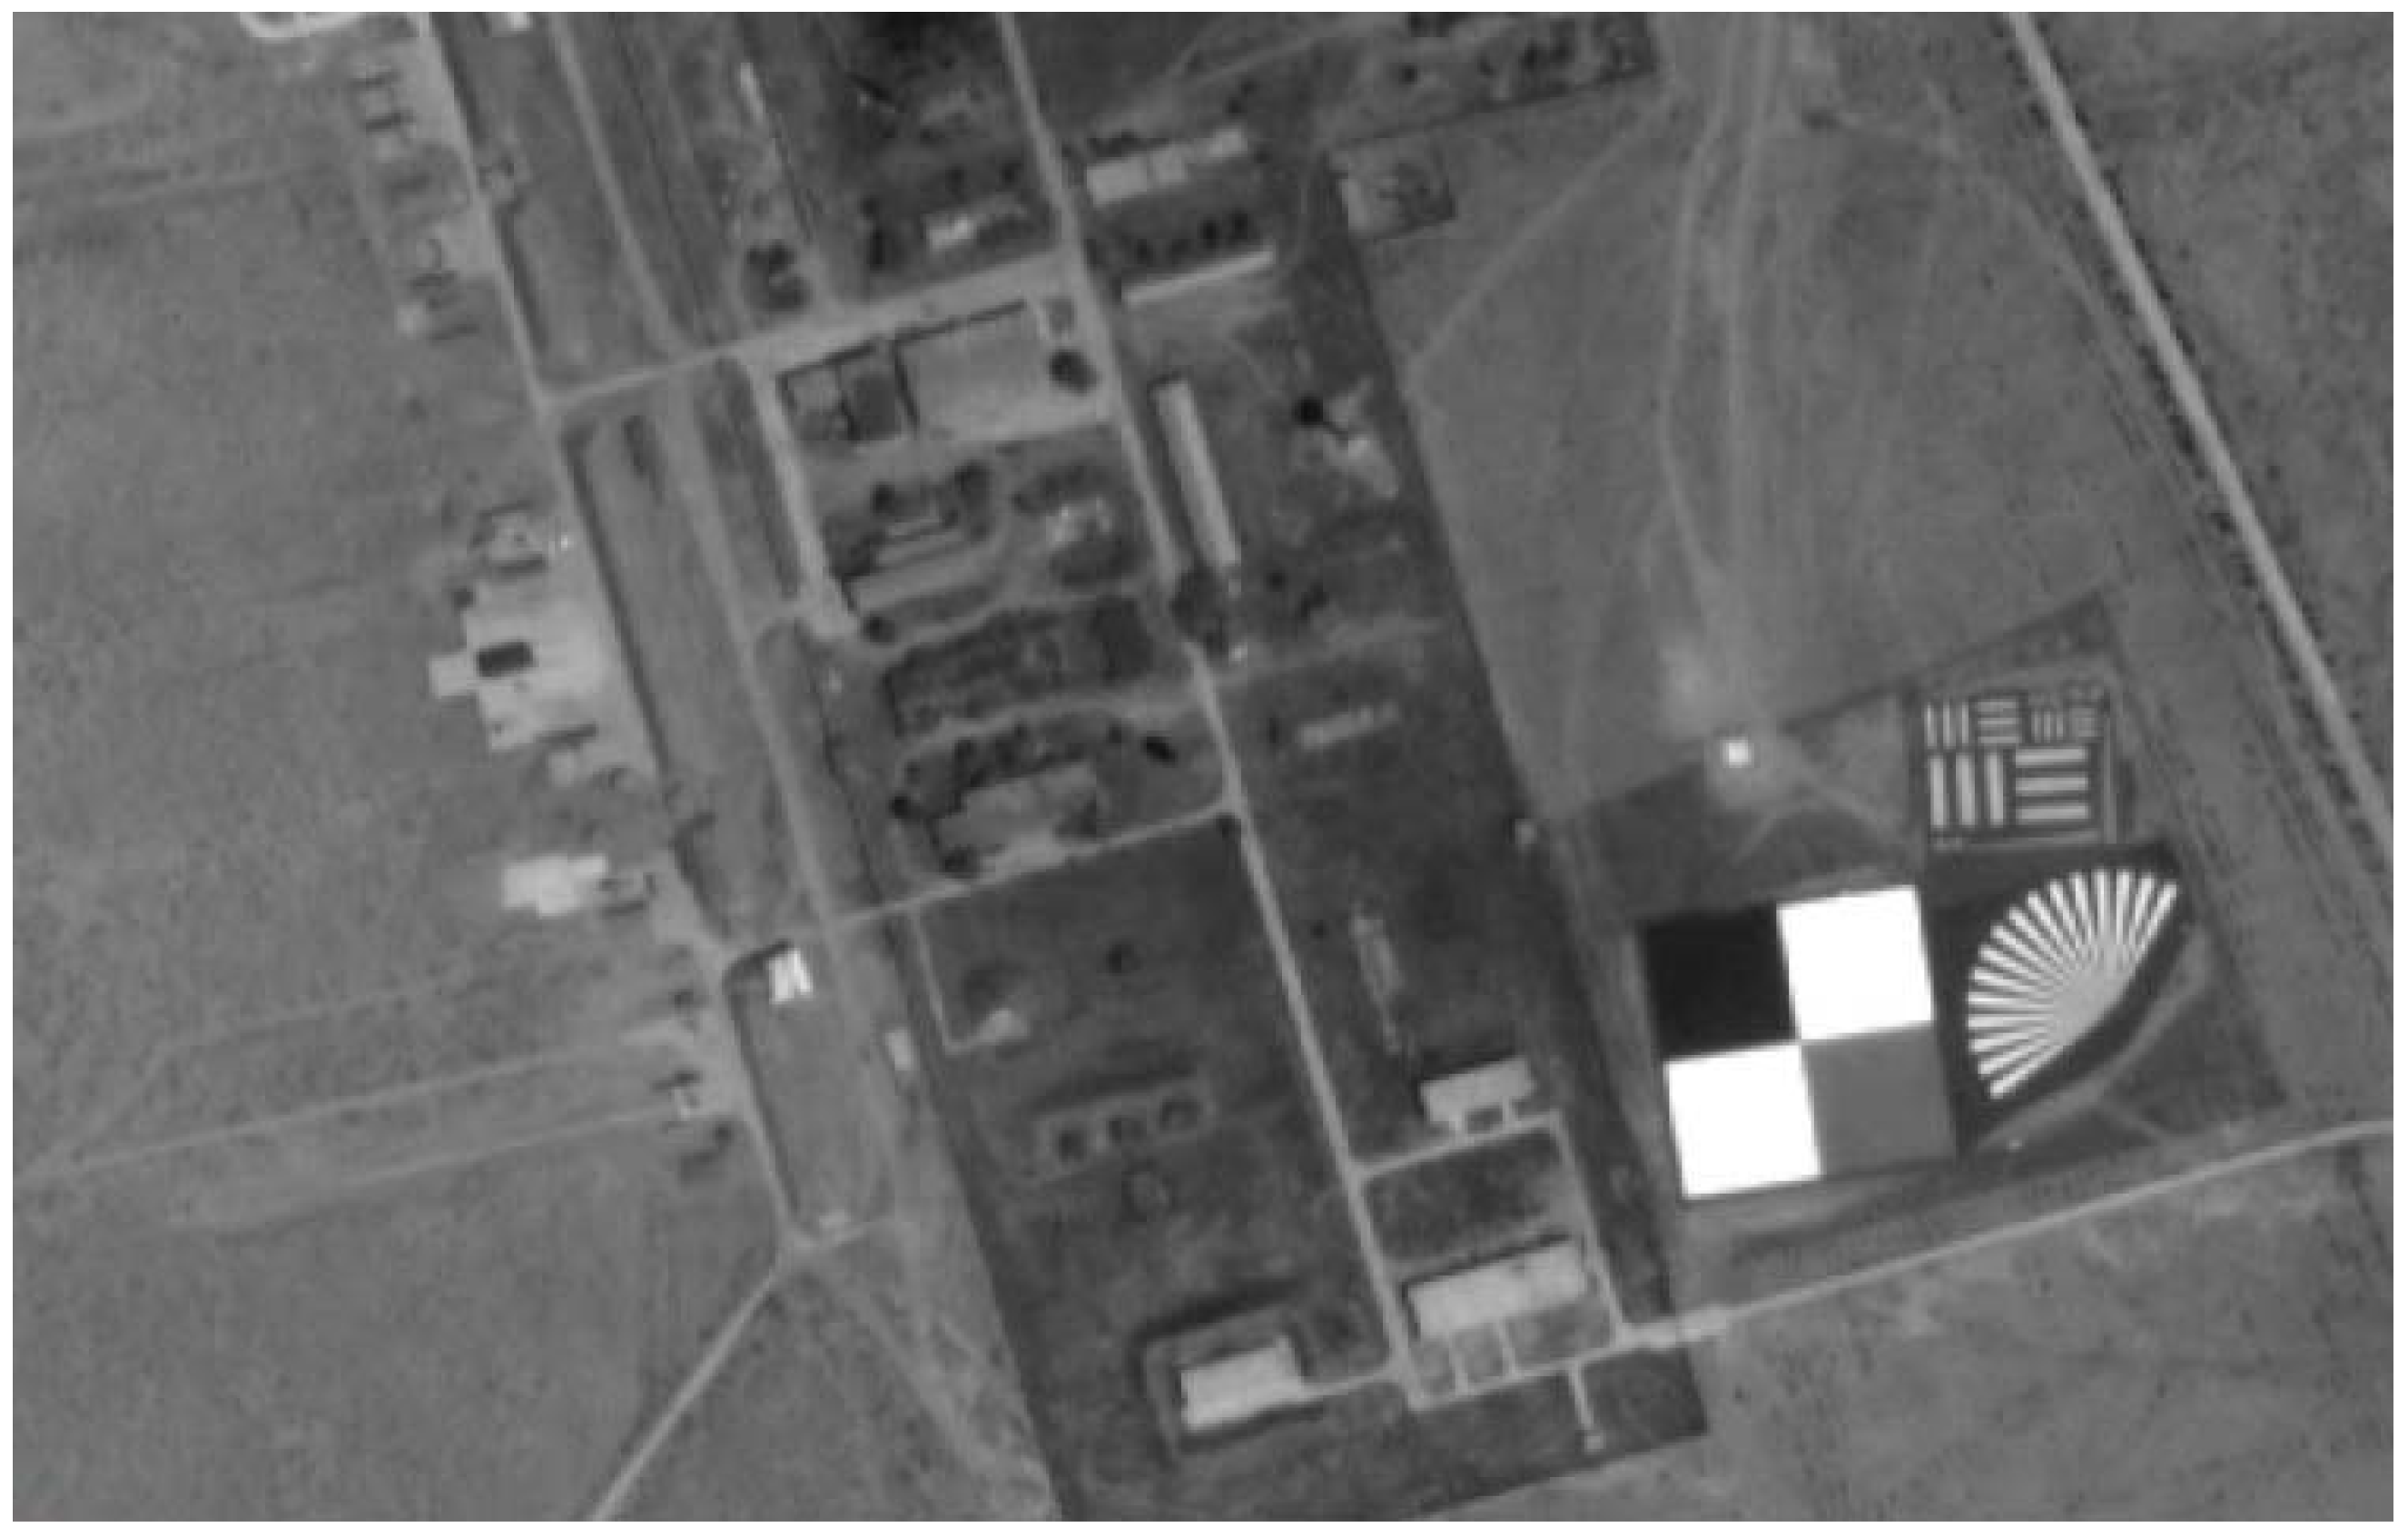
2.3.2. The Gray-Scale Permanent Artificial Targets

The Baotou site is currently maintained and operated by the Aerospace Information Research Institute, Chinese Academy of Science. A series of targets and infrastructure has been built in the Baotou site to provide effective support for satellite sensor on-orbit calibration and performance evaluation, and remote-sensing product validation. Figure 3 shows the gray-scale permanent artificial targets. The gray-scale permanent artificial targets are composed of two white, one gray, and one black uniform gravel squares, each of which covers an area of 48 m × 48 m, which can be used for radiometric calibration and validation of high-resolution optical sensors. The white, gray, and black targets with known spectral reflectance (56%, 18%, and 7%) have a fairly flat spectral reflectance [16].

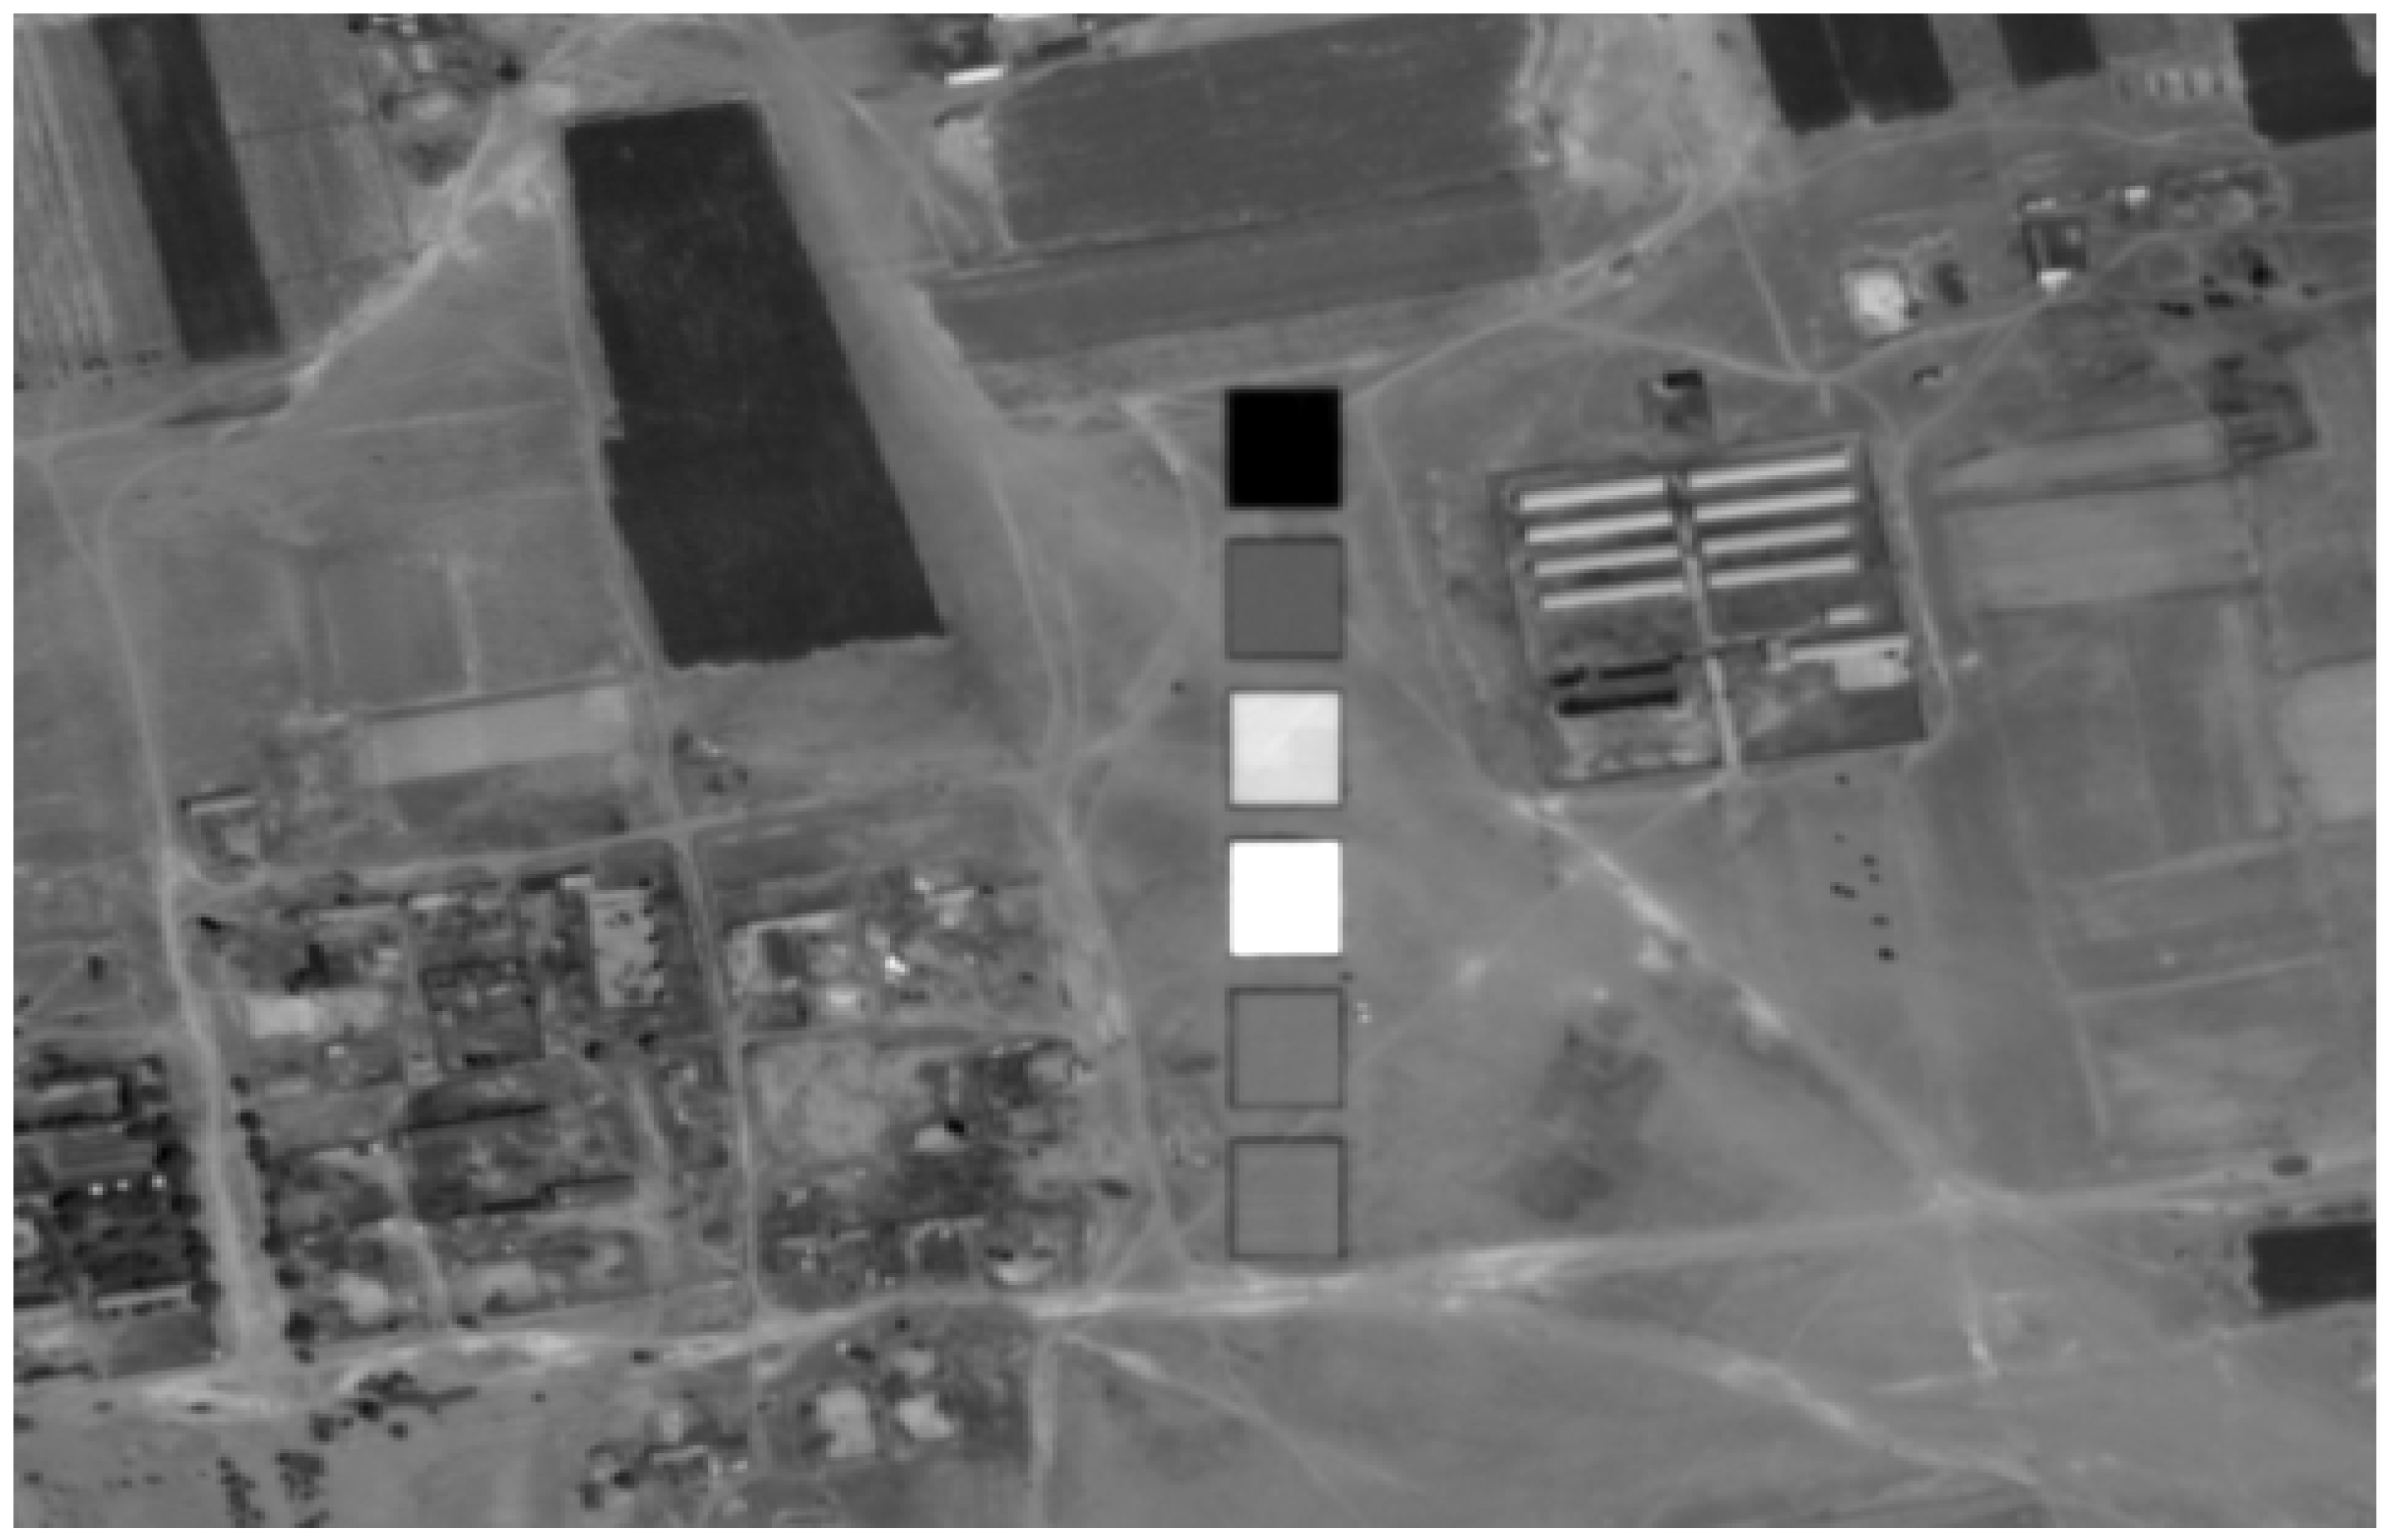
2.3.3. The Calibration Tarps

In order to properly calibrate the ZY3-02 MUX, a set of four radiometric calibration tarps with nominal reflectance of 5%, 20%, 40%, and 60% (with relatively stable reflectance curve around the nominal values with an error of less than 3%) was designed and deployed to the Baotou site. These four radiometric calibration tarps were designed as ideal calibration targets with good Lambertian properties measured and validated at the laboratory, which should be relatively flat with little variation (less than 7% of the nominal values) in the surface feature and be stable in a spectral sense. Two color-scaled radiometric tarps of blue and red were also designed with quasi-Lambertian properties for on-orbit absolute radiometric evaluation. Each of these calibration tarps covers an area of 60 m × 60 m. The spatial variation of each calibration tarp is less than 2%. The laboratory measured bi-directional reflectance factor (BRF) of the calibration tarp shows that the spectral variation of the four radiometric calibration tarps’ reflectance over 400–1000 nm is less than 3%. Figure 4 shows the arrangement of the calibration tarp at the Baotou site during the ZY3-02 calibration campaign.

3. Methodology

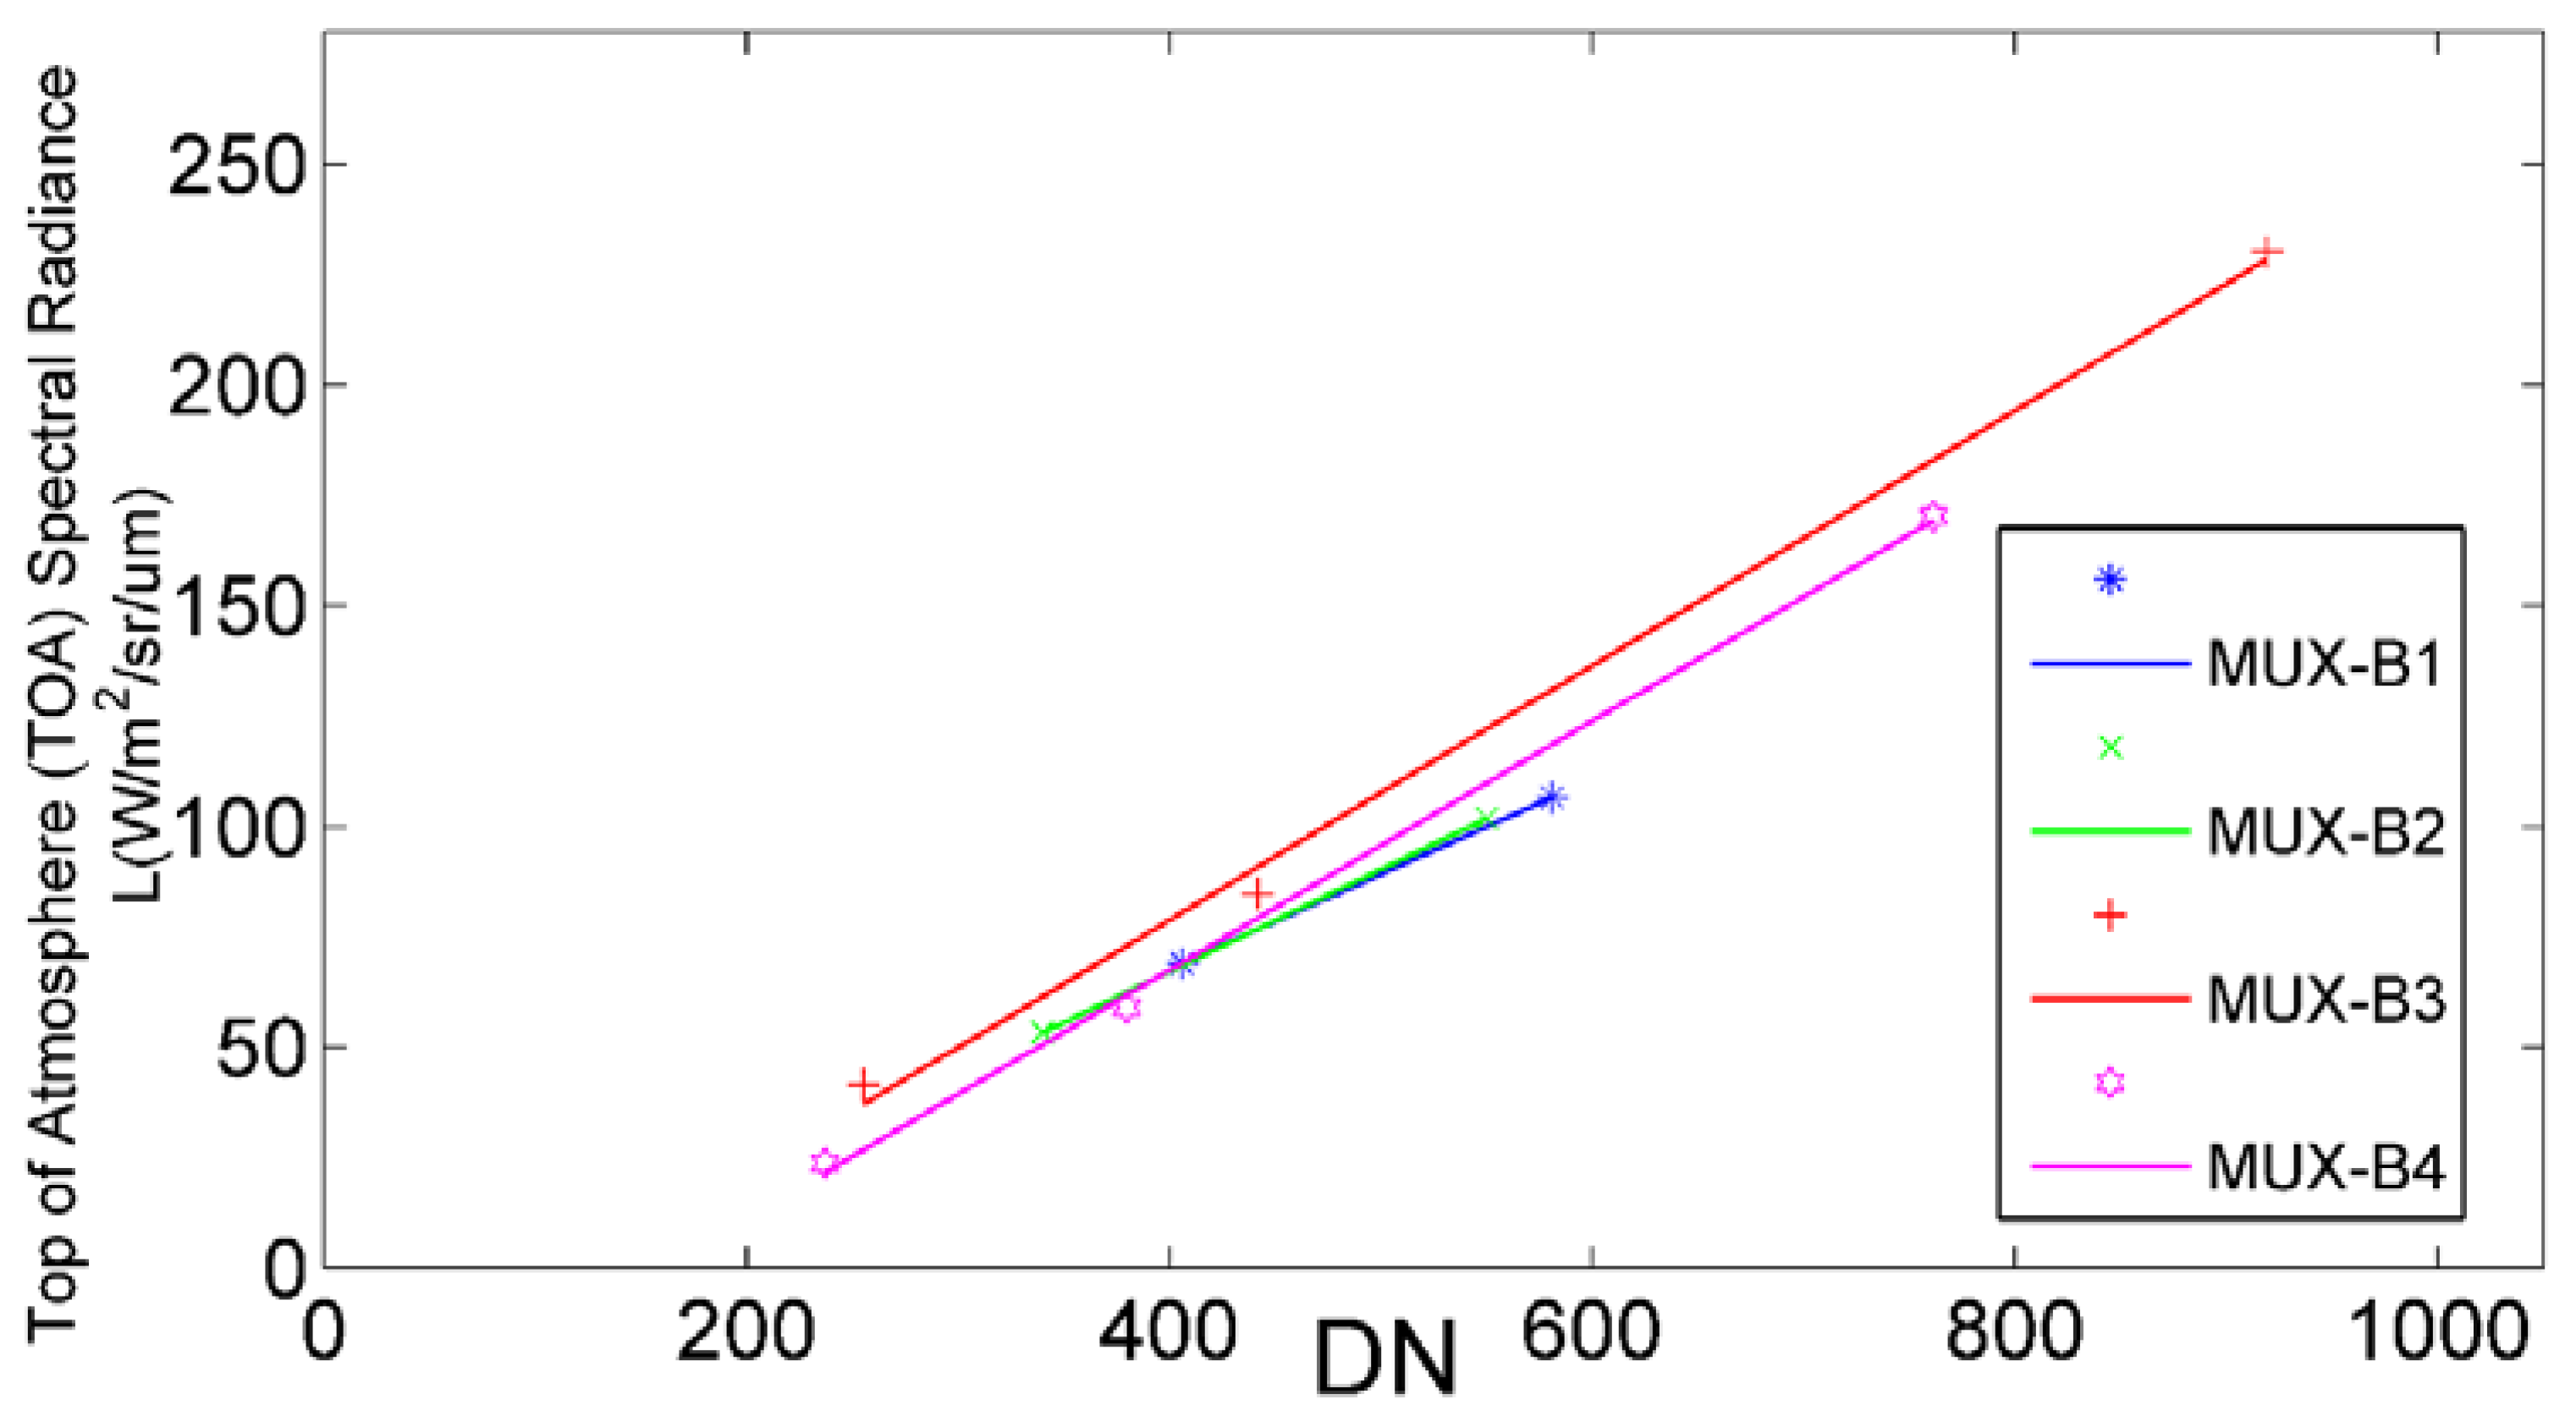
3.1. Radiometric Calibration Approaches

The reflectance-based vicarious calibration approach is the most commonly used method, which relies on synchronous measurement of the surface spectral reflectance and atmospheric parameters (including the aerosol optical depth and amount of water vapor). The measurement of the surface spectral reflectance and atmospheric parameters are required as inputs into a radiative transfer model, such as Moderate Resolution Atmospheric Transmission (MODTRAN 6.0), to compute the TOA spectral radiance. The simulated spectral radiance at the TOA from the radiative transfer model is matched with satellite DN and is used to obtain the sensor’s absolute radiometric calibration coefficients [17,18,19]. The flow chart of the reflectance-based vicarious calibration approach is shown in Figure 5.

3.2. Synchronous Measurement of Surface Reflectance

The reflectance measurements of the gray-scale permanent artificial targets and radiometric calibration tarps were collected within 30 min before and after the overpass time of the ZY3-02 satellite. The size of each gray-scale permanent artificial target is 48 m × 48 m, and covers about 8 cross-track pixels and 8 along-track pixels of ZY3-02 imagery. The spectroradiometer was configured to average five spectra per sample, and 16 samples were collected within each single target. During the measurements, the direction of the probe is nearly straight down, and, considering the Lambertian of the target, the error could be neglected [20]. The radiometric calibration tarps were 60 m × 60 m, covering about 10 cross-track pixels and 10 along-track pixels of ZY3-02 MUX imagery, five spectra per sample, and 25 samples were collected within each single tarp. The four gray-scale permanent artificial targets and six calibration tarps gave a total of 214 samples and more than 1000 spectra collected. It took more than 30 min to collect these data. The reflectance was measured by the SVC HR-1024i spectroradiometer (SVC Spectra Vista Corporation), which covered the wavelength range from 350 nm to 2500 nm. SVC HR-1024i is a high-resolution field portable spectroradiometer with a spectral resolution of 1.5 nm in the 350–1000 nm spectral range, 3.8 nm in the 1000–1890 nm spectral range, and 2.5 nm in the 1890–2500 nm spectral range. The output of the SVC software was interpolated at 1 nm intervals in the 350–2500 nm range. During spectra collection, five spectra were collected in each point and these five spectra were averaged to obtain the mean spectrum in this point. Figure 6 and Figure 7 show the reflectance measurements from the targets and tarps in the range of 400–1000 nm.

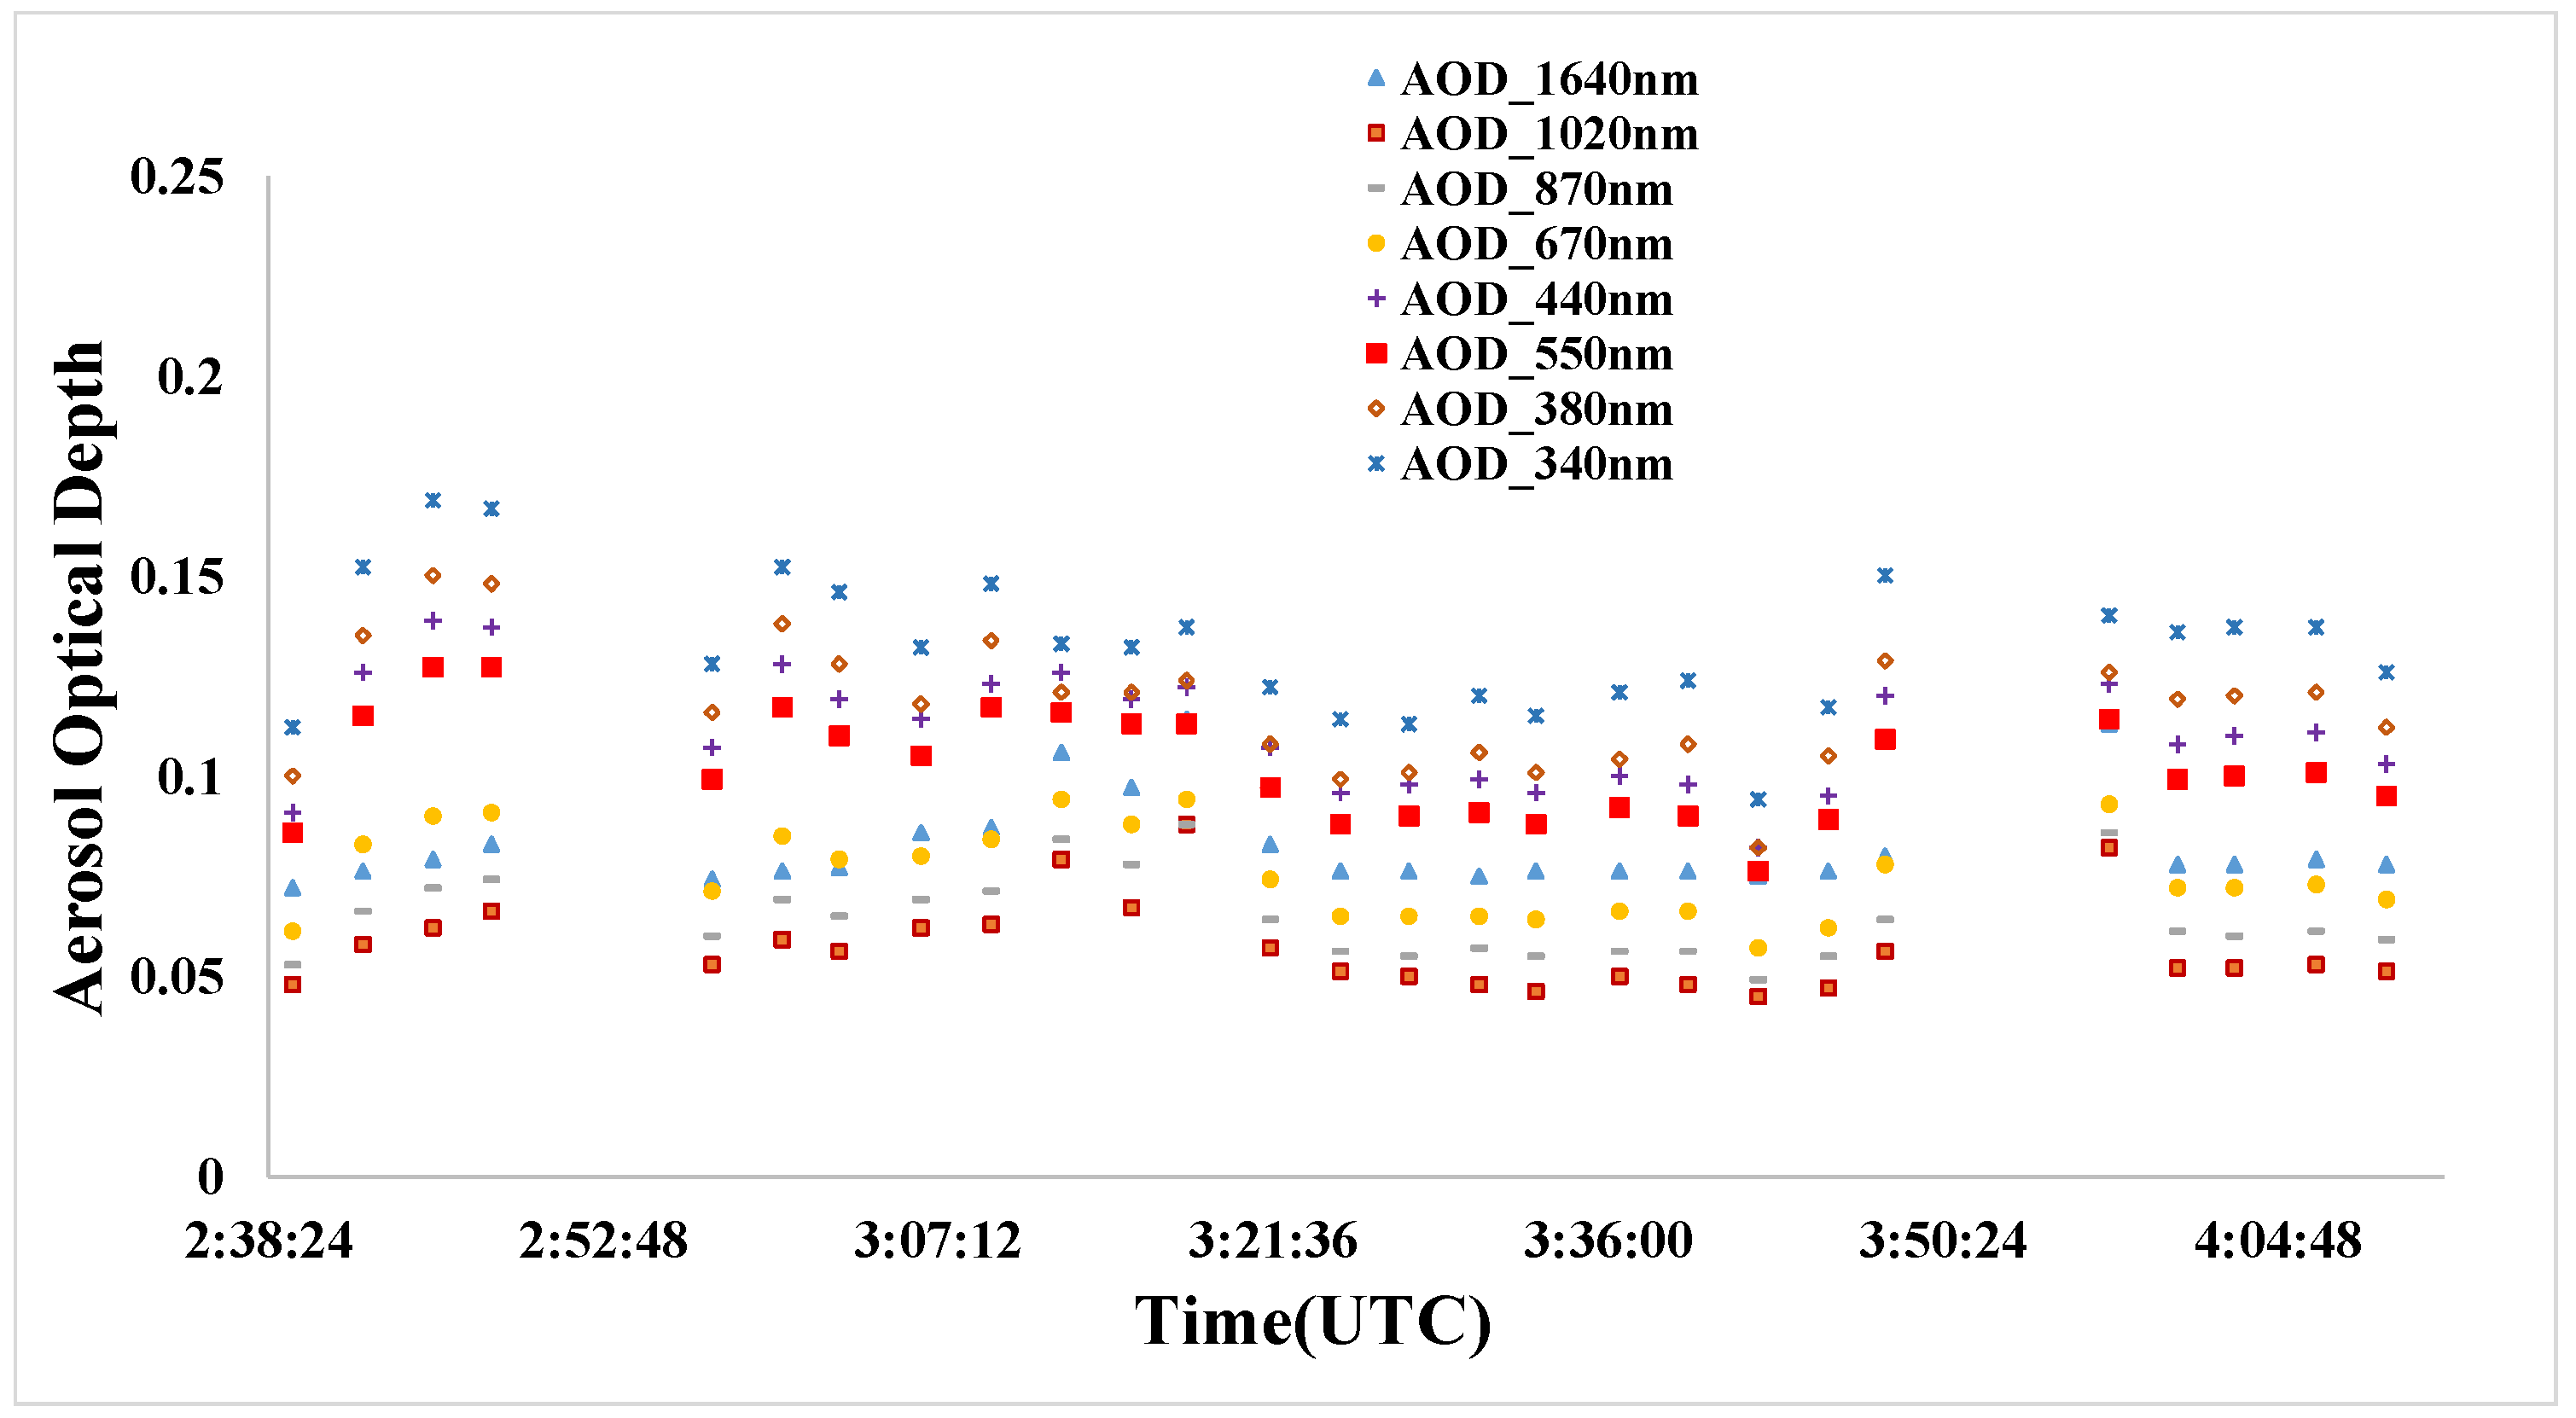
3.3. Synchronous Measurement of Atmospheric Parameters

Aerosol parameters were collected at the time of ZY3-02 satellite overpass. An automatic sun photometer (CIMEL CE318) was used to measure the aerosol optical depth (AOD) and the total columnar water vapor (CWV). The AOD and CWV were retrieved by the AERONET data process center from the CE318 sun photometer observed data at the Baotou site, which joined the Aerosol Robotic Network (AERONET) in September 2013. Figure 8 shows the measurement of atmospheric parameters of the AERONET Baotou site. The AOD at 550 nm is estimated from the Langley algorithm-derived AOD at the 440, 670, 870, and 1020 nm channels with the Ångström empirical equation, as follows:
τ α ( λ ) = β λ α
where τ α ( λ ) is AOD at the wavelength λ, β is Ångström’s turbidity coefficient, and α is the Ångström exponent; α and β are independent of the wavelength, and they can be calculated by fitting the AOD at the 440, 670, 870, and 1020 nm channels. Table 3 shows the synchronous measurement of atmospheric parameters at the time of ZY3-02 satellite overpass.
The vertical atmospheric profiles of temperature, humidity, and pressure were collected with a radiosonde balloon at the times of the ZY3-02 satellite overpass. In fact, one of the most important sources of systematic error in the reflectance-based vicarious calibration approach is caused by the assumption of aerosol properties including size distribution, refractive index, etc., which determine the microphysical status of aerosol particles affecting the complex interaction between light and aerosol particles [21]. In remote-sensing applications, the aerosol properties are assumed empirically as several types, resulting in a lot of error in radiometric calibrations. However, AERONET directly produced aerosol properties specifically for this scenario, minimizing the error. The simulation of the radiative transfer model shows that the top of atmosphere spectral radiance is highly sensitive with different aerosol properties in a high-aerosol optical depth condition. In other words, the assumption of aerosol properties would bring a large error in predicting the top of atmosphere spectral radiance [22,23]. In order to reduce the uncertainty caused by the aerosol properties assumption, we used the inversion products of the AERONET Baotou site. AERONET collaboration provides the aerosol inversion products (such as size distribution, refractive index, phase function, and asymmetry factor) of the Baotou site. The aerosol inversion products from AERONET collaboration would be taken as the input of a radiative transfer model to calculate the band-specific TOA radiance in this study, to overcome the abovementioned problems of the reflectance-based approach.

3.4. Radiative Transfer Calculations

The Radiative Transfer Model (MODTRAN 6.0) is commonly used for radiometric calibration. The reflectance measurements and the atmospheric parameters are inputs for a Radiative Transfer Model that computes a band-specific TOA spectral radiance (also known as at-sensor radiance). The apparent reflectance of the ZY-3 02 satellite sensor ρ * ( μ s , ϕ s ; μ v , ϕ v ) can be expressed as:
ρ * ( μ s , μ v , ϕ s ϕ v ) = ρ a ( λ ) + ρ 1 S ( λ ) ρ T θ s ( λ ) T θ v ( λ )
where μ s = cos θ s and μ v = cos θ v are the cosine values of the solar and viewing zenith angles, θ s is the solar zenith angle, ϕ s is the solar azimuth angle, θ v is the viewing zenith angle, and ϕ v is the viewing azimuth angle. ρ a ( λ ) is the atmospheric path reflectance, S ( λ ) is the atmospheric spherical albedo, T θ s ( λ ) is total transmittance from the solar to the earth, and T θ v ( λ ) is the total transmittance from the earth to the satellite sensor [24]. The band-specific TOA radiance L ( θ s , ϕ s ; θ v , ϕ v ) can be determined as follows:
L ( θ s , ϕ s ; θ v , ϕ v ) = μ s E s ρ * π d 2
where ρ * is the apparent reflectance of the satellite sensor, μ s = cos θ s is the cosine values of the solar zenith angles, θ s is the solar zenith angles, E s is the solar irradiance at the top of atmosphere, and d is the Solar–Earth distance factor.
We acquired one calibratable ZY3-02 MUX image, with a viewing zenith angle of less than 2 degrees under clear-sky conditions. Table 4 shows the geometric conditions of ZY3-02 for radiometric calibration.

4. Results

4.1. Comparison of Three Radiometric Calibration Results from Different Targets

The radiometric calibration coefficients of ZY3-02 MUX were determined through the least-squares method, linearly fitting band-specific TOA spectral radiance with DNs corresponding to the target regions by using Equation (4):
L i = G a i n i × D N i + B i a s i
where L i is the band-specific TOA spectral radiance with unit W · m 2 · s r 1 · μ m 1 , D N i is the digital number of the satellite imagery in band i , and G a i n i and B i a s i are the radiometric calibration coefficients Gain and Bias in band i .
There would be three radiometric calibration results from different targets. The first radiometric calibration coefficient (coefficient A, as shown in Figure 9) was determined by permanent artificial targets, which just covered three gray-scale reflectances of 7%, 18%, and 56% in 400–1000 nm.
The second coefficient (coefficient B, as shown in Figure 10) was determined by the four radiometric calibration tarps with four nominal reflectances of 5%, 20%, 40%, and 60%, and two color-scaled radiometric tarps of blue and red.
The last coefficient (coefficient C, as shown in Figure 11) was determined by combining permanent artificial targets and radiometric calibration tarps, which means that there would be seven gray-scale targets and two color-scaled targets. All the calibration results show that linear correlations between DN and TOA radiances of ZY3-02 MUX are very high, with a correlation coefficient R 2 value of up to 0.99 for each band.
Table 5 shows the three different radiometric calibration coefficients and laboratory calibration coefficients.

4.2. Uncertainty Analysis of the Reflectance-Based Approach

Early work with Landsat-7 ETM+, Landsat-8 OLI, SPOT HRV, IKONOS, RapidEye, and KOMPSAT showed that the reflectance-based approach had an absolute radiometric uncertainty of ~5% [6,20,21,22,23]. The reflectance-based uncertainty table listed the major source of radiometric uncertainty of the reflectance-based approach. Detailed descriptions of the uncertainty were discussed as follows. There are several basic areas of uncertainty in the method: (1) Surface reflectance measurement, (2) Atmospheric characterization, and (3) Inherent accuracy of the MODTRAN 6.0 radiative transfer code.
The uncertainty in a single measurement of the surface reflectance with SVC HR1024 spectroradiometer is <2%. Based on the laboratory calibration tarp BRDF measurements, we can assign a 1.5% error accuracy for assuming a Lambertian calibration tarp. The view zenith angle of ZY3-02 MUX was less than 3 degrees, and the BRDF effects of the artificial calibration targets and calibration tarps were not considered in this study.
The second primary source of uncertainty in the reflectance-based approach is atmospheric characterization, which includes the aerosol optical depth measurement, total columnar water vapor, aerosol size distribution, and aerosol complex index of refraction. The AOD and CWV were retrieved by the AERONET data process center at the AOE Baotou site, and they led to the TOA radiance uncertainties of 0.5% for AOD and 0.4% for CWV. A standard rural aerosol type in the MODTRAN 6.0 radiative transfer code was used in this study. The two parameters of aerosol (the aerosol size distribution and the aerosol complex index of refraction) resulted in uncertainties of TOA radiance less than 2.0% for aerosol size distribution and 2.5% for aerosol complex index of refraction, respectively. The inherent accuracy of the MODTRAN 6.0 radiative transfer code is <1%.
All of the analyzed uncertainty sources above were assumed independent, and the overall uncertainty in the TOA radiance in this reflectance-based approach is 4.57%, less than 5%, as shown in Table 6.

4.3. Validation of Three Radiometric Calibration Coefficients

For the automated radiometric calibration and validation of moderate and high-resolution satellite sensors, a desert area (300 m × 300 m) was established in October 2015. This is 1.8 km away from the permanent target region to the north-west and has been flattened. Figure 12 shows the desert area at Baotou site. The distance between the gray-scale permanent artificial targets and the desert area is approximately 3 km.
In order to validate the reliability of the three radiometric calibration results, the desert area (300 × 300 m2) was taken as a validation target. We obtain the surface reflectance of the desert and the atmospheric parameters (AOD and CWV). The TOA predicted radiance of the target L p r e d i c t e d can be calculated with the radiative transfer model MODTRAN.
L p r e d i c t e d = ρ λ E S U N cos θ S Z A π d 2
The average DN values of the desert area were extracted from ZY3-02 MUX imagery. The measured radiance L m e a s u r e d was radiometrically calibrated from DN with three different coefficients, and was compared with the TOA predicted radiance.
L m e a s u r e d = G a i n i × D N + B i a s i
Δ L % = | L m e a s u r e d L p r e d i c t e d L p r e d i c t e d | × 100 %
where L m e a s u r e d is the TOA measured radiance, and Δ L % is the relative difference between the TOA predicted radiance and the TOA measured radiance.
With regard to the comparison between the measured radiance and TOA predicted radiance in Table 7, the relative difference between measured radiance C and TOA predicted radiance were lowest for the blue band (2.25%), followed by the green band (2.52%), red band (2.91%), and NIR band (2.98%), less than 3% in all bands (Figure 13). The calibration result of combining the permanent artificial targets and the radiometric calibration tarps (coefficient C) shows the best agreement between the measured radiance and TOA predicted radiance. Largest relative differences occurred in the laboratory radiometric calibration results, which indicated that the on-orbit radiometric calibration is a critical activity that must be regularly performed.

4.4. Cross-Validation with Landsat-8 OLI Using the Three Determined Radiometric Calibration Coefficients

To further validate the reliability of the abovementioned three radiometric calibration results, the calibrated ZY3-02 MUX was compared with Landsat-8 Operational Land Imager (OLI), which is considered as a reference sensor of ZY3-02. The radiometric accuracy of Landsat-8 OLI is typically within 3% for all solar-reflective bands [24]. The Dunhuang test site was carefully selected as reference standard test site for cross-validation of ZY3-02 MUX with Landsat-8 OLI. The Dunhuang test site was China’s national radiometric calibration site, which had been used to calibrate the Chinese satellites such as Feng-Yun series of satellites and the Gao-Fen series of satellites [25]. Figure 14 shows the Dunhuang test site in Landsat-8 OLI and ZY3-02 MUX imagery.
The Dunhuang test site was used for cross-validation based on the stability and homogeneity of the Gobi Desert (Figure 15).
Figure 16 shows the flow chart of cross-validation with Landsat-8 OLI. The corresponding subset areas with 900 × 900 m from ZY3-02 and Landsat-8 were selected to acquire the homogenous areas within the Dunhuang Gobi site. In the case of ZY3-02 MUX, a total of 150 × 150 pixels were used, while Landsat-8 OLI was 30 × 30 pixels. Table 8 shows geometric conditions of ZY3-02 and Landsat-8 OLI for cross-calibration.
The TOA radiance of the ZY3-02 sensor is calculated by Formula (8).
L m e a s u r e d M U X = G a i n × D N + B i a s
where L m e a s u r e d M U X is the TOA radiance at ZY3-02 MUX band, expressed in units of W · m 2 · s r 1 · μ m 1 . D N is the digital number from the reference satellite imagery. G a i n and B i a s are the official calibration coefficients in units of W · m 2 · s r 1 · μ m 1 .
As the relative spectral responses (RSR) of each band from “reference sensor” Landsat-8 OLI and “sensor to calibrate” ZY3-02 MUX were strictly different, the TOA radiance of Landsat-8 OLI imagery needed to be transferred to ZY3-02 sensor imagery with a spectral band adjustment factor (SBAF).
The differences in the RSR between different satellite sensor were compensated by SBAF, as in Formula (9).
S B A F M U X / O L I R a d i a n c e = L M U X ( λ ) R S R M U X ( λ ) d λ R S R M U X ( λ ) d λ L O L I ( λ ) R S R O L I ( λ ) d λ R S R O L I ( λ ) d λ
The TOA radiances of the Landsat-8 OLI imagery were transferred to ZY3-02 sensor imagery by the formula which follows, in which L O L I S B A F is the TOA radiance from “reference sensor” Landsat-8 OLI after SBAF correction.
L O L I S B A F = L O L I × S B A F M U X / O L I R a d i a n c e
The average relative difference (ARD) between the TOA radiance from Landsat-8 OLI after SBAF correction L O L I S B A F and the TOA radiance of the ZY3-02 MUX L m e a s u r e d M U X is:
A R D = m e a n ( L O L I S B A F L m e a s u r e d M U X L O L I S B A F ) × 100 %
Finally, the calibrated ZY3-02 MUX with coefficient C shows the best cross-validation results, and the average relative difference between ZY3-02 MUX Measured TOA Radiance and Landsat-8 OLI TOA radiance after SBAF correction is less than 3.5% in all bands of ZY3-02 MUX (Table 9, Figure 17). The Dunhuang Gobi cross-validation results also show good agreement with the Baotou desert area validation results. The results show that radiometric calibration coefficient C of combining the permanent artificial targets and the radiometric calibration tarps is best.

5. Conclusions

In this study, the methods and results of a reflectance-based vicarious calibration campaign were described. The relationship between the DN and TOA radiance exploiting radiometric calibration coefficients was obtained via an absolute radiometric calibration campaign at the RadCalNet Baotou site. We obtained three radiometrically calibrated coefficients of ZY3-02 MUX using different targets and tarps. The calibration results show that linear correlations between DN and TOA radiances of ZY3-02 MUX are very high, with a correlation coefficient R 2 value of up to 0.99 for each band. A detailed discussion on the uncertainty analysis of the radiometric calibration is presented in this paper, and the overall uncertainty of this reflectance-based approach is 4.57%.
The aim of our study was to obtain a reliable and high-accuracy radiometric calibration coefficient for ZY3-02 MUX. In order to consolidate the ZY3-02 MUX absolute radiometric calibration, the three calibration coefficients were validated by the synchronous measurement of surface reflectance and atmospheric characterization in the RadCalNet Baotou desert site, and also cross-validated with Landsat-8 OLI in the Dunhuang Gobi site. A detailed discussion on the validation analysis of the comparison results between the different radiometric calibration coefficients is presented in this paper. The reasonably good agreement of the radiometrically calibrated coefficients of the ZY3-02 MUX is encouraging, which shows that the percentage difference in coefficient C was within 4% in the MUX bands. The radiometric coefficient C was determined by combining permanent artificial targets and radiometric calibration tarps, which means that there would be seven gray-scale targets and two color-scaled targets. It should be noted that absolute radiometric calibration incorporating the permanent gray-scale target and calibration tarps significantly enhances the accuracy and quality. The results also indicate that radiometric characteristics of ZY3-02 are reliable and high-accuracy quantitative applications. The radiometric calibration coefficients would be useful for users when utilizing ZY3-02 MUX imagery.

Author Contributions

H.T. developed the research plan and supervised the work, and J.X., X.T., W.C. and Q.L. participated in the literature review, method selection, data acquisition, and discussions. All authors have read and agreed to the published version of the manuscript.

Funding

This work was supported by the National Key R&D Program of China, 2018YFB0504800, 2018YFB0504801.

Institutional Review Board Statement

Not applicable.

Informed Consent Statement

Not applicable.

Data Availability Statement

Not applicable.

Conflicts of Interest

The authors declare no conflict of interest.

References

  1. Thome, K.J. Absolute Radiometric Calibration of Landsat 7 ETM+ Using the Reflectance-Based Method. Remote Sens. Environ. 2001, 78, 27–38. [Google Scholar] [CrossRef]
  2. Biggar, S.F.; Dinguirard, M.C.; Gellman, G.I.; Henry, P.; Jackson, R.D.; Moran, M.S.; Slater, P.N. Radiometric Calibration of SPOT 2 HRV-a Comparison of Three Methods. Proc. SPIE 1991, 1493, 155–162. [Google Scholar]
  3. Dinguirard, M.; Slater, P.N. Calibration of Space-Multispectral Imaging Sensors: A Review. Remote Sens. Environ. 1999, 68, 194–205. [Google Scholar] [CrossRef]
  4. Gao, H.L.; Gu, X.F.; Yu, T. The Research Overview on Visible and Near-infrared Channels Radiometric Calibration of Space-borne Optical Remote Sensors. Remote Sens. Inf. 2010, 4, 12. [Google Scholar]
  5. Frouin, R.; Gautier, C. Calibration of NOAA-7 AVHRR, GOES-5, and GOES-6 VISSR/VAS solar channels. Remote Sens. Environ. 1987, 22, 73–101. [Google Scholar] [CrossRef] [Green Version]
  6. Pagnutti, M.; Ryan, R.E.; Kelly, M.; Holekamp, K.; Zanoni, V.; Thome, K.; Schiller, S. Radiometric characterization of IKONOS multispectral imagery. Remote Sens. Environ. 2003, 88, 53–68. [Google Scholar] [CrossRef] [Green Version]
  7. Xiong, X.; Barnes, W.; Xie, X.; Salomonson, V. On-orbit performance of Aqua MODIS on-board calibrators. Proc. SPIE 2005, 5978, 75–80. [Google Scholar]
  8. Ponzoni, F.J.; Junior, J.Z.; Lamparelli, R. In-flight absolute calibration of the CBERS-2 CCD sensor data. An. Acad. Bras. Ciênc. 2008, 80, 799–804. [Google Scholar] [CrossRef] [Green Version]
  9. Hu, X.; Liu, J.; Sun, L.; Rong, Z.; Li, Y.; Zhang, Y.; Zheng, Z.; Wu, R.; Zhang, L.; Gu, X. Characterization of CRCS Dunhuang test site and vicarious calibration utilization for Fengyun (FY) series sensors. Can. J. Remote Sens. 2010, 36, 566–582. [Google Scholar] [CrossRef]
  10. Naughton, D.; Brunn, A.; Czapla-Myers, J.; Douglass, S.; Thiele, M.; Weichelt, H.; Oxfort, M. Absolute radiometric calibration of the RapidEye multispectral imager using the reflectance-based vicarious calibration method. J. Appl. Remote Sens. 2011, 5, 3544. [Google Scholar] [CrossRef]
  11. Pinto, C.; Ponzoni, F.; Castro, R.; Leigh, L.; Mishra, N.; Aaron, D.; Helder, D. First in-Flight Radiometric Calibration of MUX and WFI on-Board CBERS-4. Remote Sens. 2016, 8, 405. [Google Scholar] [CrossRef] [Green Version]
  12. Liu, Y.K.; Ma, L.L.; Wang, N.; Qian, Y.G.; Zhao, Y.G.; Qiu, S.; Gao, C.X.; Long, X.X.; Li, C.R. On-orbit radiometric calibration of the optical sensors on-board SuperView-1 satellite using three independent methods. Opt. Express 2020, 28, 11085–11105. [Google Scholar] [CrossRef] [PubMed]
  13. Bouvet, M.; Thome, K.; Berthelot, B.; Bialek, A.; Czapla-Myers, J.; Fox, N.P.; Goryl, P.; Henry, P.; Ma, L.; Marcq, S.; et al. RadCalNet: A Radiometric Calibration Network for Earth Observing Imagers Operating in the Visible to Shortwave Infrared Spectral Range. Remote Sens. 2019, 11, 2401. [Google Scholar] [CrossRef] [Green Version]
  14. Li, C.; Ma, L.; Gao, C.; Tang, L.; Wang, N.; Liu, Y.; Zhao, Y.; Dou, S.; Zhang, D.; Li, X. Permanent target for optical payload performance and data quality assessment: Spectral characterization and a case study for calibration. J. Appl. Remote Sens. 2014, 8, 083498. [Google Scholar] [CrossRef]
  15. Li, C.R.; Tang, L.L.; Ma, L.L.; Zhou, Y.S.; Gao, C.X.; Wang, N.; Li, X.H.; Wang, X.H.; Zhu, X.H. A comprehensive calibration site for high resolution remote sensors dedicated to quantitative remote sensing and its applications. Natl. Remote Sens. Bull. 2021, 25, 198–219. [Google Scholar]
  16. Liu, Y.; Ma, L.; Wang, N.; Qian, Y.; Qiu, S.; Li, C.; Tang, L. Vicarious radiometric calibration/validation of Landsat-8 operational land imager using a ground reflected radiance-based approach with Baotou site in China. J. Appl. Remote Sens. 2017, 11, 044004. [Google Scholar] [CrossRef]
  17. Kim, J.; Jin, C.; Choi, C.; Ahn, H. Radiometric characterization and validation for the KOMPSAT-3 sensor. Remote Sens. Lett. 2015, 6, 529–538. [Google Scholar] [CrossRef]
  18. Yeom, J.-M.; Hwang, J.; Jung, J.-H.; Lee, K.-H.; Lee, C.-S. Initial Radiometric Characteristics of KOMPSAT-3A Multispectral Imagery Using the 6S Radiative Transfer Model, Well-Known Radiometric Tarps, and MFRSR Measurements. Remote Sens. 2017, 9, 130. [Google Scholar] [CrossRef] [Green Version]
  19. Jin, C.; Ahn, H.; Seo, D.; Choi, C. Radiometric Calibration and Uncertainty Analysis of KOMPSAT-3A Using the Reflectance-Based Method. Sensors 2020, 20, 2564. [Google Scholar] [CrossRef]
  20. Chen, W.; Yan, L.; Li, Z.; Jing, X.; Duan, Y.; Xiong, X. In-flight absolute calibration of an airborne wide-view multispectral imager using a reflectance-based method and its validation. Int. J. Remote Sens. 2013, 34, 1995–2005. [Google Scholar] [CrossRef]
  21. Chen, W.; Zhao, H.; Li, Z.; Jing, X.; Yan, L. Uncertainty evaluation of an in-flight absolute radiometric calibration using a statistical Monte Carlo method. IEEE Trans. Geosci. Remote Sens. 2015, 53, 2925–2934. [Google Scholar] [CrossRef]
  22. Biggar, F.S.; Slater, P.N.; Gellman, D.I. Uncertainties in the in-Flight Calibration of Sensors with Reference to Measured Ground Sites in the 0.4–1.1 um Range. Remote Sens. Environ. 1994, 48, 245–252. [Google Scholar] [CrossRef]
  23. Markham, B.; Thome, K.; Barsi, J.; Kaita, E.; Helder, D.; Barker, J.; Scaramuzza, P. Landsat-7 ETM+ on-orbit reflective-band radiometric stability and absolute calibration. IEEE Trans. Geosci. Remote Sens. 2004, 42, 2810–2820. [Google Scholar] [CrossRef]
  24. Czapla-Myers, J.; McCorkel, J.; Anderson, N.; Thome, K.; Biggar, S.; Helder, D.; Aaron, D.; Leigh, L.; Mishra, N. The ground-based absolute radiometric calibration of Landsat 8 OLI. Remote Sens. 2015, 7, 600–626. [Google Scholar] [CrossRef] [Green Version]
  25. Gao, H.; Gu, X.; Yu, T.; Sun, Y.; Liu, Q. Cross-Calibration of GF-1 PMS Sensor With Landsat 8 OLI and Terra MODIS. IEEE Trans. Geosci. Remote Sens. 2016, 54, 4847–4854. [Google Scholar] [CrossRef]
Figure 1. Normalized spectral response function of the ZY3 MUX.
Sensors 22 02066 g001
Figure 2. The RadCalNet Baotou site.
Sensors 22 02066 g002
Figure 3. The gray-scale permanent artificial targets at RadCalNet Baotou site.
Sensors 22 02066 g003
Figure 4. The arrangement of the calibration tarps at the RadCalNet Baotou site.
Sensors 22 02066 g004
Figure 5. Flow chart of the reflectance-based radiometric calibration approach.
Sensors 22 02066 g005
Figure 6. Spectral reflectance measurement data of gray-scale permanent targets.
Sensors 22 02066 g006
Figure 7. Spectral reflectance measurement data of calibration tarps.
Sensors 22 02066 g007
Figure 8. The measurement of atmospheric parameter of AERONET Baotou site.
Sensors 22 02066 g008
Figure 9. Calibration result of the gray-scale permanent artificial targets (coefficient A).
Sensors 22 02066 g009
Figure 10. Calibration result of the radiometric calibration tarps (coefficient B).
Sensors 22 02066 g010
Figure 11. Calibration result of combining the permanent artificial targets and the radiometric calibration tarps (coefficient C).
Sensors 22 02066 g011
Figure 12. The desert area at Baotou calibration site.
Sensors 22 02066 g012
Figure 13. The relative difference between the TOA predicted and measured radiance with different coefficients.
Sensors 22 02066 g013
Figure 14. The Dunhuang test site in Landsat-8 OLI and ZY3-02 MUX imagery.
Sensors 22 02066 g014
Figure 15. Surface reflectance and standard deviation of Gobi in Dunhuang test site.
Sensors 22 02066 g015
Figure 16. Flow chart of cross-validation with Landsat-8 OLI.
Sensors 22 02066 g016
Figure 17. The relative difference between the Landsat-8 OLI TOA radiance after SBAF correction and the measured radiance with different coefficients.
Sensors 22 02066 g017
Table 1. The technical specification of ZY3-02 Satellite.
ZY3-02 SatelliteTechnical Specification
Launch ScheduleMay 2016
OrbitAltitude: 506 km
Type: sun-synchronous,
Equator Crossing time: 10:30 AM
Cycle: 97 min
Mission duration5 Years
Image Band of Remote SensorPanchromatic and multi-spectral (Four-band: blue, green, red, NIR)
Spatial resolutionPanchromatic: nadir-view: 2.1 m (GSD)
forward-view (+22°): 2.5 m (GSD)
backward-view (−22°): 2.5 m (GSD)
Multi-spectral: nadir-view: 5.8 m (GSD)
Dynamic Range10 bits/pixel; time-delayed integral imaging
Swath width51 km
Attitude determination and controlThree-axis stabilization
Sensors: star sensor, solid inertia reference: GPS
Pointing Accuracy0.1°
Side-sway AbilitySteer up to ±32°
CycleRepeat cycle time: 59 days
Revisit time: 5 days
Table 2. The spectral responses properties of ZY3-02 MUX.
BandDescriptionSpectral Range
(nm)
Specified Spectral Range at 50% Transmittance Points(nm)Center Wavelength
(nm)
Bandwidth
(nm)
1Blue450–520462.3–512.249070
2Green520–590515.7–587.156370
3Red630–690625.8–693.067660
4NIR770–890763.9–885.4807120
Table 3. Synchronous measurement of atmospheric parameters.
Atmospheric ParametersSynchronous Measurement
AOD @ 550 nm0.1276
CWV0.8763 g/cm2
Table 4. Geometric conditions of ZY3-02 for radiometric calibration.
SiteDateOverpass
Time (UTC)
Solar ZenithSolar AzimuthViewing ZenithViewing Azimuth
Baotou20 July 201603:45:0834.687140.4111.7147.459
Table 5. Different radiometric calibration coefficients (in units of W · m 2 · s r 1 · μ m 1 ).
CoefficientsABCLaboratory
BandGainBiasGainBiasGainBiasGainBias
MUX-B10.2495−18.360.2342−17.070.2291−11.620.2004−0.1794
MUX-B20.2282−10.550.2333−13.600.2213−6.2410.2031−0.3262
MUX-B30.2542−15.480.2454−12.950.2432−10.290.2205−0.1812
MUX-B40.2466−23.330.2261−16.400.2110−9.5520.2044−0.4489
Table 6. Sources of uncertainties in TOA radiance in the reflectance-based approach.
Source of UncertaintyAccuracy %TOA Radiance
Uncertainty %
Surface reflectance measurement2%2.0%
Lambertian assumption of targets1.5%1.5%
Aerosol optical depth 0.5%
Total columnar water vapor 0.4%
Aerosol size distribution 2.0%
Aerosol complex index of refraction 2.5%
MODTRAN 6.0 Radiative transfer2.0%2.0%
Overall Uncertainty 4.57%
Table 7. The relative difference between the TOA predicted and measured radiance (in units of W · m 2 · s r 1 · μ m 1 ).
BandBlueGreenRedNIR
TOA Predicted Radiance
by MODTRAN 6.0 L p r e d i c t e d
97.233106.576113.23596.328
ZY3-02
MUX measured radiance
L m e a s u r e d
Laboratory
Coefficients
105.642113.173121.06889.449
Coefficients A101.327112.289116.94090.686
Coefficients B102.243112.587118.43692.375
Coefficients C99.419109.267116.53093.456
Relative difference
Δ L %
Diff_Lab8.65%6.19%6.92%7.14%
Diff_A4.21%5.36%3.27%5.86%
Diff_B5.15%5.64%4.59%4.10%
Diff_C2.25%2.52%2.91%2.98%
Table 8. Geometric conditions of ZY3-02 and Landsat-8 OLI for cross-calibration.
SensorDateOverpass
Time
(UTC)
Solar ZenithSolar
Azimuth
Viewing ZenithViewing AzimuthAOD@
550 nm
Cloud Condition
ZY3-02
MUX
22 July 201604:31:4824.966137.7740.899186.2490.0892no cloud
Landsat-8 OLI25 July 201604:20:2027.759132.077051.4620.1022no cloud
Table 9. Comparison of results between ZY3-02 MUX Measured TOA Radiance using different calibration coefficients and Landsat-8 OLI TOA Radiance after SBAF correction.
Calibration CoefficientsAverage Relative Difference (%)
BlueGreenRedNIR
Laboratory
Coefficients
8.86%6.63%6.06%7.35%
Coefficients A6.14%6.67%5.30%5.68%
Coefficients B5.34%5.73%5.17%4.43%
Coefficients C2.76%2.77%2.43%3.11%
Publisher’s Note: MDPI stays neutral with regard to jurisdictional claims in published maps and institutional affiliations.

