
Ultra-Wideband Microwave Imaging System for Root Phenotyping

 , , , , , ,
Abstract
:1. Introduction
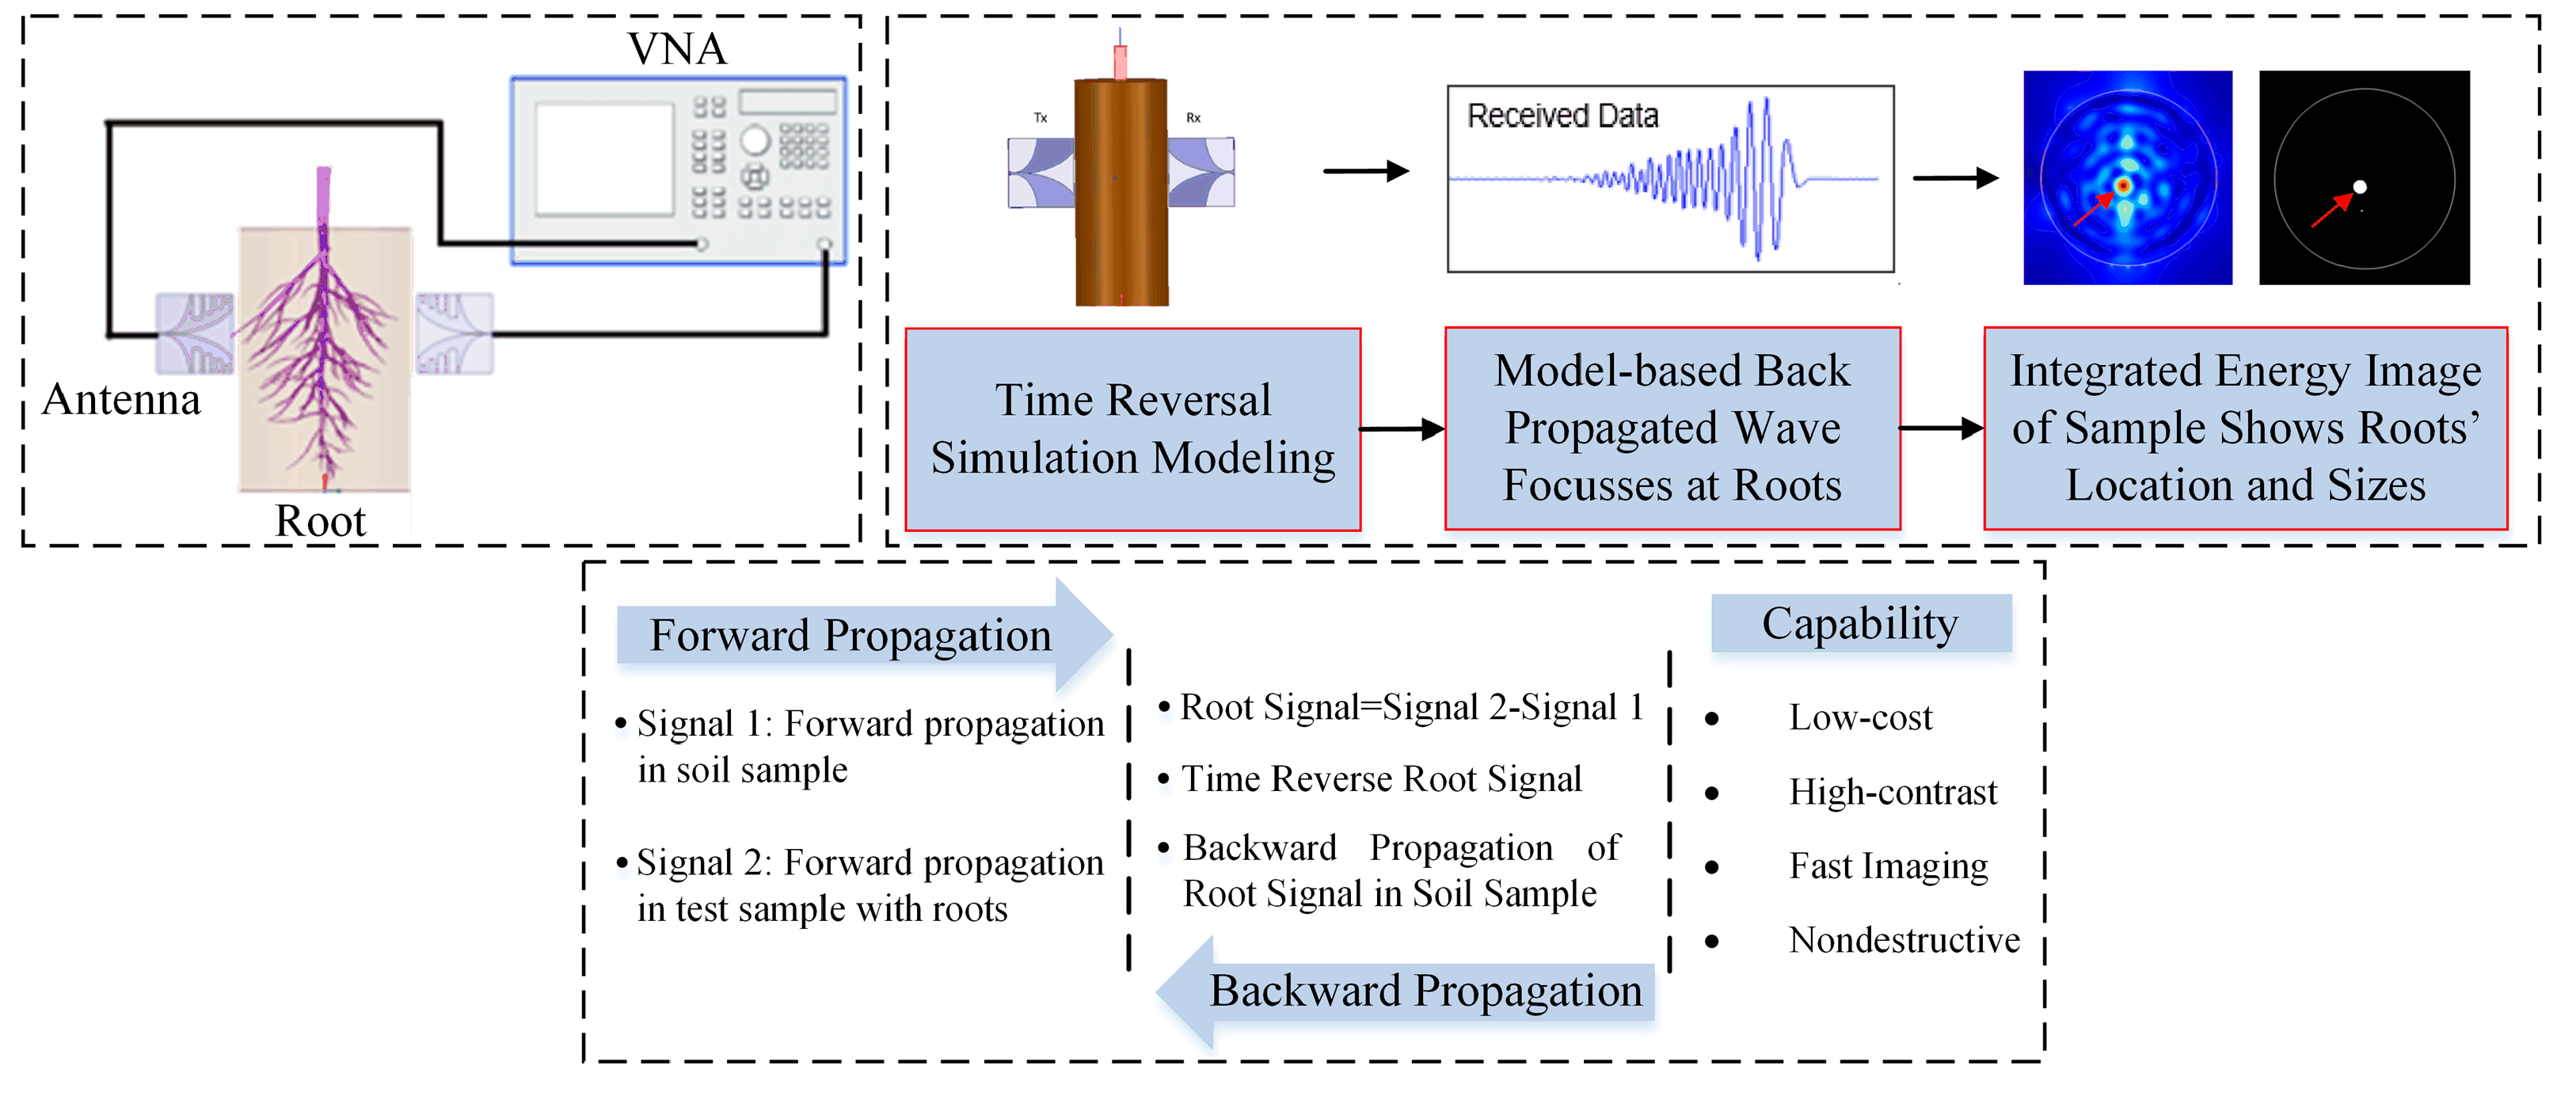
2. Imaging System
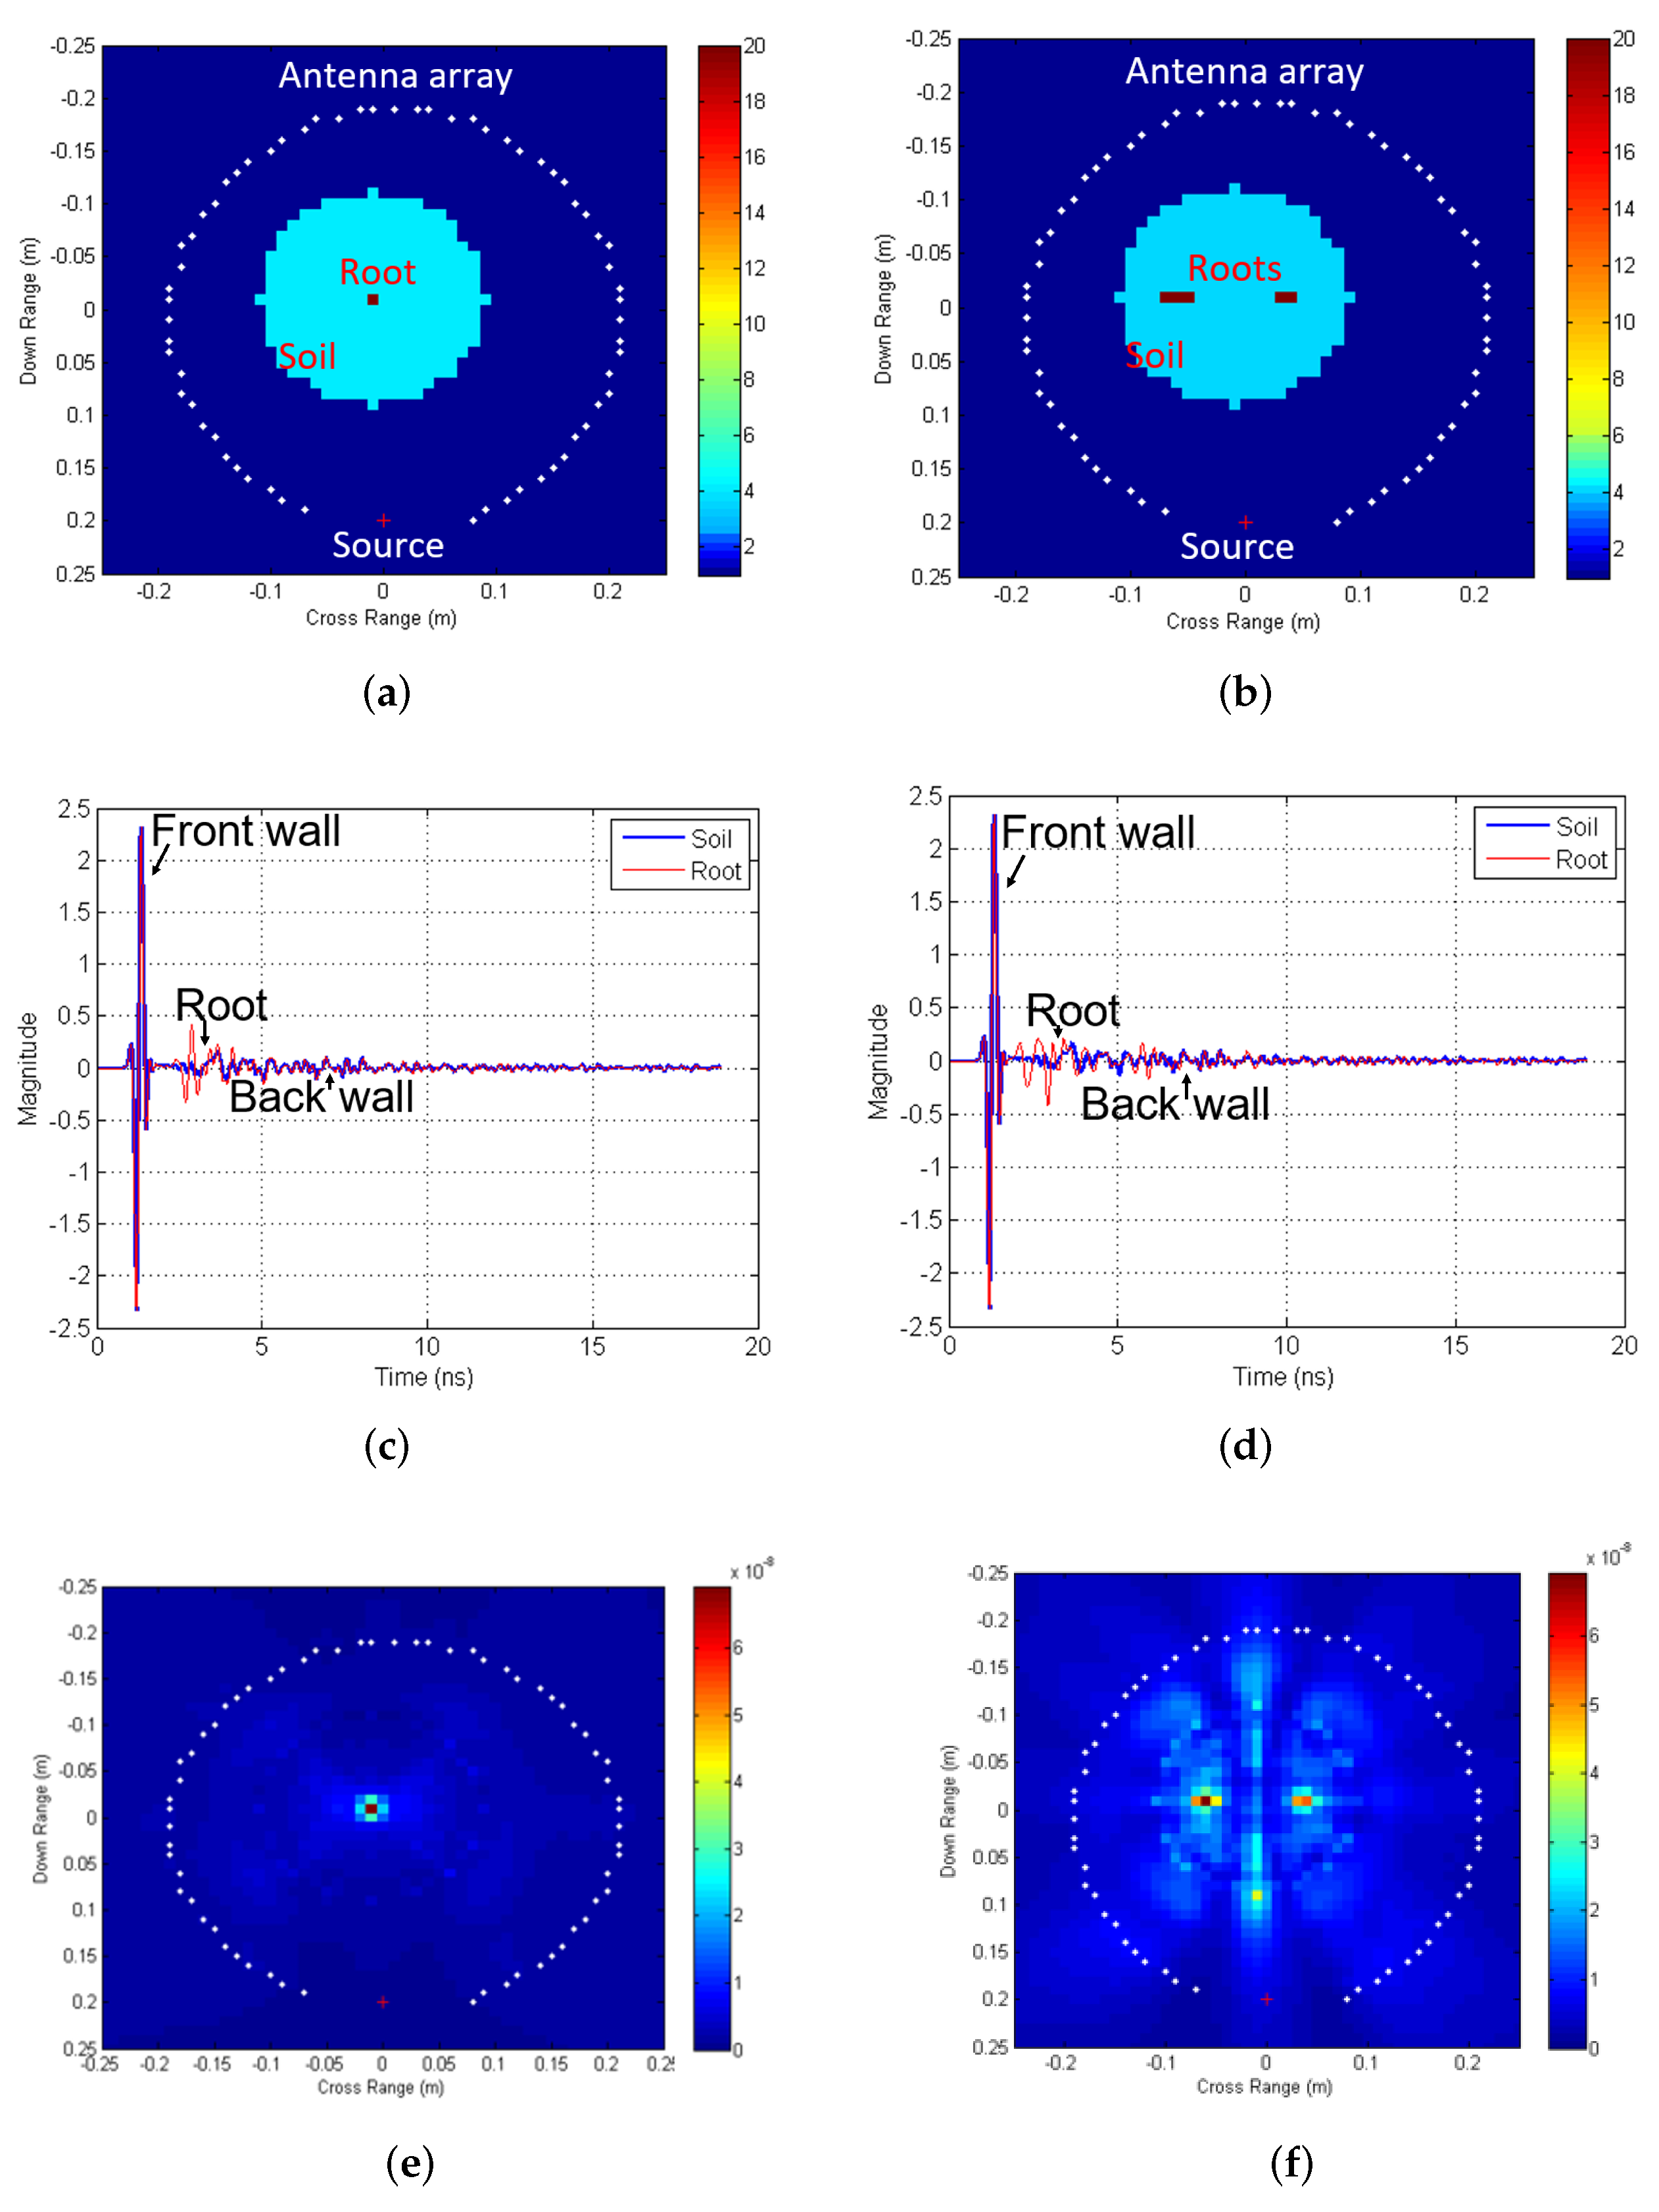
2.1. Time Reversal Imaging
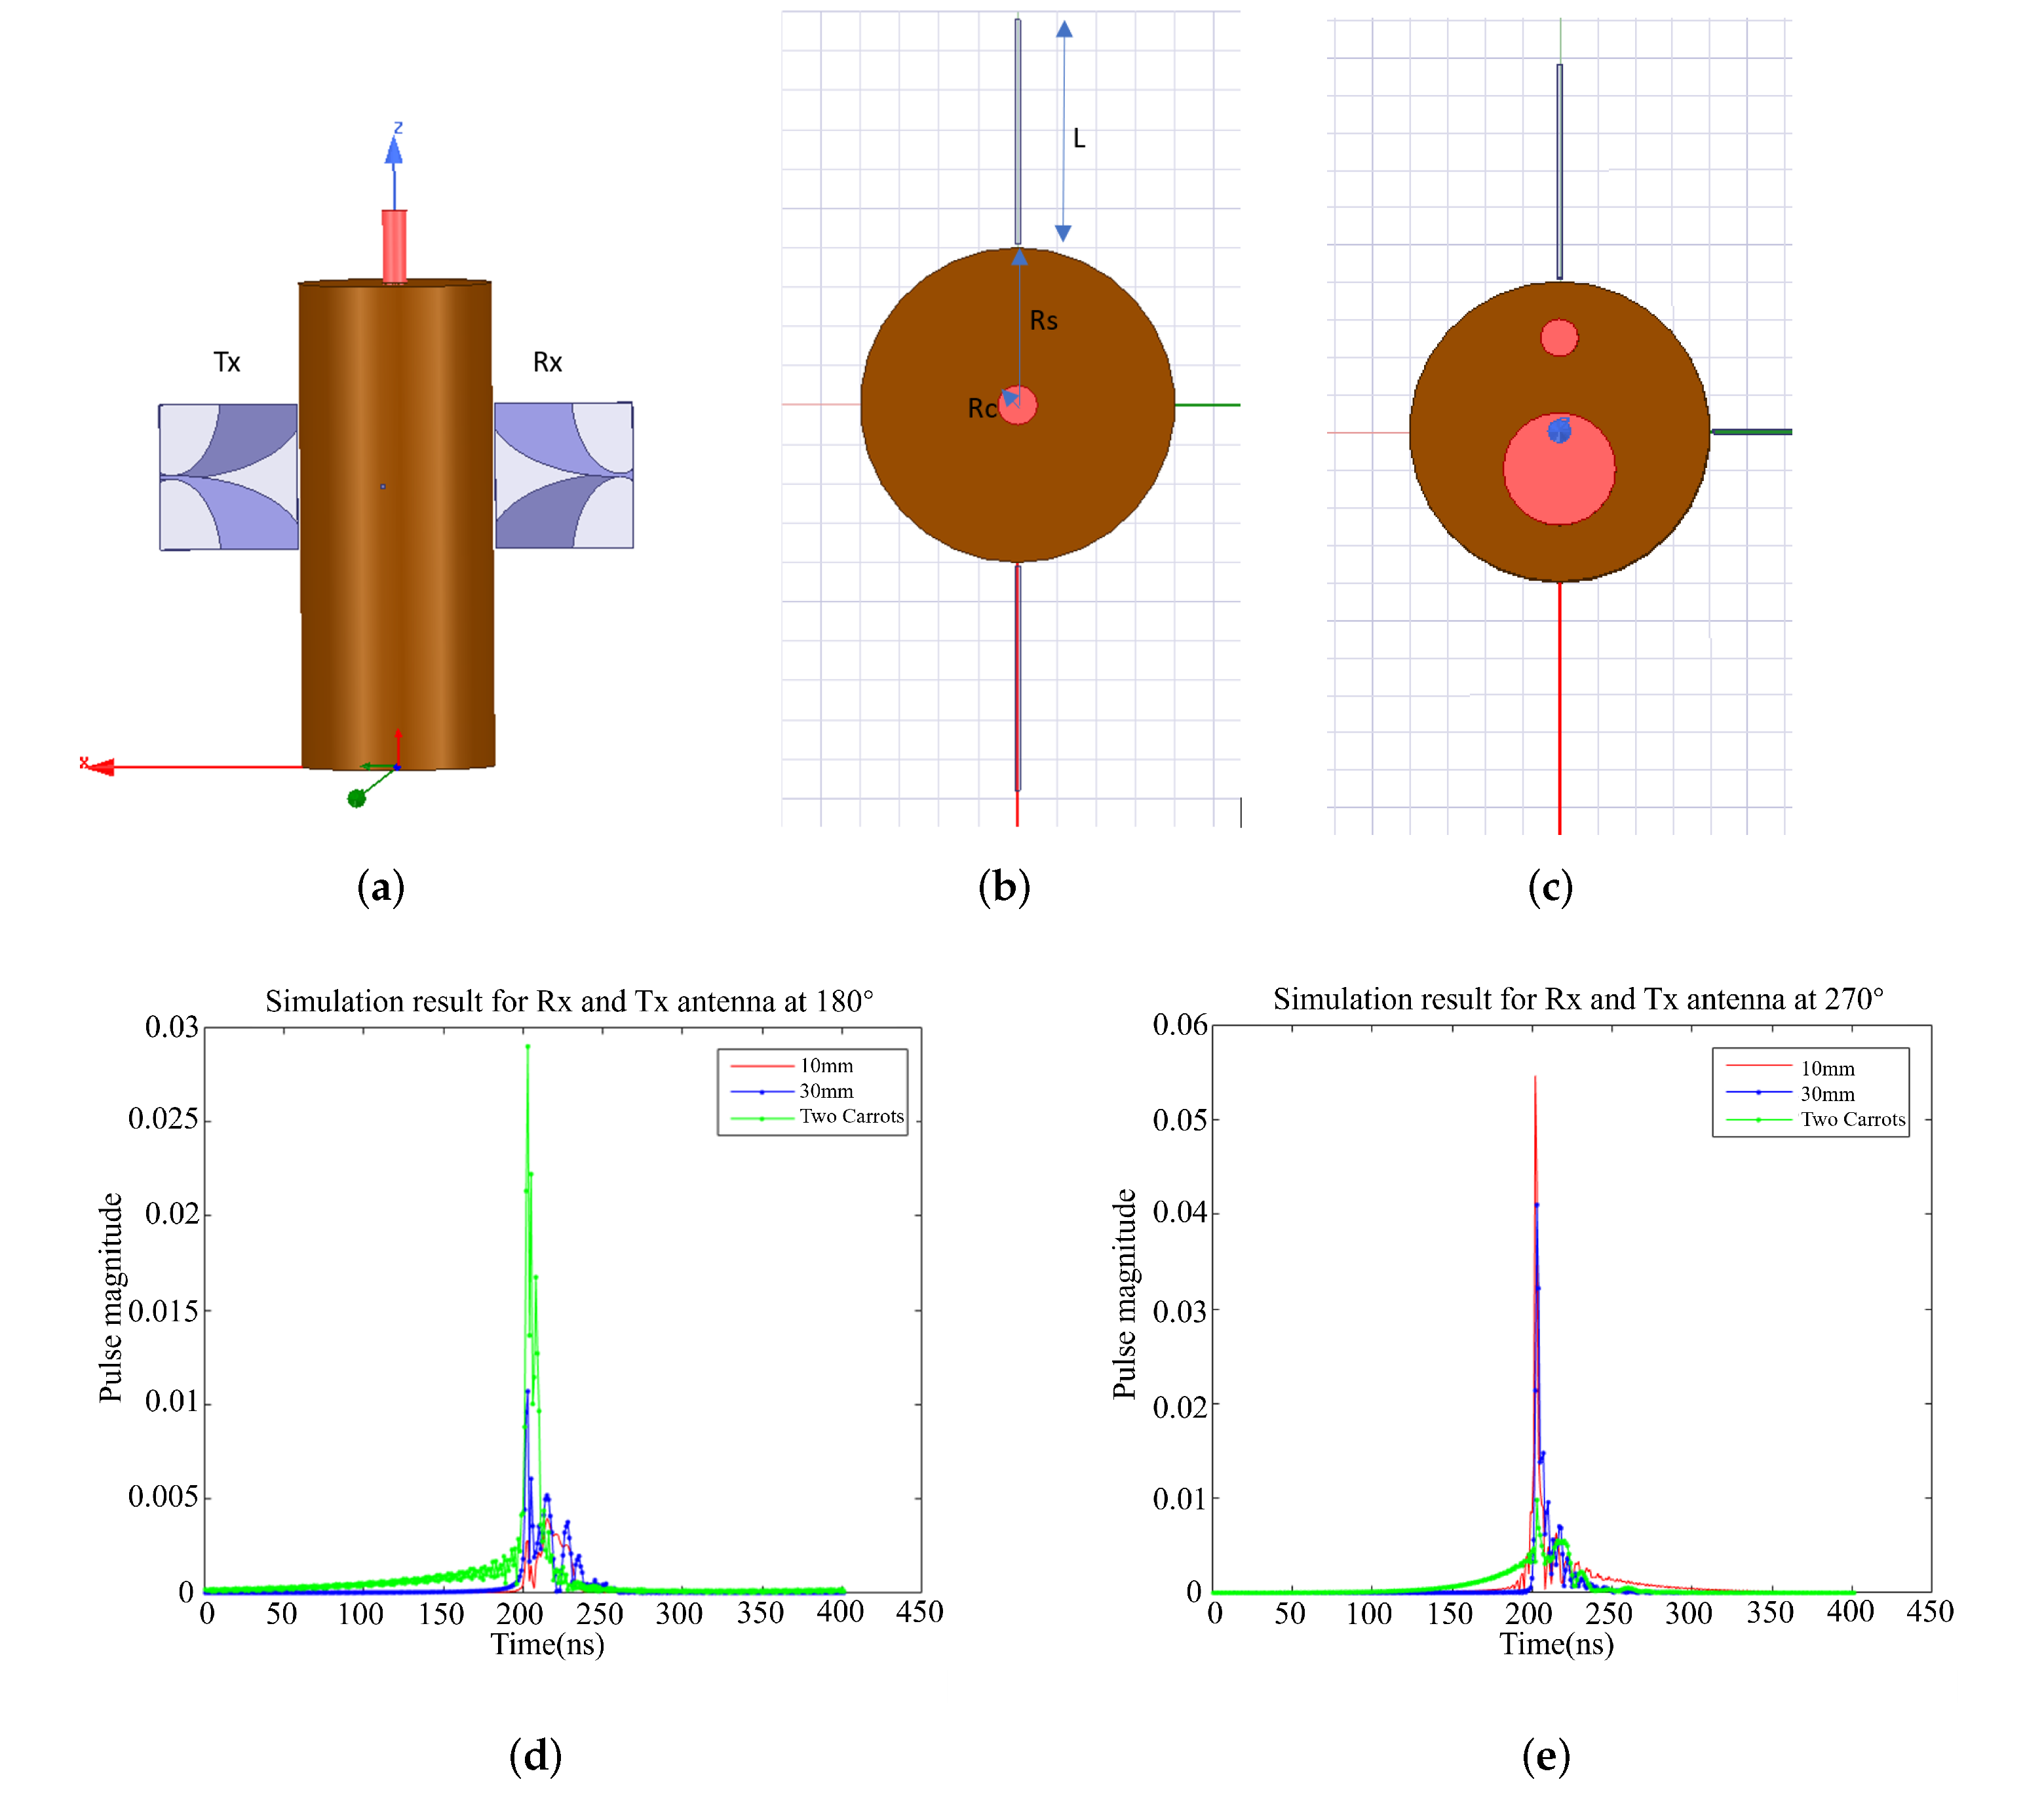
2.2. HFSS Simulations
3. Experimental Results
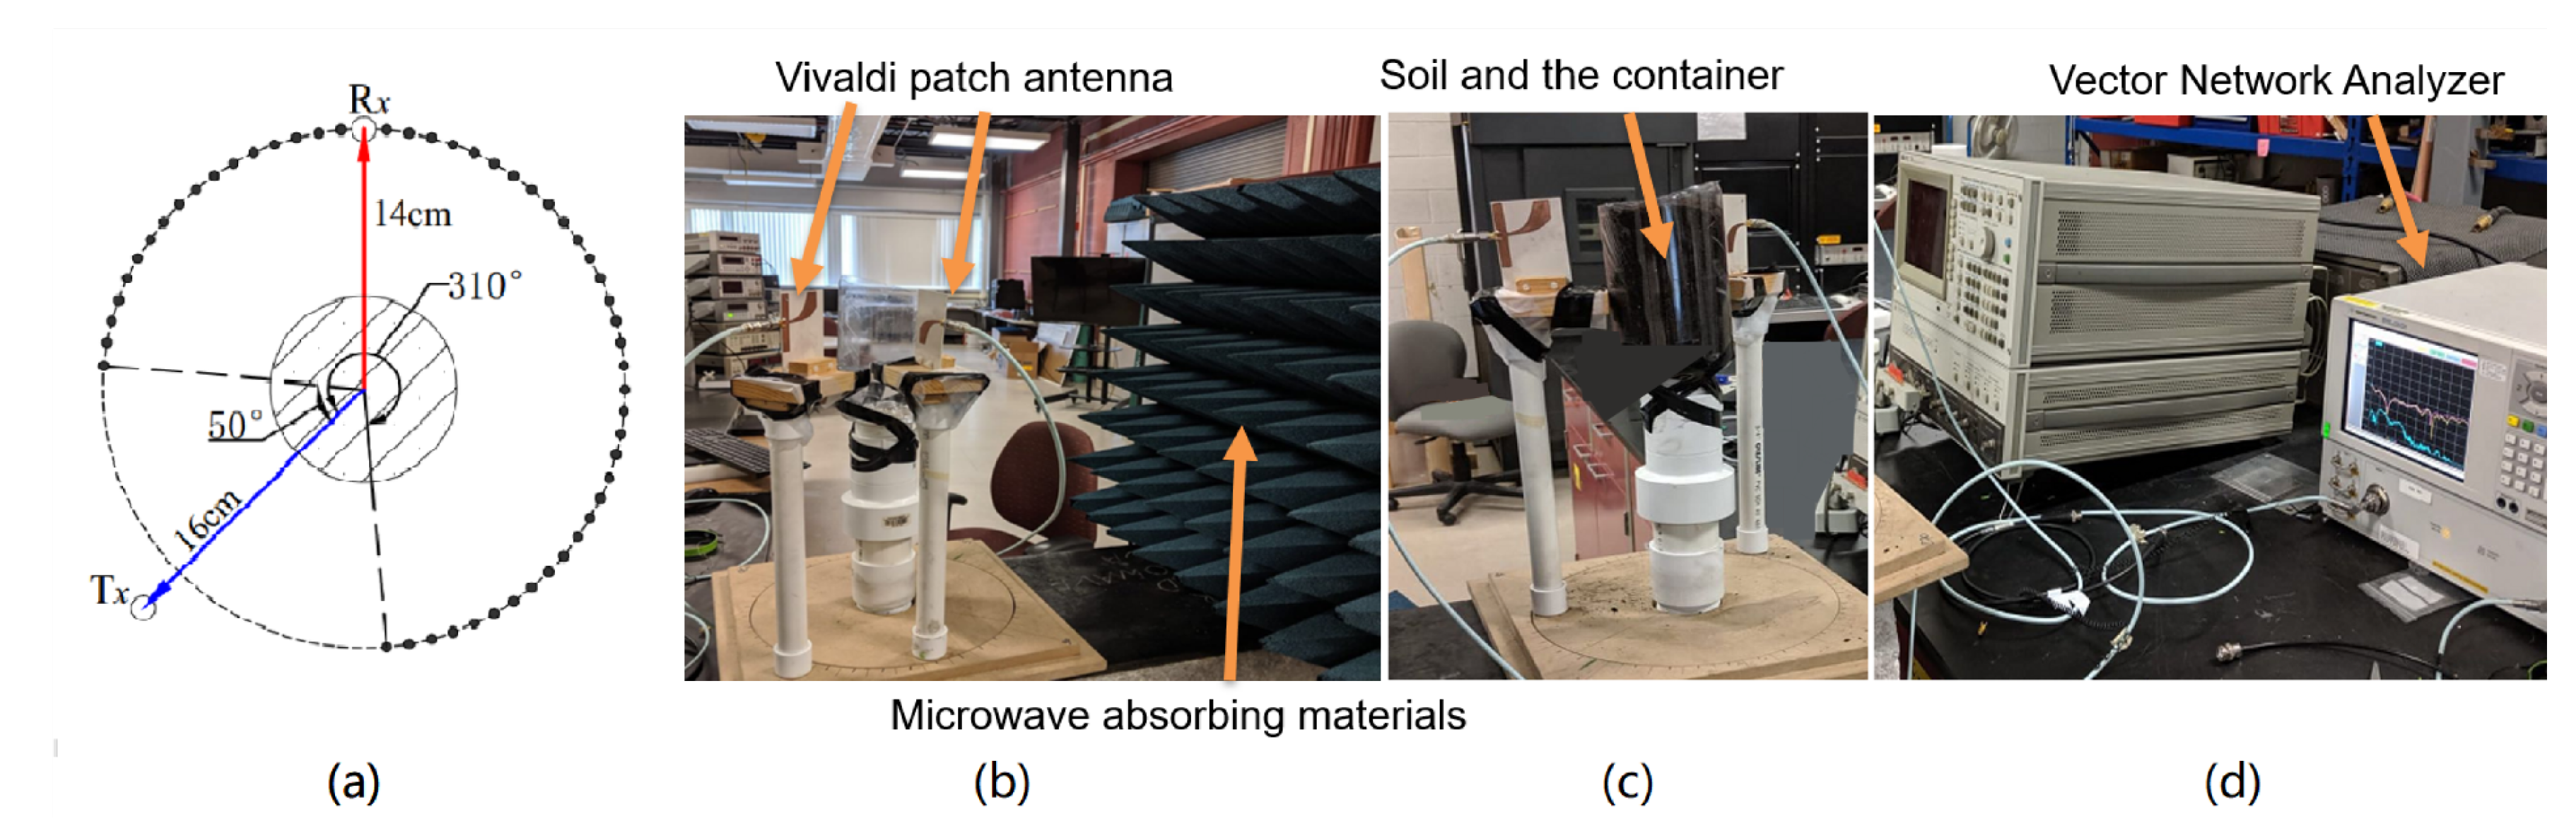
3.1. Experimental Setup
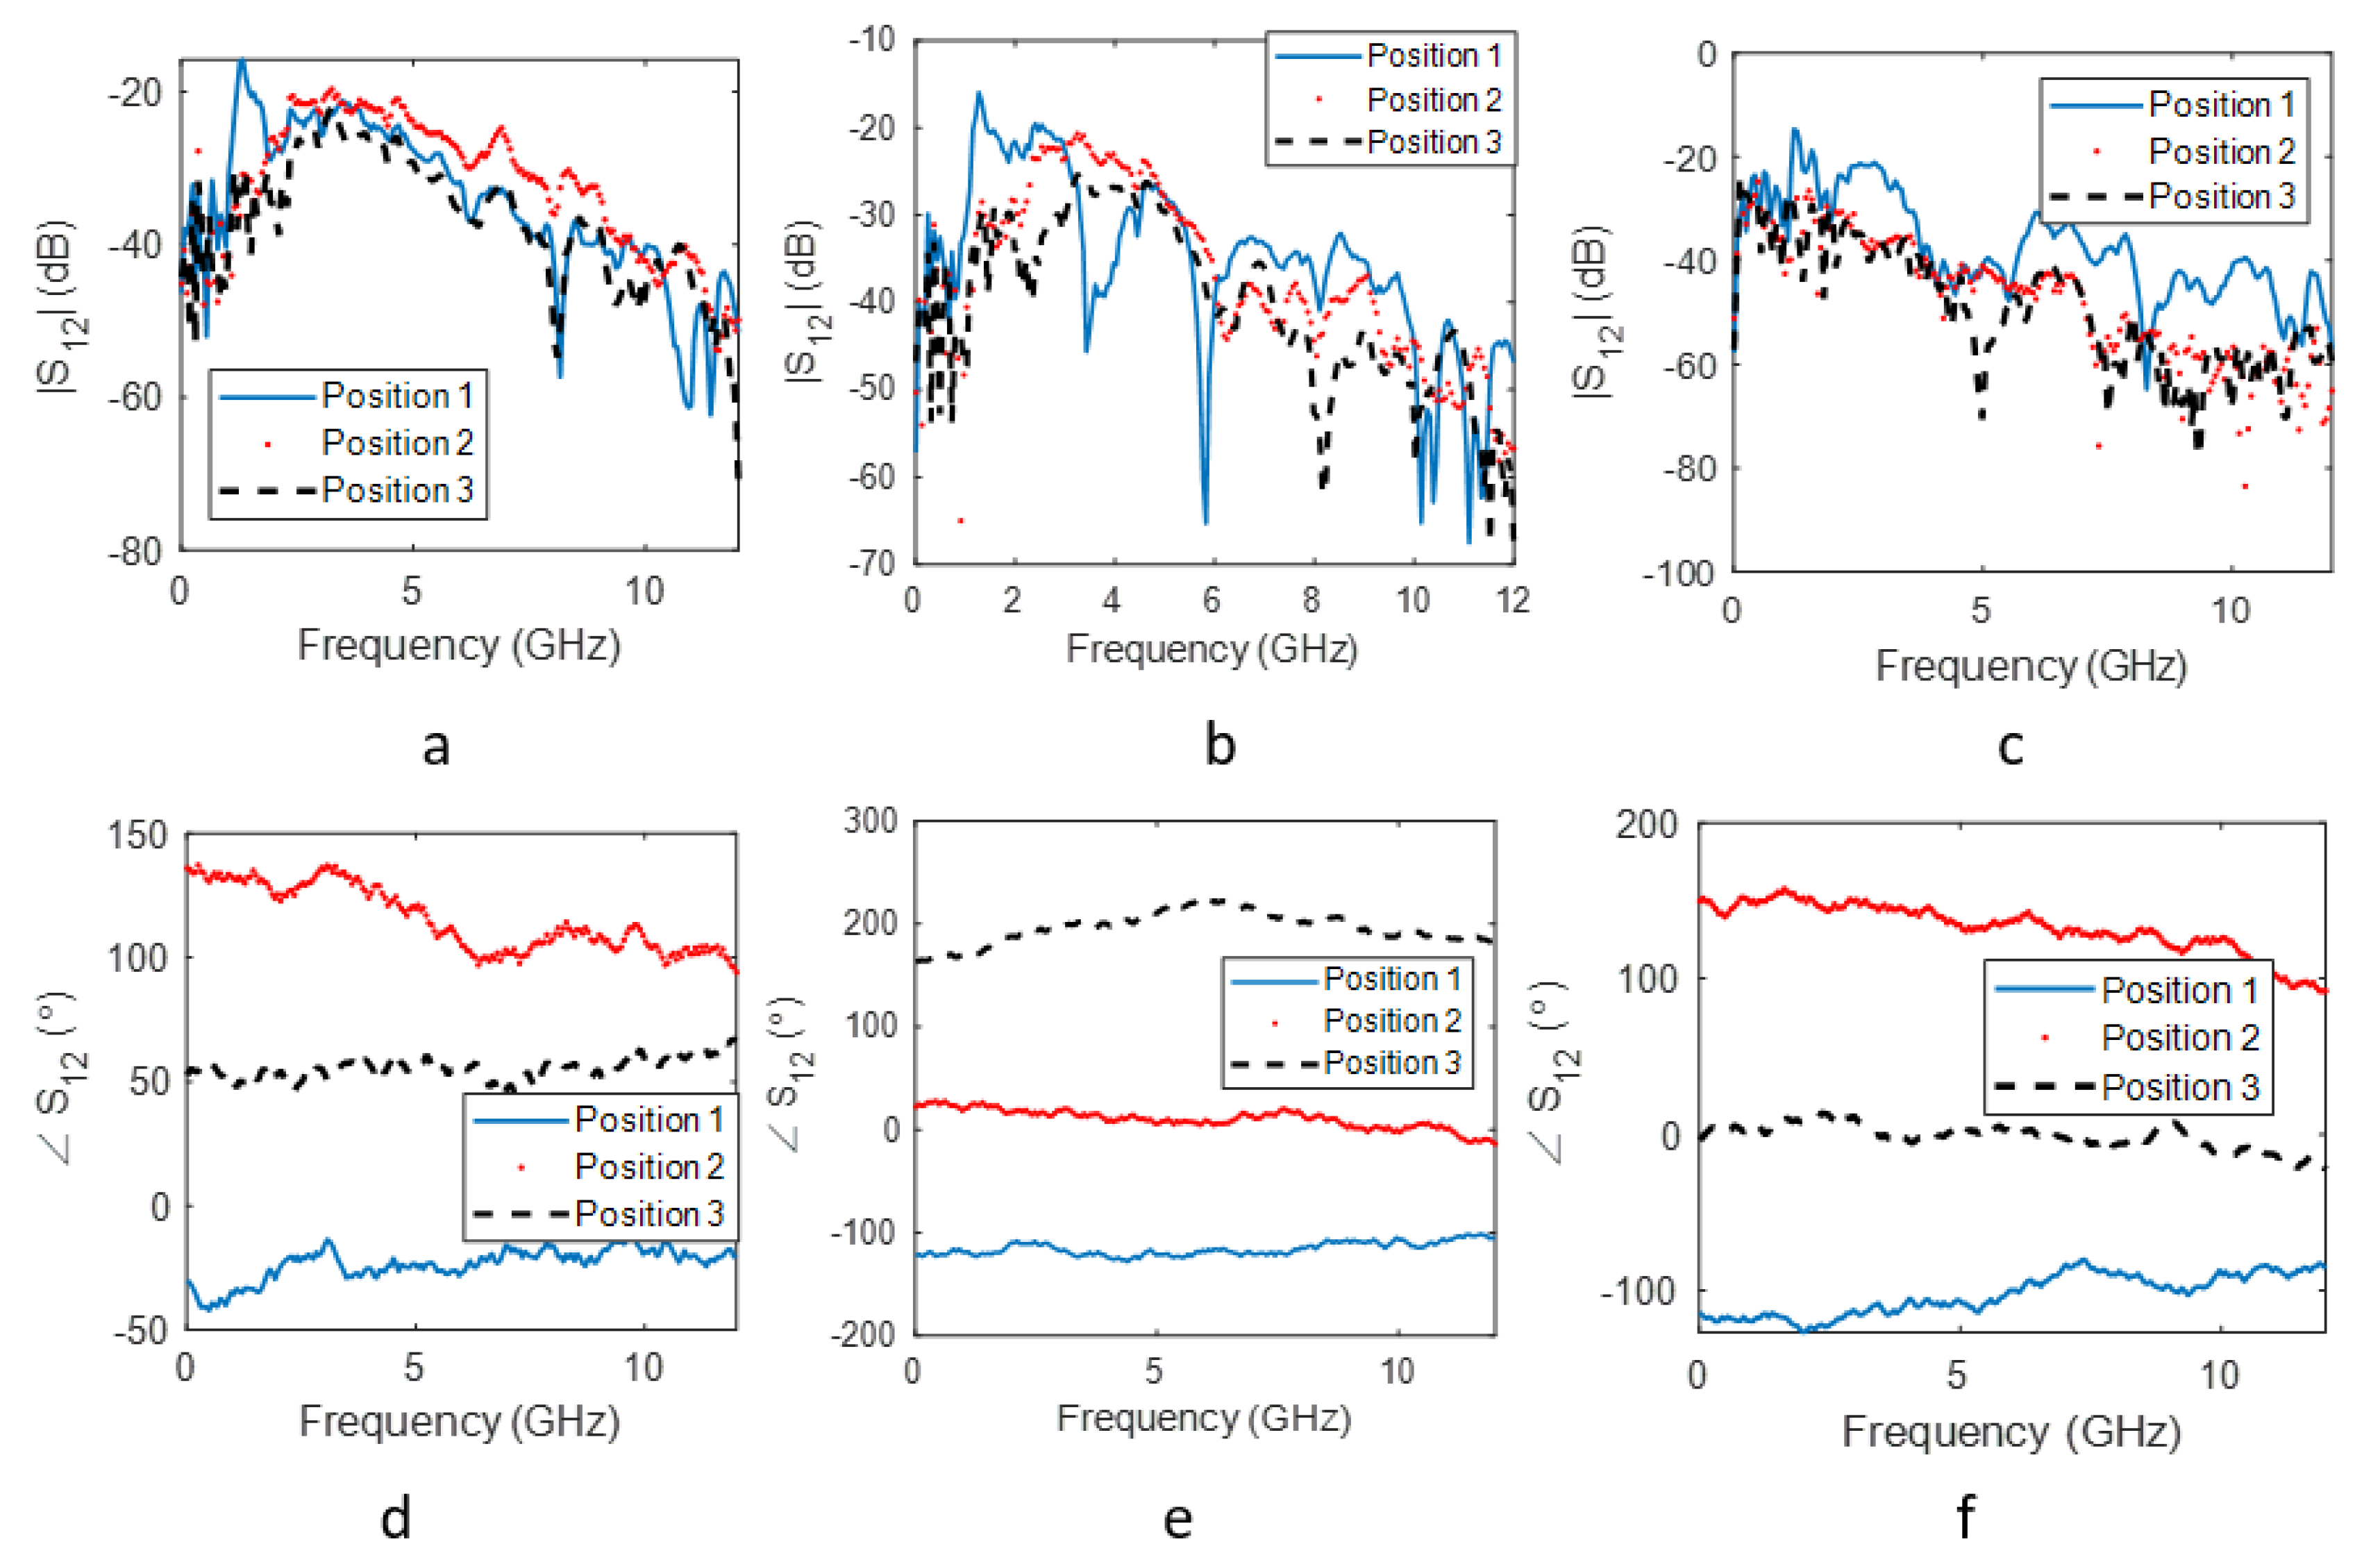
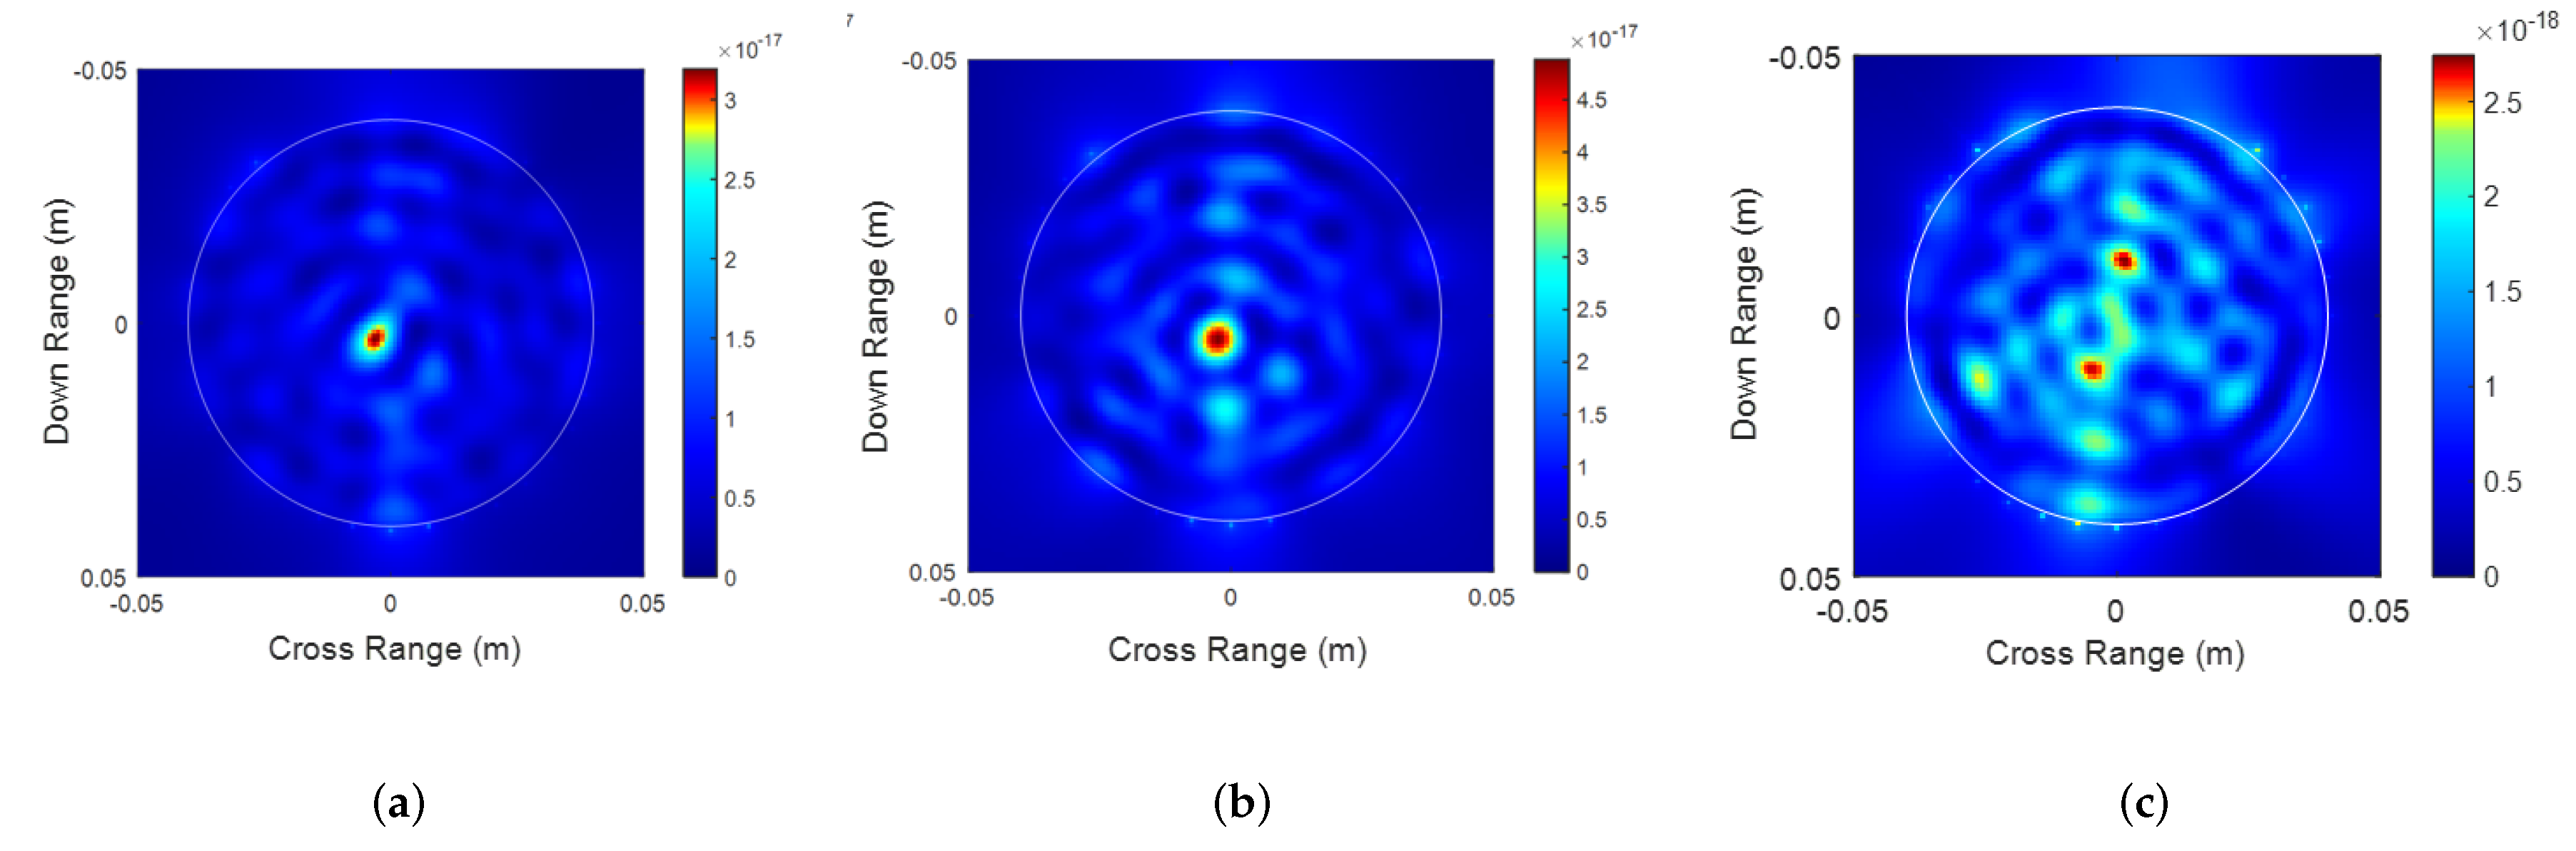
3.2. Results
3.3. Discussion on the Error Estimate
4. Conclusions
Author Contributions
Funding
Institutional Review Board Statement
Informed Consent Statement
Acknowledgments
Conflicts of Interest
References
- Iyer-Pascuzzi, A.S.; Symonova, O.; Mileyko, Y.; Hao, Y.; Belcher, H.; Harer, J.; Weitz, J.S.; Benfey, P.N. Imaging and analysis platform for automatic phenotyping and trait ranking of plant root systems. Plant Physiol. 2010, 152, 1148–1157. [Google Scholar] [CrossRef] [PubMed] [Green Version]
- Paustian, K.; Campbell, N.; Dorich, C.; Marx, E.; Swan, A. Assessment of Potential Greenhouse Gas Mitigation from Changes to Crop Root Mass and Architecture; Technical Report; Booz Allen Hamiltion Inc.: McLean, VA, USA, 2016. [Google Scholar]
- Liu, J.; Ren, Y. A general transfer framework based on industrial process fault diagnosis under small samples. IEEE Trans. Ind. Inform. 2020, 17, 6073–6083. [Google Scholar] [CrossRef]
- Fu, M.; Liu, J.; Zhang, H.; Lu, S. Multisensor Fusion for Magnetic Flux Leakage Defect Characterization Under Information Incompletion. IEEE Trans. Ind. Electron. 2020, 68, 4382–4392. [Google Scholar] [CrossRef]
- Luo, L.; Liu, W.; Lu, Q.; Wang, J.; Wen, W.; Yan, D.; Tang, Y. Grape berry detection and size measurement based on edge image processing and geometric morphology. Machines 2021, 9, 233. [Google Scholar] [CrossRef]
- Wu, F.; Duan, J.; Chen, S.; Ye, Y.; Ai, P.; Yang, Z. Multi-target recognition of bananas and automatic positioning for the inflorescence axis cutting point. Front. Plant Sci. 2021, 12, 705021. [Google Scholar] [CrossRef]
- Chen, M.; Tang, Y.; Zou, X.; Huang, Z.; Zhou, H.; Chen, S. 3D global mapping of large-scale unstructured orchard integrating eye-in-hand stereo vision and SLAM. Comput. Electron. Agric. 2021, 187, 106237. [Google Scholar] [CrossRef]
- Tracy, S.R.; Nagel, K.A.; Postma, J.A.; Fassbender, H.; Wasson, A.; Watt, M. Crop Improvement from Phenotyping Roots: Highlights Reveal Expanding Opportunities. Trends Plant Sci. 2020, 25, 105–118. [Google Scholar] [CrossRef] [Green Version]
- Bodner, G.; Nakhforoosh, A.; Arnold, T.; Leitner, D. Hyperspectral imaging: A novel approach for plant root phenotyping. Plant Methods 2018, 14, 84. [Google Scholar] [CrossRef] [Green Version]
- Clark, R.T.; MacCurdy, R.B.; Jung, J.K.; Shaff, J.E.; McCouch, S.R.; Aneshansley, D.J.; Kochian, L.V. Three-Dimensional Root Phenotyping with a Novel Imaging and Software Platform. Plant Physiol. 2011, 156, 455–465. [Google Scholar] [CrossRef] [Green Version]
- Smit, A.L.; Bengough, A.G.; Engels, C.; van Noordwijk, M.; Pellerin, S.; van de Geijn, S.C. Root Methods: A Handbook; Springer Science & Business Media: New York, NY, USA, 2013. [Google Scholar]
- Schuurman, J.; Goedewaagen, M. Methods for the Examination of Root Systems and Roots; Centre for Agricultural Publications and Documentation: Wageningen, The Netherlands, 1965. [Google Scholar]
- Böhm, W. Methods of Studying Root Systems; Springer Science & Business Media: New York, NY, USA, 2012; Volume 33. [Google Scholar]
- Bates, G. A device for the observation of root growth in the soil. Nature 1937, 139, 966–967. [Google Scholar] [CrossRef]
- Moradi, A.B.; Conesa, H.M.; Robinson, B.; Lehmann, E.; Kuehne, G.; Kaestner, A.; Oswald, S.; Schulin, R. Neutron radiography as a tool for revealing root development in soil: Capabilities and limitations. Plant Soil 2009, 318, 243–255. [Google Scholar] [CrossRef] [Green Version]
- Gregory, P.J.; Hutchison, D.; Read, D.B.; Jenneson, P.M.; Gilboy, W.B.; Morton, E.J. Non-invasive imaging of roots with high resolution X-ray micro-tomography. In Roots: The Dynamic Interface between Plants and the Earth; Springer: Dordrecht, The Netherlands, 2003; pp. 351–359. [Google Scholar]
- Tracy, S.R.; Roberts, J.A.; Black, C.R.; McNeill, A.; Davidson, R.; Mooney, S.J. The X-factor: Visualizing undisturbed root architecture in soils using X-ray computed tomography. J. Exp. Bot. 2010, 61, 311–313. [Google Scholar] [CrossRef] [PubMed] [Green Version]
- Schmidt, S.; Bengough, A.G.; Gregory, P.J.; Grinev, D.V.; Otten, W. Estimating root–soil contact from 3D X-ray microtomographs. Eur. J. Soil Sci. 2012, 63, 776–786. [Google Scholar] [CrossRef]
- Atkinson, J.A.; Pound, M.P.; Bennett, M.J.; Wells, D.M. Uncovering the hidden half of plants using new advances in root phenotyping. Curr. Opin. Biotechnol. 2019, 55, 1–8. [Google Scholar] [CrossRef]
- Downie, H.F.; Adu, M.; Schmidt, S.; Otten, W.; Dupuy, L.X.; White, P.; Valentine, T.A. Challenges and opportunities for quantifying roots and rhizosphere interactions through imaging and image analysis. Plant Cell Environ. 2015, 38, 1213–1232. [Google Scholar] [CrossRef] [Green Version]
- Metzner, R.; Eggert, A.; Van Dusschoten, D.; Pflugfelder, D.; Gerth, S.; Schurr, U.; Uhlmann, N.; Jahnke, S. Direct comparison of MRI and X-ray CT technologies for 3D imaging of root systems in soil: Potential and challenges for root trait quantification. Plant Methods 2015, 11, 17. [Google Scholar] [CrossRef]
- Pflugfelder, D.; Metzner, R.; van Dusschoten, D.; Reichel, R.; Jahnke, S.; Koller, R. Non-invasive imaging of plant roots in different soils using magnetic resonance imaging (MRI). Plant Methods 2017, 13, 102. [Google Scholar] [CrossRef]
- Wasson, A.P.; Nagel, K.A.; Tracy, S.; Watt, M. Beyond Digging: Noninvasive Root and Rhizosphere Phenotyping. Trends Plant Sci. 2020, 25, 119–120. [Google Scholar] [CrossRef] [Green Version]
- Fang, S.; Yan, X.; Liao, H. 3D reconstruction and dynamic modeling of root architecture in situ and its application to crop phosphorus research. Plant J. 2009, 60, 1096–1108. [Google Scholar] [CrossRef]
- Turillazzi, E.; Karch, S.B.; Neri, M.; Pomara, C.; Riezzo, I.; Fineschi, V. Confocal laser scanning microscopy. Using new technology to answer old questions in forensic investigations. Int. J. Leg. Med. 2008, 122, 173–177. [Google Scholar] [CrossRef]
- Tsaftaris, S.A.; Noutsos, C. Plant phenotyping with low cost digital cameras and image analytics. In Information Technologies in Environmental Engineering; Springer: Berlin/Heidelberg, Germany, 2009; pp. 238–251. [Google Scholar]
- Fahlgren, N.; Gehan, M.A.; Baxter, I. Lights, camera, action: High-throughput plant phenotyping is ready for a close-up. Curr. Opin. Plant Biol. 2015, 24, 93–99. [Google Scholar] [CrossRef] [Green Version]
- Faget, M.; Blossfeld, S.; Von Gillhaußen, P.; Schurr, U.; Temperton, V.M. Disentangling who is who during rhizosphere acidification in root interactions: Combining fluorescence with optode techniques. Front. Plant Sci. 2013, 4, 392. [Google Scholar] [CrossRef] [Green Version]
- Watt, M.; Hugenholtz, P.; White, R.; Vinall, K. Numbers and locations of native bacteria on field-grown wheat roots quantified by fluorescence in situ hybridization (FISH). Environ. Microbiol. 2006, 8, 871–884. [Google Scholar] [CrossRef]
- Singhvi, A.; Ma, B.; Scharwies, J.D.; Dinneny, J.R.; Khuri-Yakub, B.T.; Arbabian, A. Non-Contact Thermoacoustic Sensing and Characterization of Plant Root Traits. In Proceedings of the 2019 IEEE International Ultrasonics Symposium (IUS), Glasgow, UK, 6–9 October 2019; pp. 1992–1995. [Google Scholar]
- Smith, N.; Rivera, L.A.; Burford, N.; Bowman, T.; El-Shenawee, M.O.; DeSouza, G.N. Towards root phenotyping in situ using THz imaging. In Proceedings of the 2015 40th International Conference on Infrared, Millimeter, and Terahertz Waves (IRMMW-THz), Hong Kong, China, 23–28 August 2015; pp. 1–2. [Google Scholar]
- Mukherjee, S.; Shi, X.; Deng, Y.; Udpa, L. A Hybrid Microwave NDE System for Rapid Inspection of GFRP Composites. Mater. Eval. 2020, 78, 963–975. [Google Scholar] [CrossRef]
- Rathod, V.T.; Banerjee, P.; Deng, Y. Low Field Methods (GMR, Hall Probes, etc.). In Handbook of Advanced Non-Destructive Evaluation; Ida, N., Meyendorf, N., Eds.; Springer International Publishing: Cham, Switzerland, 2019; pp. 1–54. [Google Scholar]
- Shi, X.; Rathod, V.T.; Mukherjee, S.; Udpa, L.; Deng, Y. Multi-modality strain estimation using a rapid near-field microwave imaging system for dielectric materials. Measurement 2020, 151, 107243. [Google Scholar] [CrossRef]
- Kazemi, N.; Schofield, K.; Musilek, P. A high-resolution reflective microwave planar sensor for sensing of vanadium electrolyte. Sensors 2021, 21, 3759. [Google Scholar] [CrossRef]
- Abdolrazzaghi, M.; Daneshmand, M.; Iyer, A.K. Strongly enhanced sensitivity in planar microwave sensors based on metamaterial coupling. IEEE Trans. Microw. Theory Tech. 2018, 66, 1843–1855. [Google Scholar] [CrossRef] [Green Version]
- Herrmann, P.S.d.P.; Sydoruk, V.; Marques Porto, F.N. Microwave Transmittance Technique Using Microstrip Patch Antennas, as a Non-Invasive Tool to Determine Soil Moisture in Rhizoboxes. Sensors 2020, 20, 1166. [Google Scholar] [CrossRef] [Green Version]
- Menzel, M.I.; Tittmann, S.; Buehler, J.; Preis, S.; Wolters, N.; Jahnke, S.; Walter, A.; Chlubek, A.; Leon, A.; Hermes, N.; et al. Non-invasive determination of plant biomass with microwave resonators. Plant Cell Environ. 2009, 32, 368–379. [Google Scholar] [CrossRef]
- Mukherjee, S.; Udpa, L.; Deng, Y.; Chahal, P.; Rothwell, E.J. Design of a microwave time reversal mirror for imaging applications. Prog. Electromagn. Res. 2017, 77, 155–165. [Google Scholar] [CrossRef] [Green Version]
- Lerosey, G.; De Rosny, J.; Tourin, A.; Derode, A.; Montaldo, G.; Fink, M. Time reversal of electromagnetic waves. Phys. Rev. Lett. 2004, 92, 193904. [Google Scholar] [CrossRef] [PubMed]
- Mukherjee, S.; Udpa, L.; Udpa, S.; Rothwell, E.J. Target localization using microwave time-reversal mirror in reflection mode. IEEE Trans. Antennas Propag. 2016, 65, 820–828. [Google Scholar] [CrossRef]
- Mukherjee, S.; Tamburrino, A.; Haq, M.; Udpa, S.; Udpa, L. Far field microwave NDE of composite structures using time reversal mirror. NDT E Int. 2018, 93, 7–17. [Google Scholar] [CrossRef]


| Method | Advantage | Limit |
|---|---|---|
| Excavation methods [11], pinboard method [12], trench profile technique [9], glass pane/tube method [13,14] | Easy and cost effective method | Destructive, time consuming, may affect and limit the growth of the root, low accuracy and low-resolution |
| Neutron radiography [15] | Provides root image | Destructive, inapplicable for in situ root phenotype |
| X-ray computed tomography [16,17,18,19,20] | Non-destructive, high resolution, high accuracy and fast 3D root phenotype | Expensive, destructive, non-portable, ineffective for in situ root phenotype |
| Magnetic resonance (MR) method [21,22] | Non-destructive, high accuracy and 3D root phenotype | Lower resolution and longer imaging time compared to the X-ray method. MR dependents on the water content of the root, and thus its accuracy may be influenced by the plant type and soil moisture |
| Laser root scanner [24]/confocal laser scanning microscopy [25] | Provide precise 3D measurements non-destructively | Destructive, can only be used when the root is growing in a transparent medium, requires longer imaging times, expensive |
| Cameras [26,27] | Provide precise images non-destructively and fast | Can only be used when the root is growing in a transparent medium |
| Fluorescence techniques [28,29] | Provide precise measurements | Destructive, can only be used when the root is growing in a transparent medium |
| Hyperspectral imaging method [9] | Discriminates between living, senescent and dead roots, leaf debris and soil | Can only be used when the root is growing in a transparent medium |
| THz imaging method [31] | High resolution images, detects and identifies roots and objects buried in soil | Scattering, absorption and radiation issues and unavailability of hardware for commercialization |
| Parameters | Values |
|---|---|
| Scanning angle | 50–310 |
| Scanning step | 10 |
| Vivaldi antenna frequency | 3–10 GHz |
| Distance between receiver and soil container | 14 cm |
| Distance between transmitter and soil container | 16 cm |
| Diameter of soil container | 100 mm |
| Diameter of carrots | 16, 25 mm |
Publisher’s Note: MDPI stays neutral with regard to jurisdictional claims in published maps and institutional affiliations. |
© 2022 by the authors. Licensee MDPI, Basel, Switzerland. This article is an open access article distributed under the terms and conditions of the Creative Commons Attribution (CC BY) license (https://creativecommons.org/licenses/by/4.0/).
Share and Cite
Shi, X.; Li, J.; Mukherjee, S.; Datta, S.; Rathod, V.; Wang, X.; Lu, W.; Udpa, L.; Deng, Y. Ultra-Wideband Microwave Imaging System for Root Phenotyping. Sensors 2022, 22, 2031. https://doi.org/10.3390/s22052031
Shi X, Li J, Mukherjee S, Datta S, Rathod V, Wang X, Lu W, Udpa L, Deng Y. Ultra-Wideband Microwave Imaging System for Root Phenotyping. Sensors. 2022; 22(5):2031. https://doi.org/10.3390/s22052031
Chicago/Turabian StyleShi, Xiaodong, Jiaoyang Li, Saptarshi Mukherjee, Srijan Datta, Vivek Rathod, Xinyu Wang, Wei Lu, Lalita Udpa, and Yiming Deng. 2022. "Ultra-Wideband Microwave Imaging System for Root Phenotyping" Sensors 22, no. 5: 2031. https://doi.org/10.3390/s22052031