
Usability Testing of Virtual Reality Applications—The Pilot Study


Abstract
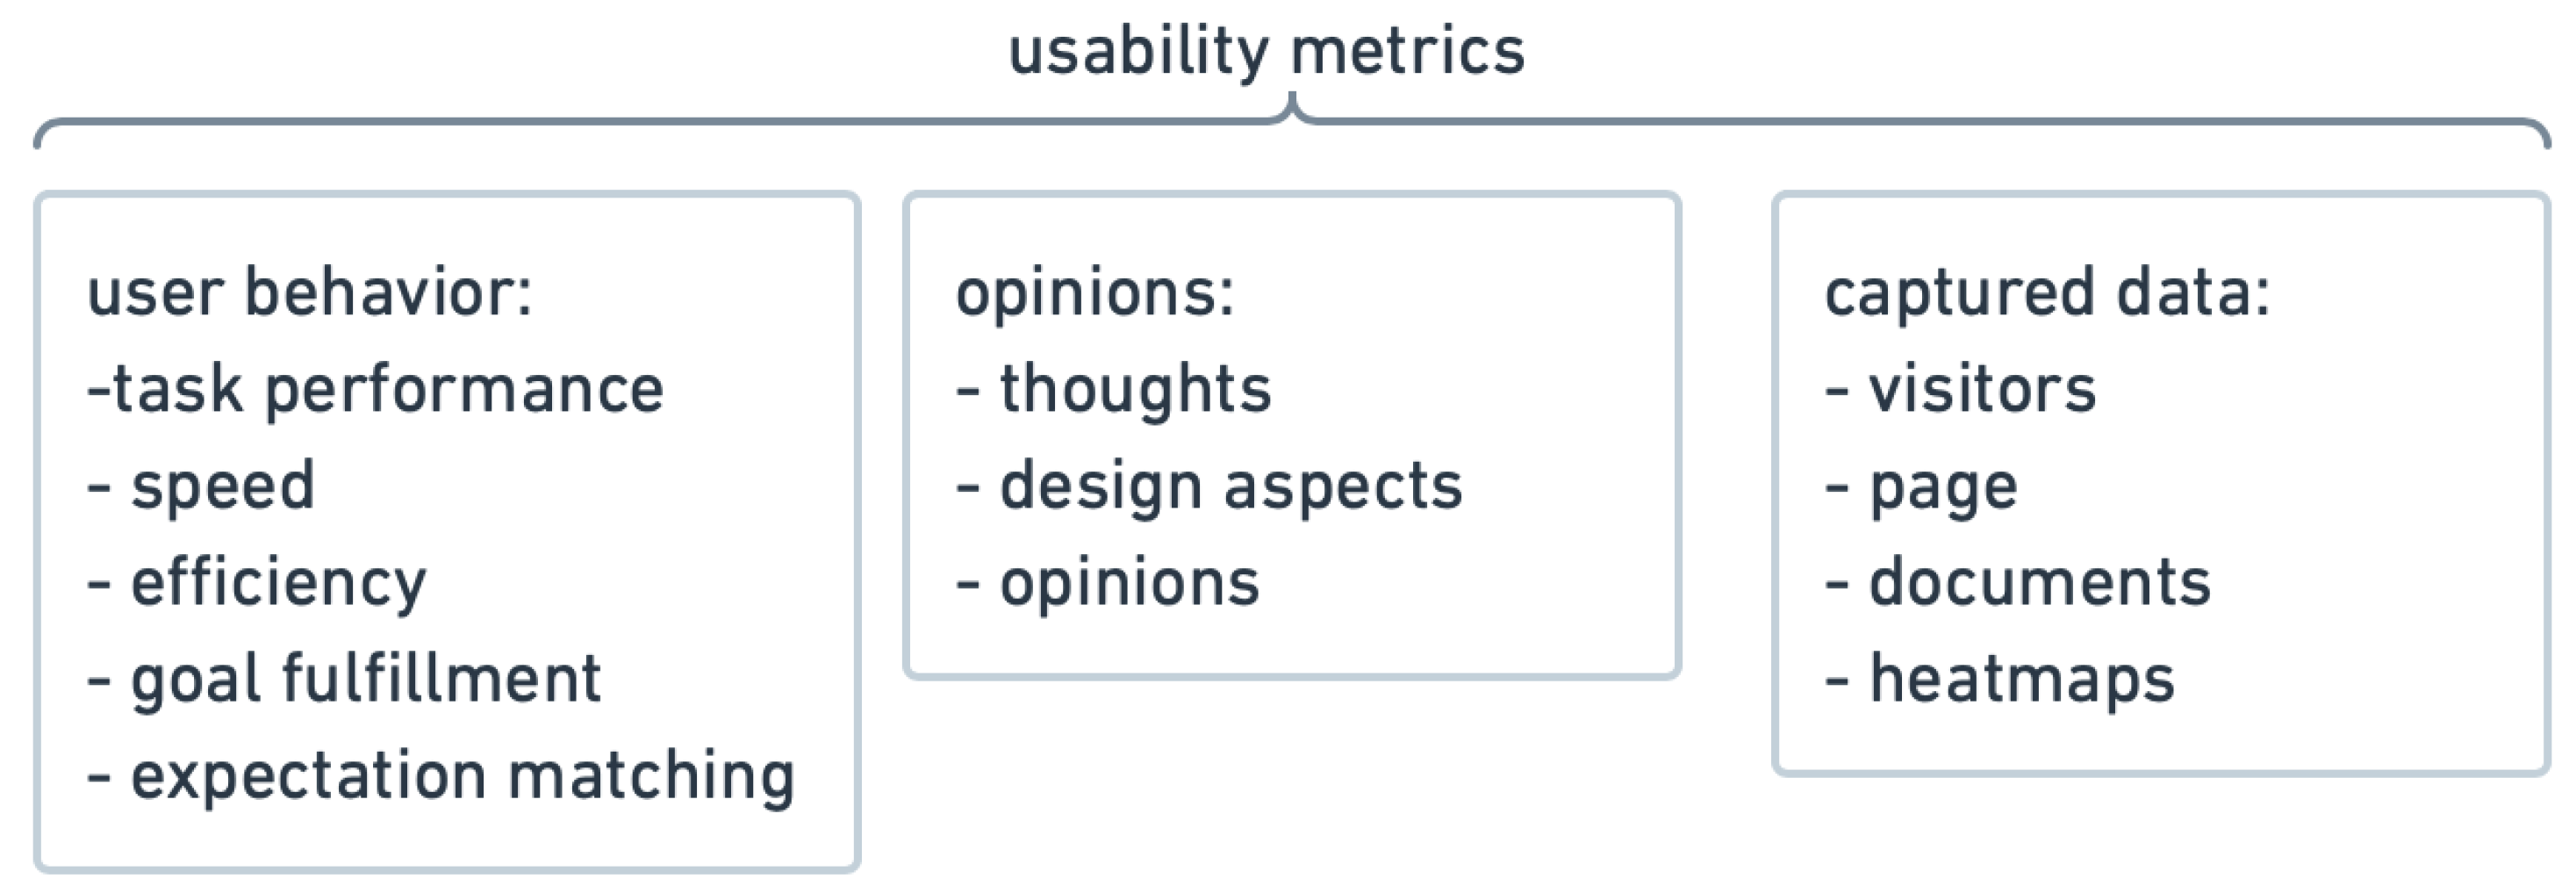
:1. Introduction
- Learnability: How easy it is for the user to accomplish basic tasks the first time they are dealing with the design.
- Efficiency: How quickly the user can perform tasks once they have learned the design.
- Memorability: How easily the user reestablishes proficiency when they return to the design after a period of not using it.
- Errors: How many errors the users make, and how easily they can recover from the errors.
- Satisfaction: How pleasurable it is to use the design.
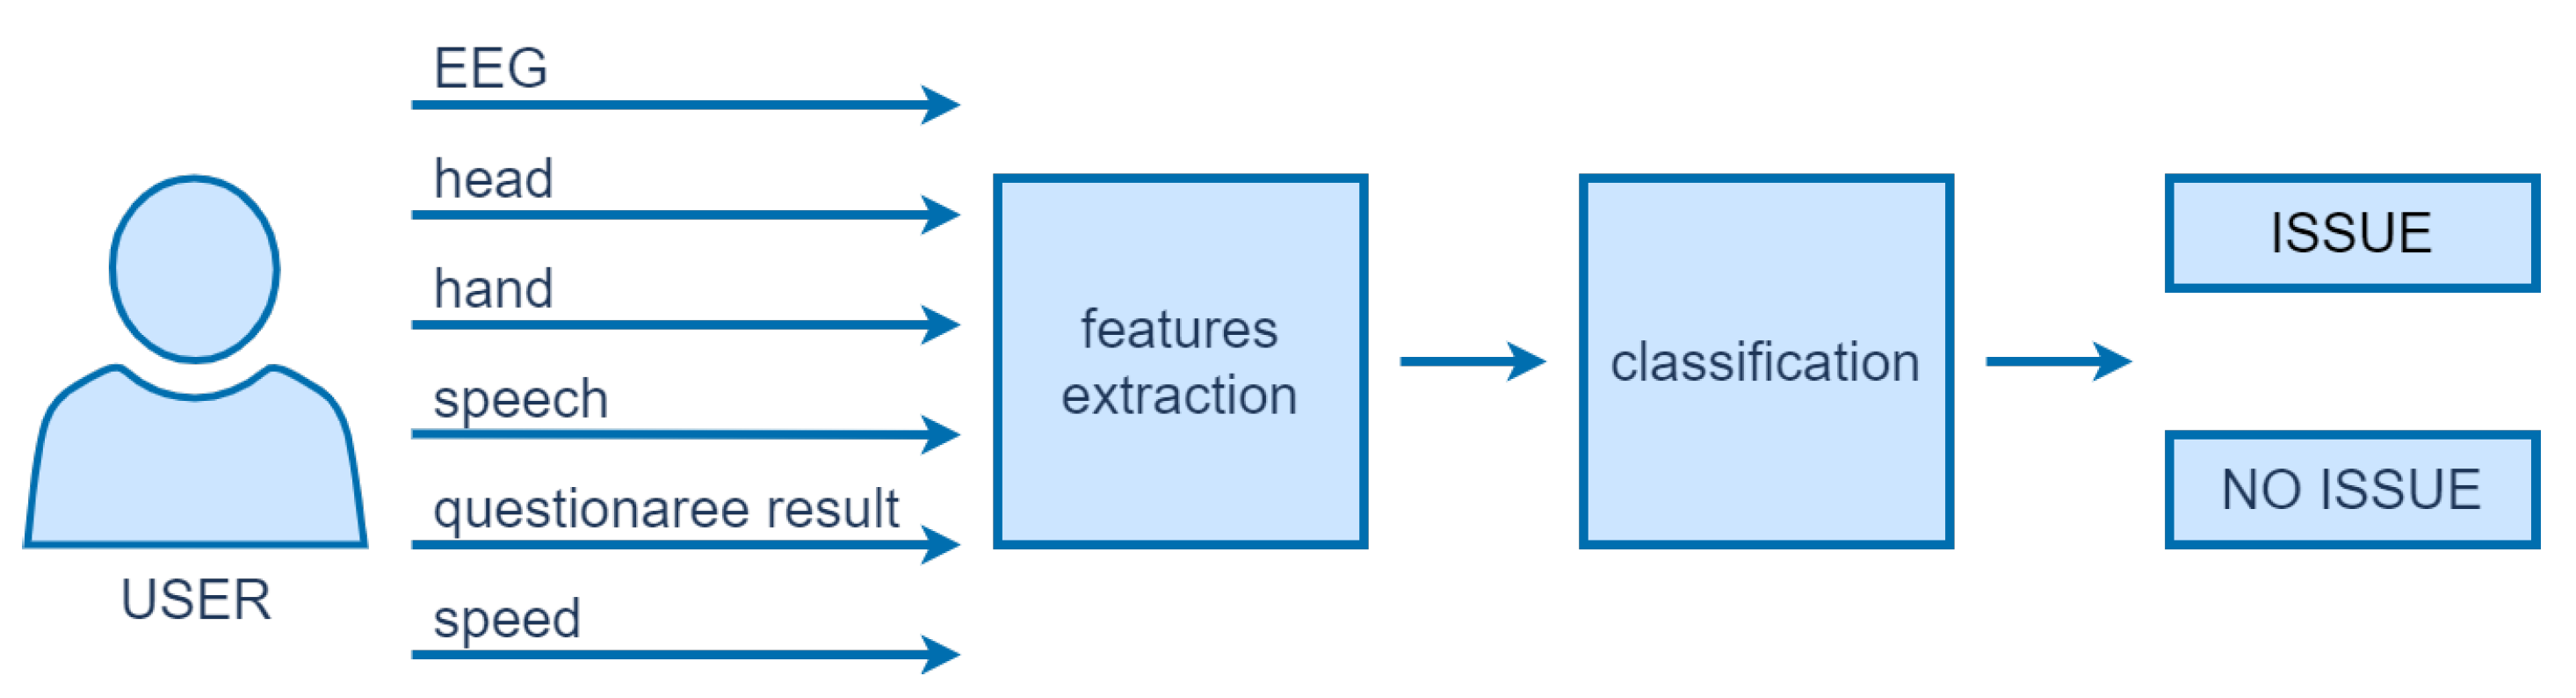
- We introduce a procedure for usability testing in VR. The procedure includes an automatic analysis of the objective data (e.g., EEG and speech signal analysis, head and hand tracking, speed of task performance) extracted during typical usability testing, and automatic analysis of subjective data represented by questionnaire answers.
- The introduced procedure was tested on fourteen subjects. The results are juxtaposed with specialists’ observations as well as user subjective opinions (post-interview).
- All devices used for collecting objective data are integrated with the headset, thus there is no need for additional external measuring or data collecting equipment, which can disturb the VR experience and consequently influence the usability test results.
- The presented solution is especially aimed at performing usability tests at scale, eliminating the need for constant supervision and observation, which is resource-consuming or impossible with bigger test groups.
2. Related Works
2.1. User-Subjective Metrics in VR Usability Testing
2.2. Objective Metrics in VR Usability Testing
3. VR Design
4. Methods and Analysis
4.1. Study Design
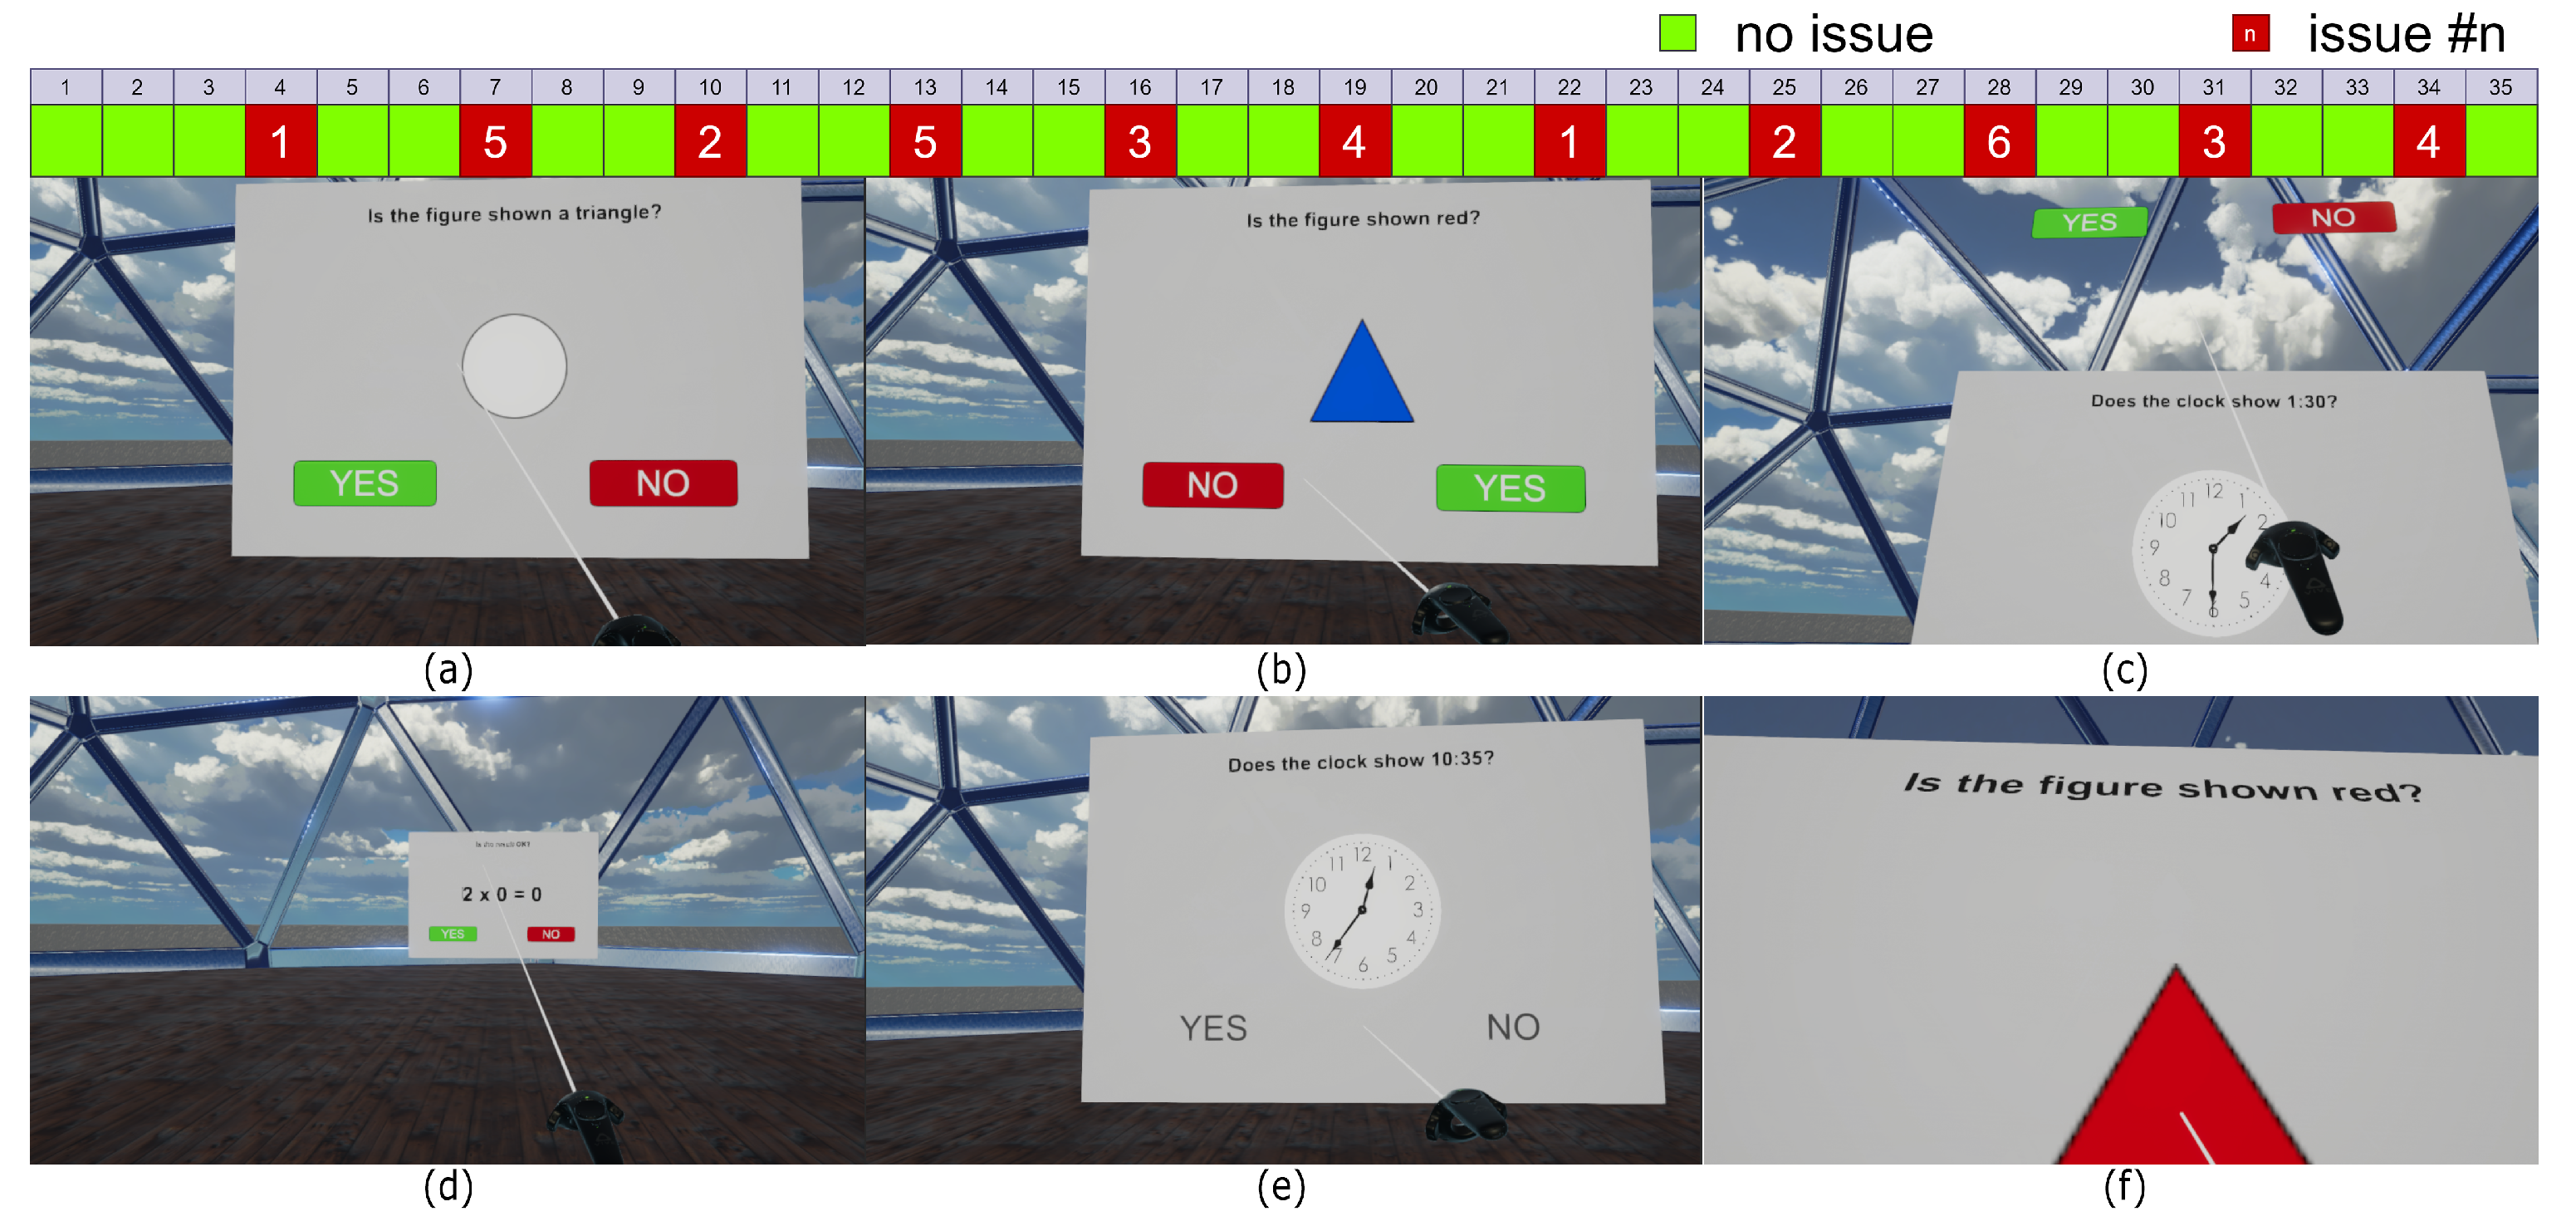
- issue #1—interface board in the wrong distance from user (too close, too far away);
- issue #2—swapped places of answer buttons;
- issue #3—answers without button (just letters without any frame);
- issue #4—answer buttons out of field of view (also connected with arm fatigue);
- issue #5—haptic inconsistency;
- issue #6—sound inconsistency.
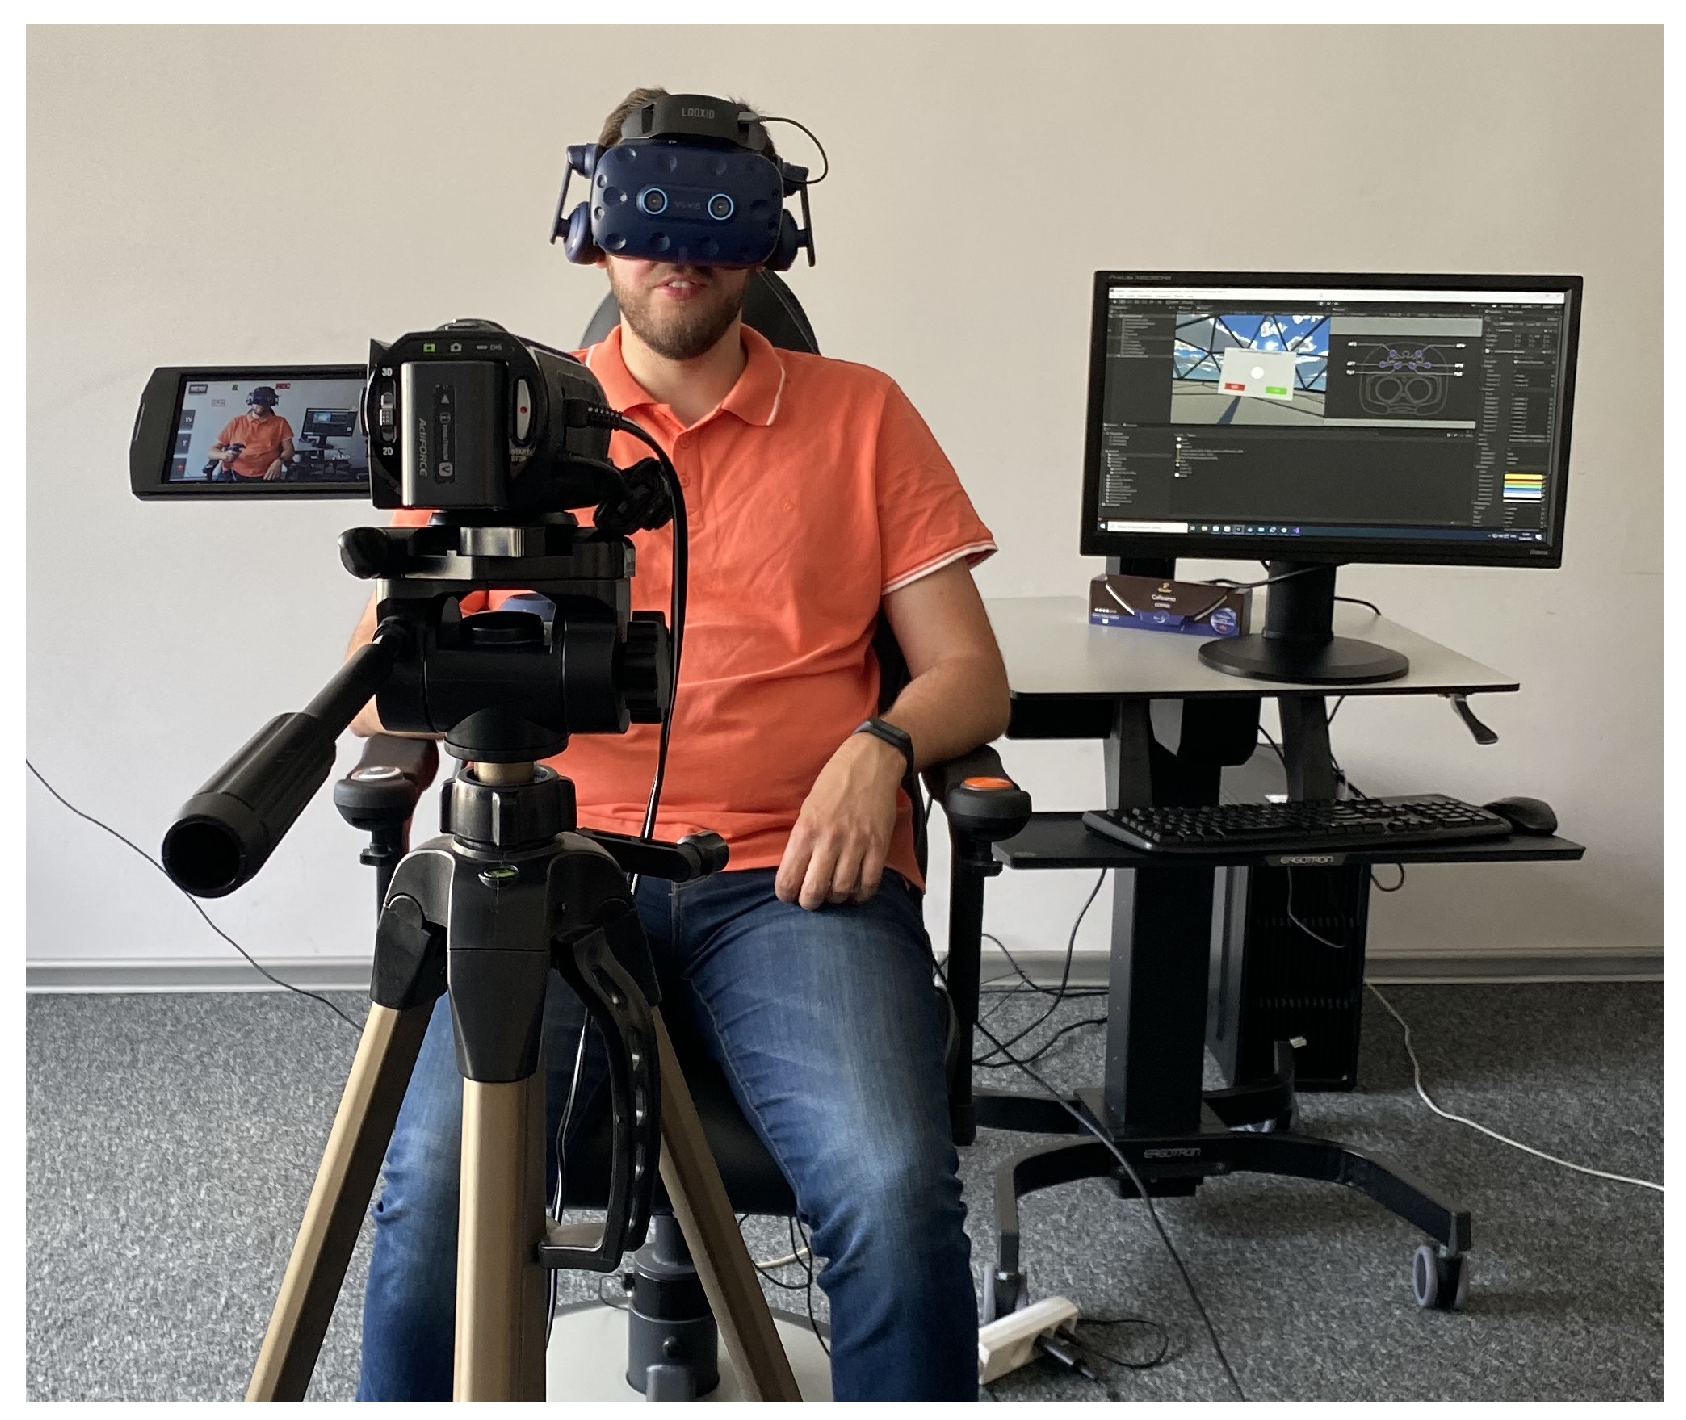
4.2. Study Settings
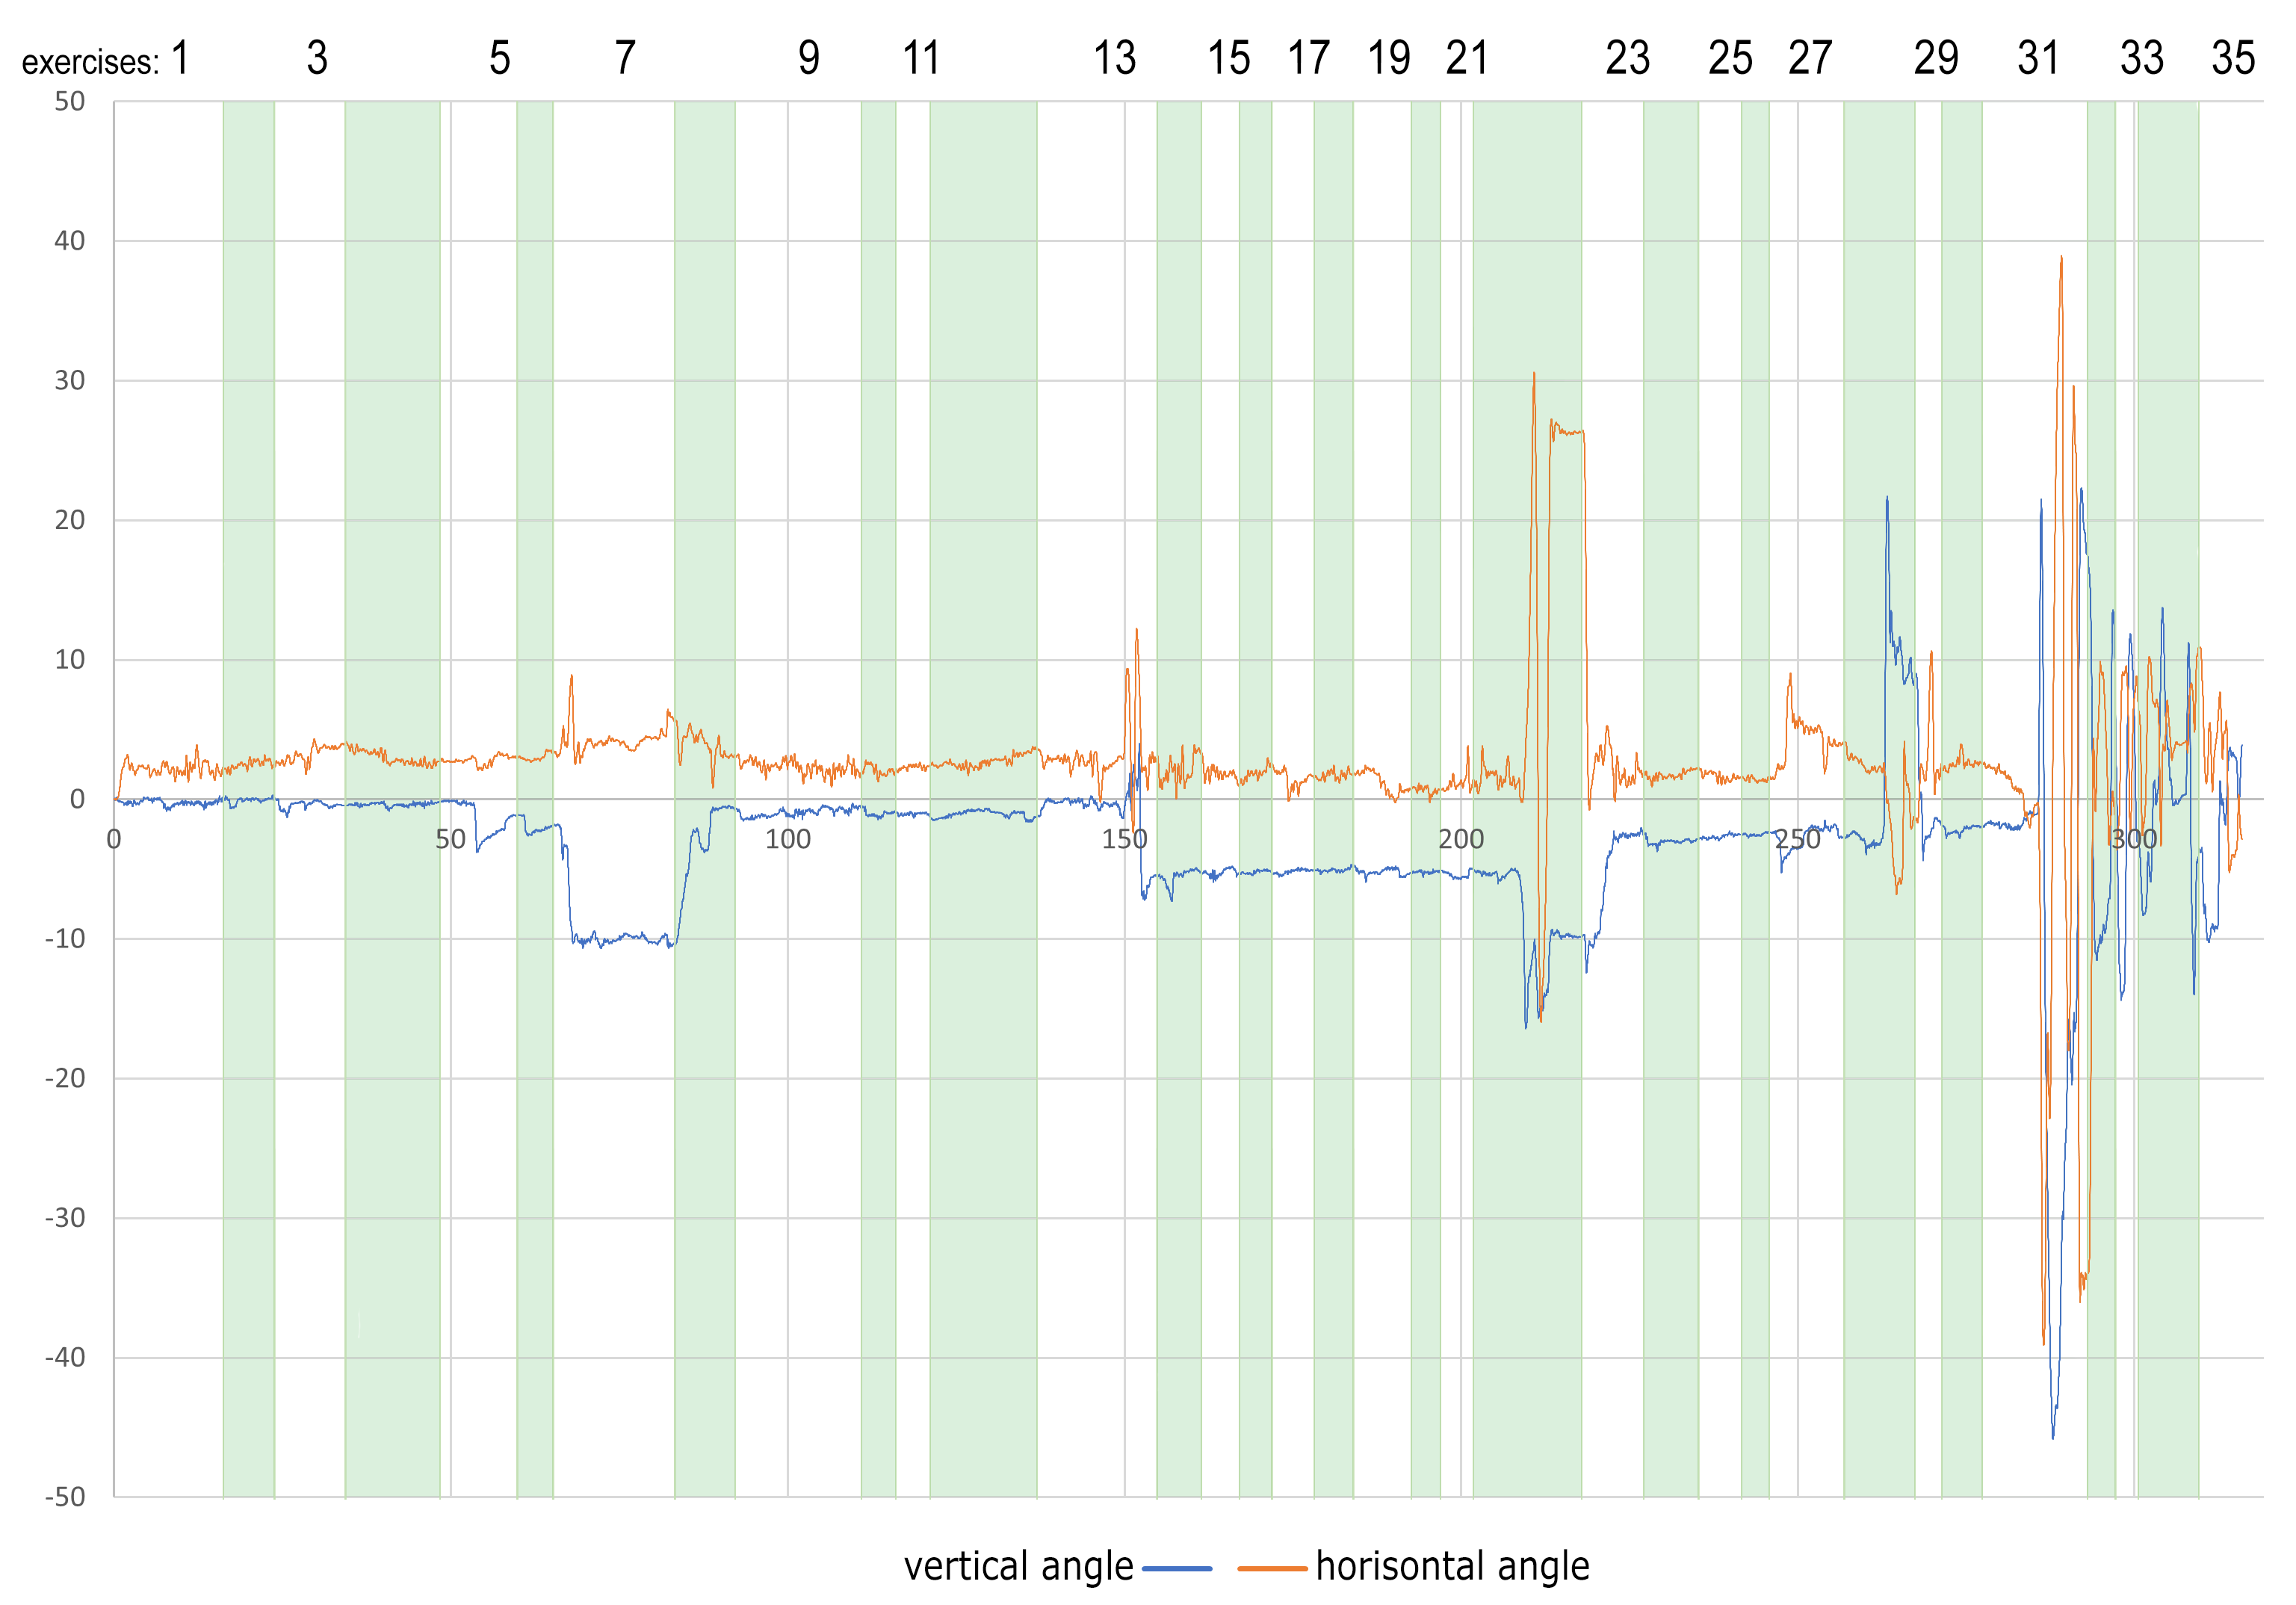
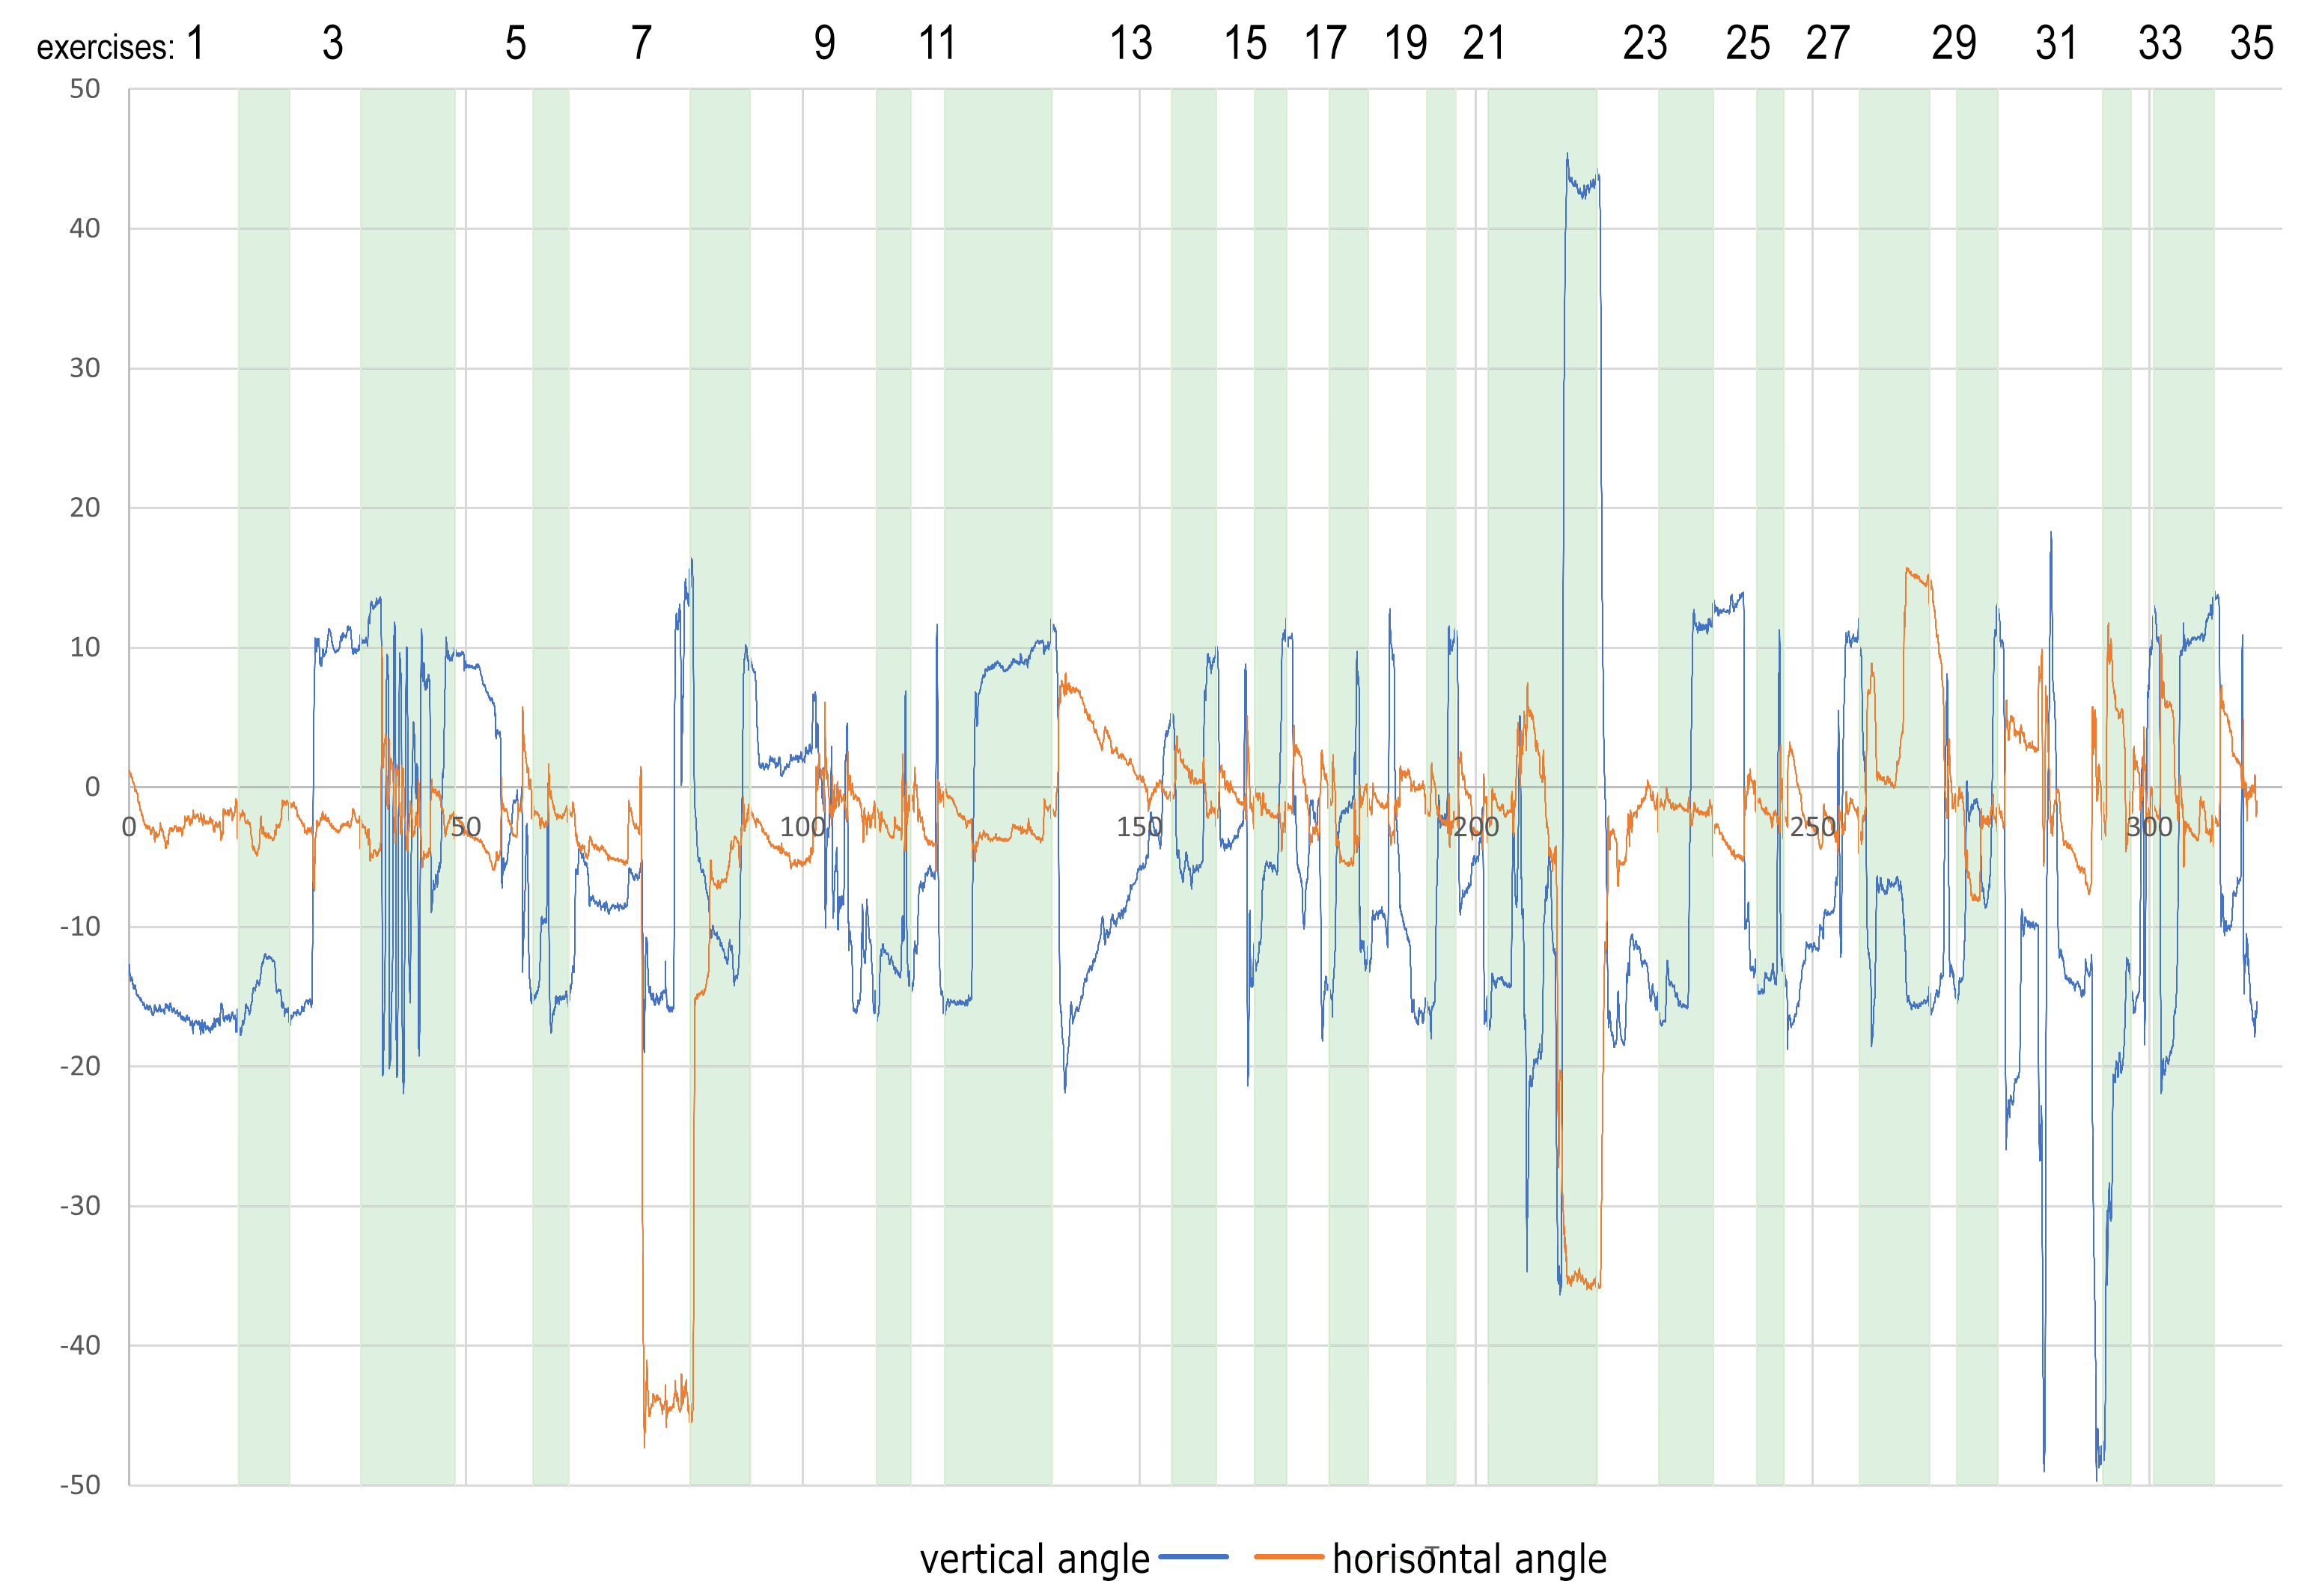
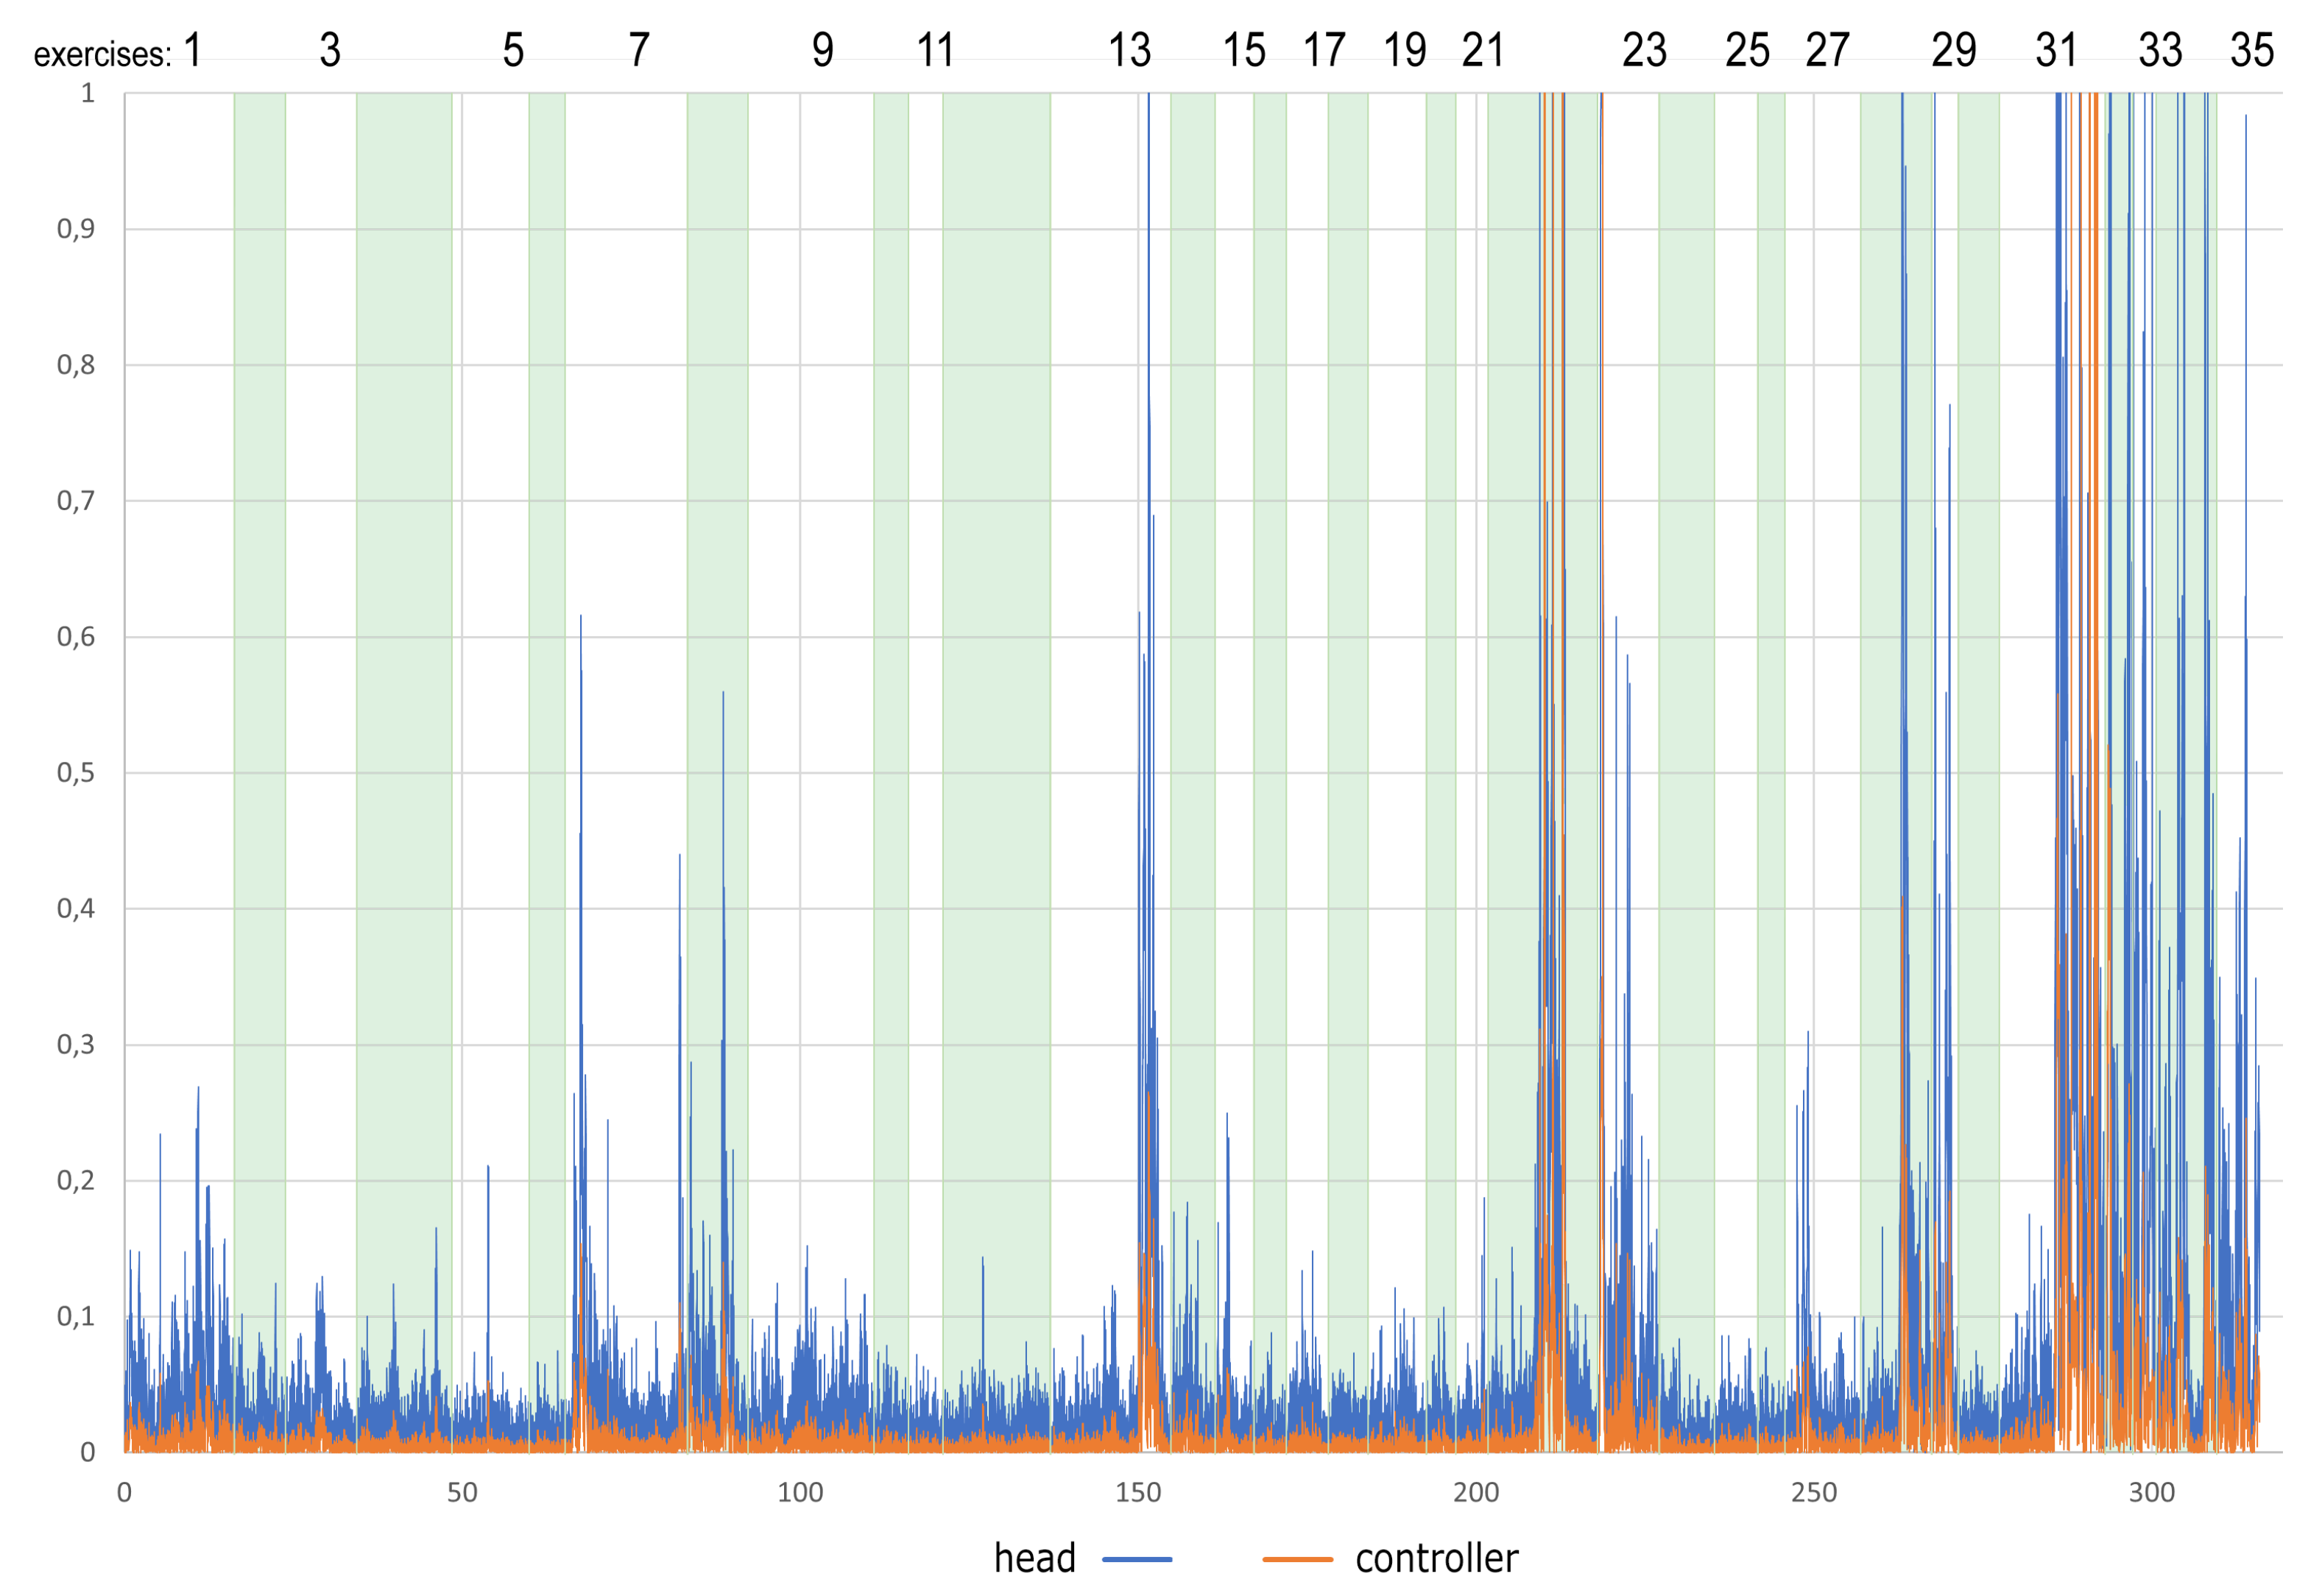
4.2.1. HMD Built-In Head and Hands Tracking
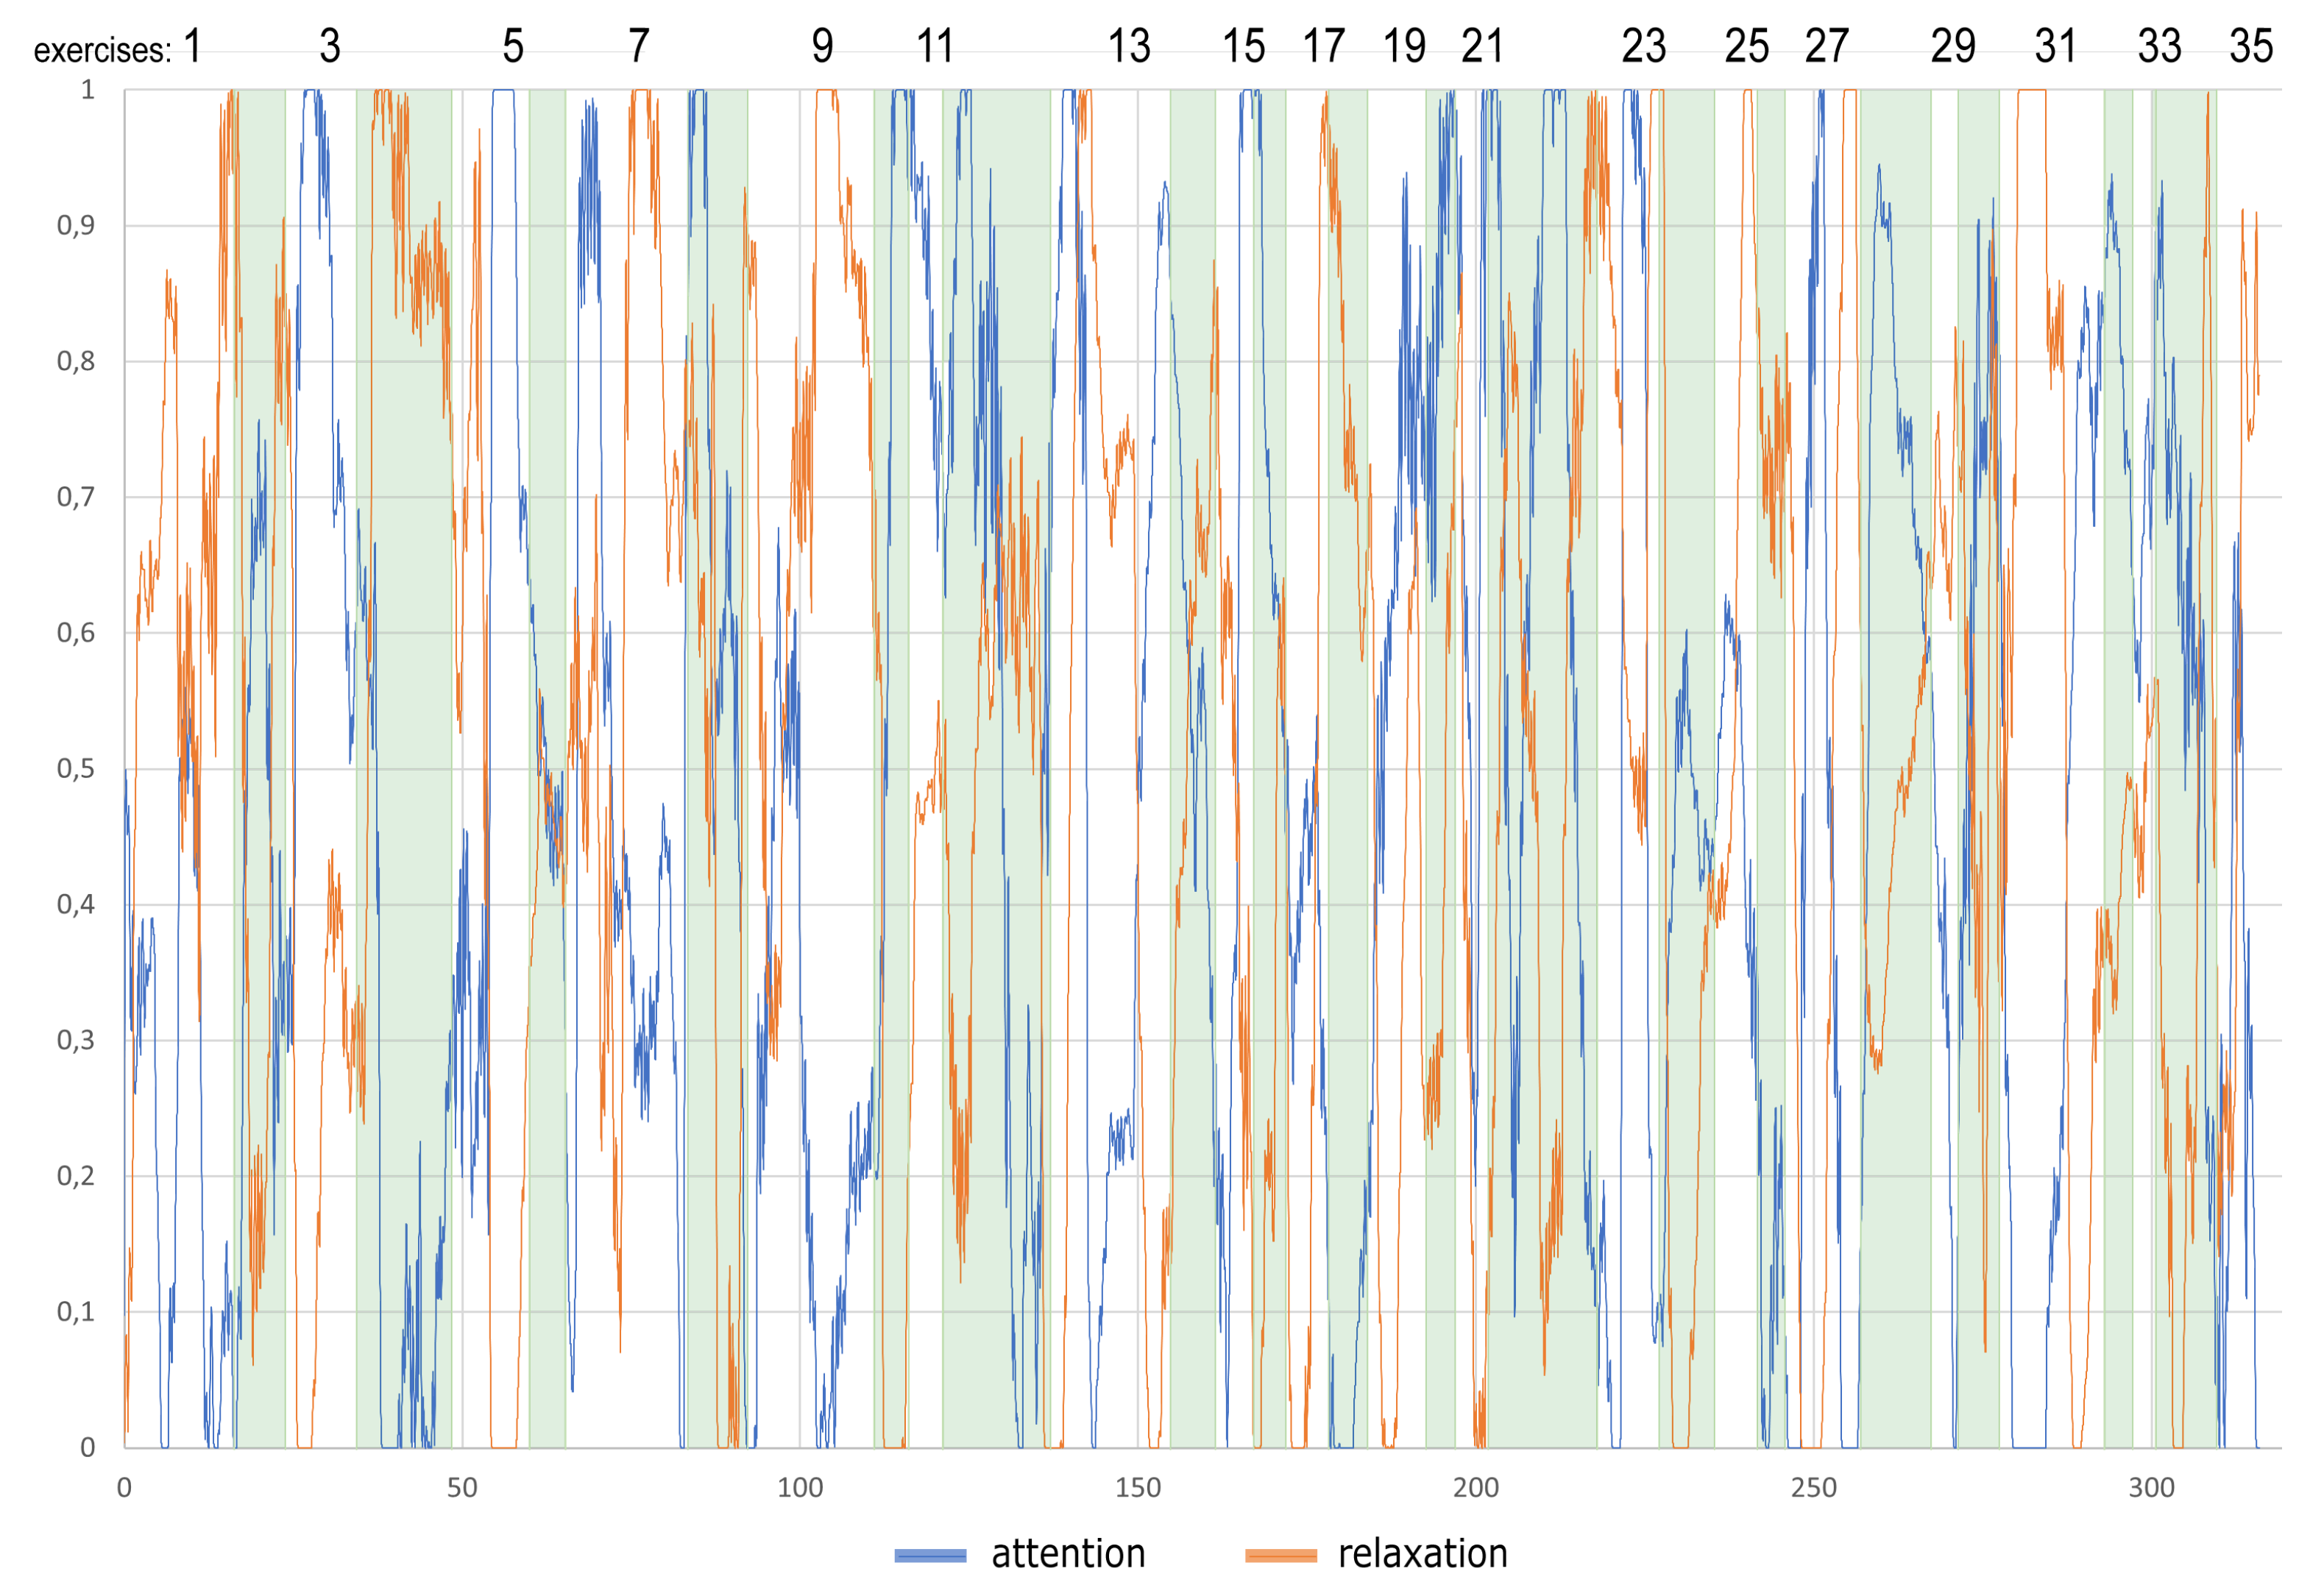
4.2.2. Electroencephalography
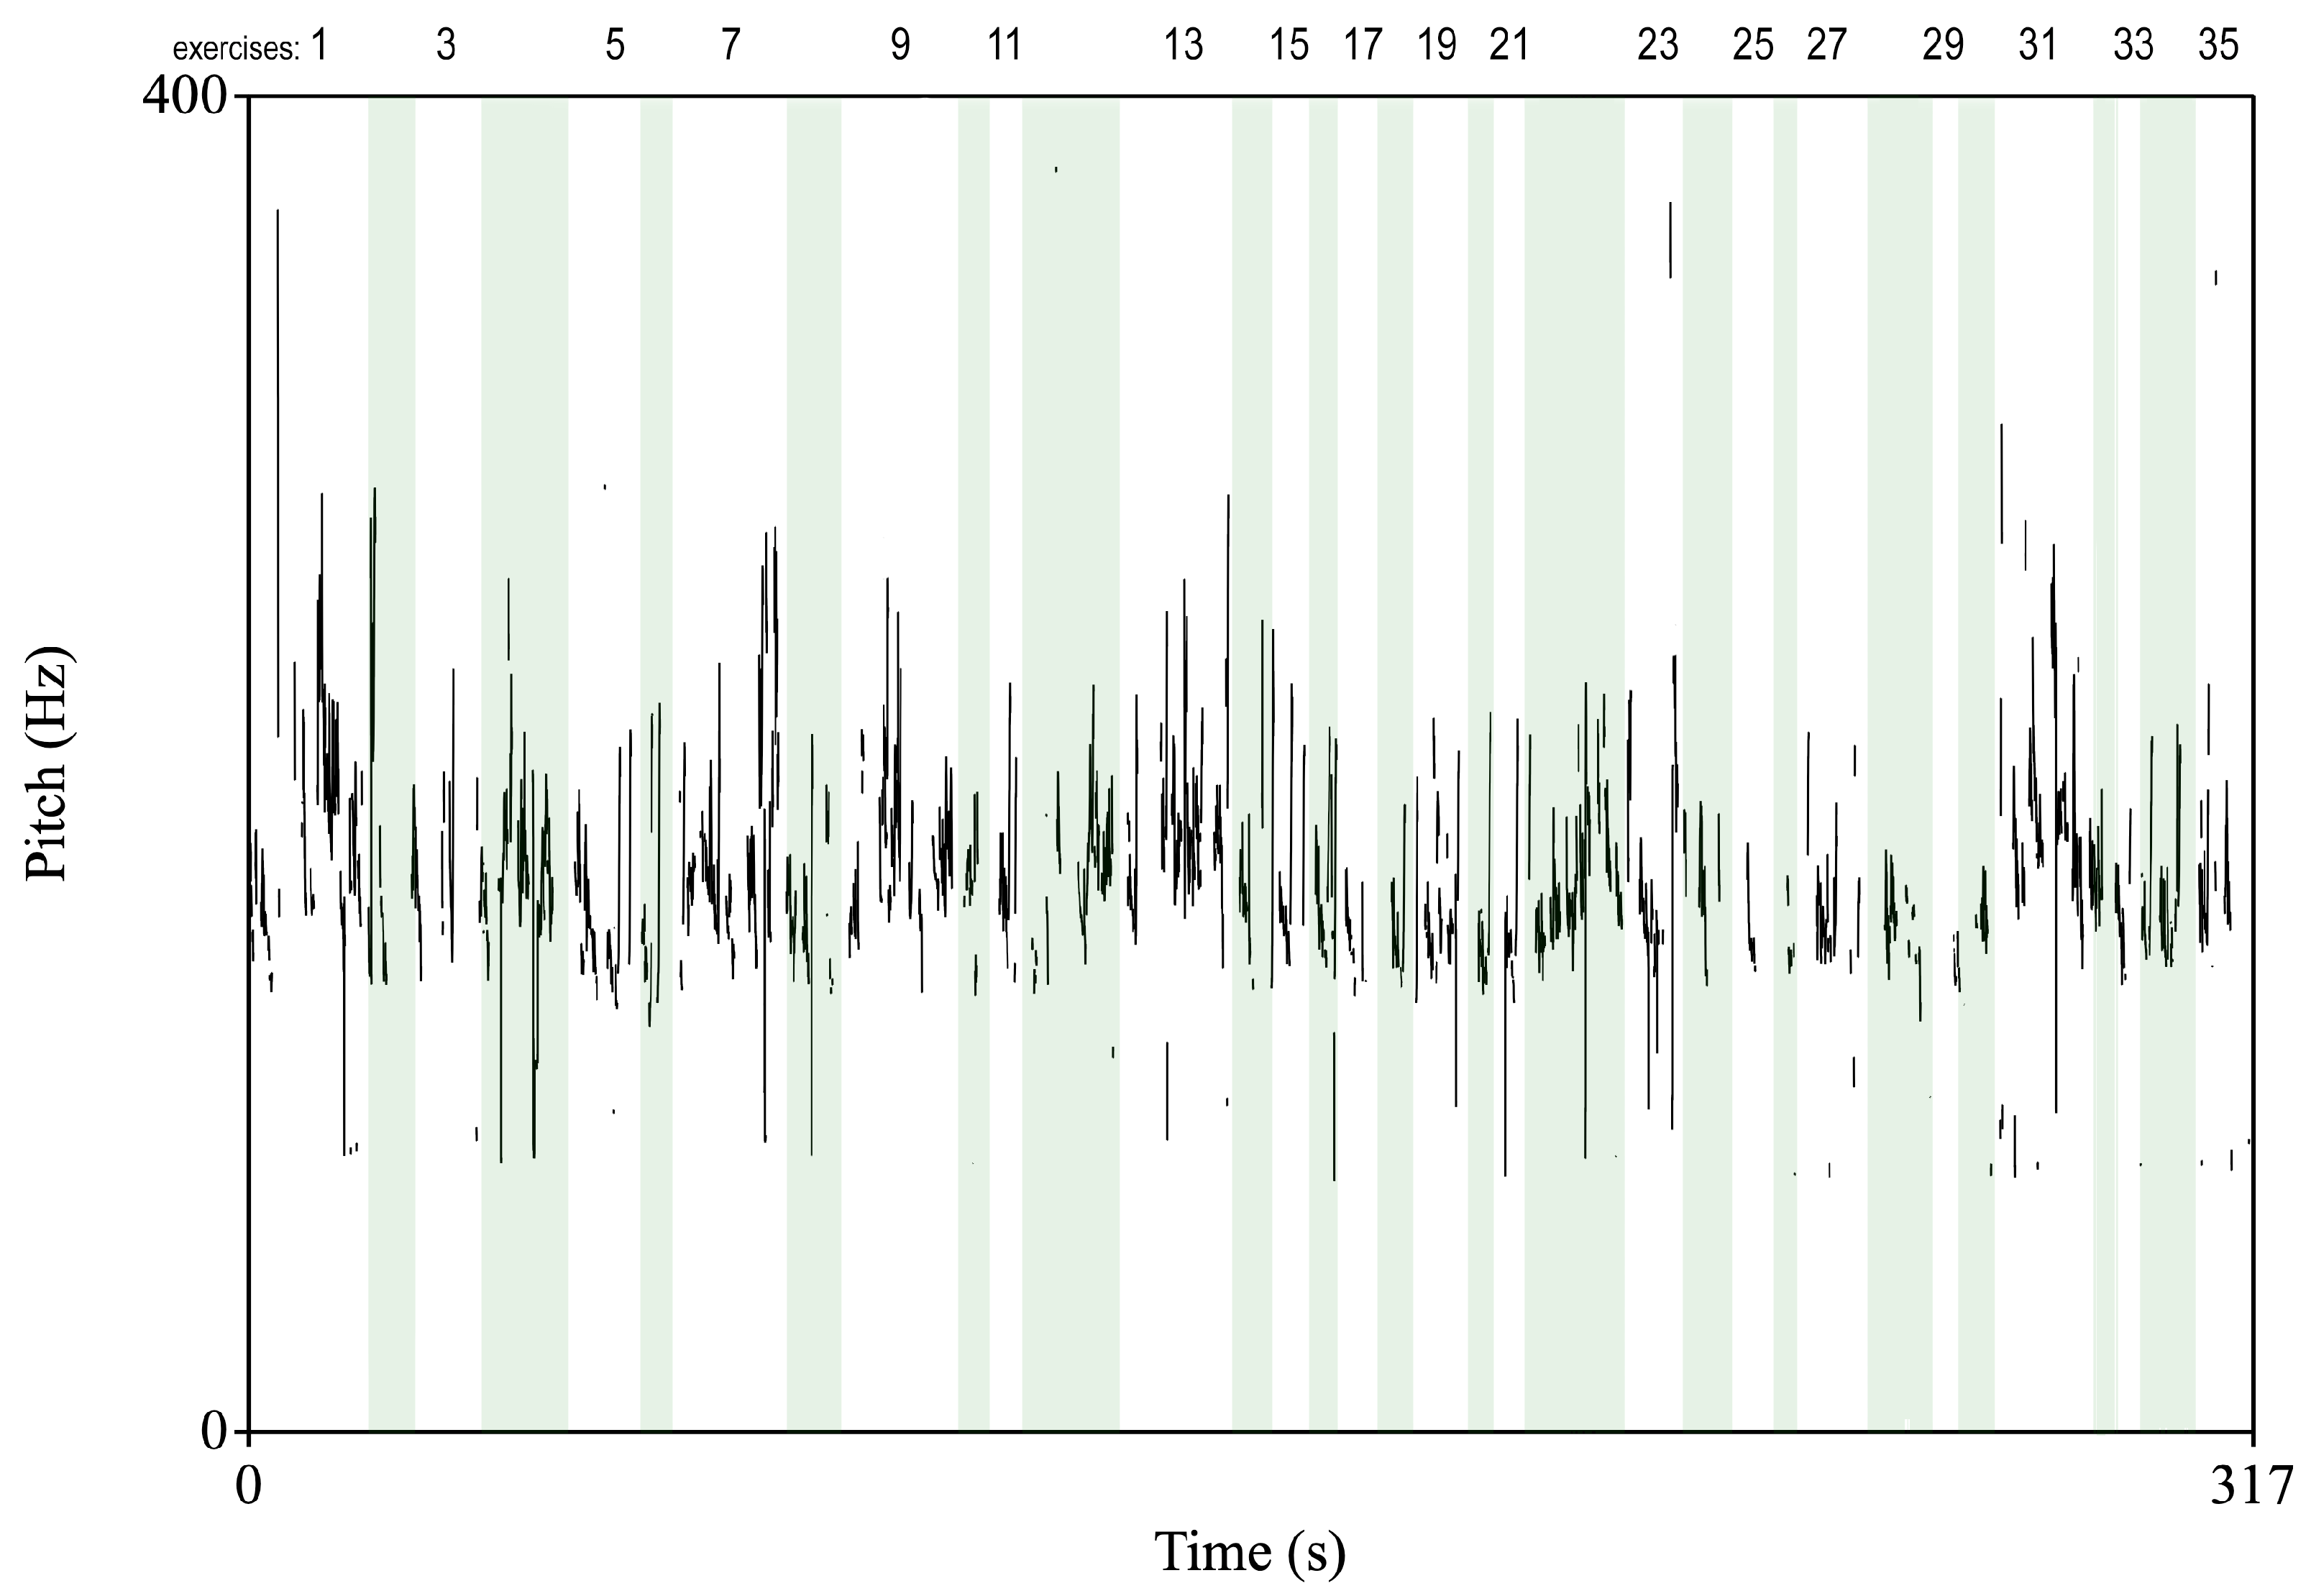
4.2.3. Video Analysis
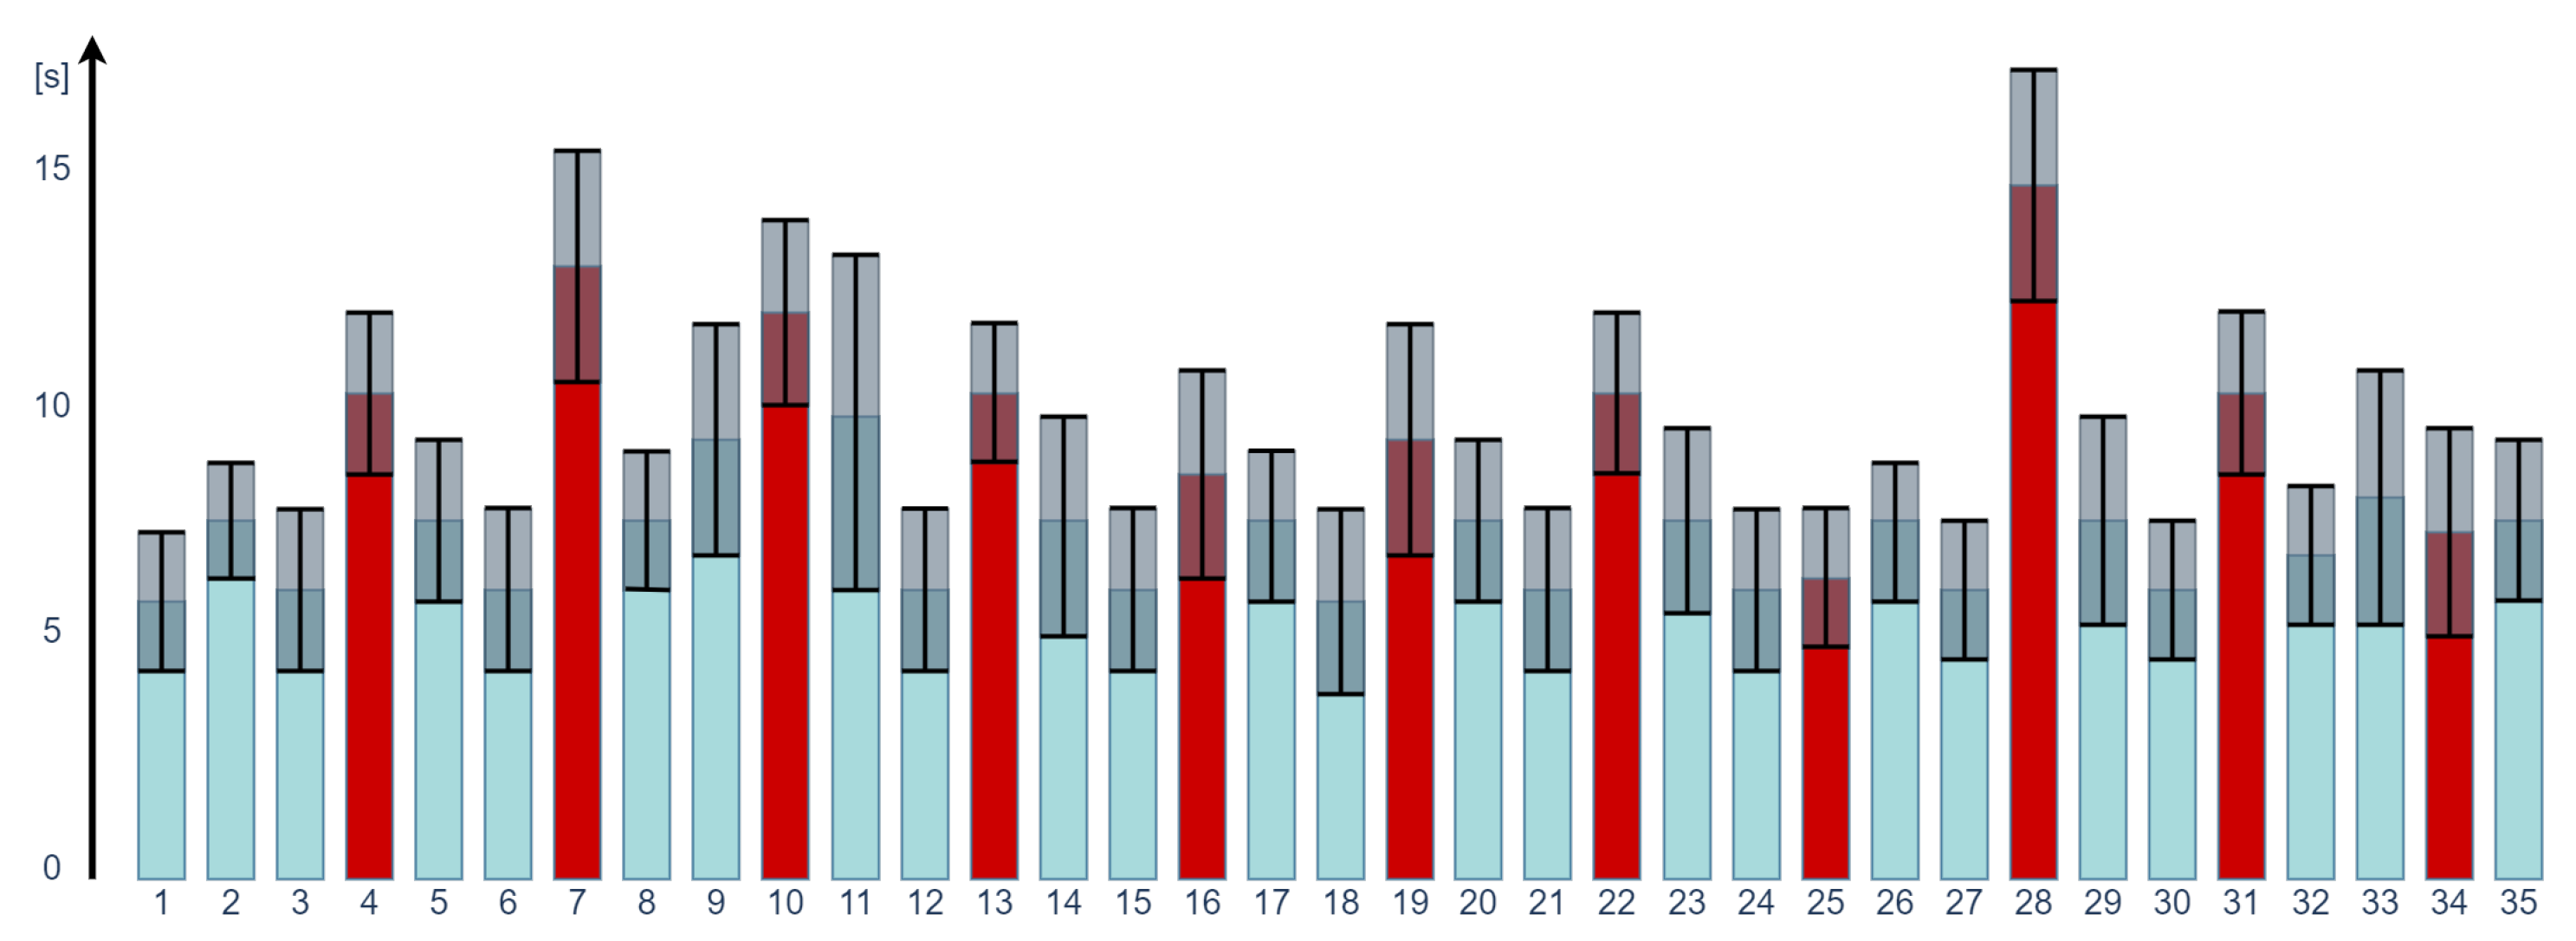
4.2.4. Task Performance
4.2.5. User Observation Analysis
4.3. Procedure
4.4. Automatic Usability Testing
4.4.1. Features Extraction
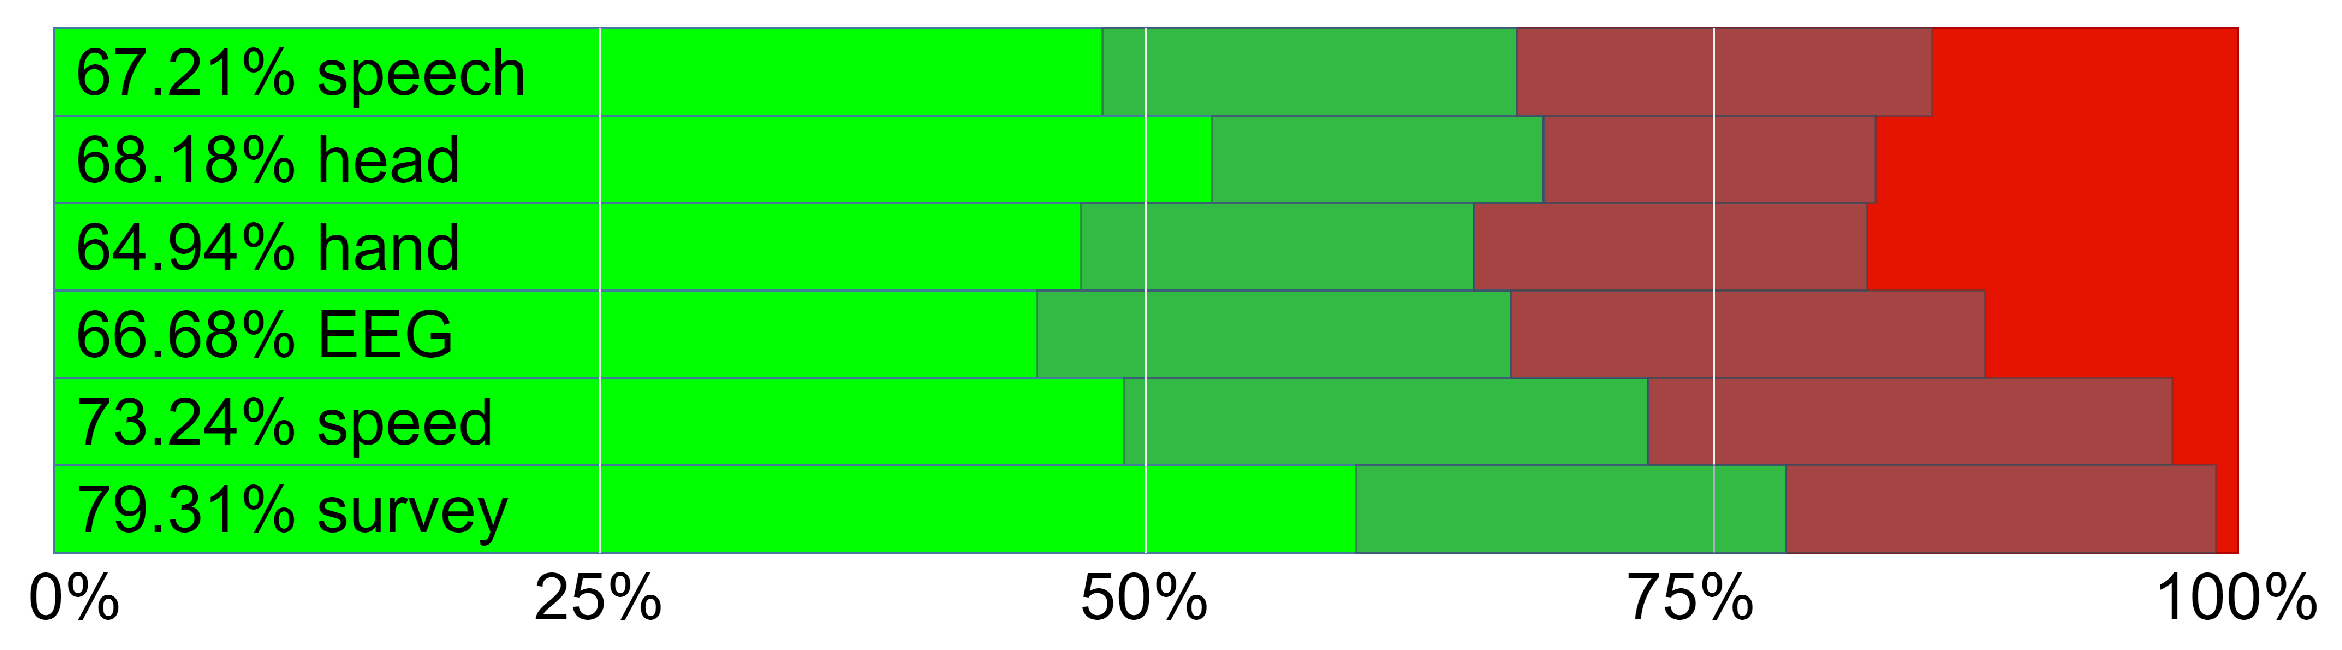
4.4.2. Classification
5. Results Discussion
5.1. Automatic Usability Testing Results
5.2. Usability Questionnaire Results
5.3. Usability Observation Evaluation
- The distance between user and UI board does matter. of users were confused and rather taken aback when the UI was too close; some of them nervously looked around to read and choose the chosen answer; selection of the correct button was challenging for them as well. of test participants had problems seeing clearly and reading when the UI was too far. Interestingly, older participants and those with hyperopia did not find this error problematic.
- Users get used to UI arrangement (in this case button arrangement). When the answer buttons (YES/NO) were swapped, of users were confused and unsure if they had selected the correct answer. The design of answer buttons with frame and colour (YES—green, NO—red) helped users to find the desired option. Without buttons, of users did not know where they should exactly press. When the buttons were out of field of view, all users needed more time to find out “new arrangement”, so they used more time for such questions (statistically over twice as long). However, the users adapted to buttons outside the board and there was less confusion in the next questions with such UI error.
- Controller vibrations do not play a key role in VR experience. of participants did not notice any changes in controller vibrations, and the majority of them did not feel any haptics.
- Sound is a valuable element of UI and supports giving user feedback as well. When the sound was changed a few users were confused and unsure whether they had selected the correct answer.
6. Conclusions
Author Contributions
Funding
Institutional Review Board Statement
Informed Consent Statement
Conflicts of Interest
References
- Bevan, N. International standards for HCI and usability. Int. J. Hum. Comput. Stud. 2001, 55, 533–552. [Google Scholar] [CrossRef] [Green Version]
- Nielsen, J. Usability 101: Introduction to Usability. Available online: https://www.nngroup.com/articles/usability-101-introduction-to-usability/ (accessed on 3 January 2021).
- Lazar, J.; Feng, J.H.; Hochheiser, H. Research Methods in Human-Computer Interaction; Morgan Kaufmann: Burlington, MA, USA, 2017. [Google Scholar]
- Hass, C. A practical guide to usability testing. In Consumer Informatics and Digital Health; Springer Nature: Cham, Switzerland, 2019; pp. 107–124. [Google Scholar]
- Hartson, H.R.; Andre, T.S.; Williges, R.C. Criteria for evaluating usability evaluation methods. Int. J. Hum. Comput. Interact. 2001, 13, 373–410. [Google Scholar] [CrossRef]
- Budiu, R. Quantitative vs. Qualitative Usability Testing. 2021. Available online: https://www.nngroup.com/articles/quant-vs-qual/ (accessed on 3 January 2021).
- Dumas, J.S.; Dumas, J.S.; Redish, J. A Practical Guide to Usability Testing; Intellect books; School of Art and Design Earl Richards Road North: Exeter, UK, 1999. [Google Scholar]
- Nielsen, J. Usability inspection methods. In Conference Companion on Human Factors in Computing Systems; Association for Computing Machinery: New York, NY, USA, 1994; pp. 413–414. [Google Scholar]
- Horsky, J.; McColgan, K.; Pang, J.E.; Melnikas, A.J.; Linder, J.A.; Schnipper, J.L.; Middleton, B. Complementary methods of system usability evaluation: Surveys and observations during software design and development cycles. Int. J. Biomed. Inf. 2010, 43, 782–790. [Google Scholar] [CrossRef] [PubMed] [Green Version]
- Diah, N.M.; Ismail, M.; Ahmad, S.; Dahari, M.K.M. Usability testing for educational computer game using observation method. In Proceedings of the 2010 International Conference on Information Retrieval & Knowledge Management (CAMP), Shah Alam, Malaysia, 17–18 March 2010; pp. 157–161. [Google Scholar]
- Walji, M.F.; Kalenderian, E.; Piotrowski, M.; Tran, D.; Kookal, K.K.; Tokede, O.; White, J.M.; Vaderhobli, R.; Ramoni, R.; Stark, P.C.; et al. Are three methods better than one? A comparative assessment of usability evaluation methods in an EHR. Int. J. Med. Inf. 2014, 83, 361–367. [Google Scholar] [CrossRef] [Green Version]
- Stappers, P.J.; Giaccardi, E. Research through design. In The Encyclopedia of Human-Computer Interaction; The Interaction Design Foundation: Aarhus, Denmark, 2017; pp. 1–94. [Google Scholar]
- Yeung, A.W.K.; Tosevska, A.; Klager, E.; Eibensteiner, F.; Laxar, D.; Stoyanov, J.; Glisic, M.; Zeiner, S.; Kulnik, S.T.; Crutzen, R.; et al. Virtual and augmented reality applications in medicine: Analysis of the scientific literature. J. Med. Internet Res. 2021, 23, e25499. [Google Scholar] [CrossRef] [PubMed]
- Kamińska, D.; Smółka, K.; Zwoliński, G.; Wiak, S.; Merecz-Kot, D.; Anbarjafari, G. Stress reduction using bilateral stimulation in virtual reality. IEEE Access 2020, 8, 200351–200366. [Google Scholar] [CrossRef]
- Kamińska, D.; Sapiński, T.; Wiak, S.; Tikk, T.; Haamer, R.E.; Avots, E.; Helmi, A.; Ozcinar, C.; Anbarjafari, G. Virtual reality and its applications in education: Survey. Information 2019, 10, 318. [Google Scholar] [CrossRef] [Green Version]
- He, Z.; Du, R.; Perlin, K. CollaboVR: A Reconfigurable Framework for Creative Collaboration in Virtual Reality. In Proceedings of the 2020 IEEE International Symposium on Mixed and Augmented Reality (ISMAR), Porto de Galinhas, Brazil, 9–13 November 2020; pp. 542–554. [Google Scholar]
- Knierim, P.; Schmidt, A. The Virtual Office of the Future: Are Centralized Workplaces Obsolete? Available online: https://www.microsoft.com/en-us/research/publication/the-virtual-office-of-the-future-are-centralized-workplaces-obsolete/ (accessed on 3 January 2021).
- Roos, G.; Oláh, J.; Ingle, R.; Kobayashi, R.; Feldt, M. Online conferences—Towards a new (virtual) reality. Comput. Theor. Chem. 2020, 1189, 112975. [Google Scholar] [CrossRef]
- Steinicke, F.; Lehmann-Willenbrock, N.; Meinecke, A.L. A first pilot study to compare virtual group meetings using video conferences and (immersive) virtual reality. In Proceedings of the SUI ’20: Symposium on Spatial User Interaction, Virtual Event. New York, NY, USA, 30 October 2020; pp. 1–2. [Google Scholar]
- Sutcliffe, A.G.; Kaur, K.D. Evaluating the usability of virtual reality user interfaces. Behav. Inf. Technol. 2000, 19, 415–426. [Google Scholar] [CrossRef]
- Fang, Y.M.; Lin, C. The usability testing of VR interface for tourism apps. Appl. Sci. 2019, 9, 3215. [Google Scholar] [CrossRef] [Green Version]
- Lewis, J.R. The system usability scale: Past, present, and future. Int. J. Hum. Comput. Interact. 2018, 34, 577–590. [Google Scholar] [CrossRef]
- Siregar, R.M.P.; Sudarmilah, E.; Istiadi, I. Approachability Evaluation of Virtual Reality Educational Game: The Case of Keepin. J. Phys. Conf. Ser. 2021, 1908, 012013. [Google Scholar] [CrossRef]
- de França, A.C.P.; Neto, J.P.; Soares, M.M. Methods and procedures to usability testing in virtual reality systems. In Proceedings of the International Conference on Applied Human Factors and Ergonomics, Los Angeles, CA, USA, 17–21 July 2017; pp. 45–51. [Google Scholar]
- Chin, C.; Teou, L.Y. Using concept cartoons in formative assessment: Scaffolding students’ argumentation. Int. J. Sci. Educ. Technol. 2009, 31, 1307–1332. [Google Scholar] [CrossRef]
- Zhang, T.; Booth, R.; Jean-Louis, R.; Chan, R.; Yeung, A.; Gratzer, D.; Strudwick, G. A primer on usability assessment approaches for health-related applications of virtual reality. JMIR Serious Games 2020, 8, e18153. [Google Scholar] [CrossRef] [PubMed]
- Oliveira, R.; Calsavara, D.; Oliveira, P.; Fernandes Tavares, T. Measurement Methods for Phenomena Associated with Immersion, Engagement, Flow, and Presence in Digital Games; SBGames: Sao Paolo, Brazil, 2016. [Google Scholar]
- Chandra, A.N.R.; El Jamiy, F.; Reza, H. A review on usability and performance evaluation in virtual reality systems. In Proceedings of the 2019 International Conference on Computational Science and Computational Intelligence (CSCI), Las Vegas, NV, USA, 5 December 2019; pp. 1107–1114. [Google Scholar]
- Lucas, J.D. Immersive VR in the construction classroom to increase student understanding of sequence, assembly, and space of wood frame construction. J. Inf. Technol. Constr. 2018, 23, 179–194. [Google Scholar]
- Sylvan, C.A. Virtual Reality (VR) for Leadership: VR Assisted Meditation Training for Leadership Development. Ph.D. Thesis, San Francisco State University, San Francisco, CA, USA, 2019. [Google Scholar]
- Andrade, S.A.; Quevedo, A.J.U.; Nunes, F.L.; Delamaro, M.E. Understanding VR Software Testing Needs from Stakeholders’ Points of View. In Proceedings of the 2020 22nd Symposium on Virtual and Augmented Reality (SVR), Porto de Galinhas, Brasil, 7–10 November 2020; pp. 57–66. [Google Scholar]
- Montoya, M.F.; Muñoz, J.E.; Henao, O.A. Enhancing Virtual Rehabilitation in Upper Limbs With Biocybernetic Adaptation: The Effects of Virtual Reality on Perceived Muscle Fatigue, Game Performance and User Experience. IEEE Trans. Neural Syst. Rehabil. Eng. 2020, 28, 740–747. [Google Scholar] [CrossRef]
- IJsselsteijn, W.A.; de Kort, Y.A.; Poels, K. The Game Experience Questionnaire; Technische Universiteit Eindhoven: Eindhoven, The Netherlands, 2013; Volume 46. [Google Scholar]
- Brooke, J. SUS-A quick and dirty usability scale. In Usability Evaluation in Industry; CRC Press: London, UK, 1996; pp. 4–7. [Google Scholar]
- Borg, G. Borg’s Perceived Exertion and Pain Scales; Human Kinetics: Stockholm, Sweden, 1998. [Google Scholar]
- Proffitt, R.; Glegg, S.; Levac, D.; Lange, B. End-user involvement in rehabilitation virtual reality implementation research. J. Enabling Technol. 2019, 13. [Google Scholar] [CrossRef]
- Wolfartsberger, J. Analyzing the potential of Virtual Reality for engineering design review. Autom. Constr. 2019, 104, 27–37. [Google Scholar] [CrossRef]
- Shelstad, W.J.; Smith, D.C.; Chaparro, B.S. Gaming on the rift: How virtual reality affects game user satisfaction. In Proceedings of the Human Factors and Ergonomics Society Annual Meeting, Los Angeles, CA, USA, 9–13 October 2017; pp. 2072–2076. [Google Scholar]
- Soegaard, M.; Dam, R.F. The Encyclopedia of Human-Computer Interaction; IGI Global: Hershey, PA, USA, 2012. [Google Scholar]
- Yin, M.S.; Haddawy, P.; Suebnukarn, S.; Kulapichitr, F.; Rhienmora, P.; Jatuwat, V.; Uthaipattanacheep, N. Formative feedback generation in a VR-based dental surgical skill training simulator. J. Biomed. Inf. 2021, 114, 103659. [Google Scholar] [CrossRef]
- Schensul, S.L.; Schensul, J.J.; LeCompte, M.D. Essential Ethnographic Methods: Observations, Interviews, and Questionnaires; Rowman Altamira: Walnut Creek, CA, USA, 1999. [Google Scholar]
- Virvou, M.; Katsionis, G. On the usability and likeability of virtual reality games for education: The case of VR-ENGAGE. Comput. Educ. 2008, 50, 154–178. [Google Scholar] [CrossRef]
- Seo, N.J.; Kumar, J.A.; Hur, P.; Crocher, V.; Motawar, B.; Lakshminarayanan, K. Usability evaluation of low-cost virtual reality hand and arm rehabilitation games. J. Rehabil. Res. Dev. 2016, 53, 321. [Google Scholar] [CrossRef]
- Schnack, A.; Wright, M.J.; Holdershaw, J.L. Immersive virtual reality technology in a three-dimensional virtual simulated store: Investigating telepresence and usability. Food Res. Int. 2019, 117, 40–49. [Google Scholar] [CrossRef] [PubMed]
- Ng, J.T.d.; Liu, W.; Hu, X.; Jung, T.P. Evaluation of Low-end Virtual Reality Content of Cultural Heritage: A Preliminary Study with Eye Movement. In Proceedings of the ACM/IEEE Joint Conference on Digital Libraries in 2020, Wuhan, China, 1–5 August 2020; pp. 365–368. [Google Scholar]
- Pallavicini, F.; Pepe, A.; Minissi, M.E. Gaming in virtual reality: What changes in terms of usability, emotional response and sense of presence compared to non-immersive video games? Simul. Gaming 2019, 50, 136–159. [Google Scholar] [CrossRef]
- Petukhov, I.V.; Glazyrin, A.E.; Gorokhov, A.V.; Steshina, L.A.; Tanryverdiev, I.O. Being present in a real or virtual world: A EEG study. Int. J. Med. Inform. 2020, 136, 103977. [Google Scholar] [CrossRef]
- Sapiński, T.; Kamińska, D.; Pelikant, A.; Anbarjafari, G. Emotion recognition from skeletal movements. Entropy 2019, 21, 646. [Google Scholar] [CrossRef] [Green Version]
- Kamińska, D. Emotional speech recognition based on the committee of classifiers. Entropy 2019, 21, 920. [Google Scholar] [CrossRef] [Green Version]
- Shi, R.; Liang, H.N.; Wu, Y.; Yu, D.; Xu, W. Virtual Reality Sickness Mitigation Methods: A Comparative Study in a Racing Game. Proc. ACM Comput. Graph. Interact. Tech. 2021, 4, 1–16. [Google Scholar] [CrossRef]
- Nelson-Quigg, J.M.; Cello, K.; Johnson, C.A. Predicting binocular visual field sensitivity from monocular visual field results. Investig. Ophthalmol. Vis. Sci. 2000, 41, 2212–2221. [Google Scholar]
- Field of View for Virtual Reality Headsets Explained. Available online: https://vr-lens-lab.com/ (accessed on 2 August 2021).
- Lee, J.; Sinclair, M.; Gonzalez-Franco, M.; Ofek, E.; Holz, C. TORC: A virtual reality controller for in-hand high-dexterity finger interaction. In Proceedings of the 2019 CHI Conference on Human Factors in Computing Systems, Glasgow, UK, 4–9 May 2019; pp. 1–13. [Google Scholar]
- Yang, L.; Huang, J.; Feng, T.; Hong-An, W.; Guo-Zhong, D. Gesture interaction in virtual reality. Virtual Real. Intell. Hardw. 2019, 1, 84–112. [Google Scholar]
- Perret, J.; Vander Poorten, E. Touching virtual reality: A review of haptic gloves. In Proceedings of the 16th International Conference on New Actuators, Bremen, Germany, 25–27 June 2018; pp. 1–5. [Google Scholar]
- Needleman, S.E. Virtual Reality, Now With the Sense of Touch. Wall Str. J. 2018. [Google Scholar]
- Kalwasiński, D. Interakcja człowieka ze środowiskiem wirtualnym za pomoca rzeczywistych i wirtualnych elementów sterowniczych. Probl. Mechatroniki 2017, 8. [Google Scholar]
- Tuena, C.; Pedroli, E.; Trimarchi, P.D.; Gallucci, A.; Chiappini, M.; Goulene, K.; Gaggioli, A.; Riva, G.; Lattanzio, F.; Giunco, F.; et al. Usability issues of clinical and research applications of virtual reality in older people: A systematic review. Front. Hum. Neurosci. 2020, 14, 93. [Google Scholar] [CrossRef] [Green Version]
- Monteiro, P.; Gonçalves, G.; Coelho, H.; Melo, M.; Bessa, M. Hands-free interaction in immersive virtual reality: A systematic review. IEEE Trans. Vis. Comput. Graph. 2021, 27, 2702–2713. [Google Scholar] [CrossRef] [PubMed]
- Brivio, E.; Serino, S.; Cousa, E.N.; Zini, A.; Riva, G.; De Leo, G. Virtual reality and 360 panorama technology: A media comparison to study changes in sense of presence, anxiety, and positive emotions. Virtual Real. 2021, 25, 303–311. [Google Scholar] [CrossRef]
- Navigation in Virtual Reality. Available online: https://manoramajha.medium.com/ (accessed on 4 August 2021).
- Shneiderman, B. Designing for fun: How can we design user interfaces to be more fun? Interactions 2004, 11, 48–50. [Google Scholar] [CrossRef]
- Schmidt, P.; Reiss, A.; Duerichen, R.; Van Laerhoven, K. Wearable affect and stress recognition: A review. arXiv 2018, arXiv:1811.08854. [Google Scholar]
- HTC VIVE. Available online: https://www.vive.com/us/ (accessed on 30 July 2021).
- Blackford, J.U.; Pine, D.S. Neural substrates of childhood anxiety disorders: A review of neuroimaging findings. Child Adolesc. Psychiatr. Clin. 2012, 21, 501–525. [Google Scholar] [CrossRef] [Green Version]
- Jo, A.; Chae, B.Y. Introduction to real time user interaction in virtual reality powered by brain computer interface technology. In ACM SIGGRAPH 2020 Real-Time Live! Association for Computing Machinery: New York, NY, USA, 2020. [Google Scholar]
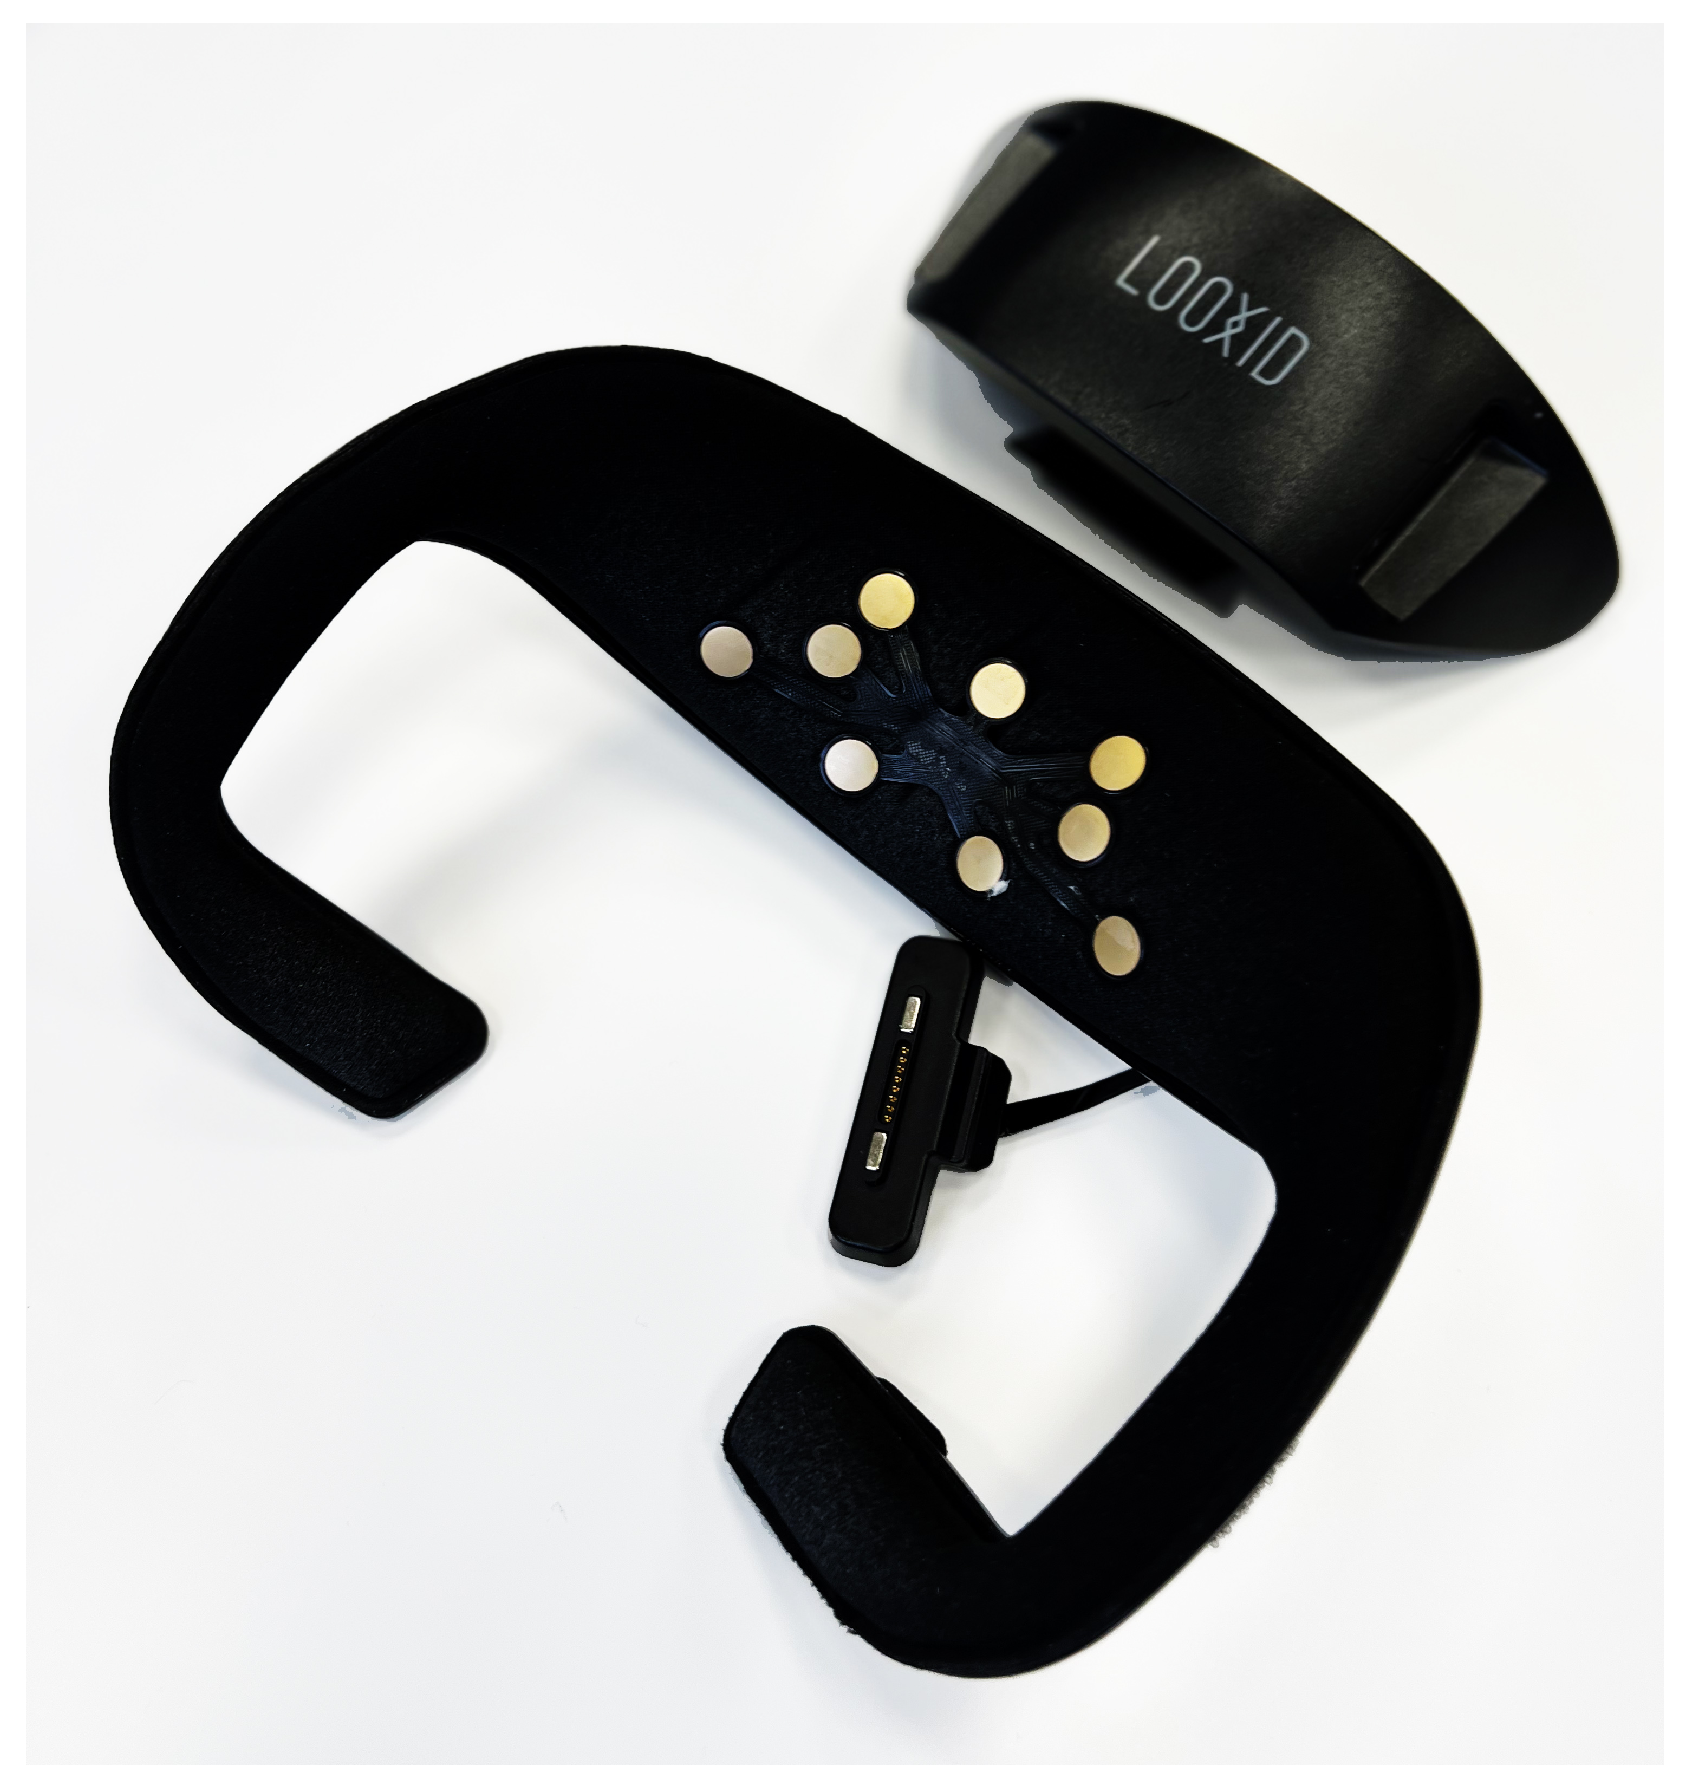
- Looxid Link. Available online: https://looxidlink.looxidlabs.com (accessed on 16 August 2021).
- Albert, W.; Tullis, T. Measuring the User Experience: Collecting, Analyzing, and Presenting Usability Metrics; Newnes: Central Tablelands, Australia, 2013. [Google Scholar]
- Kamińska, D.; Sapiński, T.; Anbarjafari, G. Efficiency of chosen speech descriptors in relation to emotion recognition. Eurasip J. Audio Speech Music. Process. 2017, 2017, 1–9. [Google Scholar] [CrossRef] [Green Version]
- Boersma, P.; Van Heuven, V. Speak and unSpeak with PRAAT. Glot Int. 2001, 5, 341–347. [Google Scholar]
- Ritter, M.; Winterbottom, C. UX for the Web: Build Websites for User Experience and Usability; Packt Publishing Ltd.: Birmingham, UK, 2017. [Google Scholar]
- Witten, I.H.; Frank, E.; Trigg, L.E.; Hall, M.A.; Holmes, G.; Cunningham, S.J. Weka: Practical Machine Learning Tools and Techniques with Java. Available online: https://researchcommons.waikato.ac.nz/handle/10289/1040 (accessed on 31 August 2021).


| Partic. | #1 | #2 | #3 | #4 | #5 | #6 | #7 | #8 | #9 | #10 | #11 | #12 | #13 | #14 |
|---|---|---|---|---|---|---|---|---|---|---|---|---|---|---|
| Sex | M | M | F | F | F | M | M | F | M | M | M | M | F | M |
| Age | 62 | 50 | 48 | 43 | 26 | 32 | 57 | 26 | 44 | 31 | 33 | 31 | 37 | 43 |
| Head movements | Y-axis rotation: mean, median, std, max and min |
| X-axis rotation: mean, median, std, max and min | |
| Hand movements | Y-axis rotation: mean, median, std, max and min |
| X-axis rotation: mean, median, std, max and min | |
| EEG | Level of attention: mean, median, std, max and min |
| Level of relaxation: mean, median, std, max and min | |
| Speech signal | MFCC: mean values of |
| F0: mean, median, std, max and min | |
| Energy: mean, median, std, max and min |
| k-NN | SVM | RF | MLP | |
|---|---|---|---|---|
| speech | 64.29 | 68.51 | 67.21 | 61.69 |
| head | 66.23 | 66.23 | 68.18 | 66.68 |
| hand | 55.84 | 58.77 | 64.94 | 61.69 |
| EEG | 66.56 | 64.94 | 66.68 | 65.58 |
| COMBO | 67.21 | 68.51 | 71.75 | 70.78 |
| COMBO+Q | 73.70 | 75.97 | 76.95 | 76.30 |
| COMBO+Q+S | 79.8 | 80.82 | 84.23 | 82.20 |
| Questions | Mean | STD |
|---|---|---|
| #1 I thought the application was easy to use. | 4.6 | 0.6 |
| #2 I thought there was too much inconsistency in this application. | 3.1 | 1.4 |
| #3 I found the buttons that were too low or too high very cumbersome to use. | 3.5 | 1.1 |
| #4 I felt very uncomfortable/unconfident when the buttons were out of field of view. | 2.6 | 1.2 |
| #5 I thought the user interface placed too close was uncomfortable to use. | 3.9 | 1.3 |
| #6 I thought the user interface placed too far was difficult to use. | 2.8 | 1.4 |
| #7 I found the colour of buttons (green for YES, red for NO) helpful to select wanted answer. | 4.5 | 0.6 |
| #8 I needed more time to select the answer when the buttons were in opposite colours (YES—red, NO—green). | 2.8 | 1.4 |
| #9 I found it surprising when the sound confirming selection was different than previously. | 4.4 | 0.6 |
| #10 I found it easier when the answers to select when in button-form (buttons in a frame with colour background). | 3.6 | 1.4 |
Publisher’s Note: MDPI stays neutral with regard to jurisdictional claims in published maps and institutional affiliations. |
© 2022 by the authors. Licensee MDPI, Basel, Switzerland. This article is an open access article distributed under the terms and conditions of the Creative Commons Attribution (CC BY) license (https://creativecommons.org/licenses/by/4.0/).
Share and Cite
Kamińska, D.; Zwoliński, G.; Laska-Leśniewicz, A. Usability Testing of Virtual Reality Applications—The Pilot Study. Sensors 2022, 22, 1342. https://doi.org/10.3390/s22041342
Kamińska D, Zwoliński G, Laska-Leśniewicz A. Usability Testing of Virtual Reality Applications—The Pilot Study. Sensors. 2022; 22(4):1342. https://doi.org/10.3390/s22041342
Chicago/Turabian StyleKamińska, Dorota, Grzegorz Zwoliński, and Anna Laska-Leśniewicz. 2022. "Usability Testing of Virtual Reality Applications—The Pilot Study" Sensors 22, no. 4: 1342. https://doi.org/10.3390/s22041342