
Impact of Road Marking Retroreflectivity on Machine Vision in Dry Conditions: On-Road Test


Abstract
:1. Introduction
2. Methodology
2.1. Instruments
2.2. Procedure
2.3. Data Analysis
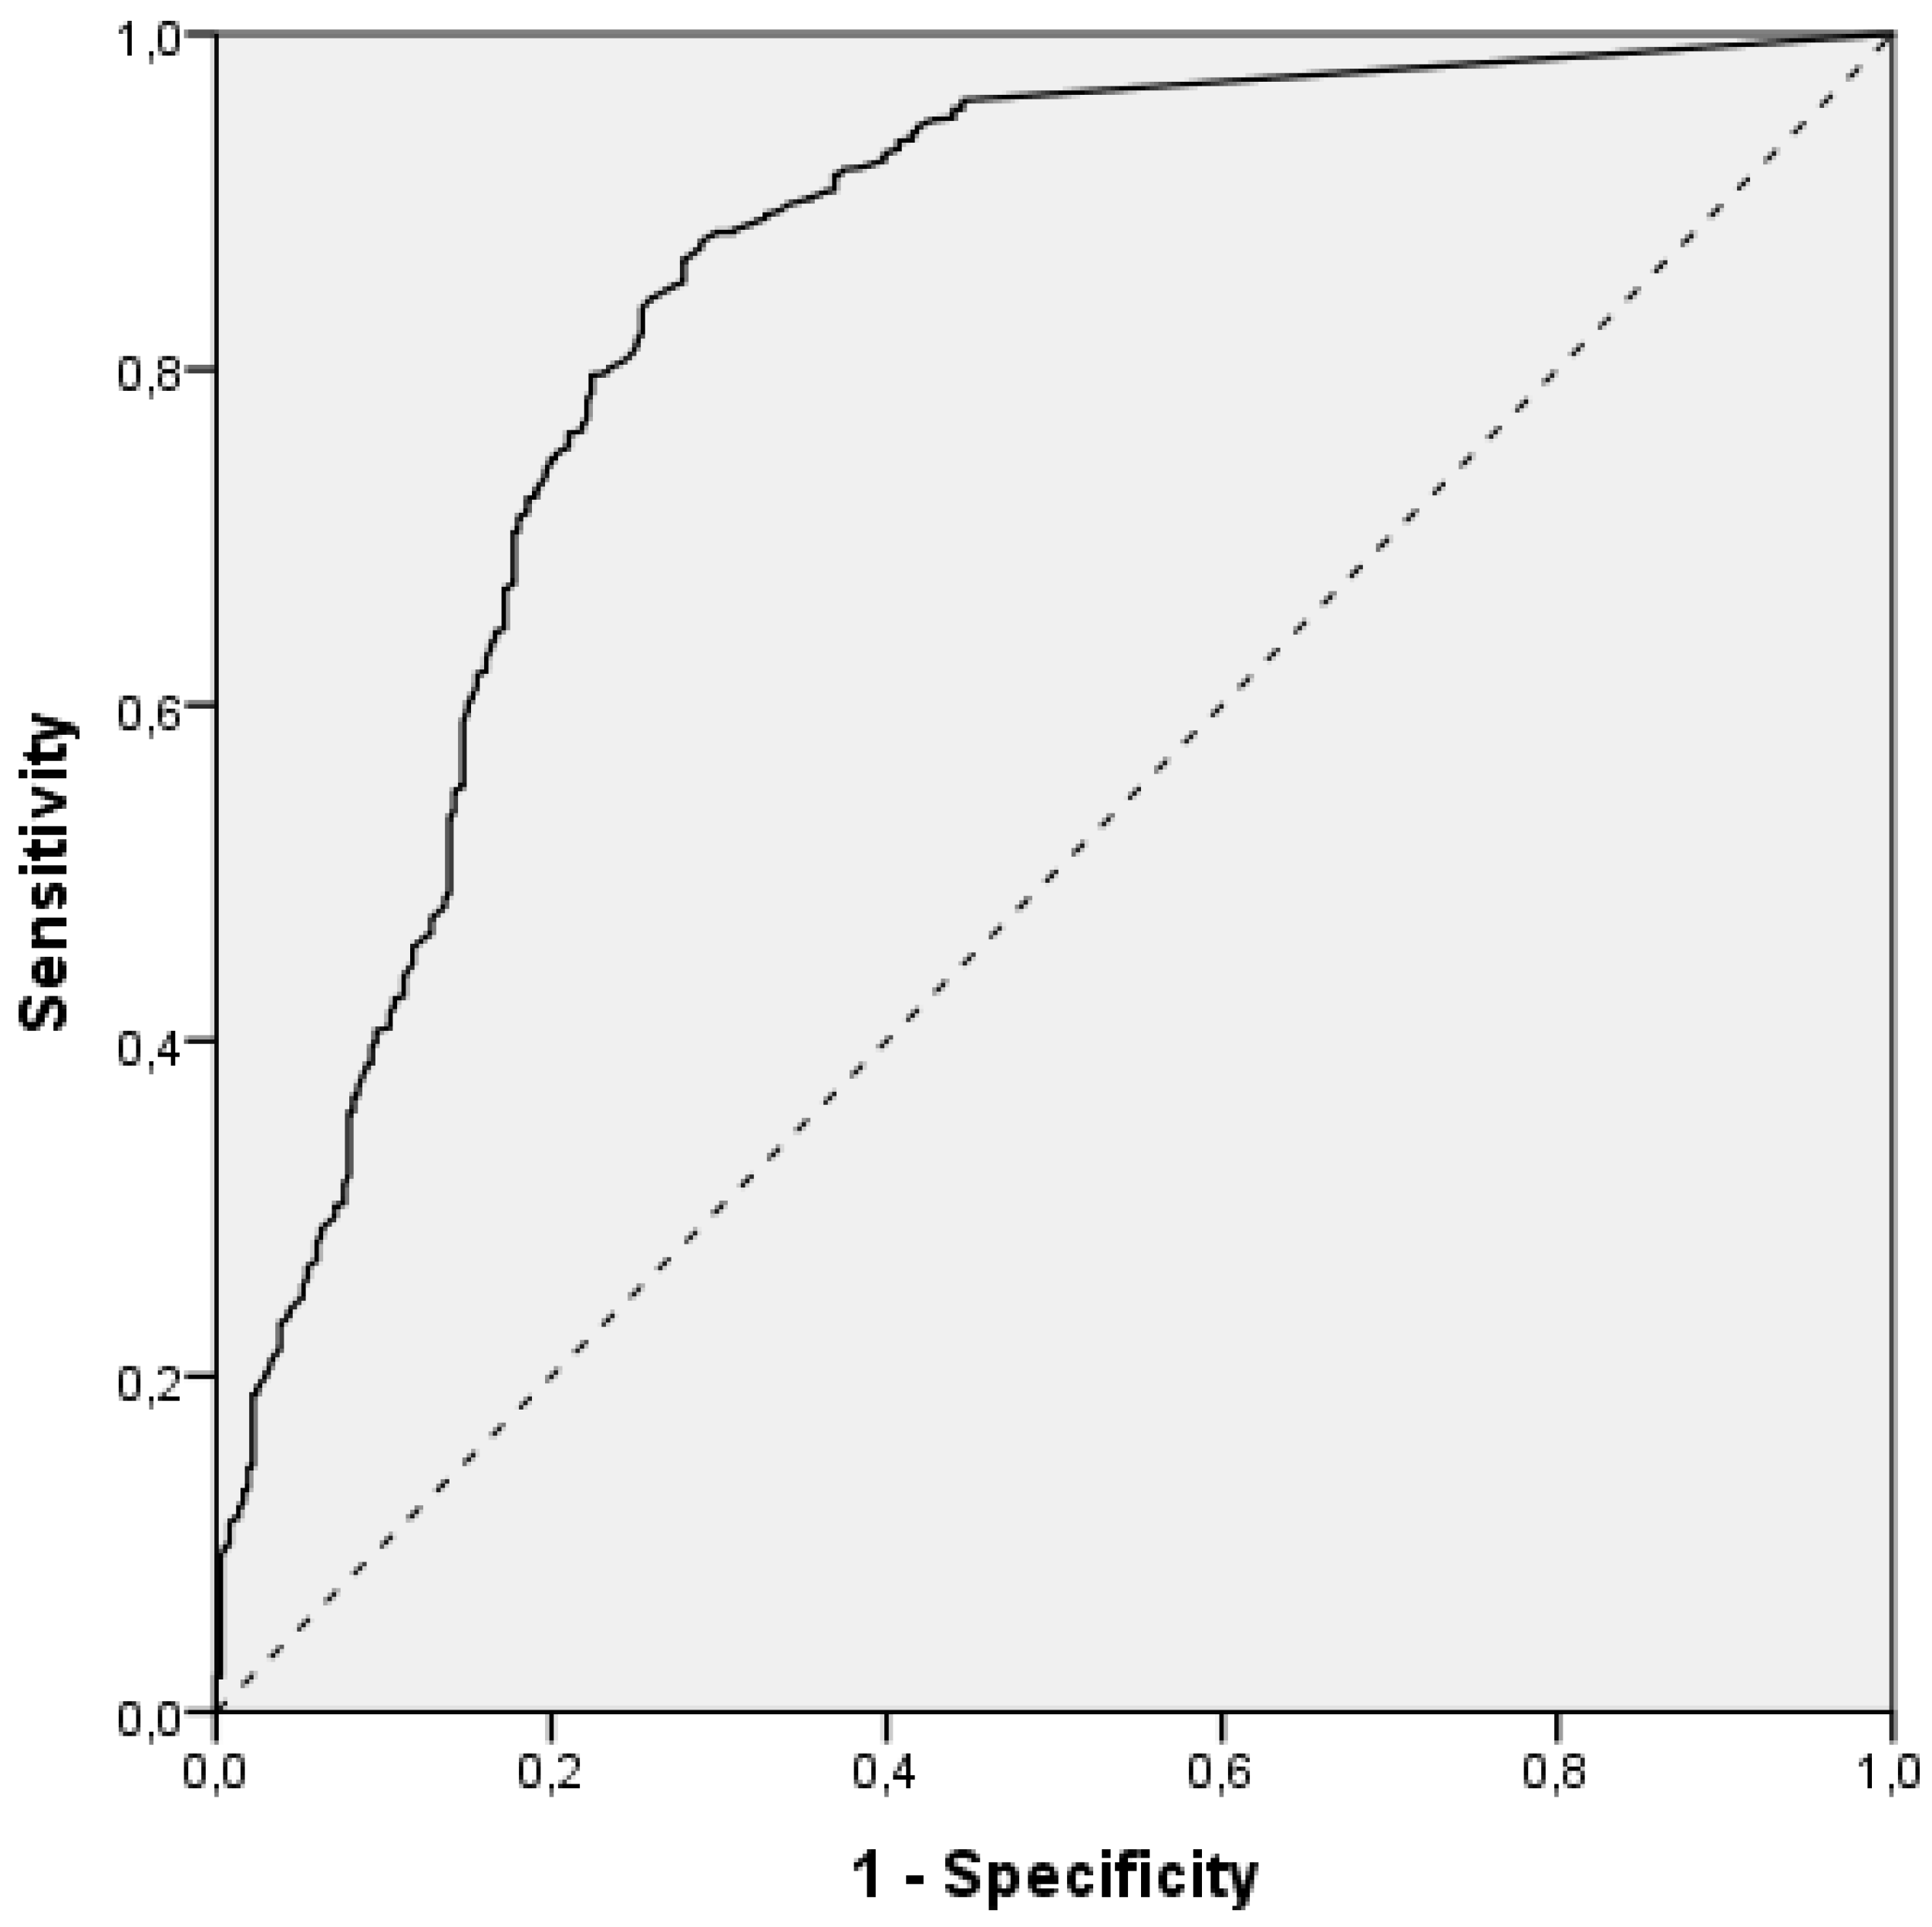
3. Results
3.1. Descriptive Statistics—Retroreflectivity, Lane Markings’ Detection Quality and Range of View
3.2. Correlation Analysis
3.3. ROC Curve Analysis
4. Discussion
5. Conclusions
Author Contributions
Funding
Institutional Review Board Statement
Informed Consent Statement
Data Availability Statement
Conflicts of Interest
References
- Faculty of Transport and Traffic Sciences. Analysis of Critical Factors of Road Accidents; Faculty of Transport and Traffic Sciences: Zagreb, Croatia, 2020. (In Croatia) [Google Scholar]
- Federal Highway Administration. Roadway Departure Safety. 2020. Available online: https://safety.fhwa.dot.gov/roadway_dept/ (accessed on 19 July 2021).
- Xiong, X.; Chen, L.; Liang, J. Analysis of Roadway Traffic Accidents Based on Rough Sets and Bayesian Networks. Promet—Traffic Transp. 2018, 30, 71–81. [Google Scholar] [CrossRef]
- Kusano, K.D.; Gabler, H.C. Rural Road Departure Crashes: Why is Injury Severity Correlated with Lane Markings? In Proceedings of the Transportation Research Board 91st Annual Meeting, Washington, DC, USA, 22–26 January 2012. [Google Scholar]
- El-Basyouny, K.; Sayed, T. Linear and Nonlinear Safety Intervention Models: Novel Methods Applied to Evaluation of Shoulder Rumble Strips. J. Transp. Res. Board 2012, 2280, 28–37. [Google Scholar] [CrossRef]
- Sayed, T.; deLeur, P.; Pump, J. Impact of Rumble Strips on Collision Reduction on Highways in British Columbia, Canada: Comprehensive Before-and-After Safety Study. J. Transp. Res. Board 2010, 2148, 9–15. [Google Scholar] [CrossRef]
- Ariën, C.; Brijs, K.; Vanroelen, G.; Ceulemans, W.; Jongen, E.M.M.; Daniels, S.; Brijs, T.; Wets, G. The Effect of Pavement Markings on Driving Behaviour in Curves: A Simulator Study. Ergonomics 2017, 60, 701–713. [Google Scholar] [CrossRef] [PubMed] [Green Version]
- Calvi, A. A Study on Driving Performance Along Horizontal Curves of Rural Roads. J. Transp. Saf. Secur. 2015, 7, 243–267. [Google Scholar] [CrossRef]
- Babić, D.; Brijs, T. Low-cost Road Marking Measures for Increasing Safety in Horizontal Curves: A Driving Simulator Study. Accid. Anal. Prev. 2021, 153, 106013. [Google Scholar] [CrossRef] [PubMed]
- Sternlund, S.; Strandroth, J.; Rizzi, M.; Lie, A.; Tingvall, C. The Effectiveness of Lane Departure Warning Systems—A Reduction in Real-World Passenger Car Injury Crashes. Traffic Inj. Prev. 2017, 18, 225–229. [Google Scholar] [CrossRef] [PubMed]
- Tan, H.; Zhao, F.; Hao, H.; Liu, Z. Estimate of Safety Impact of Lane Keeping Assistant System on Fatalities and Injuries Reduction for China: Scenarios Through 2030. Traffic Inj. Prev. 2020, 21, 156–162. [Google Scholar] [CrossRef] [PubMed]
- Austroads. Implications of Pavement Markings for Machine Vision; Research Report AP-R633-20; Austroads Ltd.: Sydney, Australia, 2020; ISBN 978-1-922382-25-2. [Google Scholar]
- Nguyen, V.; Kim, H.; Jun, S.; Boo, K. A Study on Real-Time Detection Method of Lane and Vehicle for Lane Change Assistant System Using Vision System on Highway. Eng. Sci. Technol. 2018, 21, 822–833. [Google Scholar] [CrossRef]
- Hillel, A.B.; Lerner, R.; Levi, D.; Raz, G. Recent Progress in Road and Lane Detection: A Survey. Mach. Vis. Appl. 2014, 25, 727–745. [Google Scholar] [CrossRef]
- Jermakian, J.S. Crash Avoidance Potential of Four Passenger Vehicle Technologies. Accid. Anal. Prev. 2011, 43, 732–740. [Google Scholar] [CrossRef] [PubMed]
- Jermakian, J.S. Crash Avoidance Potential of Four Large Truck Technologies. Accid. Anal. Prev. 2012, 49, 338–346. [Google Scholar] [CrossRef] [PubMed]
- Kusano, K.D.; Gabler, H.C. Comparison of Expected Crash and Injury Reduction from Production Forward Collision and Lane Departure Warning Systems. Traffic Inj. Prev. 2015, 16, 109–114. [Google Scholar] [CrossRef]
- Hickman, J.S.; Guo, F.; Camden, M.; Hanowski, R.J.; Medina, A.; Mabry, J.E. Efficacy of Roll Stability Control and Lane Departure Warning Systems Using Carrier-Collected Data. J. Saf. Res. 2015, 52, 59–63. [Google Scholar] [CrossRef] [PubMed]
- Sternlund, S. The Safety Potential of Lane Departure Warning Systems—A Descriptive Real-world Study of Fatal Lane Departure Passenger Car Crashes in Sweden. Traffic Inj. Prev. 2017, 18, 18–23. [Google Scholar] [CrossRef] [PubMed] [Green Version]
- Spicer, R.; Vahabaghaie, A.; Bahouth, G.; Drees, L.; Von Bülow, R.M.; Baur, P. Field Effectiveness Evaluation of Advanced Driver Assistance Systems. Traffic Inj. Prev. 2018, 19, 91–95. [Google Scholar] [CrossRef] [PubMed]
- Cicchino, J.B. Effects of Lane Departure Warning on Police-reported Crash Rates. J. Saf. Res. 2018, 66, 61–70. [Google Scholar] [CrossRef] [PubMed]
- Pike, A.M.; Barrette, T.P.; Carlson, P.J. Evaluation of the Effects of Pavement Marking Characteristics on Detectability by ADAS Machine Vision; National Cooperative Highway Research Program (NCHRP): Washington, DC, USA, 2018. [Google Scholar]
- Mistry, V.H.; Makwana, R. Survey: Vision Based Road Detection Techniques. Comput. Sci. Inf. Technol. 2014, 5, 4741–4747. [Google Scholar]
- Wilson, B.; Stearns, M.; Koopmann, J.; Yang, C.Y. Evaluation of a Road-Departure Crash Warning System; National Highway Safety Bureau: Washington, DC, USA, 2007.
- Gordon, T.; Sardar, H.; Blower, D.; Ljung Aust, M.; Bareket, Z.; Barnes, M.; Theander, H. Advanced Crash Avoidance Technologies (ACAT) Program—Final Report of the Volvo-Ford-UMTRI Project: Safety Impact Methodology for Lane Departure Warning-Method Development and Estimation of Benefits; National Highway Traffic Safety Administration: Washington, DC, USA, 2010.
- Lundkvist, S.O.; Fors, C. Lane Departure Warning System—LDW; VTI: Linköping, Sweden, 2010. [Google Scholar]
- Potters Industry and Mobileye. Pavement Markings Guiding Autonomous Vehicles—A Real World Study. 2016. Available online: https://higherlogicdownload.s3.amazonaws.com/AUVSI/14c12c18-fde1-4c1d-8548-035ad166c766/UploadedImages/documents/Breakouts/20-2%20Physical%20Infrastructure.pdf (accessed on 19 July 2021).
- Carlson, P.J.; Poorsartep, M. Enhancing the Roadway Physical Infrastructure for Advanced Vehicle Technologies: A Case Study in Pavement Markings for Machine Vision and a Road Map Towards a Better Understanding. In Proceedings of the 96th Annual Meeting Transportation Research Board, Washington, DC, USA, 8–12 January 2017. [Google Scholar]
- Babić, D.; Fiolić, M.; Babić, D.; Timothy, G. Road Markings and Their Impact on Driver Behaviour and Road Safety: A Systematic Review of Current Findings. J. Adv. Transp. 2020, 7843743. [Google Scholar] [CrossRef]
- European Committee for Standardization (CEN). EN 1436:2018. Road Marking Materials. Road Marking Performance for Road Users; European Committee for Standardization: Brussels, Belgium, 2018. [Google Scholar]
- Babić, D.; Ščukanec, A.; Babić, D. Determining the Impact of Directionality on Road Markings Retroreflectivity Using Dynamic Method. Transport 2018, 33, 1095–1103. [Google Scholar] [CrossRef] [Green Version]
- American Traffic Safety Services Association. ATSSA Policy on Road Markings for Machine Vision Systems. 2019. Available online: https://www.reflective-systems.com/wp-content/uploads/2019/04/Policy-re-Road-Markings-for-Machine-Vision-Systems.pdf (accessed on 19 July 2021).
- Mobileye Technical Specifications—Manual; Mobileye. 2021. Available online: https://www.mobileye.com/ (accessed on 19 July 2021).
- European Union Road Federation. Marking the Way towards A Safer Future; ERF: Brussels, Belgium, 2013. [Google Scholar]


| Vision Sensor | |
|---|---|
| Vision Sensor: | Aptina MT9V024 (1/3″) RCC |
| Array Format: | Total: 752 H × 480 V—Active pixels: 640 H × 480 V |
| Pixel Size: | 6.0 μm × 6.0 μm |
| Dynamic Range: | >55 dB linear; >100 dB in HDR mode |
| Responsivity: | 4.8 V/lux sec (550 nm) |
| Angle of view: | 38° (horizontal) |
| Focus range: | 5 m to infinity |
| AGC: | Automatic Gain Control of the image sensor for high dynamic range |
| EyeQ2 Vision Processor | |
| 332 MHz clock rate running seven parallel processes | |
| Two MIPS24KF 32bit CPUs | |
| Eight 64bit Vision Computing Engines (VCE) | |
| Eight channels DMA | |
| 64bit width 512 KB on-chip SRAM | |
| # | Length of the Road (km) | Width of the Markings (cm) | Length of the Middle Line (km) | Age of the Middle Marking |
|---|---|---|---|---|
| 1 | 32.21 | 15 | Solid: 20.61 Dashed: 11.60 | <6 months |
| 2 | 20.53 | 15 | Solid: 14.68 Dashed: 5.85 | <6 months |
| 3 | 38.05 | 15 | Solid: 15.00 Dashed: 23.05 | <6 months |
| 4 | 30.01 | 15 | Solid: 30.08 | >1 year |
| Range of View (m) | ||||
|---|---|---|---|---|
| Average RL (mcd/lx/m2) | n | (%) | Median | Interquartile Range |
| <100 mcd/lx/m2 | 486 | (22.6) | 22.41 | 0.96–38.14 |
| ≥100 < 200 mcd/lx/m2 | 581 | (27.0) | 44.47 | 31.68–54.97 |
| ≥200 < 300 mcd/lx/m2 | 610 | (28.4) | 42.68 | 29.00–54.67 |
| ≥300 mcd/lx/m2 | 473 | (22.0) | 42.94 | 32.69–52.73 |
| Average detection quality | ||||
| 0 | 168 | (7.8) | 0 | 0–1.60 |
| 1 | 198 | (9.2) | 20.77 | 11.56–32.79 |
| 2 | 428 | (19.9) | 34.81 | 25.61–44.12 |
| 3 | 1356 | (63.1) | 46.01 | 35.70–55.60 |
| 1. Average RL | 2. Average Detection Quality | |
|---|---|---|
| 1. Average RL | - | |
| 2. Average detection quality | 0.53 | - |
| 3. Average range of view | 0.29 | 0.52 |
| RL Categories (mcd/lx/m2) | 1 | 2 | 3 |
|---|---|---|---|
| 1 (<100 mcd/lx/m2) | - | ||
| 2 (≥100 < 200 mcd/lx/m2) | p < 0.001 | - | |
| 3 (≥200 < 300 mcd/lx/m2) | p < 0.001 | p = 0.594 | - |
| 4 (≥300 mcd/lx/m2) | p < 0.001 | p > 0.999 | p > 0.999 |
| Detection Quality | ||||
|---|---|---|---|---|
| 2 or 3 | <2 | |||
| RL (mcd/lx/m2) | ≥54.5 | true positive 1695 | false positive 161 | Positive predictive value 91% (91–92%) |
| <54.5 | false negative 89 | true negative 205 | Negative predictive value 70% (65–74%) | |
| Sensitivity 95% (94–96%) | Specificity 56% (52–60%) | |||
| No. of Measurements | Detection Quality | |||
|---|---|---|---|---|
| 3 | <3 | |||
| RL (mcd/lx/m2) | ≥88.5 | true positive 1285 | false positive 434 | Positive predictive value 75% (74–76%) |
| <88.5 | false negative 71 | true negative 360 | Negative predictive value 84% (80–87%) | |
| Sensitivity 95% (94–96%) | Specificity 45% (43–47%) | |||
Publisher’s Note: MDPI stays neutral with regard to jurisdictional claims in published maps and institutional affiliations. |
© 2022 by the authors. Licensee MDPI, Basel, Switzerland. This article is an open access article distributed under the terms and conditions of the Creative Commons Attribution (CC BY) license (https://creativecommons.org/licenses/by/4.0/).
Share and Cite
Babić, D.; Babić, D.; Fiolić, M.; Eichberger, A.; Magosi, Z.F. Impact of Road Marking Retroreflectivity on Machine Vision in Dry Conditions: On-Road Test. Sensors 2022, 22, 1303. https://doi.org/10.3390/s22041303
Babić D, Babić D, Fiolić M, Eichberger A, Magosi ZF. Impact of Road Marking Retroreflectivity on Machine Vision in Dry Conditions: On-Road Test. Sensors. 2022; 22(4):1303. https://doi.org/10.3390/s22041303
Chicago/Turabian StyleBabić, Darko, Dario Babić, Mario Fiolić, Arno Eichberger, and Zoltan Ferenc Magosi. 2022. "Impact of Road Marking Retroreflectivity on Machine Vision in Dry Conditions: On-Road Test" Sensors 22, no. 4: 1303. https://doi.org/10.3390/s22041303