
Industry 4.0 Readiness Calculation—Transitional Strategy Definition by Decision Support Systems


Abstract
:1. Introduction
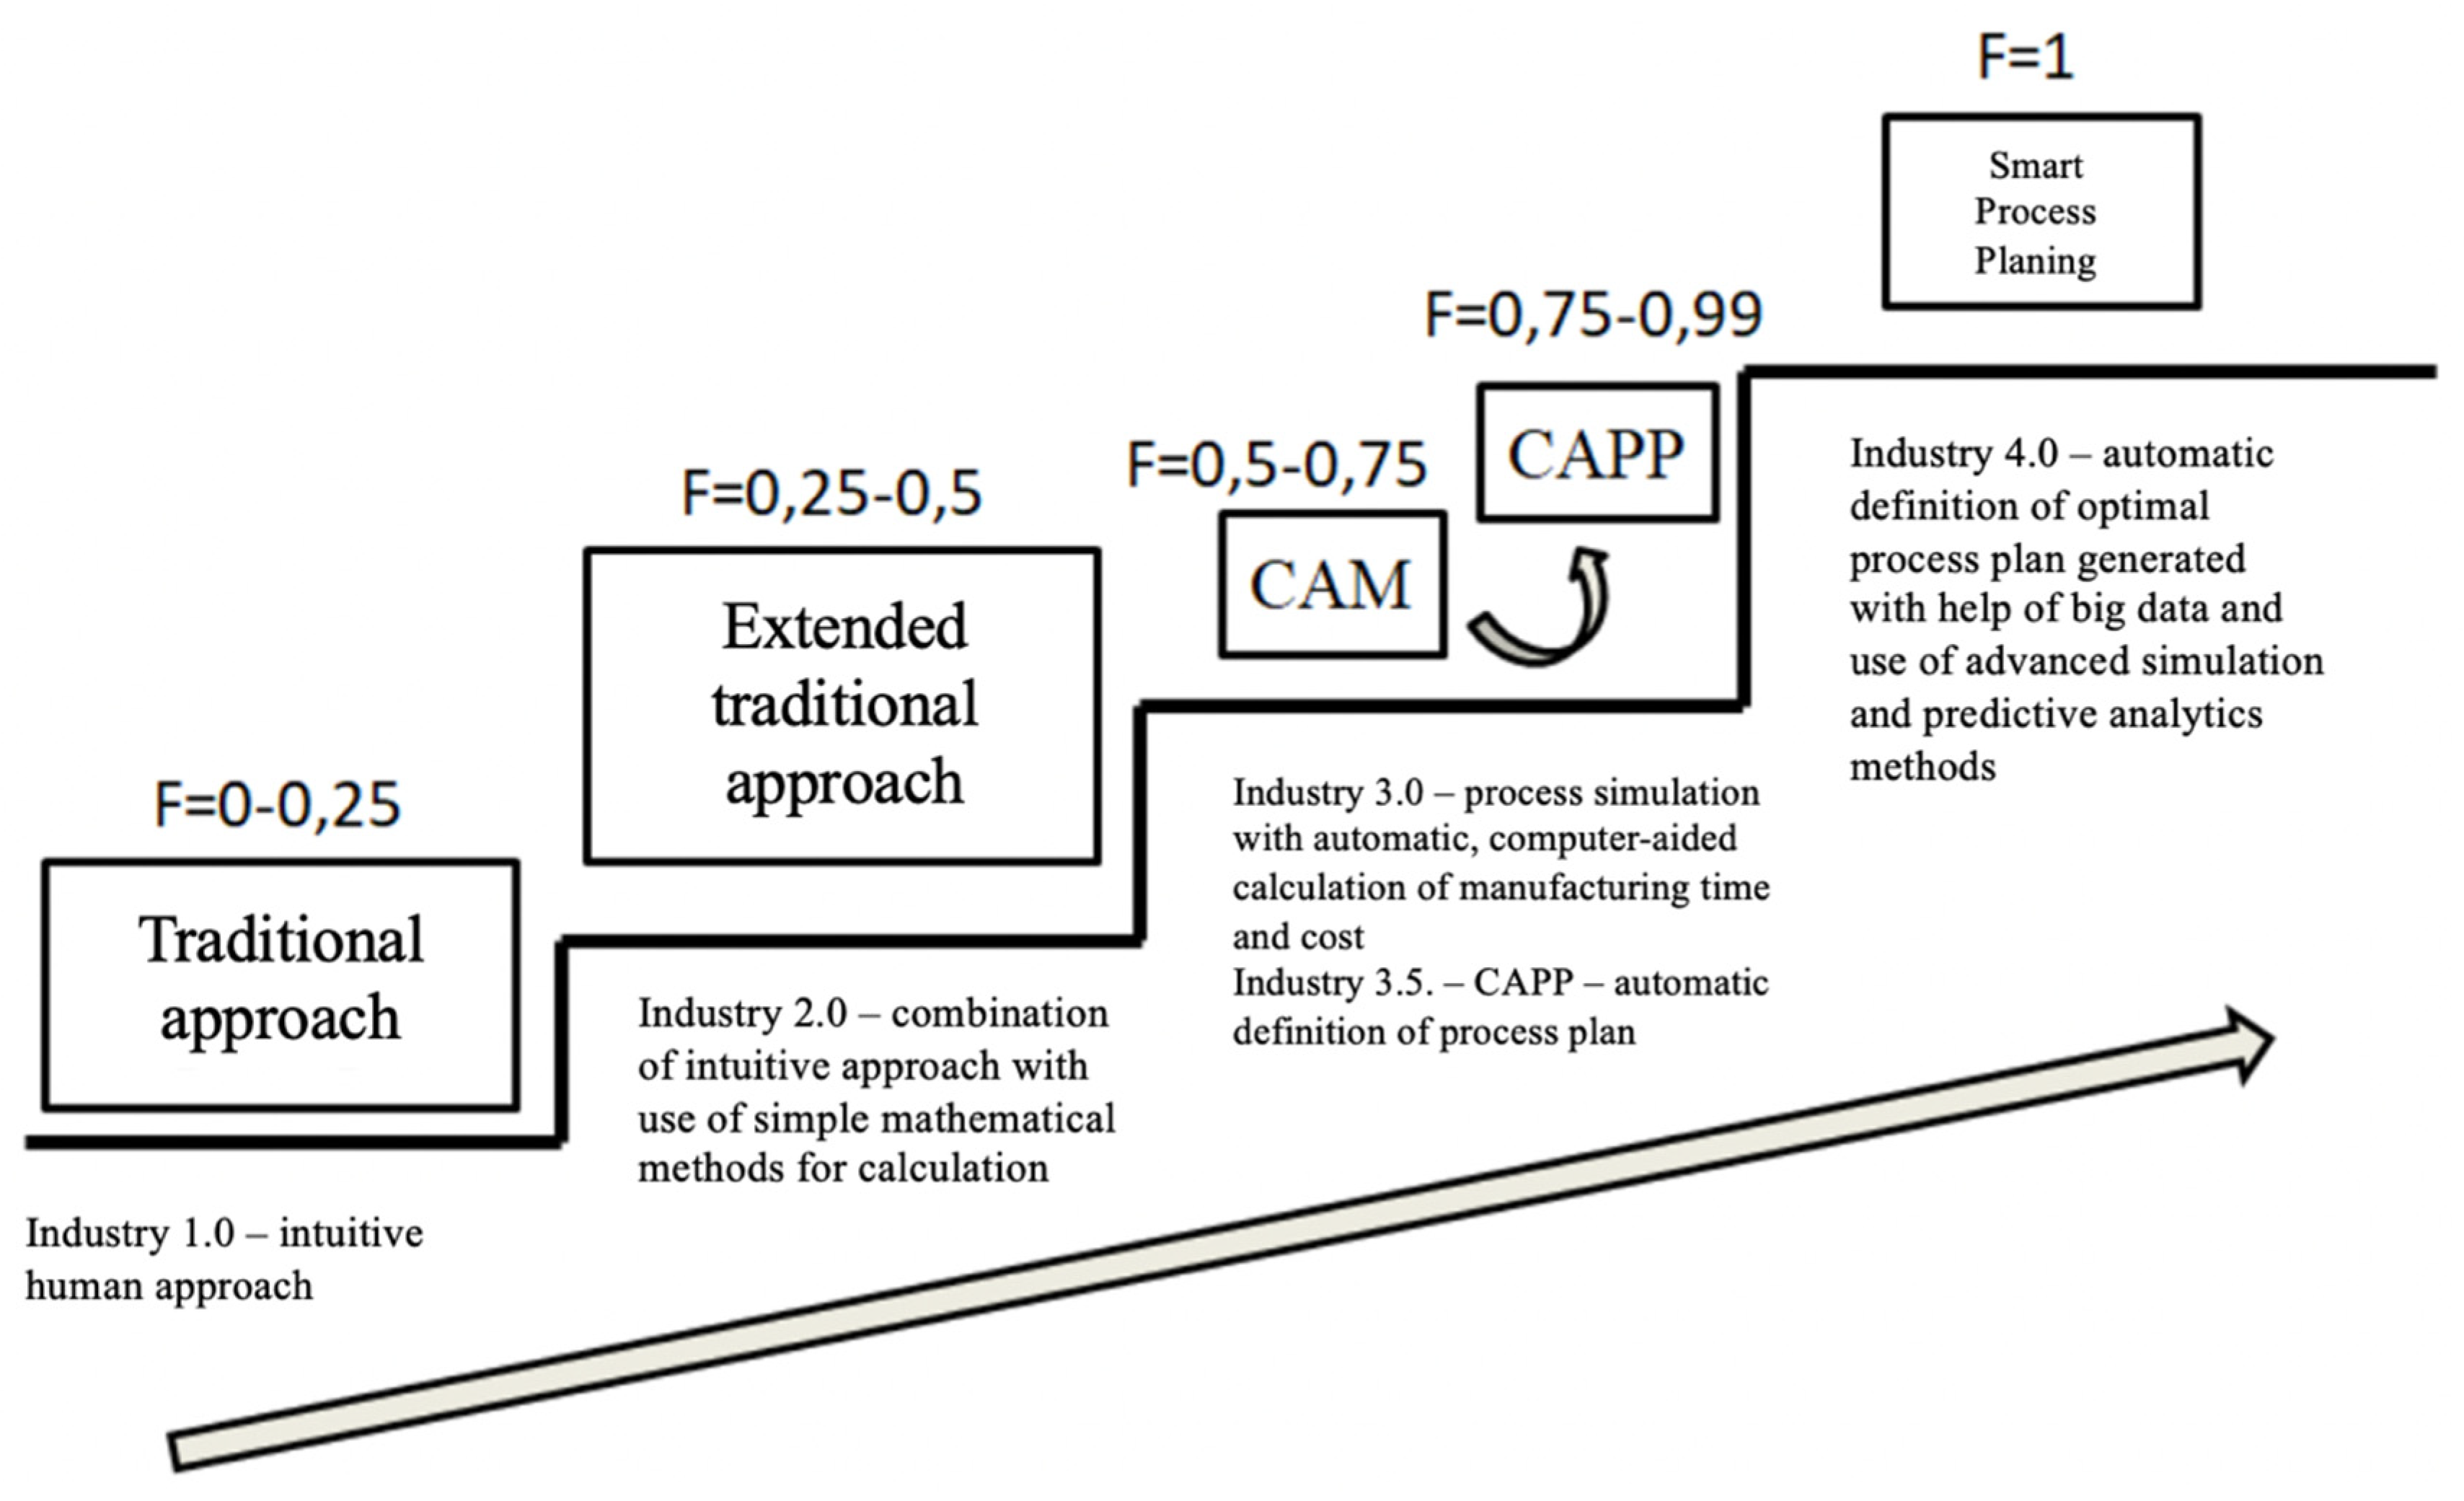
Process Planning in Industry 4.0
2. Literature Review
Scientific Gap
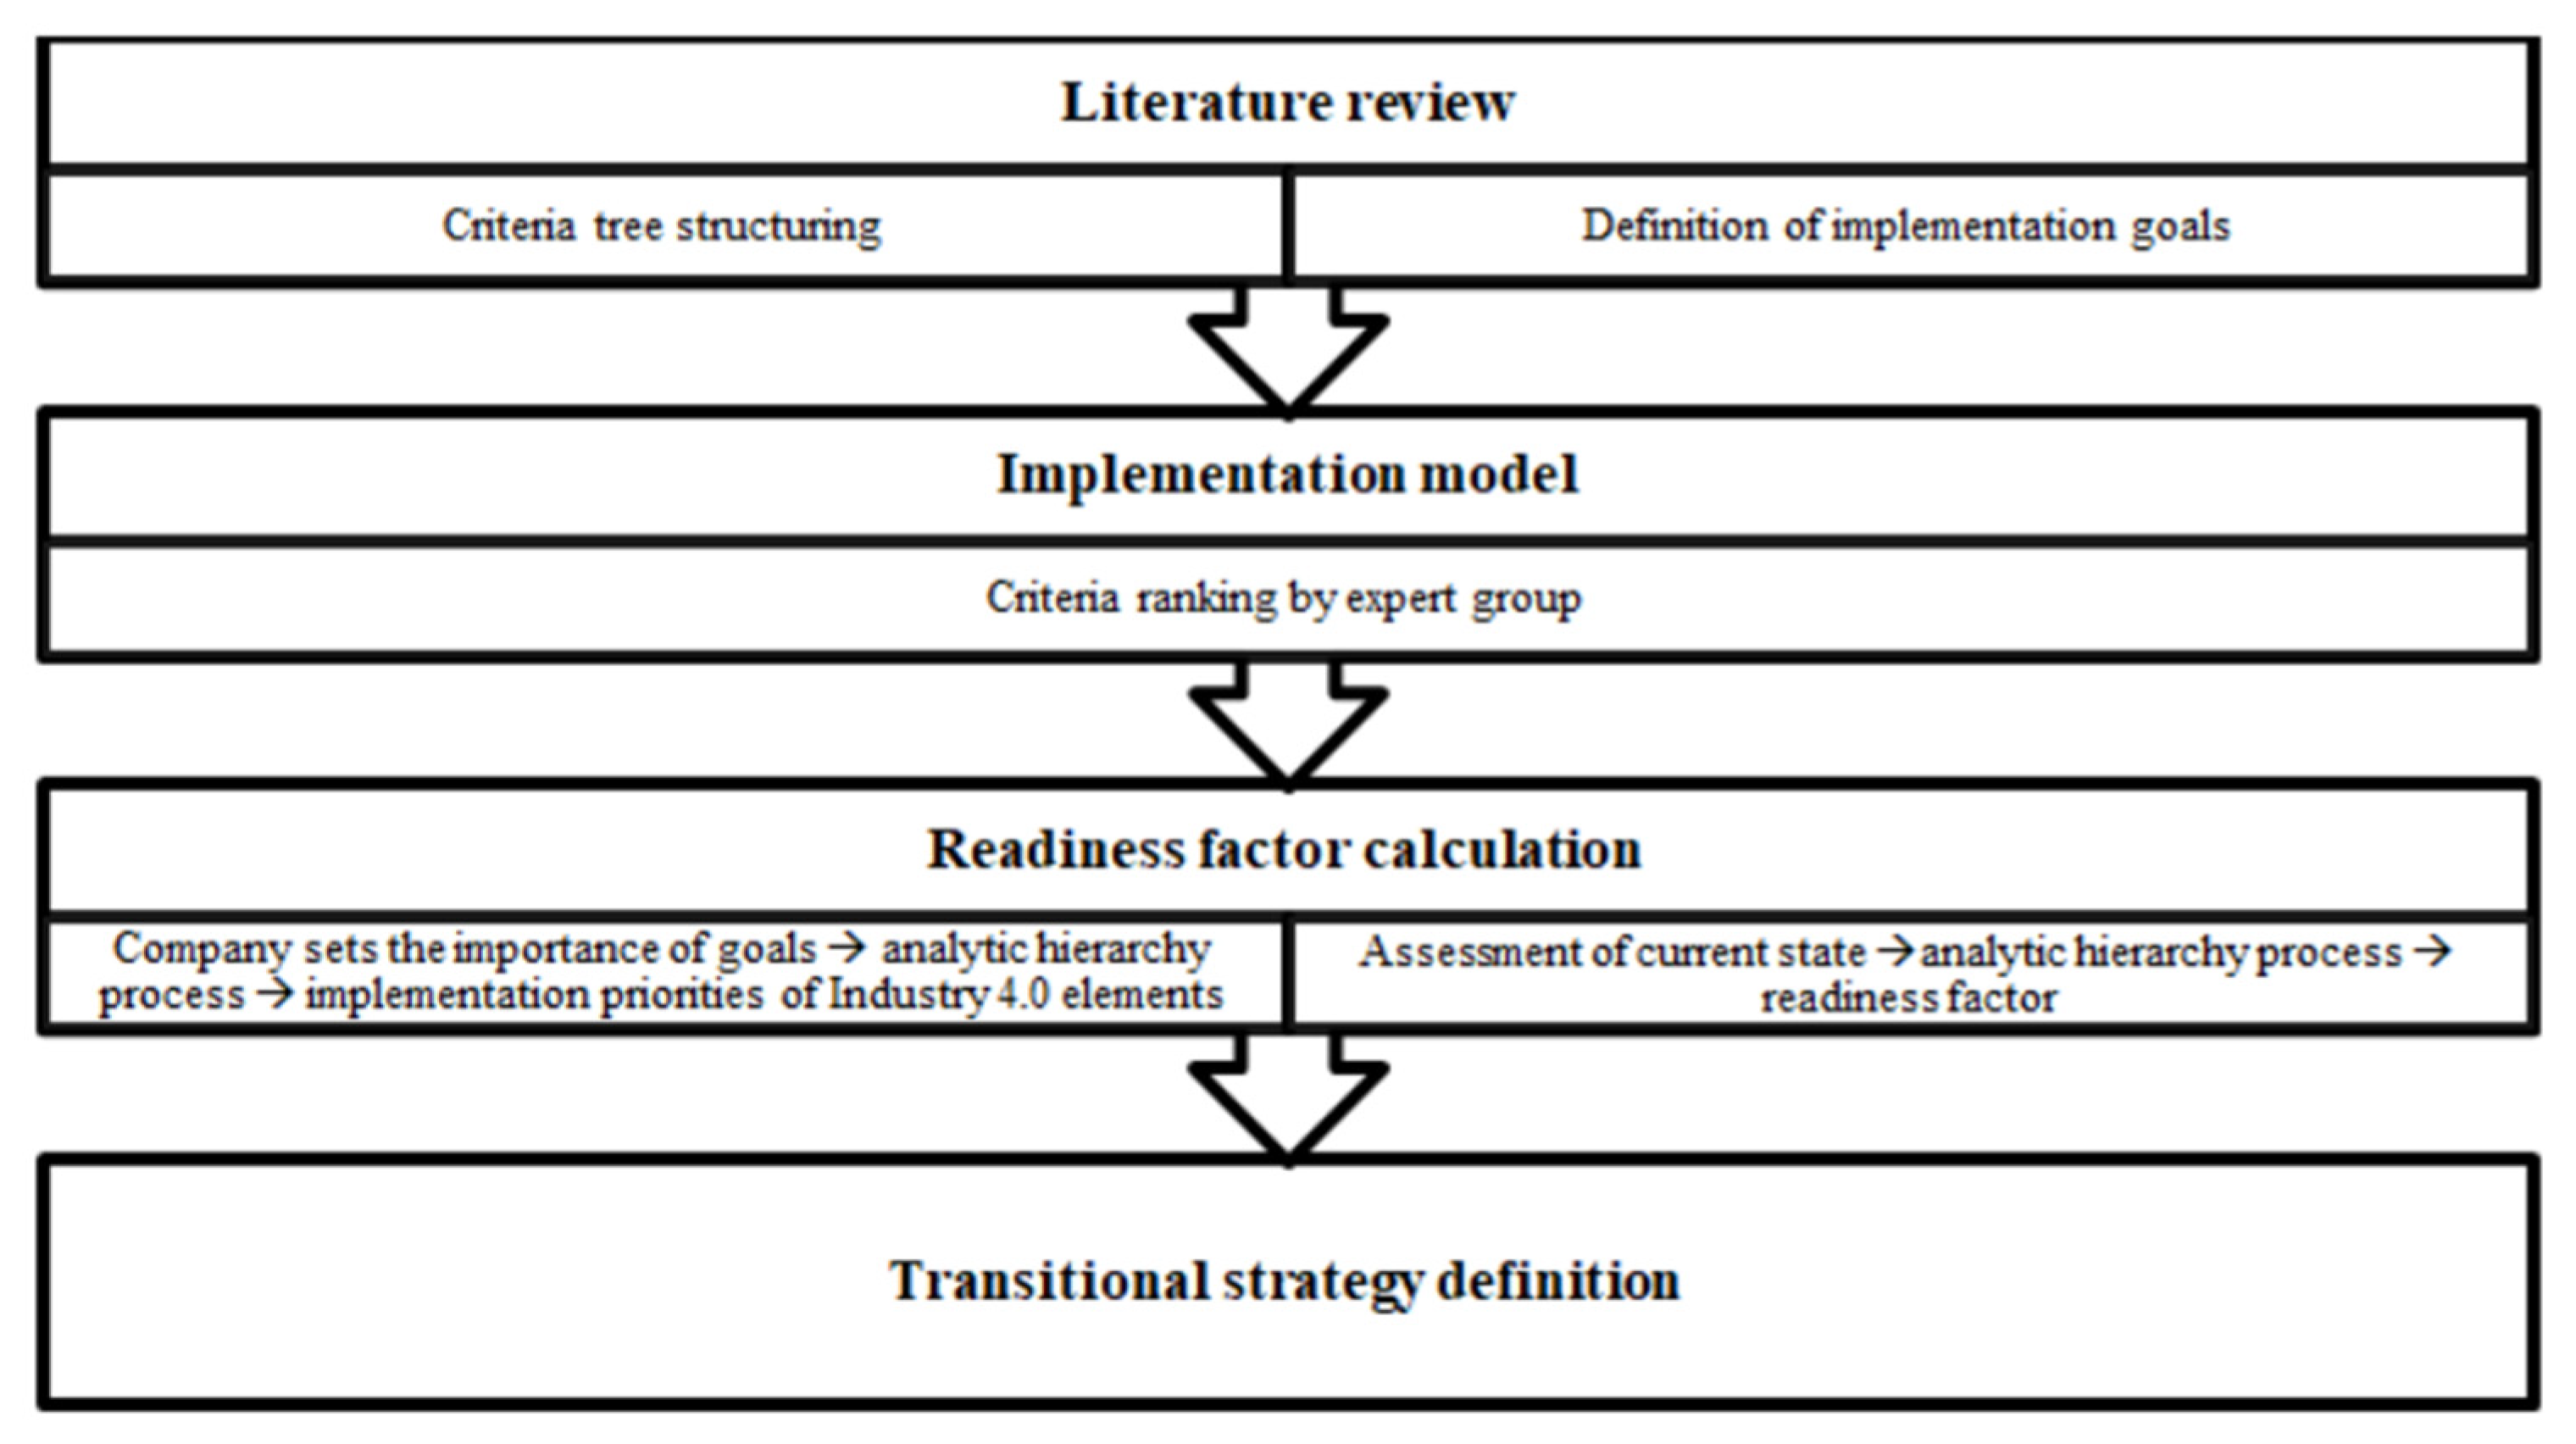
3. Methodology
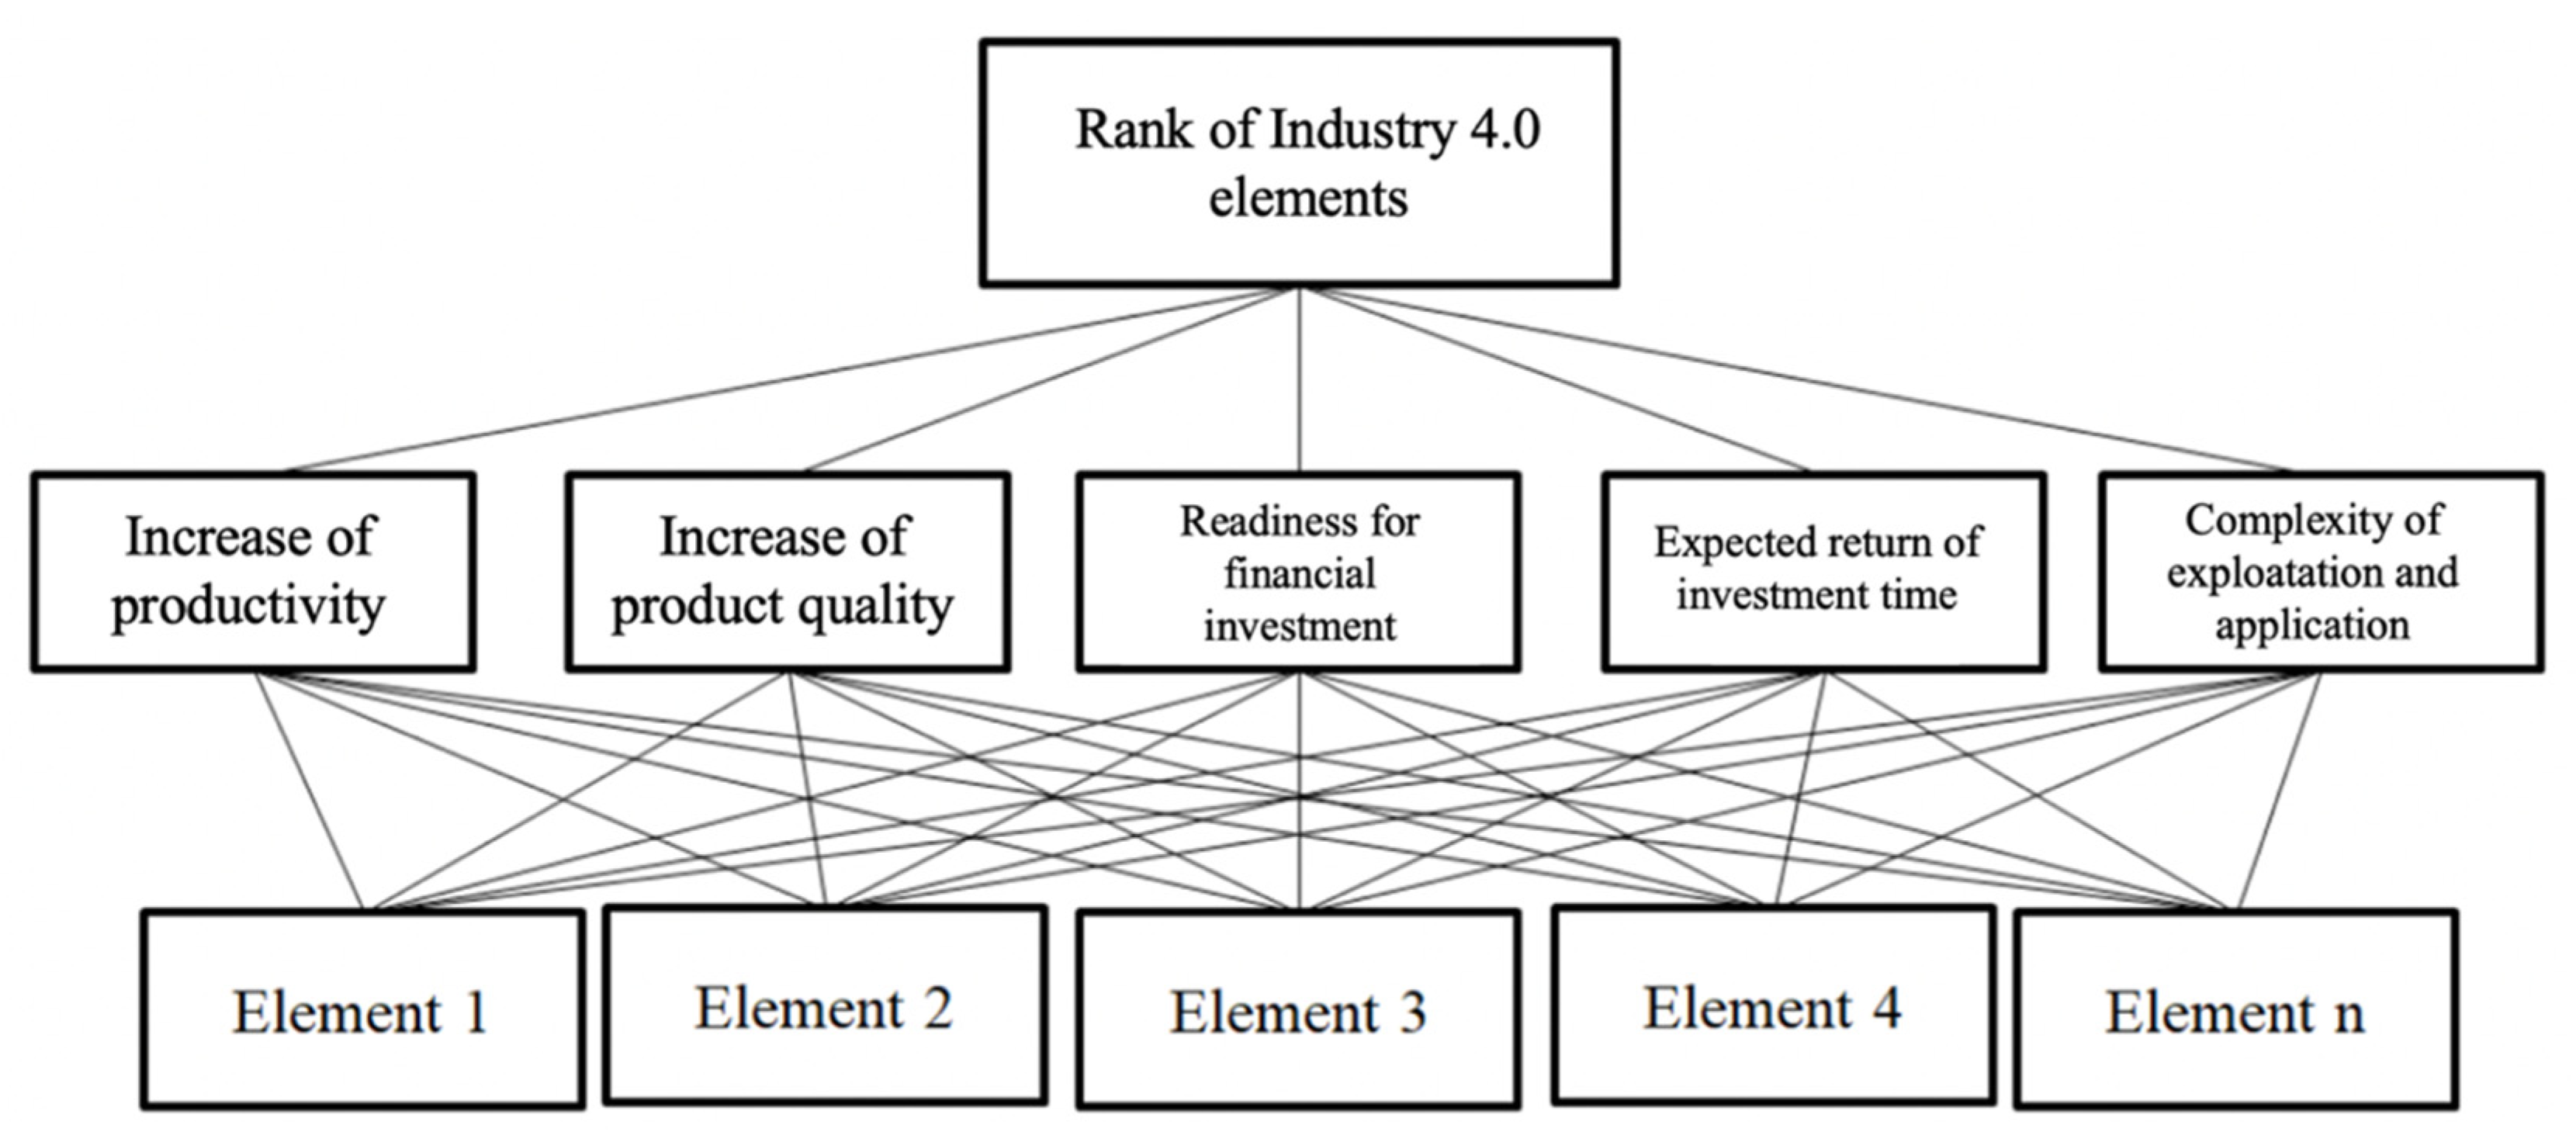
3.1. Definition of Process Planning Oriented Industry 4.0 Elements and Goals
- Increase of productivity
- Increase of product quality
- Readiness for financial investment
- Complexity of execution and application
- Expected return of investment time.
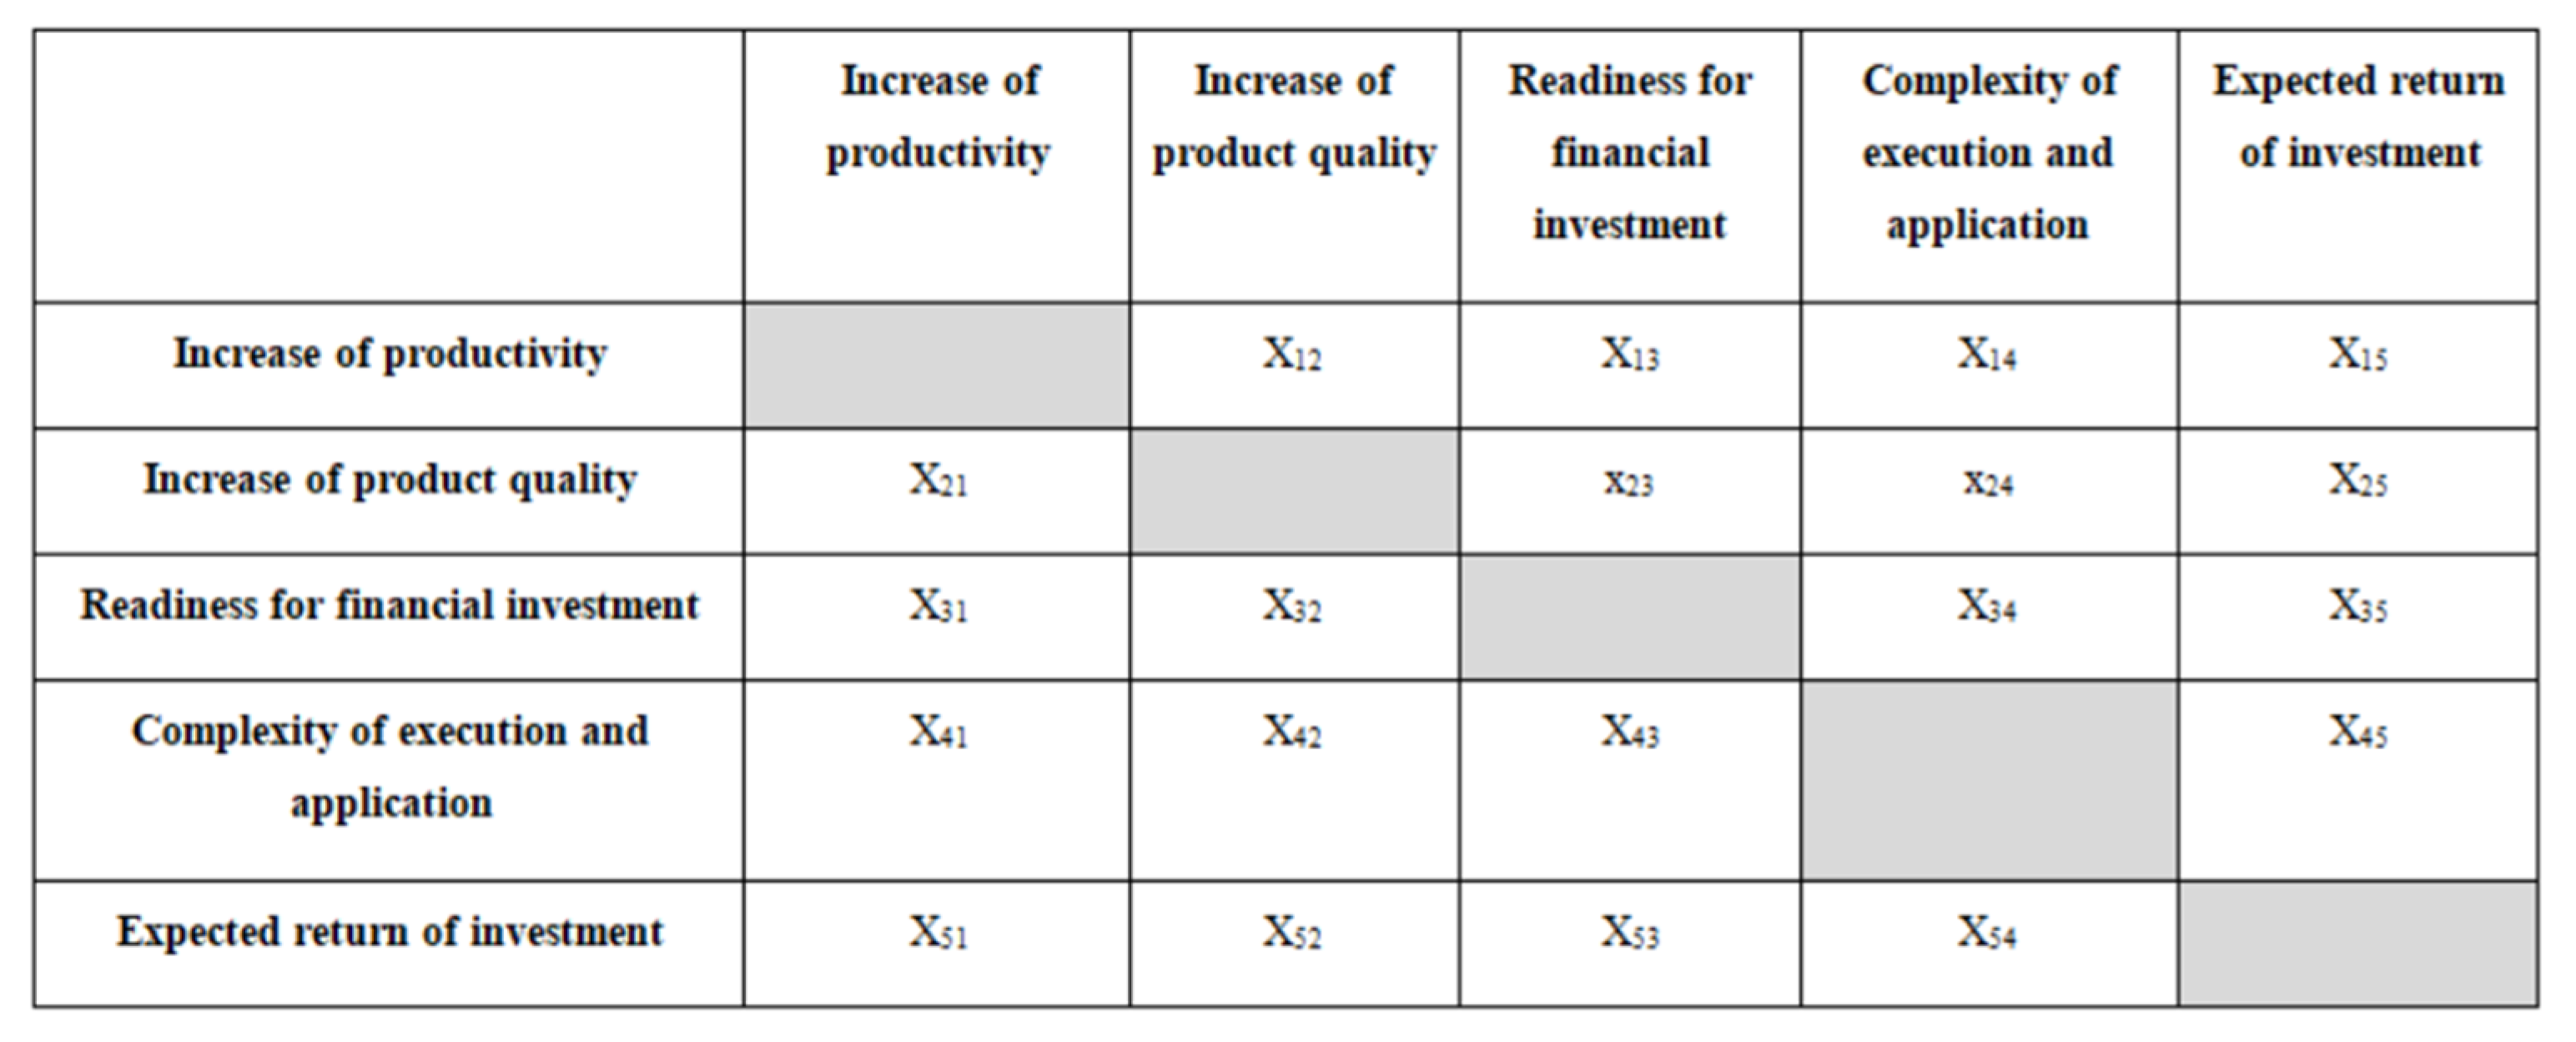
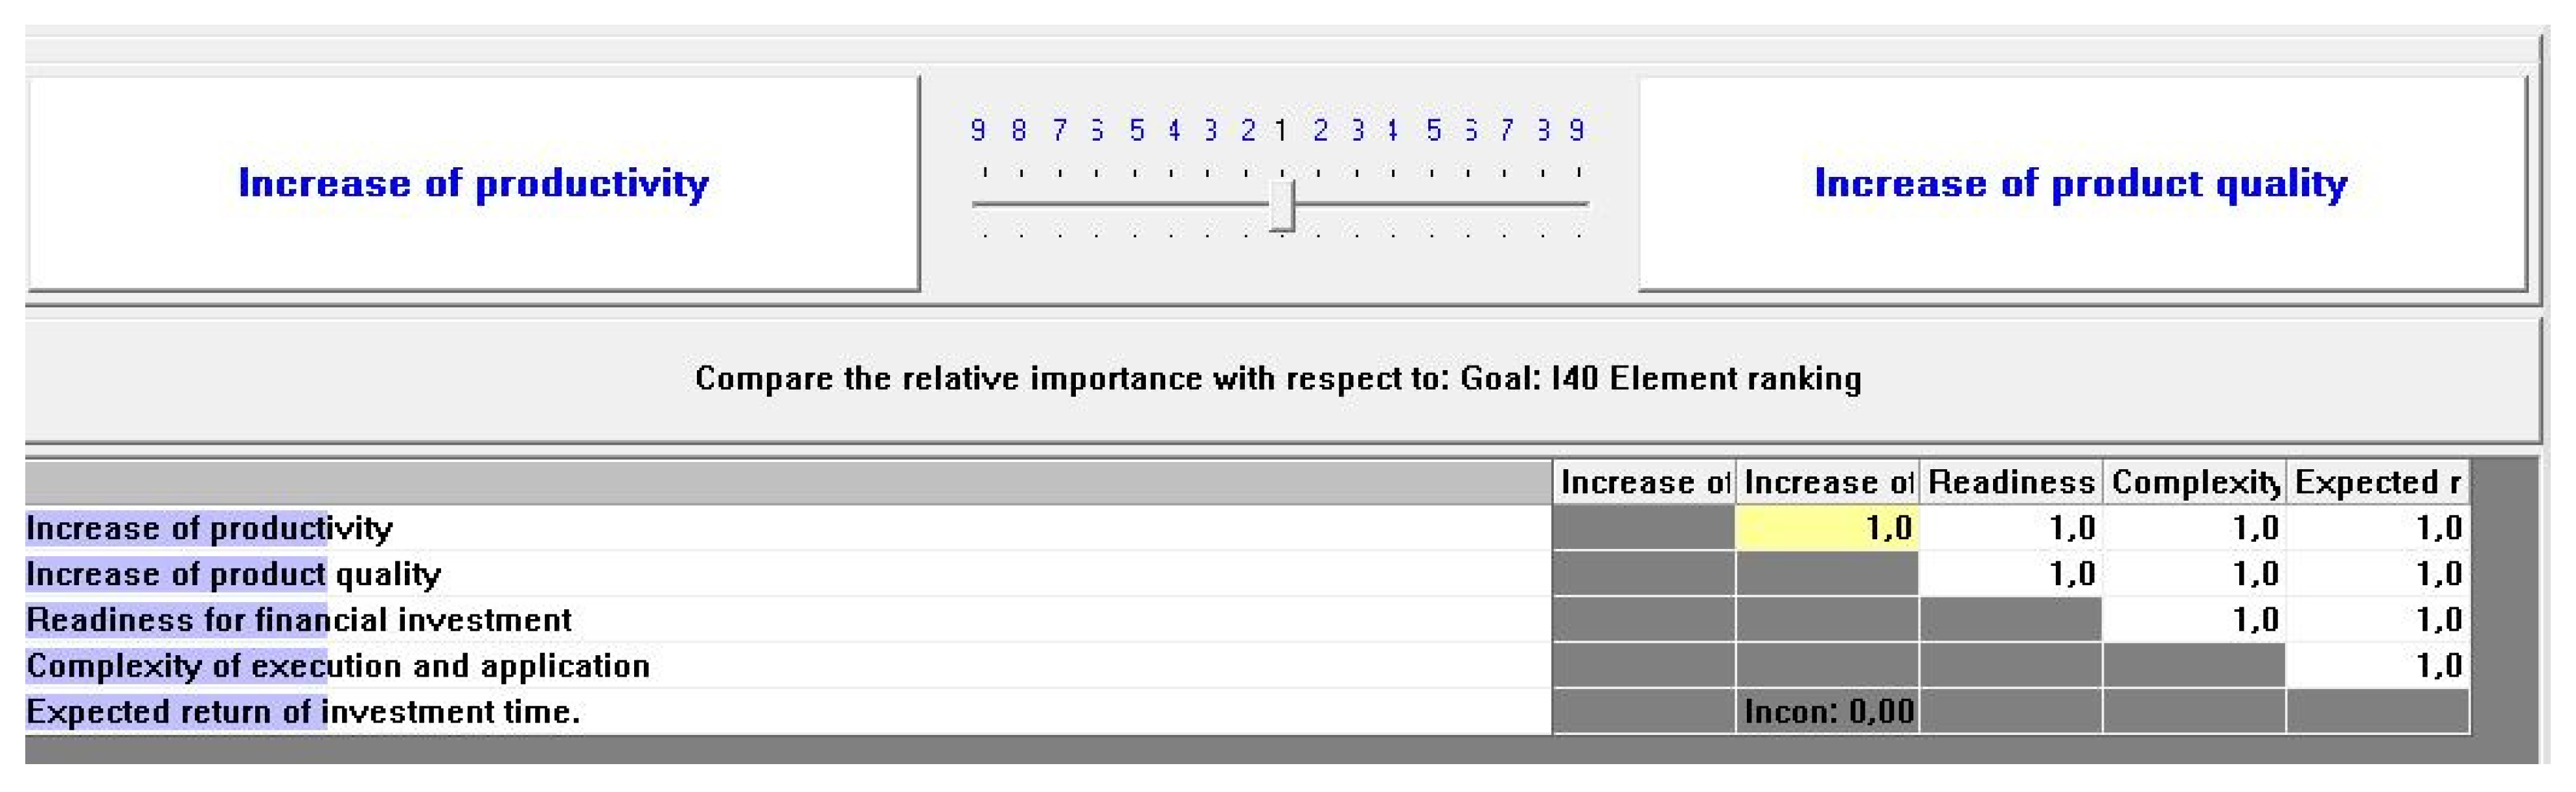
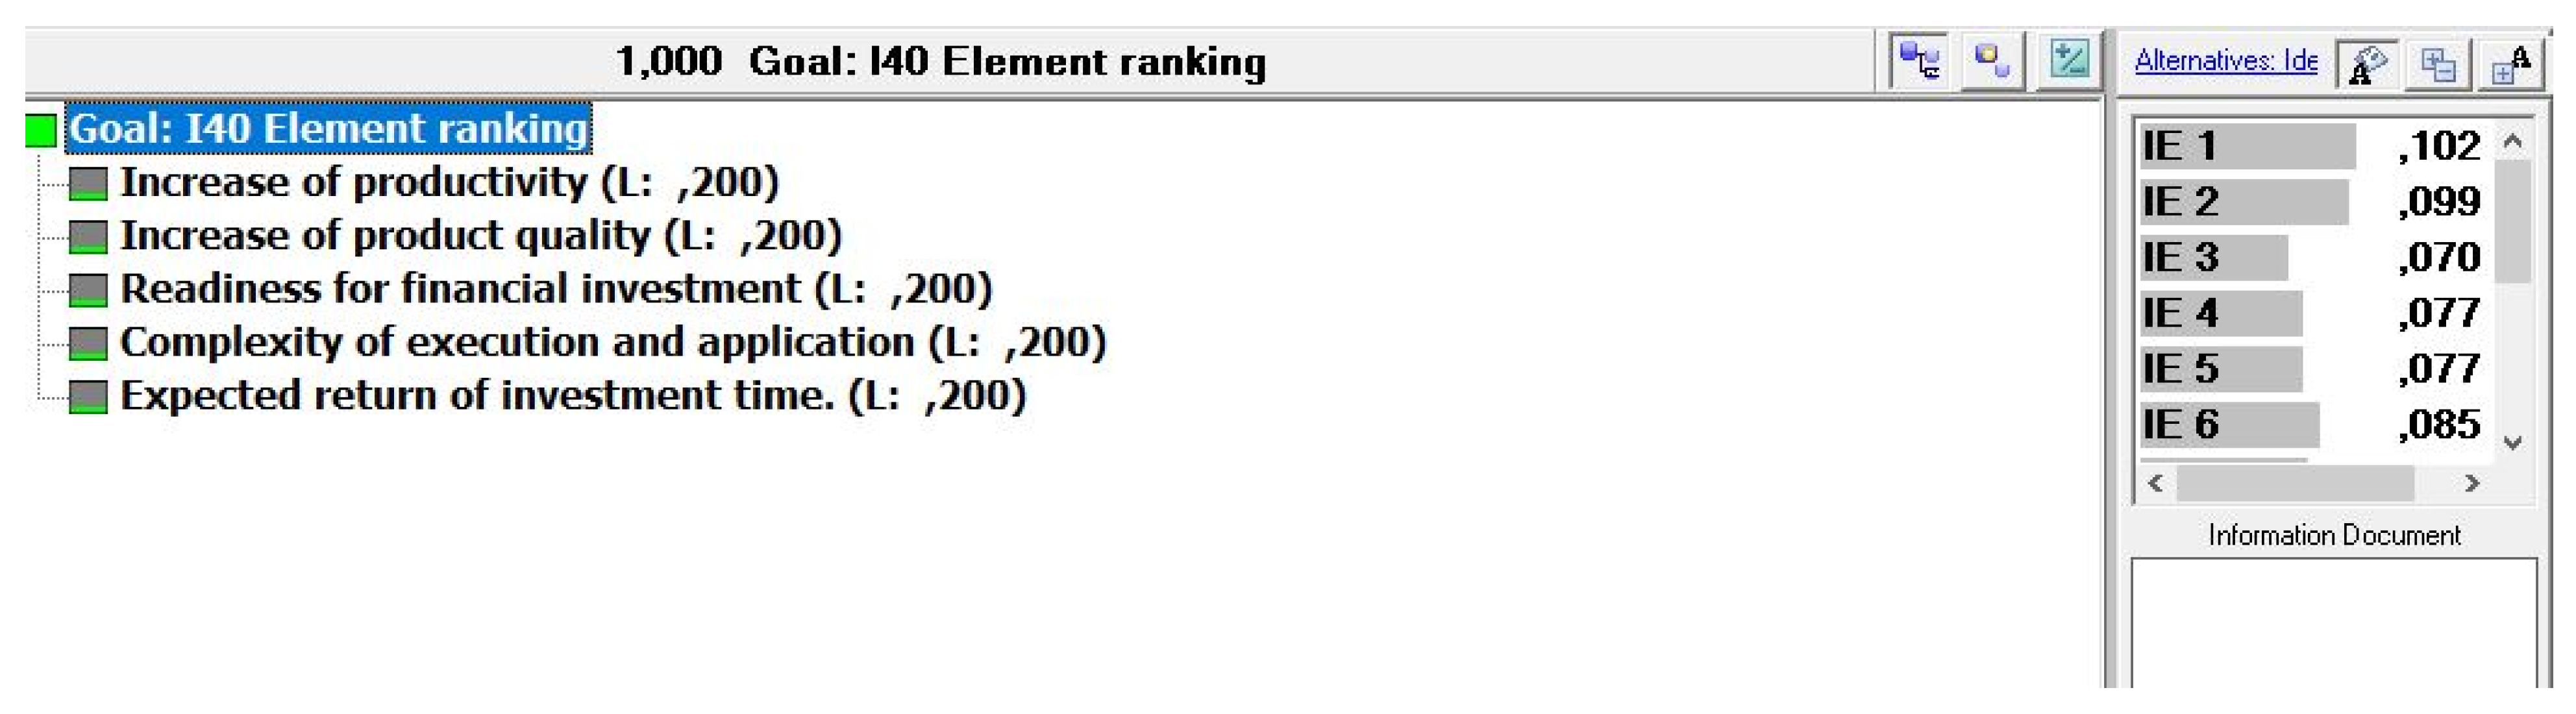
3.2. Implementation Priorities (Criteria Weighting) and Model
4. Results
- -
- implementation of elements that enable higher productivity, which means that the elements which increase productivity have a higher weight
- -
- implementation of elements that enable higher product quality, which means that the elements which affect the increase of product quality have a higher weight
- -
- implementation of elements where the company is more willing to invest financially, which means that the elements in which the companies are more willing to invest have a higher weight
- -
- implementation of elements with less complexity of execution and application, which means that the elements which are simpler for execution and application have a higher weight
- -
- implementation of elements with a shorter return of investment time, which means that the elements with a shorter ROI time have a higher weight
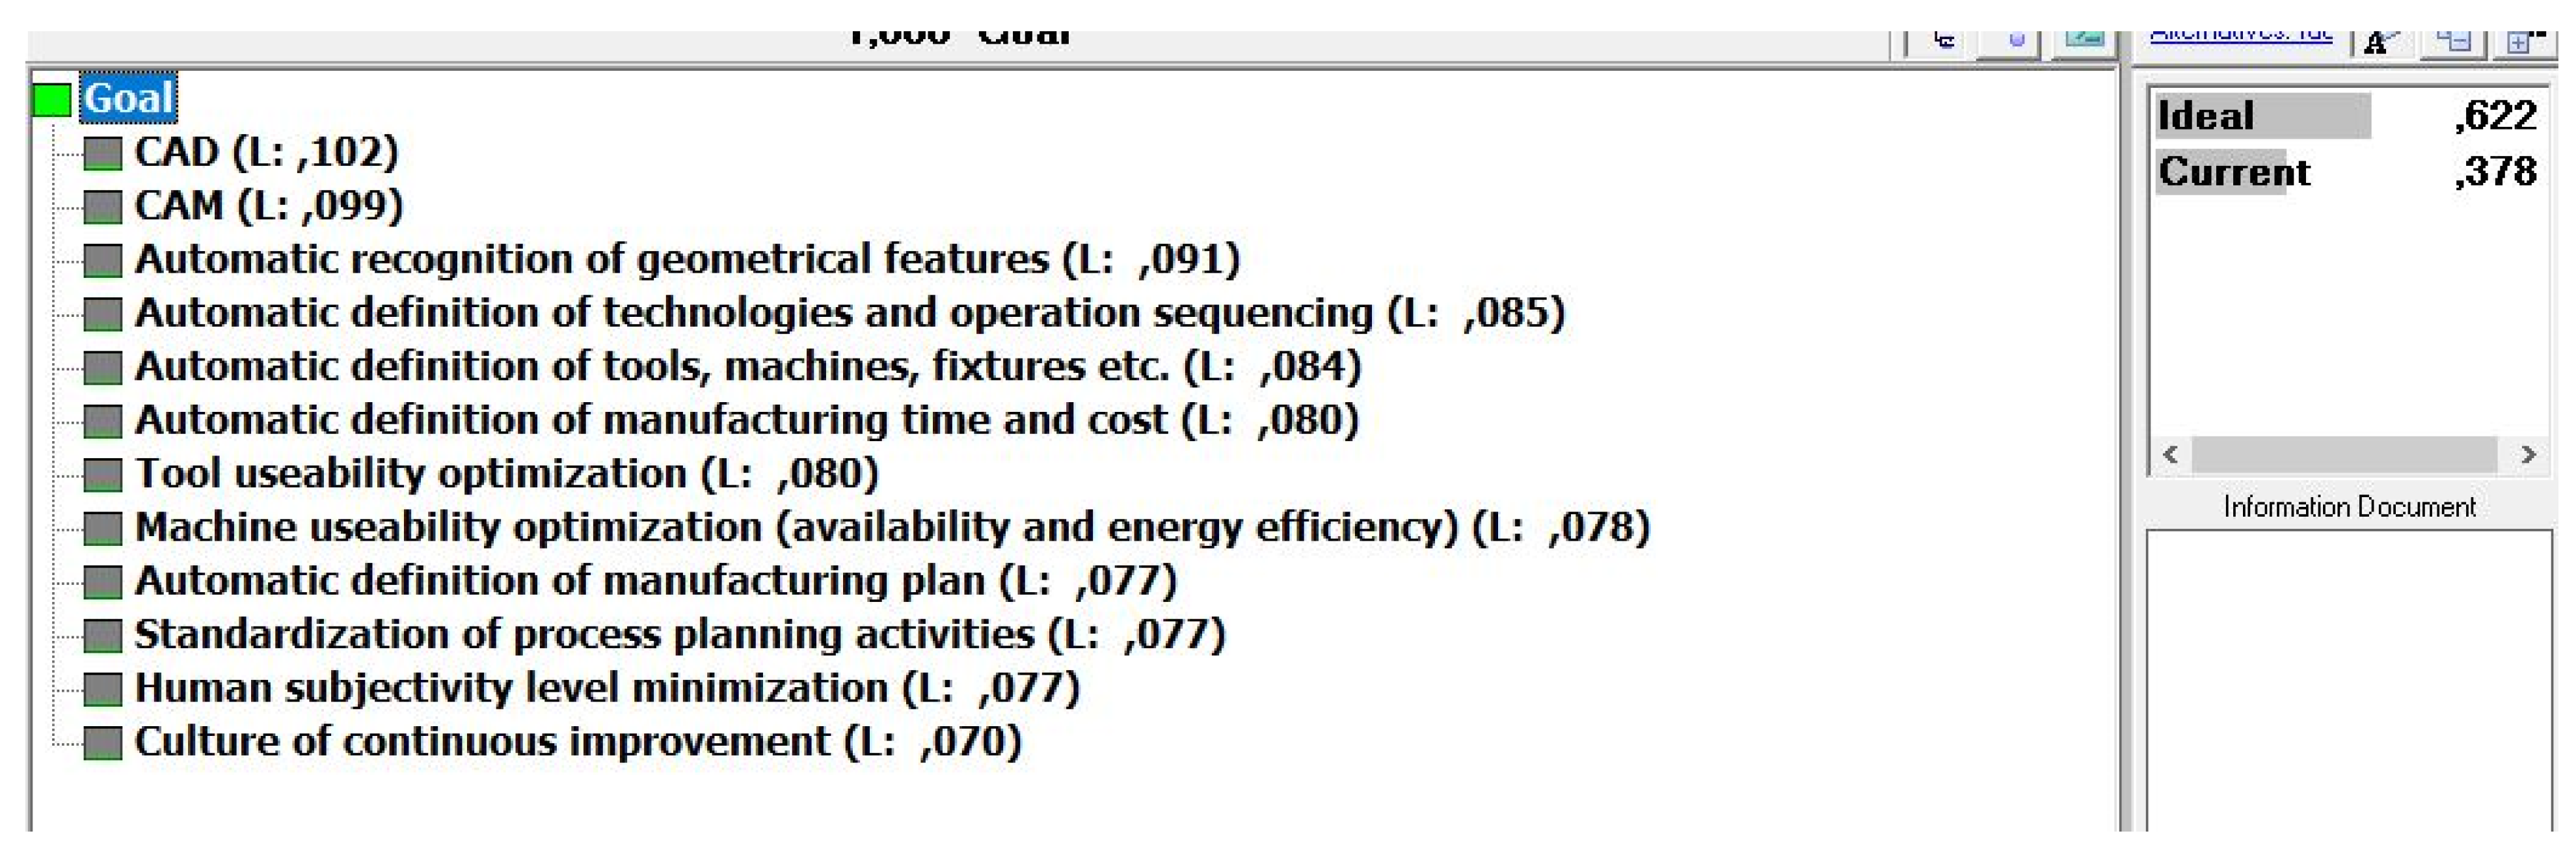
4.1. Readiness Factor Calculation
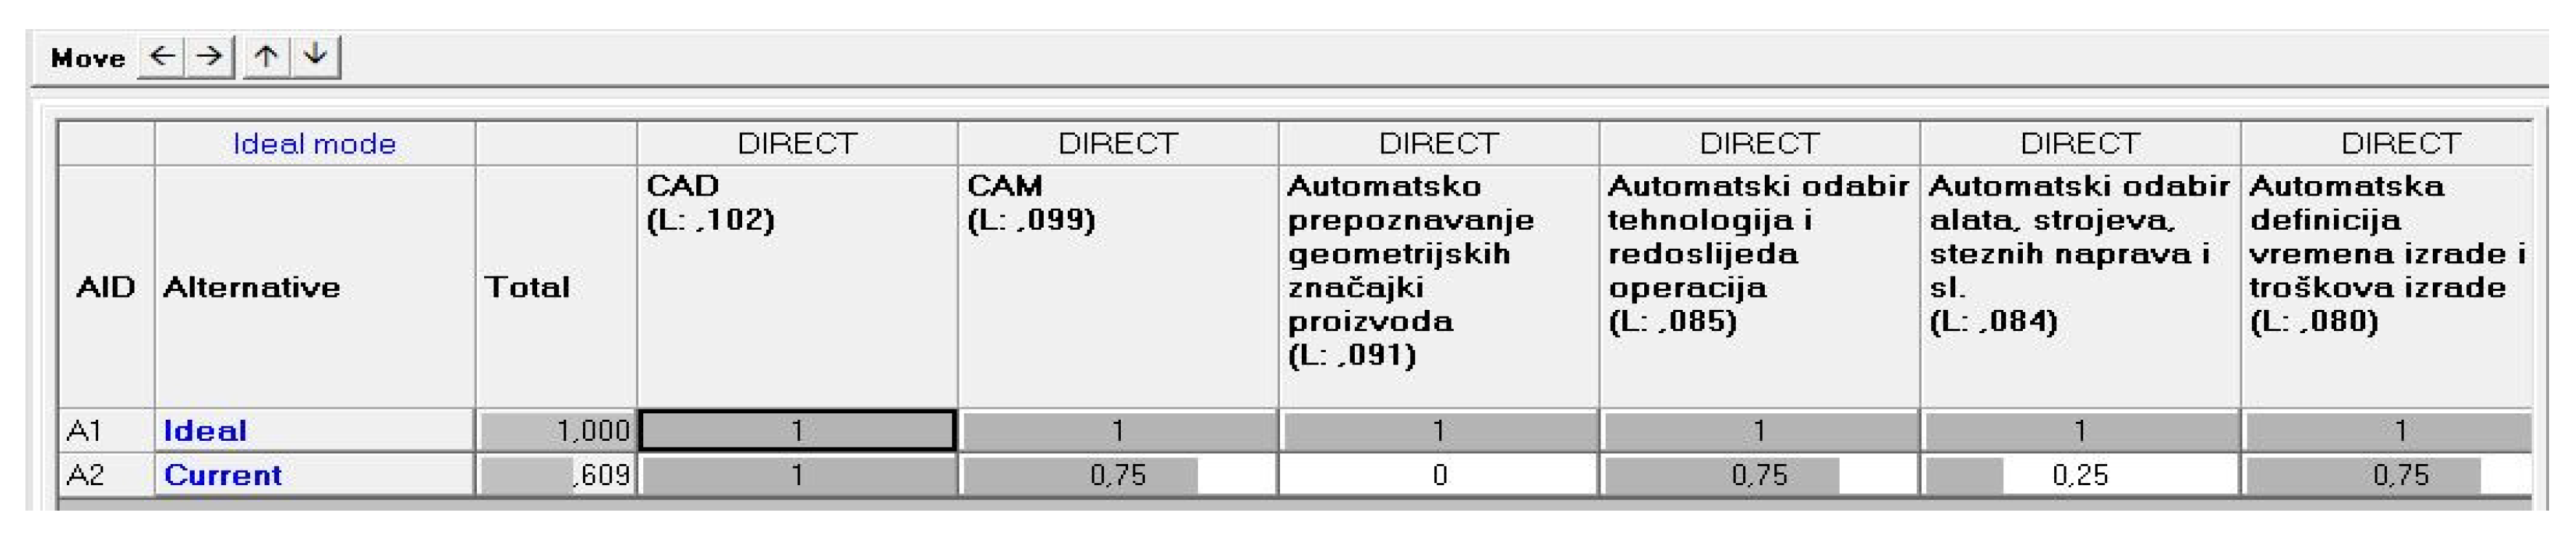
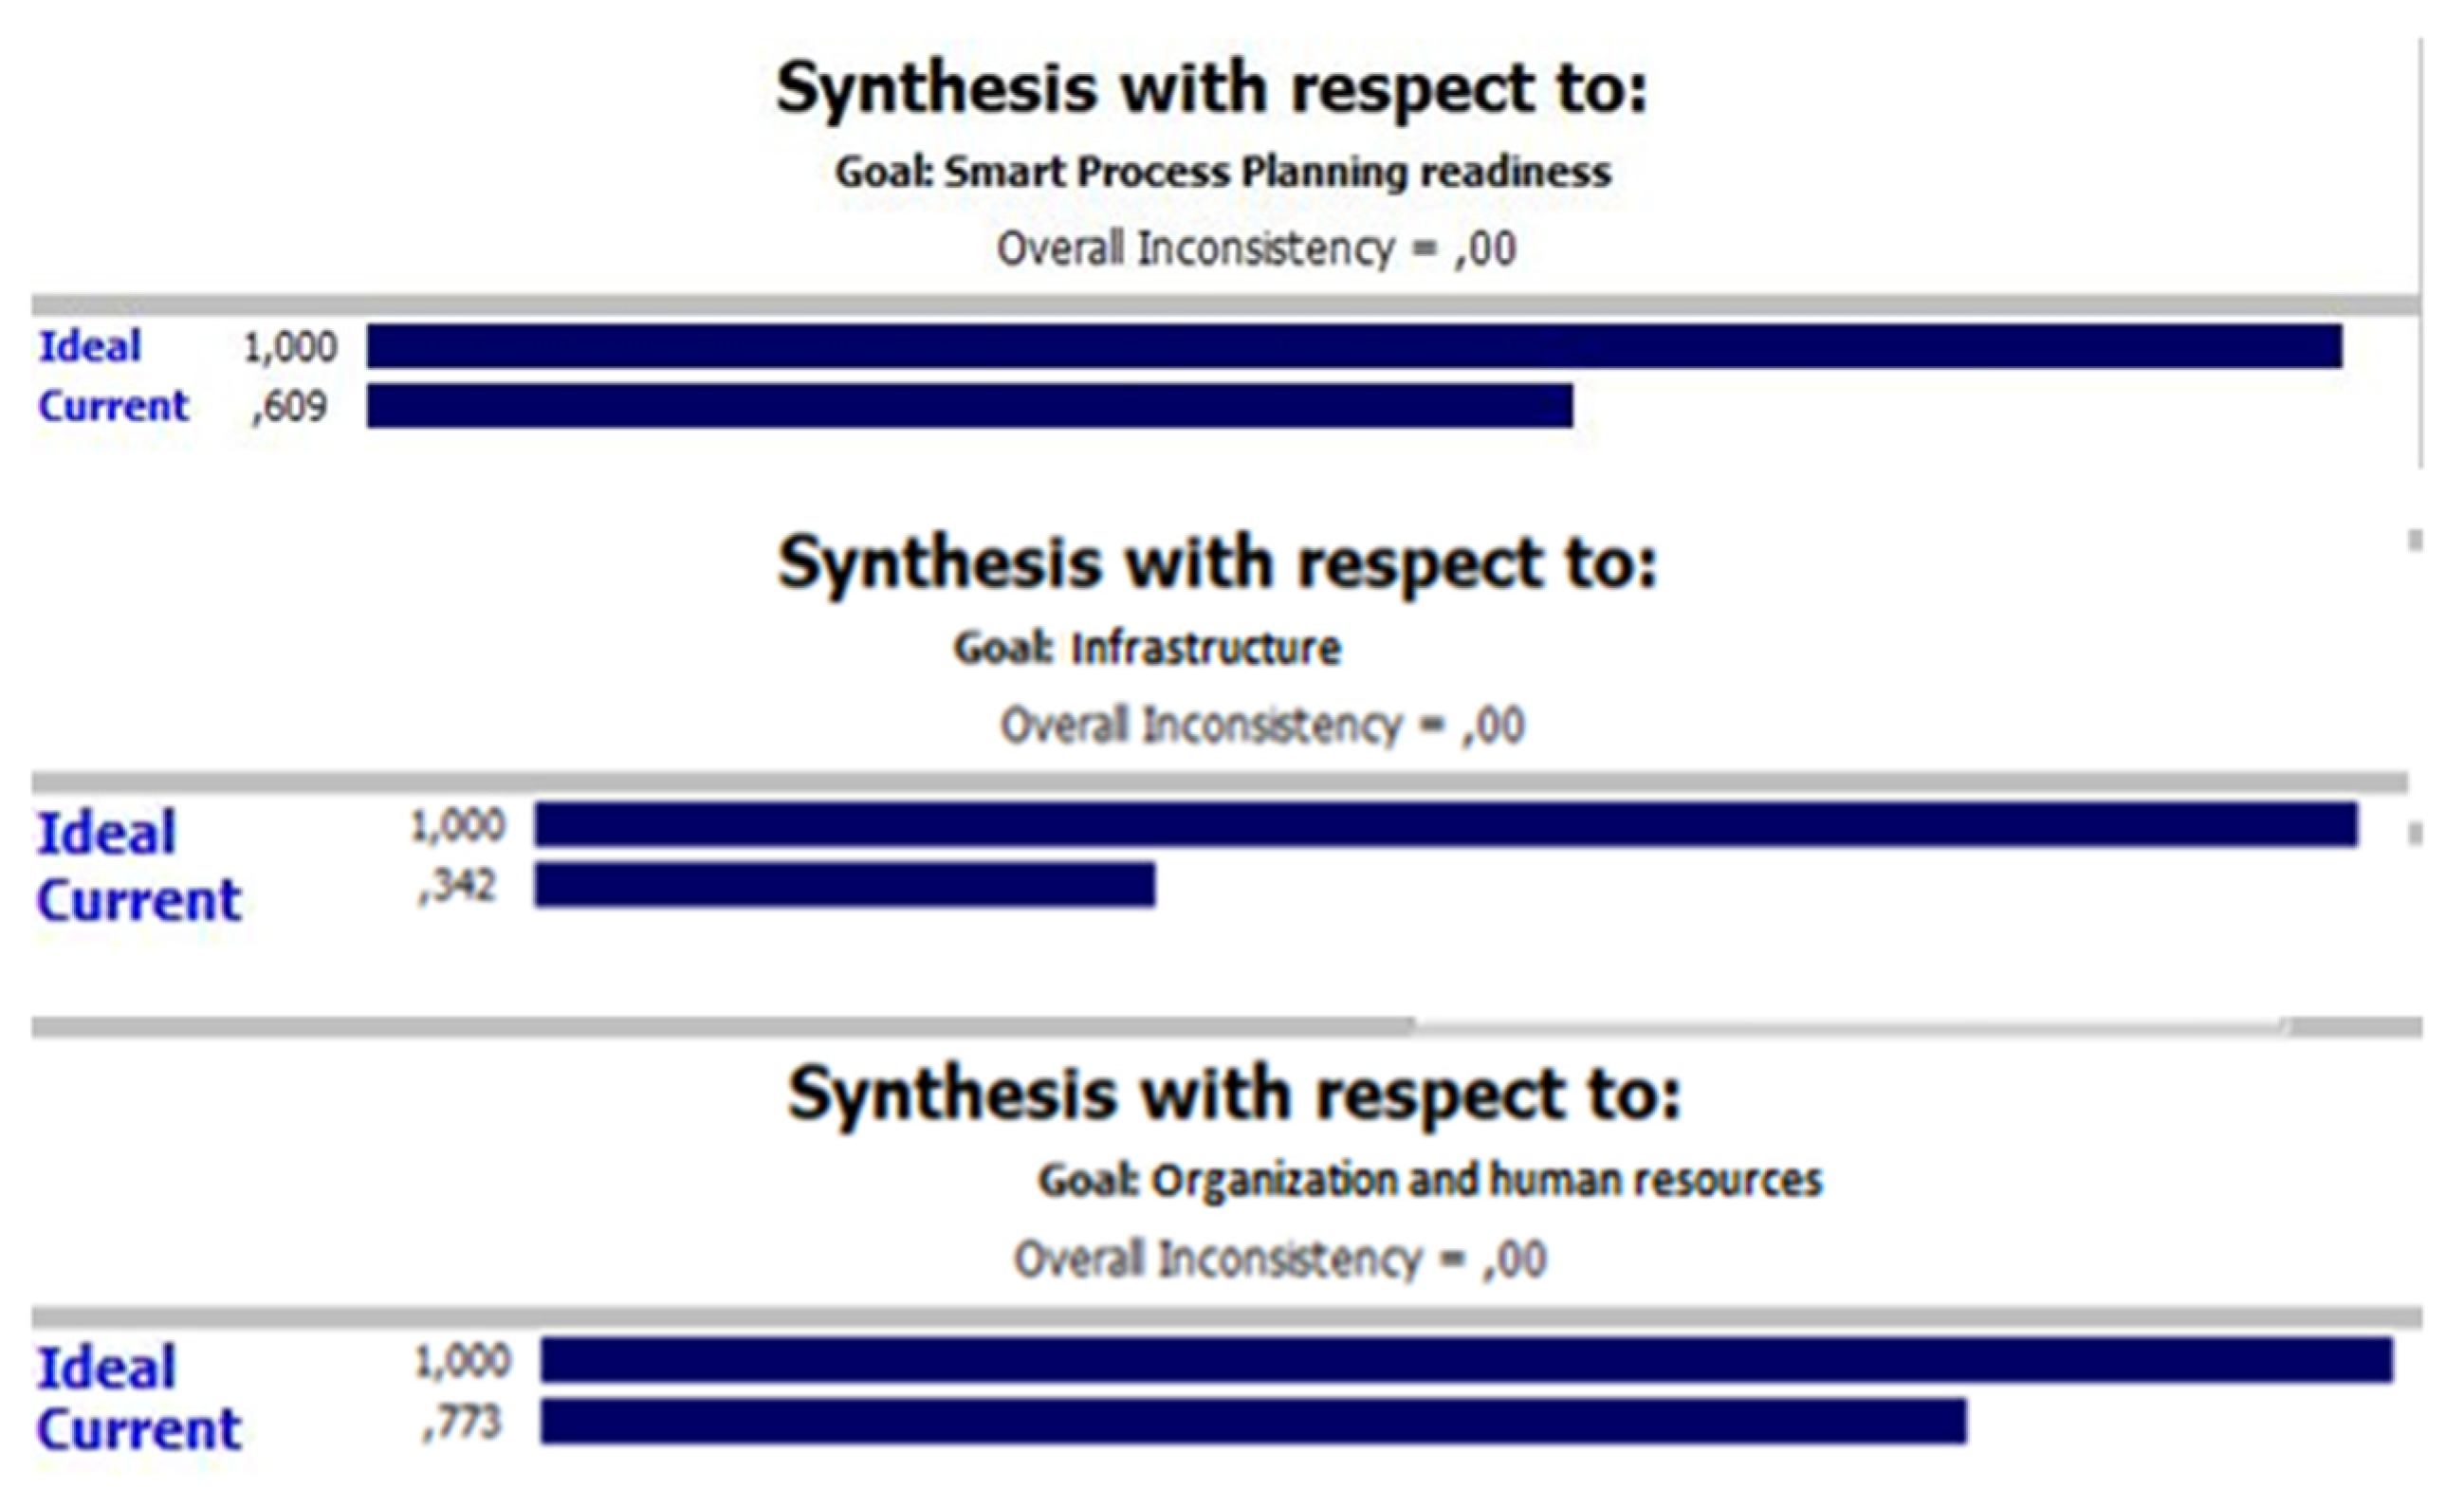
4.2. Case Study
4.3. Discussion—Implementation Strategy
4.4. Limitations
4.5. Scientific Contribution
4.6. Managerial Implications
5. Conclusions
Author Contributions
Funding
Institutional Review Board Statement
Informed Consent Statement
Data Availability Statement
Conflicts of Interest
References
- Misita, M.; Lapcevic, N.; Tadic, D.; Milanovic, D.D.; Borota-Tisma, A. New Model of Enterprises Resource Planning Implementation Planning Process in Manufacturing Enterprises. Adv. Mech. Eng. 2016, 8, 1–15. [Google Scholar] [CrossRef] [Green Version]
- 2019 IEEE Pune Section International Conference (PuneCon): MIT World Peace University, Pune, India, 18–20 December 2019. Available online: http://link.library.missouri.edu/portal/2019-IEEE-Pune-Section-International-Conference/b9NeTB0kNxU/ (accessed on 5 December 2021).
- Essential Implications of the Digital Transformation in Industry 4.0. Web of Science Core Collection. Available online: https://www.webofscience.com/wos/woscc/full-record/WOS:000407529700002 (accessed on 5 December 2021).
- Change Readiness as a Proposed Dimension for Industry 4.0 Readiness Models. Web of Science Core Collection. Available online: https://www.webofscience.com/wos/woscc/full-record/WOS:000609424000007 (accessed on 5 December 2021).
- Kreis, A.; Hirz, M.; StadlerKreis, S. IEEE Optimized Information Exchange Process between CAD and CAM. In Proceedings of the 2018 5th International Conference on Industrial Engineering and Applications (ICIEA) 2018, Singapore, 26–28 April 2018. [Google Scholar]
- Xu, X.; Wang, L.; Newman, S.T. Computer-Aided Process Planning-A Critical Review of Recent Developments and Future Trends. Int. J. Comput. Integr. Manuf. 2010, 24, 1–31. [Google Scholar] [CrossRef]
- Zhang, Y.; Luo, X.; Zhang, B.; Zhang, S. Semantic Approach to the Automatic Recognition of Machining Features. Int. J. Adv. Manuf. Technol. 2017, 89, 417–437. [Google Scholar] [CrossRef]
- Trstenjak, M.; Ćosić, P.; Antolić, D. Workpiece Classification Criteria in Automated Process Planning. Teh. Vjesn. 2019, 26, 256–262. [Google Scholar]
- Sunil, V.B.; Pande, S.S. Automatic Recognition of Features from Freeform Surface CAD Models. Comput.-Aided Des. 2008, 40, 502–517. [Google Scholar] [CrossRef]
- Su, Y.; Chu, X.; Chen, D.; Sun, X. A Genetic Algorithm for Operation Sequencing in CAPP Using Edge Selection Based Encoding Strategy. J. Intell. Manuf. 2018, 29, 313–332. [Google Scholar] [CrossRef]
- Trstenjak, M.; Cosic, P. Process Planning in Industry 4.0 Environment. Procedia Manuf. 2017, 11, 1175–1750. [Google Scholar] [CrossRef] [Green Version]
- Królikowski, M.A.; Krawczyk, M.B. Does Metal Additive Manufacturing in Industry 4.0 Reinforce the Role of Substractive Machining? Available online: https://link.springer.com/chapter/10.1007/978-3-030-18715-6_13 (accessed on 5 December 2021).
- Dayam, S.; Desai, K.A.; Kuttolamadom, M. In-Process Dimension Monitoring System for Integration of Legacy Machine Tools into the Industry 4.0 Framework. Smart Sustain. Manuf. Syst. 2021, 5, 20210021. [Google Scholar] [CrossRef]
- Moreno, A.; Velez, G.; Ardanza, A.; Barandiaran, I.; de Infante, Á.R.; Chopitea, R. Virtualisation Process of a Sheet Metal Punching Machine within the Industry 4.0 Vision. Int. J. Interact. Des. Manuf. 2017, 11, 365–373. [Google Scholar] [CrossRef]
- Kurth, R.; Tehel, R.; Päßler, T.; Putz, M.; Wehmeyer, K.; Kraft, C.; Schwarze, H. Forming 4.0: Smart Machine Components Applied as a Hybrid Plain Bearing and a Tool Clamping System. Procedia Manuf. 2019, 27, 65–71. [Google Scholar] [CrossRef]
- Akyazi, T.; Goti, A.; Oyarbide-Zubillaga, A.; Alberdi, E.; Carballedo, R.; Ibeas, R.; Garcia-Bringas, P. Skills Requirements for the European Machine Tool Sector Emerging from Its Digitalization. Metals 2020, 10, 1665. [Google Scholar] [CrossRef]
- Ferreira, F.; Guerra, H. The Coordinate Measuring Machines, Essential Tools for Quality Control of Dimensional and Geometrical Specifications of Technical Components, in the Context of the Industry 4.0. J. Phys. Conf. Ser. 2018, 1044, 012065. [Google Scholar] [CrossRef]
- Singh, G.; Aggarwal, V.; Singh, S. Critical Review on Ecological, Economical and Technological Aspects of Minimum Quantity Lubrication towards Sustainable Machining. J. Clean. Prod. 2020, 271, 122185. [Google Scholar] [CrossRef]
- Cañizares, E.; Valero, F.A. Analyzing the Effects of Applying IoT to a Metal-Mechanical Company. J. Ind. Eng. Manag. 2018, 11, 308–317. [Google Scholar] [CrossRef] [Green Version]
- Maier, W.; Möhring, H.C.; Werkle, K. Tools 4.0-Intelligence Starts on the Cutting Edge. Procedia Manuf. 2018, 24, 299–304. [Google Scholar] [CrossRef]
- Knittel, D.; Makich, H.; Nouari, M. Milling Diagnosis Using Artificial Intelligence Approaches. Mech. Ind. 2019, 20, 8. [Google Scholar] [CrossRef]
- Stentoft, J.; Adsbøll Wickstrøm, K.; Philipsen, K.; Haug, A. Drivers and Barriers for Industry 4.0 Readiness and Practice: Empirical Evidence from Small and Medium-Sized Manufacturers. Prod. Plan. Control. 2021, 32, 811–828. [Google Scholar] [CrossRef]
- Industrie 4.0-Readiness-Check. Available online: https://www.industrie40-readiness.de/?lang=en (accessed on 5 December 2021).
- Industry 4.0 Strategy Consulting Services | BCG. Available online: https://www.bcg.com/capabilities/manufacturing/industry-4.0 (accessed on 5 December 2021).
- Manufacturing’s next Act | McKinsey. Available online: https://www.mckinsey.com/business-functions/operations/our-insights/manufacturings-next-act (accessed on 5 December 2021).
- Industry 4.0-Self Assessment. Available online: https://i40-self-assessment.pwc.de/i40/landing/ (accessed on 5 December 2021).
- Schumacher, A.; Erol, S.; Sihn, W. A Maturity Model for Assessing Industry 4.0 Readiness and Maturity of Manufacturing Enterprises. Procedia CIRP 2016, 52, 161–166. [Google Scholar] [CrossRef]
- Ganzarain, J.; Ganzarain, J.; Errasti, N. Three Stage Maturity Model in SME’s toward Industry 4.0. J. Ind. Eng. Manag. 2016, 9, 1119–1128. [Google Scholar] [CrossRef]
- Babi, Z.; Veža, I.; Pavić, I. Ranking of Enterprises with Regard to Industrial Maturity Level Using AHP and TOPSIS. Available online: https://www.bib.irb.hr/830323 (accessed on 28 December 2021).
- Koska, A.; Oska, A.; Goksu, N.; Erdem, M.B.; Fettahlioglu, H.S. Measuring the Maturity of a Factory for Industry 4.0. International. J. Acad. Res. Bus. Soc. Sci. 2017, 7, 52–60. [Google Scholar]
- Christian, L.; Katja, B.; Thomas, S.; Sven, F. SIMMI 4.0—A Maturity Model for Classifying the Enterprise-Wide It and Software Landscape Focusing on Industry 4.0. In Proceedings of the 2016 Federated Conference on Computer Science and Information Systems (FedCSIS), Gdansk, Poland, 11–14 September 2016. [Google Scholar]
- Godsell, J.; Agca, O.; Gibson, J.; Ignatius, J.; Davies, C.W.; Xu, O. An Industry 4 Readiness Assessment Tool. The University of Warwick in association with Crimson & Co, Pinset Masons. 2018. Available online: https://warwick.ac.uk/fac/sci/wmg/research/scip/reports/final_version_of_i4_report_for_use_on_websites.pdf (accessed on 5 December 2021).
- Felch, V.; Asdecker, B.; Sucky, E. Digitization in Outbound Logistics—Application of an Industry 4.0 Maturity Model for the Delivery Process. Available online: https://fis.uni-bamberg.de/handle/uniba/45549 (accessed on 28 December 2021).
- Kaltenbach, F.; Marber, P.; Gosemann, C.; Bolts, T.; Kuhn, A. Smart Services Maturity Level in Germany. In Proceedings of the 2018 IEEE International Conference on Engineering, Technology and Innovation (ICE/ITMC), Stuttgart, Germany, 17–20 June 2018. [Google Scholar]
- Canetta, L.; Barni, A.; Montini, E. Development of a Digitalization Maturity Model for the Manufacturing Sector. In Proceedings of the 2018 IEEE International Conference on Engineering, Technology and Innovation (ICE/ITMC), Stuttgart, Germany, 17–20 June 2018. [Google Scholar]
- Basl, J.; Doucek, P. A Metamodel for Evaluating Enterprise Readiness in the Context of Industry 4.0. Information 2019, 10, 89. [Google Scholar] [CrossRef] [Green Version]
- Trotta, D.; Garengo, P. Assessing Industry 4.0 Maturity: An Essential Scale for SMEs. In Proceedings of the 2019 8th International Conference on Industrial Technology and Management (ICITM), Cambridge, UK, 2–4 March 2019. [Google Scholar]
- Gracel, J.; Łebkowski, P. The Concept of Industry 4.0 Related Manufacturing Technology Maturity Model (Manutech Maturity Model, MTMM). Decis. Mak. Manuf. Serv. 2018, 12, 17–31. [Google Scholar] [CrossRef]
- Oleśków-Szłapka, J.; Stachowiak, A. The Framework of Logistics 4.0 Maturity Model. Adv. Intell. Syst. Comput. 2019, 835, 771–781. [Google Scholar]
- Maisiri, W.; Van Dyk, L. Industry 4.0 Readiness Assessment for South African Industries. S. Afr. J. Ind. Eng. 2019, 30, 134–148. [Google Scholar] [CrossRef]
- SIRI Workshop on Industry 4.0 Maturity | Digital Enterprise | Siemens Global. Available online: https://new.siemens.com/global/en/company/topic-areas/digital-enterprise/digitalization-check.html (accessed on 5 December 2021).
- Machado, C.G.; Winroth, M.; Carlsson, D.; Almström, P.; Centerholt, V.; Hallin, M. Industry 4.0 Readiness in Manufacturing Companies: Challenges and Enablers towards Increased Digitalization. Procedia CIRP 2019, 81, 1113–1118. [Google Scholar] [CrossRef]
- Vrchota, J.; Pech, M. Readiness of Enterprises in Czech Republic to Implement Industry 4.0: Index of Industry 4.0. Appl. Sci. 2019, 9, 5405. [Google Scholar] [CrossRef] [Green Version]
- Pirola, F.; Cimini, C.; Pinto, R. Digital Readiness Assessment of Italian SMEs: A Case-Study Research. J. Manuf. Technol. Manag. 2020, 31, 1045–1083. [Google Scholar] [CrossRef]
- Lucato, W.C.; Pacchini, A.P.T.; Facchini, F.; Mummolo, G. Model to Evaluate the Industry 4.0 Readiness Degree in Industrial Companies. IFAC-Pap. 2019, 52, 1808–1813. [Google Scholar] [CrossRef]
- Santos, R.C.; Martinho, J.L. An Industry 4.0 Maturity Model Proposal. J. Manuf. Technol. Manag. 2019, 31, 1023–1043. [Google Scholar] [CrossRef]
- De Bruin, T.; Freeze, R.; Kulkarni, U.; Rosemann, M. Understanding the Main Phases of Developing a Maturity Assessment Model. Available online: https://eprints.qut.edu.au/25152/ (accessed on 5 December 2021).
- Antony, J.; Sony, M.; McDermott, O. Conceptualizing Industry 4.0 Readiness Model Dimensions: An Exploratory Sequential Mixed-Method Study. Available online: https://www.researchgate.net/publication/27482282_Understanding_the_Main_Phases_of_Developing_a_Maturity_Assessment_Model (accessed on 28 December 2021).
- Wagire, A.A.; Joshi, R.; Rathore, A.P.S.; Jain, R. Development of Maturity Model for Assessing the Implementation of Industry 4.0. Learning from Theory and Practice. Prod. Plan. Control. 2020, 32, 603–622. [Google Scholar] [CrossRef]
- Kruger, S.; Steyn, A.A. A Conceptual Model of Entrepreneurial Competencies Needed to Utilise Technologies of Industry 4.0. Int. J. Entrep. Innov. 2020, 22, 56–67. [Google Scholar] [CrossRef]
- Sriram, R.M.; Vinodh, S. Analysis of Readiness Factors for Industry 4.0 Implementation in SMEs Using COPRAS. Int. J. Qual. Reliab. Manag. 2021, 38, 1178–1192. [Google Scholar] [CrossRef]
- Caiado, R.G.G.; Scavarda, L.F.; Gavião, L.O.; Ivson, P.; de Mattos Nascimento, D.L.; Garza-Reyes, J.A. A Fuzzy Rule-Based Industry 4.0 Maturity Model for Operations and Supply Chain Management. Int. J. Prod. Econ. 2021, 231, 107883. [Google Scholar] [CrossRef]
- Industry 4.0 Maturity Model—Mirroring Today to Sprint into the Future | Supply Chain Management Blog. Available online: https://www.capgemini.com/ch-en/2018/02/industry-4-0-maturity-model-mirroring-today-to-sprint-into-the-future/ (accessed on 5 December 2021).
- Popkova, E.G.; Egorova, E.N.; Popova, E.; Pozdnyakova, U.A. The Model of State Management of Economy on the Basis of the Internet of Things. Stud. Comput. Intell. 2019, 826, 1137–1144. [Google Scholar]
- Brozzi, R.; D’Amico, R.D.; Pasetti Monizza, G.; Marcher, C.; Riedl, M.; Matt, D. Design of Self-Assessment Tools to Measure Industry 4.0 Readiness. A Methodological Approach for Craftsmanship SMEs. IFIP Adv. Inf. Commun. Technol. 2018, 540, 566–578. [Google Scholar]
- Sternad, M.; Lerher, T.; Gajšek, B. Maturity Levels For Logistics 4.0 Based On New’s Industry 4.0 Maturity Model. Available online: https://ideas.repec.org/a/osi/bulimm/v18y2018p695-708.html (accessed on 5 December 2021).
- Santos, K.; Rocha Loures, E.F.; Junior, O.; Santos, E. Product Lifecycle Management Maturity Models in Industry 4.0. IFIP Advances in Information and Communication Technology. Available online: https://hal.inria.fr/hal-02075595 (accessed on 28 December 2021).
- Staufen, A.G. German Industry 4.0 Index. A study from Staufen AG and Staufen Digital Neonex GmbH. 2018. Available online: https://www.staufen.ag/fileadmin/HQ/02-Company/05-Media/2-Studies/STAUFEN.-Study-Industry-4.0-Index-2018-Web-DE-en.pdf (accessed on 28 December 2021).
- Gaps in Industry 4.0 Readiness Contribute to Industrie 4.0 Maturity Index. Available online: https://www.i-scoop.eu/industry-4-0/gaps-industrie-4-0-maturity-index/ (accessed on 5 December 2021).
- Ratnasingam, J.; Latib, H.A.; Yi, L.Y.; Liat, L.C.; Khoo, A. Extent of Automation and the Readiness for Industry 4.0 among Malaysian Furniture Manufacturers. BioResources 2019, 14, 7095–7110. [Google Scholar] [CrossRef]
- De Carolis, A.; Macchi, M.; Negri, E.; Terzi, S. A Maturity Model for Assessing the Digital Readiness of Manufacturing Companies. Available online: https://link.springer.com/chapter/10.1007/978-3-319-66923-6_2 (accessed on 28 December 2021).
- A Strategist’s Guide to Industry 4.0. Available online: https://www.strategy-business.com/article/A-Strategists-Guide-to-Industry-4.0 (accessed on 5 December 2021).
- McKinsey&Company, Industry 4.0 at McKinsey’s Model Factories Get Ready for the Disruptive Wave. 2016. Available online: http://sf-eu.net/wp-content/uploads/2016/08/mckinsey-2016-industry-4.0-at-mckinseys-model-factories-en.pdf (accessed on 28 December 2021).
- Readiness for the Future of Production Report 2018–Kearney. Available online: https://www.kearney.com/operations-performance-transformation/article?/a/readiness-for-the-future-of-production-report-2018 (accessed on 5 December 2021).
- Berger Strategy Consultants, R.; Blanchet, M.; Rinn, T.; de Thieulloy, G.; von Thaden, G. Industry 4.0 The New Industrial Revolution—How Europe Will Succeed. 2014. Available online: http://www.iberglobal.com/files/Roland_Berger_Industry.pdf (accessed on 28 December 2021).
- Industrie 4.0 Maturity Index. Managing the Digital Transformation of Companies—UPDATE 2020-Acatech-National Academy of Science and Engineering. Available online: https://en.acatech.de/publication/industrie-4-0-maturity-index-update-2020/ (accessed on 5 December 2021).
- Trstenjak, M.; Opetuk, T.; Cajner, H.; Tosanovic, N. Process Planning in Industry 4.0—Current State, Potential and Management of Transformation. Sustainability 2020, 12, 5878. [Google Scholar] [CrossRef]
- Saaty, R.W. The Analytic Hierarchy Process—What It Is and How It Is Used. Math. Model. 1987, 9, 161–176. [Google Scholar] [CrossRef] [Green Version]


| Goal | Source |
|---|---|
| Strategy | [32]; [53]; [11]; [36]; [12]; [37]; [54]; [55]; [56]; [34]; [57] |
| Investment and business model | [40]; [42]; [16]; [44]; [12] |
| Increase of product quality | [45]; [36]; [37]; [38]; [35] |
| Reducing the costs | [42]; [16]; [40]; [44] |
| Decrease of manufacturing time | [16]; [43] |
| Increase of productivity | [43] |
| Element (Dimension) | Source |
|---|---|
| Manufacturing process automation and digitization | [58]; [42]; [16]; [59]; [44]; [43]; [8]; [45]; [11]; [20]; [29]; [60]; [37]; [61]; [22]; [19]; [39] |
| Smart factory | [40]; [62]; [16]; [40]; [44]; [43]; [8]; [45]; [11]; [14]; [42]; [42]; [39]; [52] |
| Big Data analytics | [40]; [42]; [16]; [40]; [63]; [8]; [45]; [47]; [22]; [39] |
| Connection with outer value chain members | [40]; [42]; [40]; [44]; [20]; [12]; [42]; [47]; [37]; [42]; [38]; [18] |
| Organization | [40]; [42]; [27]; [20]; [13]; [37]; [42]; [39] |
| IT connection/Internet infrastructure | [40]; [42]; [16]; [40]; [44]; [15]; [17] |
| Smart products | [40]; [42]; [11]; [20]; [14]; [21]; [42]; [37]; [15]; [18]; [39] |
| Technologies | [36]; [14]; [21]; [42]; [37]; [15]; [42]; [22]; [38] |
| Cyber security | [40]; [42]; [16]; [40]; [8]; [45]; [37]; [22] |
| Cloud computing | [40]; [42]; [16]; [40]; [64]; [43]; [45]; [12] |
| Education of workers and life-long learning principles | [40]; [42]; [16]; [40]; [43]; [13]; [37]; [19] |
| Real-time data exchange | [40]; [42]; [11]; [13]; [39] |
| Real-time data storage | [40]; [42]; [16]; [40]; [45]; [21]; [15]; [17] |
| Simulation/digital twin/augumented reality | [40]; [42]; [16]; [40]; [44]; [43]; [24]; [37]; [18] |
| Artificial intelligence/cyber-physical systems | [16]; [40]; [44]; [43]; [8]; [65]; [42]; [47] |
| Predictive analytics | [40]; [42]; [16]; [44]; [43]; [8]; [12] |
| Horizontal integration | [42]; [16]; [44]; [8]; [15]; [47]; [33] |
| Logistics 4.0 | [16]; [45]; [30]; [13]; [38] |
| Digital culture | [42]; [44]; [20]; [13]; [38]; [19] |
| Vertical integration | [40]; [43]; [15]; [47]; [17] |
| Advanced technology use, additive manufacturing | [40]; [44]; [43]; [8]; [45] |
| Smart scheduling and planning | [16]; [8]; [45]; [38]; [39] |
| Motivation | [42]; [12]; [19] |
| Innovation | [42]; [40]; [14]; [37] |
| Decision support | [16]; [44]; [21]; [47] |
| System self-optimization | [16]; [17] |
| Energy efficiency | [44]; [43]; [45] |
| System flexibility | [16]; [43]; [37] |
| ERP systems | [66]; [22] |
| PLM | [28] |
| Predictive maintenance | [43] |
| Decentralization | [45]; [21] |
| Renewable energy sources | [45] |
| Mass customization | [14] |
| Continuous improvement | [13] |
| Smart Process Planning | Infrastructure | Organization and Human Resources |
|---|---|---|
| CAD CAM Automatic recognition of geometrical features Automatic definition of technologies and operation sequencing Automatic definition of tools, machines, fixtures etc. Automatic definition of manufacturing time and cost Tool useability optimization Machine useability optimization (availability and energy efficiency) Automatic definition of manufacturing plan Standardization of process planning activities Human subjectivity level minimization Culture of continuous improvement | Real-time data collection in databases Archiving all data from the manufacturing plan in database Use of data from database when defining new manufacturing plan Use of predictive analytics methods Connection with outer databases Big Data manipulation Excellent computer infrastructure Flexible and modular hardware Flexible and modular software Excellent Internet infrastructure omni available Cloud computing ERP systems High level of data and connection security Predictive maintenance of hardware and software | Excellent connectivity with every part of value chain Special and highly effective communication channels (social networks) Decentralization High motivation of workers Readiness for change High innovation level Life-long learning principle Continuous improvement culture acceptance Horizontal and vertical integration |
| Increase of Productivity | Increase of Product Quality | Readiness of Financial Investment | Complexity of Execution and Application | Expected Return of Investment Time | ||||||
|---|---|---|---|---|---|---|---|---|---|---|
| Industry 4.0 element | Rank | Weight | Rank | Weight | Rank | Weight | Rank | Weight | Rank | Weight |
| CAD | 8.4667 | 0.1085 | 8.0167 | 0.1028 | 8.5333 | 0.1094 | 7.7500 | 0.0994 | 7.1000 | 0.091 |
| CAM | 8.1667 | 0.1047 | 8.3333 | 0.1068 | 7.7667 | 0.0996 | 7.9333 | 0.1017 | 6.4333 | 0.0825 |
| Automatic recognition of geometrical features of product | 5.9500 | 0.0763 | 6.3667 | 0.0816 | 4.9333 | 0.0632 | 4.2667 | 0.0547 | 5.7333 | 0.0735 |
| Automatic definition of manufacturing technology and operation sequencing | 6.8333 | 0.0876 | 6.2000 | 0.0795 | 5.3667 | 0.0688 | 6.0500 | 0.0776 | 5.5167 | 0.0707 |
| Automatic definition of tools, machine tools, fixture, etc. | 6.5833 | 0.0844 | 5.5667 | 0.0714 | 6.6167 | 0.0848 | 5.4833 | 0.0703 | 5.7167 | 0.0733 |
| Automatic definition of manufacturing time and cost | 7.2833 | 0.0934 | 6.0500 | 0.0776 | 6.8833 | 0.0882 | 6.5667 | 0.0842 | 6.2667 | 0.0803 |
| Tool useability optimization | 5.9000 | 0.0756 | 6.6000 | 0.0846 | 4.7333 | 0.0607 | 6.7333 | 0.0863 | 7.1667 | 0.0919 |
| Machine tools useability optimization (availability and energy efficiency) | 6.3000 | 0.0808 | 4.8167 | 0.0618 | 7.0333 | 0.0902 | 7.3000 | 0.0936 | 6.1667 | 0.0791 |
| Automatic definition of process plan | 4.7833 | 0.0613 | 5.8833 | 0.0754 | 6.8667 | 0.088 | 6.1000 | 0.0782 | 6.3500 | 0.0814 |
| Process planning activities standardization | 5.8500 | 0.0750 | 6.6333 | 0.085 | 6.8167 | 0.0874 | 6.7667 | 0.0868 | 6.7833 | 0.087 |
| Human subjectivity minimization | 4.4167 | 0.0566 | 6.4167 | 0.0823 | 4.9500 | 0.0635 | 6.8500 | 0.0878 | 7.6500 | 0.0981 |
| Continuous monitoring, optimization of the system and improvement | 7.4667 | 0.0957 | 7.1167 | 0.0912 | 7.5000 | 0.0962 | 6.2000 | 0.0795 | 7.1167 | 0.0912 |
| Σ | 78 | 1 | 78 | 1 | 78 | 1 | 78 | 1 | 78 | 1 |
| Increase of Productivity | Increase of Product Quality | Readiness for Financial Investment | Complexity of Execution and Application | Expected Return of Investment Time | ||||||
|---|---|---|---|---|---|---|---|---|---|---|
| Industry 4.0 element | Rank | Weight | Rank | Weight | Rank | Weight | Rank | Weight | Rank | Weight |
| Real-time data collection in databases | 9.0167 | 0.0859 | 8.1167 | 0.0773 | 8.4333 | 0.0803 | 7.9667 | 0.0759 | 7.8000 | 0.0743 |
| Archiving of all data from process plans to bases | 8.1833 | 0.0779 | 8.3333 | 0.0794 | 8.1500 | 0.0776 | 8.6833 | 0.0827 | 8.1667 | 0.0778 |
| Use of data from the base in new process plans | 6.8667 | 0.0654 | 7.7667 | 0.0740 | 8.2667 | 0.0787 | 7.6667 | 0.0730 | 7.4000 | 0.0705 |
| Use of predictive analytics methods | 9.3500 | 0.0890 | 8.6167 | 0.0821 | 6.9167 | 0.0659 | 7.0500 | 0.0671 | 7.6833 | 0.0732 |
| Connection with external databases | 5.9833 | 0.0570 | 6.9667 | 0.0663 | 6.9000 | 0.0657 | 7.5167 | 0.0716 | 6.3333 | 0.0603 |
| Big Data manipulation | 6.4500 | 0.0614 | 9.2167 | 0.0878 | 6.1167 | 0.0583 | 5.9000 | 0.0562 | 7.6500 | 0.0729 |
| Excellent computer infrastructure | 8.0167 | 0.0763 | 6.8167 | 0.0649 | 7.7167 | 0.0735 | 6.8500 | 0.0652 | 6.2500 | 0.0595 |
| Flexible and modular hardware solutions | 7.6333 | 0.0727 | 8.1833 | 0.0779 | 7.4833 | 0.0713 | 7.0167 | 0.0668 | 7.3667 | 0.0702 |
| Flexible and modular software solutions | 9.0833 | 0.0865 | 7.9167 | 0.0754 | 8.2667 | 0.0787 | 7.7833 | 0.0741 | 7.2500 | 0.0690 |
| Excellent Internet infrastructure omni available | 8.4500 | 0.0805 | 6.9500 | 0.0662 | 8.2000 | 0.0781 | 8.4000 | 0.0800 | 7.4333 | 0.0708 |
| Cloud computing | 6.9833 | 0.0665 | 6.4833 | 0.0617 | 8.0333 | 0.0765 | 7.8333 | 0.0746 | 7.3833 | 0.0703 |
| ERP systems | 6.4167 | 0.0611 | 6.4167 | 0.0611 | 6.1167 | 0.0583 | 7.3167 | 0.0697 | 8.3500 | 0.0795 |
| High data and network security | 6.7667 | 0.0644 | 6.1833 | 0.0589 | 6.3833 | 0.0608 | 7.4833 | 0.0713 | 8.3500 | 0.0795 |
| Predictive maintenance of hardware and software | 5.8000 | 0.0552 | 7.0333 | 0.0670 | 8.0167 | 0.0763 | 7.5333 | 0.0717 | 7.5833 | 0.0722 |
| Σ | 105 | 1 | 105 | 1 | 105 | 1 | 105 | 1 | 105 | 1 |
| Increase of Productivity | Increase of Product quality | Readiness for Financial Investment | Complexity of Execution and Application | Expected Return of Investment Time | ||||||
|---|---|---|---|---|---|---|---|---|---|---|
| Industry 4.0 element | Rank | Weight | Rank | Weight | Rank | Weight | Rank | Weight | Rank | Weight |
| Excellent connection with every part of value chain | 4.7000 | 0.1044 | 4.4833 | 0.0996 | 5.1000 | 0.1133 | 4.5667 | 0.1015 | 4.2167 | 0.0937 |
| Special and highly efficient communication channels (social networks) | 2.9833 | 0.0663 | 3.3833 | 0.0752 | 4.1667 | 0.0926 | 6.6167 | 0.1470 | 5.5833 | 0.1241 |
| Decentralization | 2.9833 | 0.0663 | 2.7500 | 0.0611 | 3.6167 | 0.0804 | 5.1167 | 0.1137 | 4.8167 | 0.1070 |
| High motivation of every worker | 5.9000 | 0.1311 | 6.3833 | 0.1419 | 5.2000 | 0.1156 | 5.3000 | 0.1178 | 5.3667 | 0.1193 |
| Workers’ readiness for change | 5.7500 | 0.1278 | 5.8500 | 0.1300 | 6.3667 | 0.1415 | 4.0167 | 0.0893 | 5.2333 | 0.1163 |
| High innovativeness of workers | 6.0833 | 0.1352 | 5.7833 | 0.1285 | 5.3167 | 0.1181 | 4.1500 | 0.0922 | 5.2500 | 0.1167 |
| Life-long learning principle | 6.1500 | 0.1367 | 5.6833 | 0.1263 | 5.6167 | 0.1248 | 5.0833 | 0.1130 | 5.3833 | 0.1196 |
| Continuous improvement principle (lean, kaizen) | 5.6000 | 0.1244 | 6.3667 | 0.1415 | 5.3500 | 0.1189 | 5.2500 | 0.1167 | 4.9667 | 0.1104 |
| Horizontal and vertical integration | 4.8500 | 0.1078 | 4.3167 | 0.0959 | 4.2667 | 0.0948 | 4.9000 | 0.1089 | 4.1833 | 0.0930 |
| Σ | 45 | 1 | 45 | 1 | 45 | 1 | 45 | 1 | 45 | 1 |
| Average Rank | Sum of Ranks | Mean | Std. Dev. | Weight | |
|---|---|---|---|---|---|
| PPTP | 1.7333 | 52.000 | 1.8000 | 0.7144 | 0.2889 |
| Infrastructure | 1.8500 | 55.500 | 1.9000 | 0.6618 | 0.3083 |
| Organization and Human Resources | 2.4167 | 72.500 | 2.4667 | 0.8604 | 0.4028 |
| Σ | 6.0000 | 1 |
| Rank | Organization and Human Resources | Rank | Infrastructure | Rank | Smart Process Planning |
|---|---|---|---|---|---|
| 1 | Continuous improvement culture acceptance | 1 | Archiving all data from the manufacturing plan in database | 1 | CAM |
| 2 | Excellent connectivity with every part of value chain | 2 | Real-time data collection in databases | 2 | Culture of continuous improvement |
| 3 | Special and highly effective communication channels (social networks) | 3 | Flexible and modular software | 3 | Automatic definition of manufacturing time and cost |
| 4 | Horizontal and vertical integration | 4 | Use of predictive analytics methods | 4 | Standardization of process planning activities |
| 5 | Decentralization | 5 | Excellent Internet infrastructure omni available | 5 | Tool useability optimization |
| 6 | Use of data from database when defining new manufacturing plan | 6 | Machine useability optimization (availability and energy efficiency) | ||
| 7 | Flexible and modular hardware | 7 | Human subjectivity level minimization | ||
| 8 | Cloud computing | 8 | Automatic definition of manufacturing plan | ||
| 9 | Predictive maintenance of hardware and software | 9 | Automatic definition of technologies and operation sequencing | ||
| 10 | Excellent computer infrastructure | 10 | Automatic definition of tools, machines, fixtures etc. | ||
| 11 | High level of data and connection security | 11 | Automatic recognition of geometrical features | ||
| 12 | ERP systems | ||||
| 13 | Big Data Manipulation | ||||
| 14 | Connection with outer databases |
Publisher’s Note: MDPI stays neutral with regard to jurisdictional claims in published maps and institutional affiliations. |
© 2022 by the authors. Licensee MDPI, Basel, Switzerland. This article is an open access article distributed under the terms and conditions of the Creative Commons Attribution (CC BY) license (https://creativecommons.org/licenses/by/4.0/).
Share and Cite
Trstenjak, M.; Opetuk, T.; Cajner, H.; Hegedić, M. Industry 4.0 Readiness Calculation—Transitional Strategy Definition by Decision Support Systems. Sensors 2022, 22, 1185. https://doi.org/10.3390/s22031185
Trstenjak M, Opetuk T, Cajner H, Hegedić M. Industry 4.0 Readiness Calculation—Transitional Strategy Definition by Decision Support Systems. Sensors. 2022; 22(3):1185. https://doi.org/10.3390/s22031185
Chicago/Turabian StyleTrstenjak, Maja, Tihomir Opetuk, Hrvoje Cajner, and Miro Hegedić. 2022. "Industry 4.0 Readiness Calculation—Transitional Strategy Definition by Decision Support Systems" Sensors 22, no. 3: 1185. https://doi.org/10.3390/s22031185