

Fiber Optic Sensing Textile for Strain Monitoring in Composite Substrates
 ,
,
Abstract
:1. Introduction
2. Distributed Fiber Optics Sensing System
2.1. Optical Frequency Domain Reflectometry (OFDR) Interrogation System
2.2. Textile and Composite Fabrication
3. DFOST Test Setup
4. Results
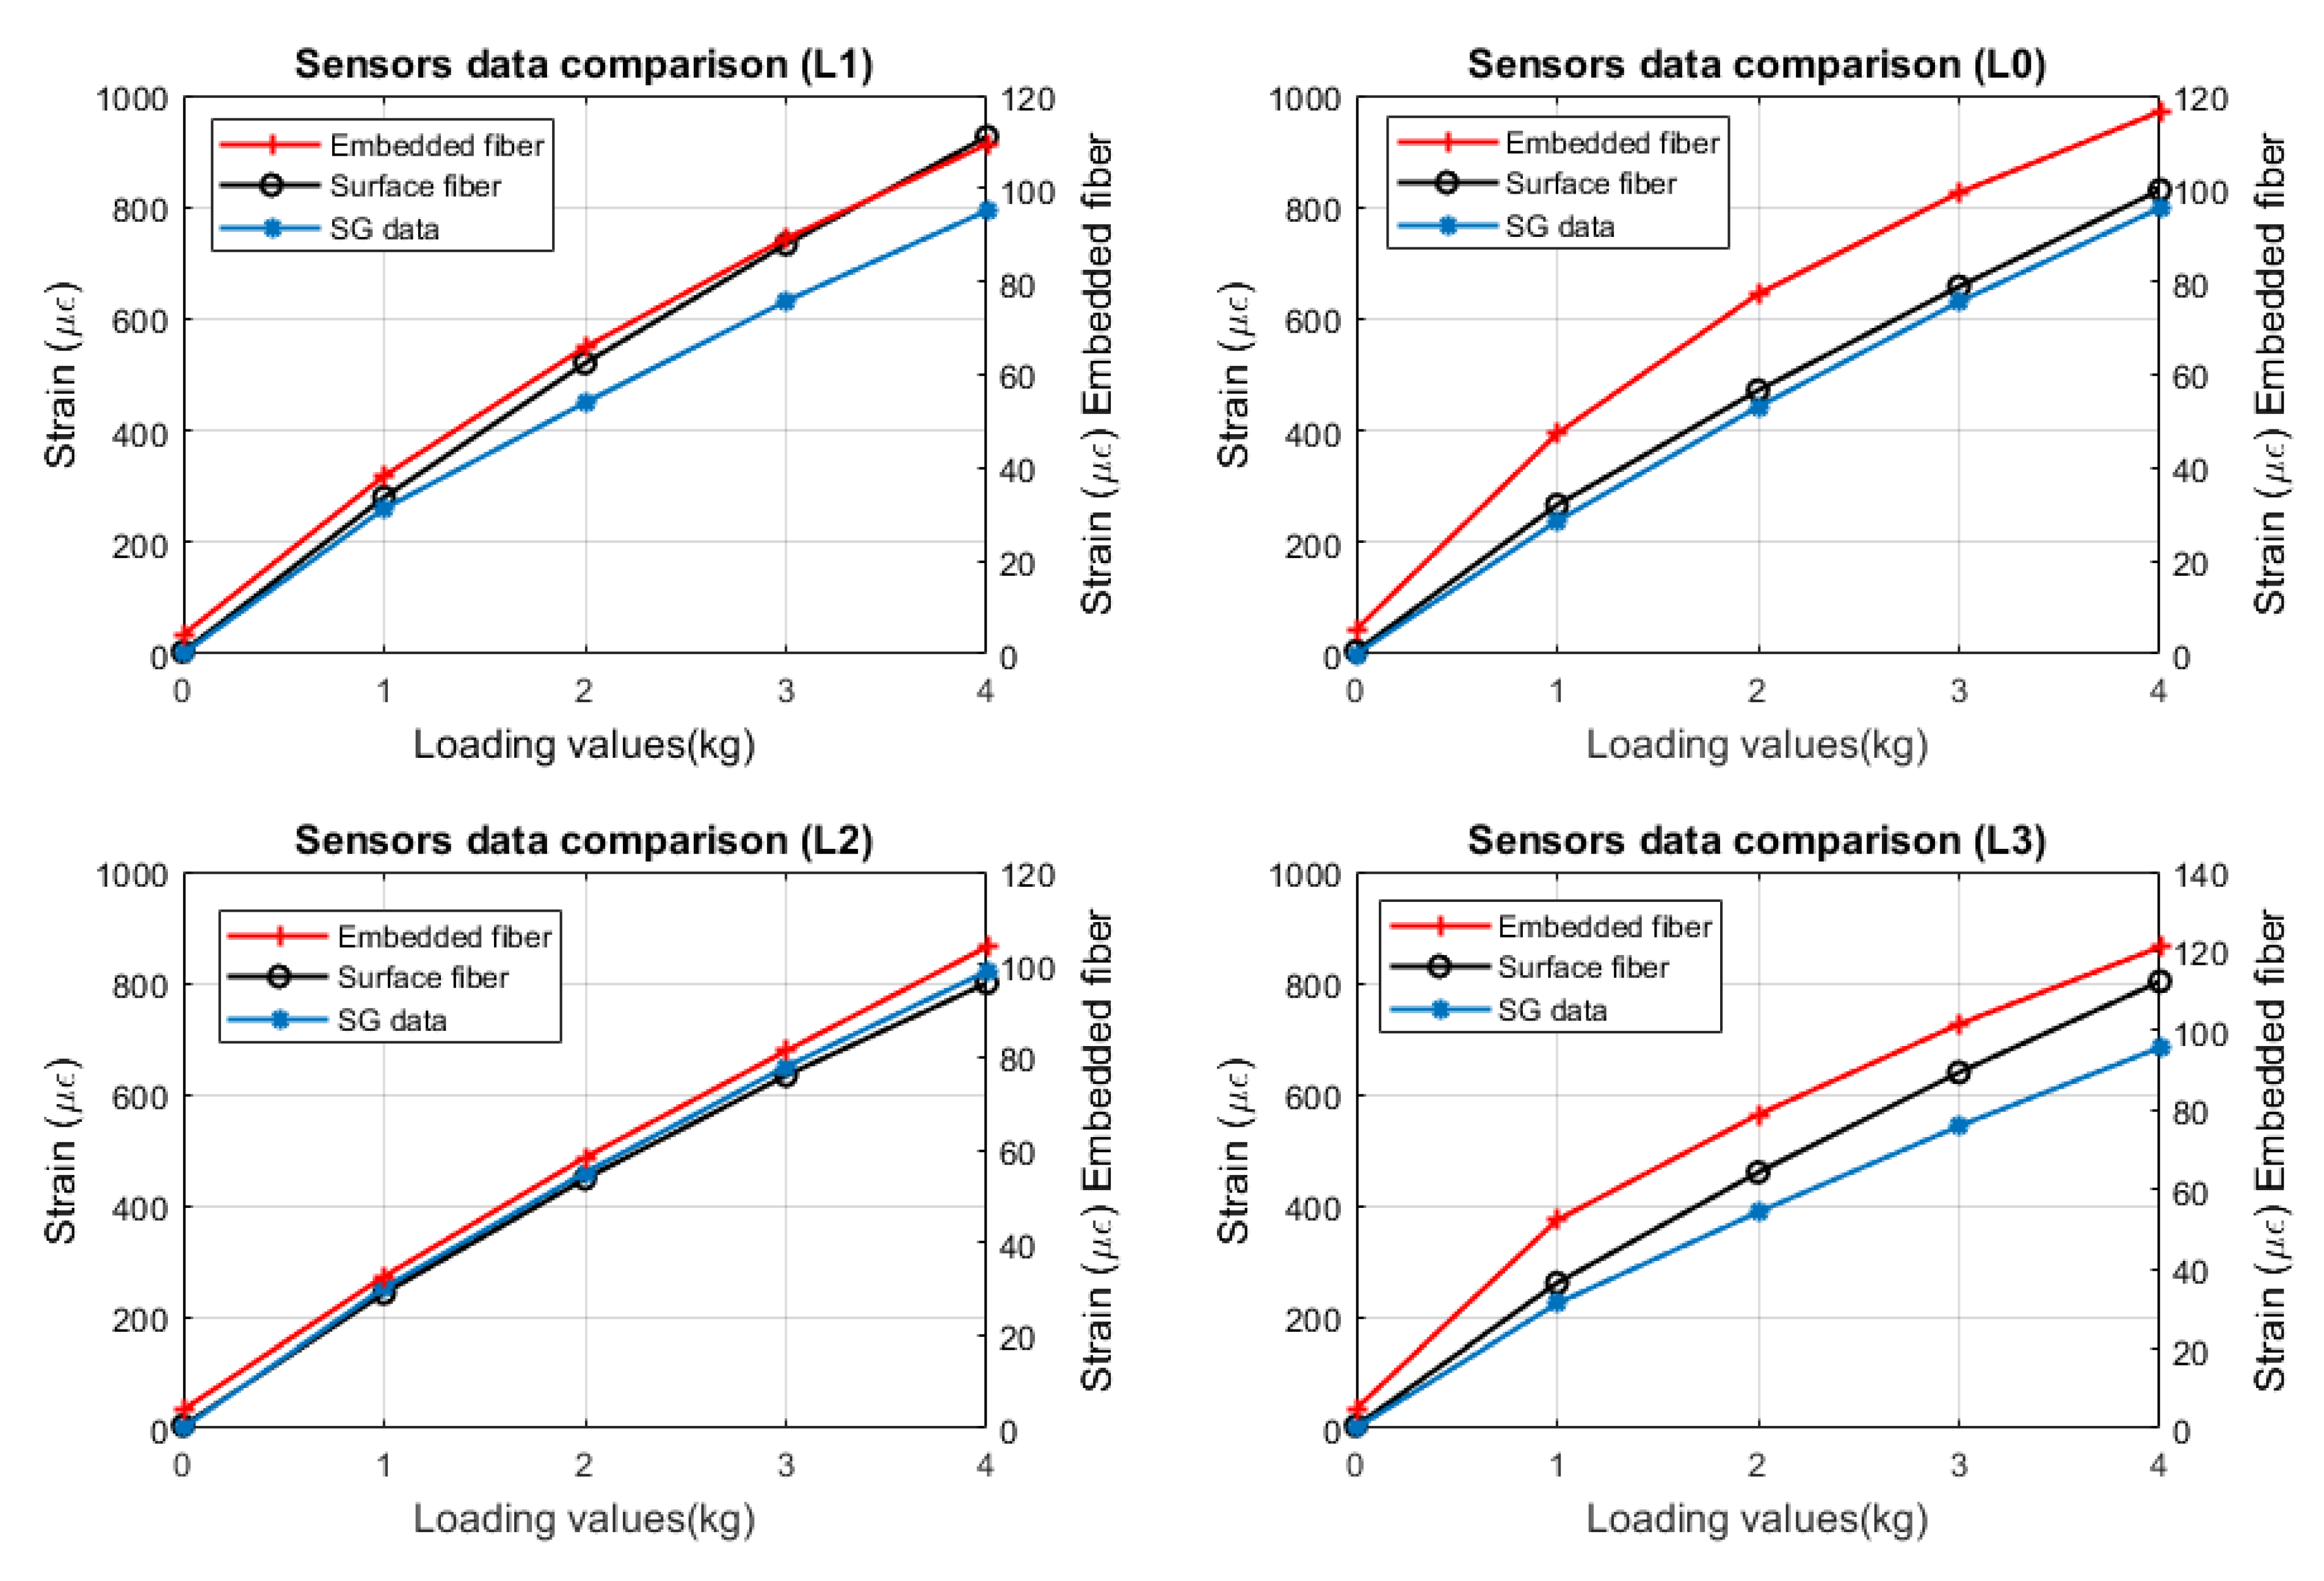
4.1. Static Test
4.2. Dynamic Test
5. Conclusions
Author Contributions
Funding
Informed Consent Statement
Data Availability Statement
Acknowledgments
Conflicts of Interest
References
- Mangalgiri, P. Composite materials for aerospace applications. Bull. Mater. Sci. 1999, 22, 657–664. [Google Scholar] [CrossRef] [Green Version]
- Friedrich, K.; Almajid, A.A. Manufacturing aspects of advanced polymer composites for automotive applications. Appl. Compos. Mater. 2013, 20, 107–128. [Google Scholar] [CrossRef]
- Hollaway, L.C. Advanced Polymer Composites and Polymers in the Civil Infrastructure; Elsevier: Amsterdam, The Netherlands, 2001. [Google Scholar]
- Keller, T. Overview of Fibre-Reinforced Polymers in Bridge Construction. SED 7. IAfBaSE (IABSE) 2003. [Google Scholar]
- Njuguna, J. Lightweight Composite Structures in Transport: Design, Manufacturing, Analysis and Performance; Woodhead Publishing: Sawston, UK, 2016. [Google Scholar]
- Sutherland, H.; Beattie, A.; Hansche, B.; Musial, W.; Allread, J.; Johnson, J.; Summers, M. The Application of Non-Destructive Techniques to the Testing of A Wind Turbine Blade; Technical Report; Sandia National Labs.: Albuquerque, NM, USA, 1994. [Google Scholar]
- Joosse, P.; Blanch, M.; Dutton, A.; Kouroussis, D.; Philippidis, T.; Vionis, P. Acoustic emission monitoring of small wind turbine blades. J. Sol. Energy Eng. 2002, 124, 446–454. [Google Scholar] [CrossRef]
- Anastassopoulos, A.; Kouroussis, D.; Nikolaidis, V.; Proust, A.; Dutton, A.; Blanch, M.; Jones, L.; Vionis, P.; Lekou, D.; van Delft, D.; et al. Structural integrity evaluation of wind turbine blades using pattern recognition analysis on acoustic emission data. J. Acoust. Emiss. 2003, 20. [Google Scholar]
- Avdelidis, N.; Almond, D.; Ibarra-Castanedo, C.; Bendada, A.; Kenny, S.; Maldague, X. Structural integrity assessment of materials by thermography. In Proceedings of the Conference Damage in Composite Materials CDCM, Stuttgart, Germany, 18–19 September 2006. [Google Scholar]
- Tuzzeo, D.; Di Scalea, F.L. Noncontact air-coupled guided wave ultrasonics for detection of thinning defects in aluminum plates. Res. Nondestruct. Eval. 2001, 13, 61–78. [Google Scholar] [CrossRef]
- Bogue, R. Recent developments in MEMS sensors: A review of applications, markets and technologies. Sens. Rev. 2013, 33, 300–304. [Google Scholar] [CrossRef]
- Zhu, J.; Liu, X.; Shi, Q.; He, T.; Sun, Z.; Guo, X.; Liu, W.; Sulaiman, O.B.; Dong, B.; Lee, C. Development trends and perspectives of future sensors and MEMS/NEMS. Micromachines 2020, 11, 7. [Google Scholar] [CrossRef] [Green Version]
- Glišić, B.; Inaudi, D. Fibre Optic Methods for Structural Health Monitoring; Wiley Online Library: Hoboken, NJ, USA, 2007. [Google Scholar]
- Measures, R.M. Structural Monitoring With Fiber Optic Technology; Academic Press Inc.: Cambridge, MA, USA, 2001. [Google Scholar]
- Al-Azzawi, A. Fibre Optics: Principles and Advanced Practices; CRC Press: Boca Raton, FL, USA, 2017. [Google Scholar]
- Zhou, D.P.; Li, W.; Chen, L.; Bao, X. Distributed temperature and strain discrimination with stimulated Brillouin scattering and Rayleigh backscatter in an optical fiber. Sensors 2013, 13, 1836–1845. [Google Scholar] [CrossRef] [Green Version]
- De Jong, S.; Slingerland, J.; Van de Giesen, N. Fiber optic distributed temperature sensing for the determination of air temperature. Atmos. Meas. Tech. 2015, 8, 335–339. [Google Scholar] [CrossRef] [Green Version]
- Lu, F.; Wright, R.; Lu, P.; Cvetic, P.C.; Ohodnicki, P.R. Distributed fiber optic pH sensors using sol-gel silica based sensitive materials. Sens. Actuators B Chem. 2021, 340, 129853. [Google Scholar] [CrossRef]
- Liu, X.; Jin, B.; Bai, Q.; Wang, Y.; Wang, D.; Wang, Y. Distributed fiber-optic sensors for vibration detection. Sensors 2016, 16, 1164. [Google Scholar] [CrossRef]
- Amanzadeh, M.; Aminossadati, S.M.; Kizil, M.S.; Rakić, A.D. Recent developments in fibre optic shape sensing. Measurement 2018, 128, 119–137. [Google Scholar] [CrossRef] [Green Version]
- Piccolo, A.; Delepine-Lesoille, S.; Bumbieler, F.; Zghondi, J.; Lecieux, Y.; Leduc, D.; Teixeira, P.; Gay, O. Tunnel monitoring: Performances of several innovative shape sensing systems. In Proceedings of the TINCE 2018—Technological Innovations in Nuclear Civil Engineering, Paris, France, 29–31 August 2018. [Google Scholar]
- Ravet, F.; Briffod, F.; Glisic, B.; Nikle, M.; Inaudi, D. Submillimeter crack detection with Brillouin-based fiber-optic sensors. IEEE Sens. J. 2009, 9, 1391–1396. [Google Scholar] [CrossRef]
- Brown, K.; Brown, A.W.; Colpitts, B.G.; Bremner, T.W. Analysis of Brillouin Scattering Based Fiber Optic Sensor Bonding Effects. J. Intell. Mater. Syst. Struct. 2008, 19, 93–99. [Google Scholar] [CrossRef]
- Ohno, H.; Naruse, H.; Kurashima, T.; Nobiki, A.; Uchiyama, Y.; Kusakabe, Y. Application of Brillouin scattering-based distributed optical fiber strain sensor to actual concrete piles. IEICE Trans. Electron. 2002, 85, 945–951. [Google Scholar]
- Mohamad, H.; Bennett, P.J.; Soga, K.; Klar, A.; Pellow, A. Distributed optical fiber strain sensing in a secant piled wall. In Proceedings of the 7th FMGM 2007: Field Measurements in Geomechanics, Boston, MA, USA, 24–27 September 2007; pp. 1–12. [Google Scholar]
- Weisbrich, M.; Holschemacher, K. Comparison between different fiber coatings and adhesives on steel surfaces for distributed optical strain measurements based on Rayleigh backscattering. J. Sensors Sens. Syst. 2018, 7, 601–608. [Google Scholar] [CrossRef] [Green Version]
- Zhu, P.; Xie, X.; Sun, X.; Soto, M.A. Distributed modular temperature-strain sensor based on optical fiber embedded in laminated composites. Compos. Part B Eng. 2019, 168, 267–273. [Google Scholar] [CrossRef]
- Kulpa, M.; Howiacki, T.; Wiater, A.; Siwowski, T.; Sieńko, R. Strain and displacement measurement based on distributed fibre optic sensing (DFOS) system integrated with FRP composite sandwich panel. Measurement 2021, 175, 109099. [Google Scholar] [CrossRef]
- Rajan, G.; Prusty, B.G. Structural Health Monitoring of Composite Structures Using Fiber Optic Methods; CRC Press: Boca Raton, FL, USA, 2016. [Google Scholar]
- Ramakrishnan, M.; Rajan, G.; Semenova, Y.; Farrell, G. Overview of fiber optic sensor technologies for strain/temperature sensing applications in composite materials. Sensors 2016, 16, 99. [Google Scholar] [CrossRef] [Green Version]
- Ghoshal, A.; Ayers, J.; Gurvich, M.; Urban, M.; Bordick, N. Experimental Investigations in Embedded Sensing for Structural Health Monitoring of Composite Components in Aerospace Vehicles. Smart Mater. Adapt. Struct. Intell. Syst. Am. Soc. Mech. Eng. 2012, 45097, 845–854. [Google Scholar]
- Zhao, L.; Wang, J.; Li, Z.; Hou, M.; Dong, G.; Liu, T.; Sun, T.; Grattan, K.T. Quasi-distributed fiber optic temperature and humidity sensor system for monitoring of grain storage in granaries. IEEE Sens. J. 2020, 20, 9226–9233. [Google Scholar] [CrossRef]
- Botsis, J.; Humbert, L.; Colpo, F.; Giaccari, P. Embedded fiber Bragg grating sensor for internal strain measurements in polymeric materials. Opt. Lasers Eng. 2005, 43, 491–510. [Google Scholar] [CrossRef]
- Kantaros, A.; Karalekas, D. FBG based in situ characterization of residual strains in FDM process. In Residual Stress, Thermomechanics &Infrared Imaging, Hybrid Techniques and Inverse Problems; Springer: Berlin/Heidelberg, Germany, 2014; Volume 8, pp. 333–337. [Google Scholar]
- Kersey, A.D.; Davis, M.A.; Patrick, H.J.; LeBlanc, M.; Koo, K.; Askins, C.; Putnam, M.; Friebele, E.J. Fiber grating sensors. J. Light. Technol. 1997, 15, 1442–1463. [Google Scholar] [CrossRef]
- Kim, G.H.; Park, S.M.; Park, C.H.; Jang, H.; Kim, C.S.; Lee, H.D. Real-time quasi-distributed fiber optic sensor based on resonance frequency mapping. Sci. Rep. 2019, 9, 1–9. [Google Scholar] [CrossRef] [PubMed] [Green Version]
- Martinez, A.; Khrushchev, I.Y.; Bennion, I. Direct inscription of Bragg gratings in coated fibers by an infrared femtosecond laser. Opt. Lett. 2006, 31, 1603–1605. [Google Scholar] [CrossRef]
- Lindner, E.; Hartung, A.; Hoh, D.; Chojetzki, C.; Schuster, K.; Bierlich, J.; Rothhardt, M. Trends and future of fiber Bragg grating sensing technologies: Tailored draw tower gratings (DTGs). Proc. SPIE 2014, 9141, 174–181. [Google Scholar]
- Born, M.; Wolf, E. Principles of Optics: Electromagnetic Theory of Propagation, Interference and Diffraction of Light; Elsevier: Amsterdam, The Netherlands, 2013. [Google Scholar]
- Horiguchi, T.; Shimizu, K.; Kurashima, T.; Tateda, M.; Koyamada, Y. Development of a distributed sensing technique using Brillouin scattering. J. Light. Technol. 1995, 13, 1296–1302. [Google Scholar] [CrossRef]
- Biondi, A.M.; Zhou, J.; Guo, X.; Wu, R.; Tang, Q.; Gandhi, H.; Yu, T.; Gopalan, B.; Hanna, T.; Ivey, J.; et al. Pipeline structural health monitoring using distributed fiber optic sensing textile. Opt. Fiber Technol. 2022, 70, 102876. [Google Scholar] [CrossRef]
- Maraval, D.; Gabet, R.; Jaouen, Y.; Lamour, V. Dynamic optical fiber sensing with brillouin optical time domain reflectometry: Application to pipeline vibration monitoring. J. Light. Technol. 2016, 35, 3296–3302. [Google Scholar] [CrossRef]
- Schenato, L. A review of distributed fibre optic sensors for geo-hydrological applications. Appl. Sci. 2017, 7, 896. [Google Scholar] [CrossRef] [Green Version]
- Díaz-Maroto, P.F.; Fernández-López, A.; García-Alonso, J.; Iglesias, M.; Güemes, A. Buckling detection of an omega-stiffened aircraft composite panel using distributed fibre optic sensors. Thin-Walled Struct. 2018, 132, 375–384. [Google Scholar] [CrossRef]
- Matta, F.; Bastianini, F.; Galati, N.; Casadei, P.; Nanni, A. Distributed strain measurement in steel bridge with fiber optic sensors: Validation through diagnostic load test. J. Perform. Constr. Facil. 2008, 22, 264. [Google Scholar] [CrossRef]
- Glišić, B.; Posenato, D.; Inaudi, D. Integrity monitoring of an old steel bridge using fiber optic distributed sensors based on Brillouin scattering. In Proceedings of the Nondestructive Characterization for Composite Materials, Aerospace Engineering, Civil Infrastructure, and Homeland Security, San Diego, CA, USA, 20–22 March 2007; Volume 6531, pp. 210–217. [Google Scholar]
- Biondi, A.M.; Guo, X.; Zhou, J.; Tang, Q.; Ghandi, H.; Goplan, B.; Hanna, T.; Ivey, J.; Yu, T.; Wang, X. Optical fiber sensing textile for temperature and strain distributed measurement. In Proceedings of the Nondestructive Characterization and Monitoring of Advanced Materials, Aerospace, Civil Infrastructure, and Transportation XV. International Society for Optics and Photonics, Online, 22–26 March 2021; Volume 11592, p. 115921. [Google Scholar]
- Soller, B.J.; Gifford, D.K.; Wolfe, M.S.; Froggatt, M.E. High resolution optical frequency domain reflectometry for characterization of components and assemblies. Opt. Express 2005, 13, 666–674. [Google Scholar] [CrossRef] [PubMed] [Green Version]
- Kreger, S.T.; Gifford, D.K.; Froggatt, M.E.; Soller, B.J.; Wolfe, M.S. High resolution distributed strain or temperature measurements in single-and multi-mode fiber using swept-wavelength interferometry. In Optical Fiber Sensors; Optical Society of America: Washington, DC, USA, 2006; p. ThE42. [Google Scholar]
- Froggatt, M.; Gifford, D.; Kreger, S.; Wolfe, M.; Soller, B. Distributed strain and temperature discrimination in unaltered polarization maintaining fiber. In Optical Fiber Sensors; Optical Society of America: Washington, DC, USA, 2006; p. ThC5. [Google Scholar]
- Zhao, S.; Cui, J.; Suo, L.; Wu, Z.; Zhou, D.P.; Tan, J. Performance investigation of OFDR sensing system with a wide strain measurement range. J. Light. Technol. 2019, 37, 3721–3727. [Google Scholar] [CrossRef]


| Mean | Standard Deviation | ||||||||||
|---|---|---|---|---|---|---|---|---|---|---|---|
| Sensor Location | Fiber Location | 0 kg | 1 kg | 2 kg | 3 kg | 4 kg | 0 kg | 1 kg | 2 kg | 3 kg | 4 kg |
| 0 | EF | 3.28 | 43.95 | 71.85 | 93.09 | 110.08 | 0.57 | 0.44 | 0.3 | 0.01 | - |
| SF | 3.6 | 263.86 | 465.46 | 651.94 | 821.23 | 0.68 | 1.16 | 5.1 | 5.32 | - | |
| SG | 3.308 | 216.89 | 399.74 | 567.61 | 721.08 | 0.23 | 0.51 | 0.54 | 0.17 | - | |
| EF/SF | - | 0.166 | 0.154 | 0.142 | 0.134 | - | - | - | - | - | |
| 1 | EF | 1.97 | 34.89 | 62 | 82.33 | 101.39 | 0.46 | 0.43 | 0.55 | 0.66 | - |
| SF | 5.45 | 275.45 | 509.68 | 720.44 | 910.08 | 0.41 | 0.48 | 1.1 | 8.22 | - | |
| SG | 5.421 | 262.6 | 458.36 | 638.1 | 801.91 | 0.35 | 0.42 | 0.63 | 0.49 | - | |
| EF/SF | - | 0.12 | 0.12 | 0.11 | 0.11 | - | - | - | - | - | |
| 2 | EF | 2.494 | 29.833 | 54.25 | 75.69 | 96.81 | 0.36 | 0.015 | 0.14 | 0.24 | - |
| SF | −2.21 | 226.81 | 427.84 | 616.69 | 790.22 | 0.4 | 1.65 | 4.42 | 17.31 | - | |
| SG | 5.83 | 254.05 | 461.45 | 650.79 | 820.28 | 0.31 | 0.46 | 0.3 | 0.56 | - | |
| EF/SF | - | 0.131 | 0.126 | 0.122 | 0.122 | - | - | - | - | - | |
| 3 | EF | 1.345 | 47.37 | 74.48 | 94.5 | 112.64 | 0.55 | 0.48 | 0.25 | 0.22 | - |
| SF | 3.53 | 256.21 | 454.5 | 633.15 | 797 | 0.54 | 1.19 | 3.07 | 7.14 | - | |
| SG | −2.96 | 214.27 | 381.5 | 536.46 | 683.87 | 0.376 | 1.02 | 0.99 | 2.42 | - | |
| EF/SF | - | 0.184 | 0.163 | 0.149 | 0.141 | - | - | - | - | - | |
Publisher’s Note: MDPI stays neutral with regard to jurisdictional claims in published maps and institutional affiliations. |
© 2022 by the authors. Licensee MDPI, Basel, Switzerland. This article is an open access article distributed under the terms and conditions of the Creative Commons Attribution (CC BY) license (https://creativecommons.org/licenses/by/4.0/).
Share and Cite
Biondi, A.; Wu, R.; Cao, L.; Gopalan, B.; Ivey, J.; Garces, C.; Mitchell, M.; Williams, J.D.; Wang, X. Fiber Optic Sensing Textile for Strain Monitoring in Composite Substrates. Sensors 2022, 22, 9262. https://doi.org/10.3390/s22239262
Biondi A, Wu R, Cao L, Gopalan B, Ivey J, Garces C, Mitchell M, Williams JD, Wang X. Fiber Optic Sensing Textile for Strain Monitoring in Composite Substrates. Sensors. 2022; 22(23):9262. https://doi.org/10.3390/s22239262
Chicago/Turabian StyleBiondi, Andres, Rui Wu, Lidan Cao, Balaji Gopalan, Jackson Ivey, Camila Garces, Michael Mitchell, John D. Williams, and Xingwei Wang. 2022. "Fiber Optic Sensing Textile for Strain Monitoring in Composite Substrates" Sensors 22, no. 23: 9262. https://doi.org/10.3390/s22239262