1. Introduction
Currently, operators in aviation towers perform control and real-time scheduling of tasks for velocity and position sensing of air targets mainly through dynamic channel interfaces [
1], which have an important role in air traffic, aerospace engineering, aviation military, and other fields [
2,
3,
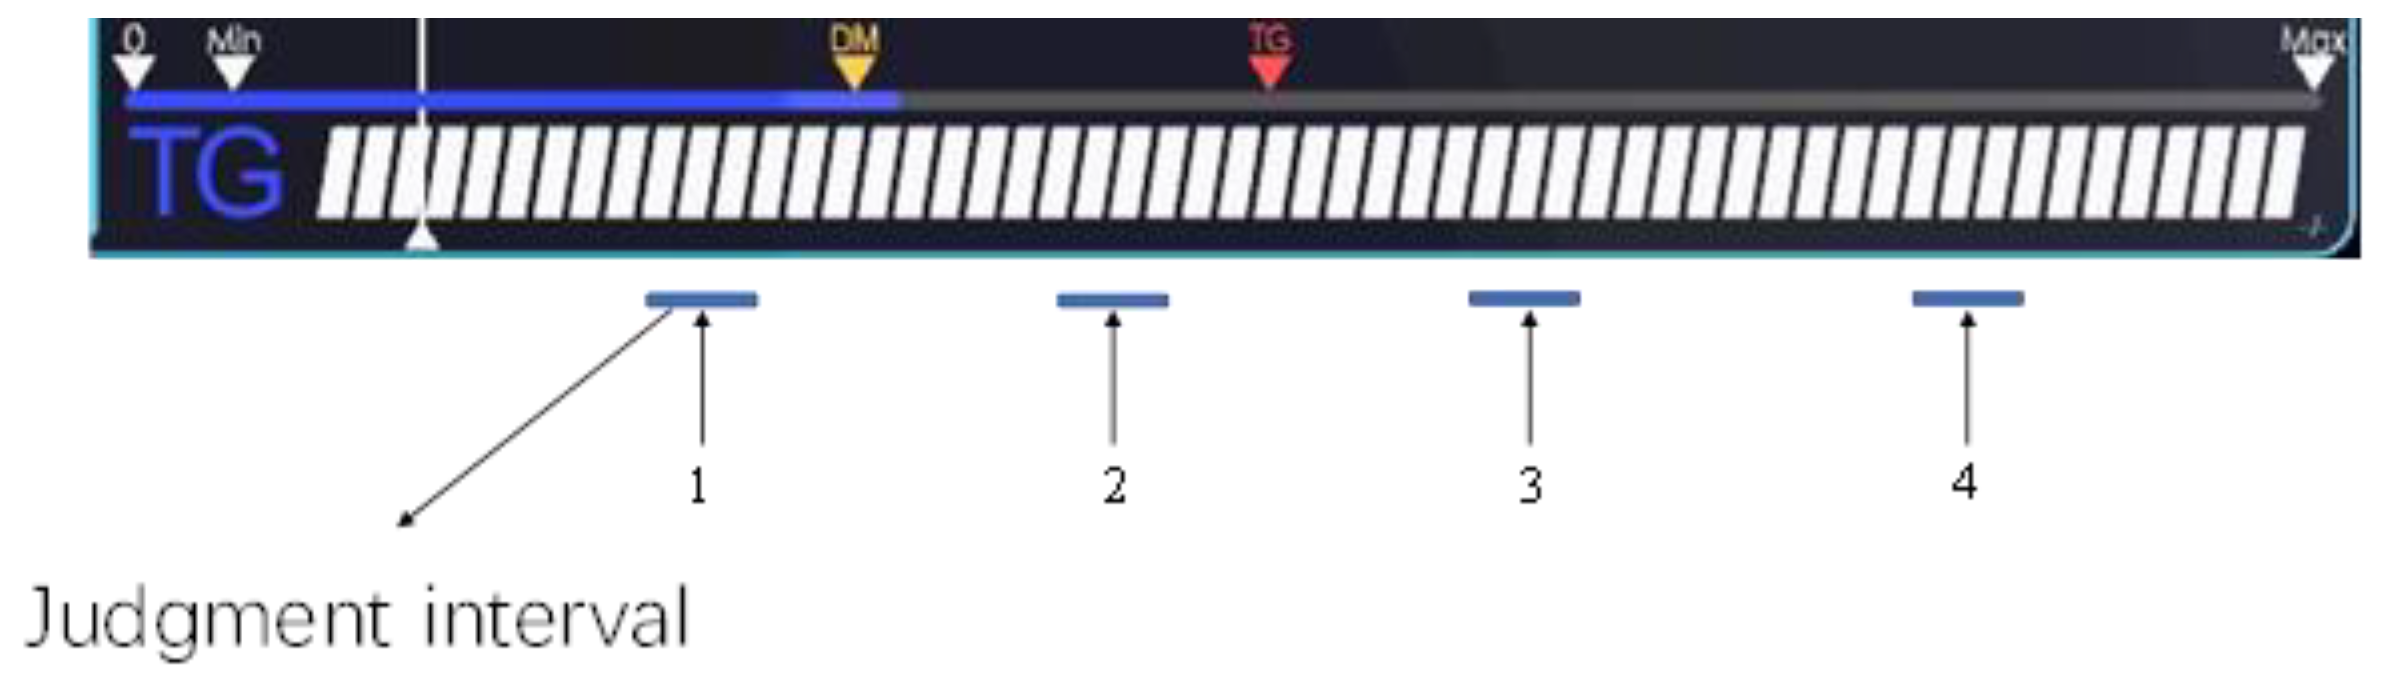
4]. The existing dynamic channel control interface consists mainly of a linear motion approach display with graduated line segments, target object cursors, decision point cursors, and related information. The relative motion of the target position point and the decision point is used to show the relative position relationship between the target and the decision point, and when the position cursor representing the target coincides with the decision point, the operator can start the decision. As an important human–computer interaction interface to characterize the target motion condition, the dynamic channel interface has dynamic and intuitive characteristics [
5]. It brings very good interaction effects to trajectory determination, target tracking, multi-target motion perception [
6,
7,
8], and other types of tasks, as well as improving task effectiveness. Additionally, due to the complexity of the real situation and the diversity of system elements [
9], it is usually difficult for a single dynamic channel to describe the overall motion, and multiple parallel channels are needed for simultaneous sensing and decision-making [
10]. Therefore, there are two types of dynamic process tasks, a multi-process simultaneous sensing task [
11] and a single-process dynamic accurate tracking task [
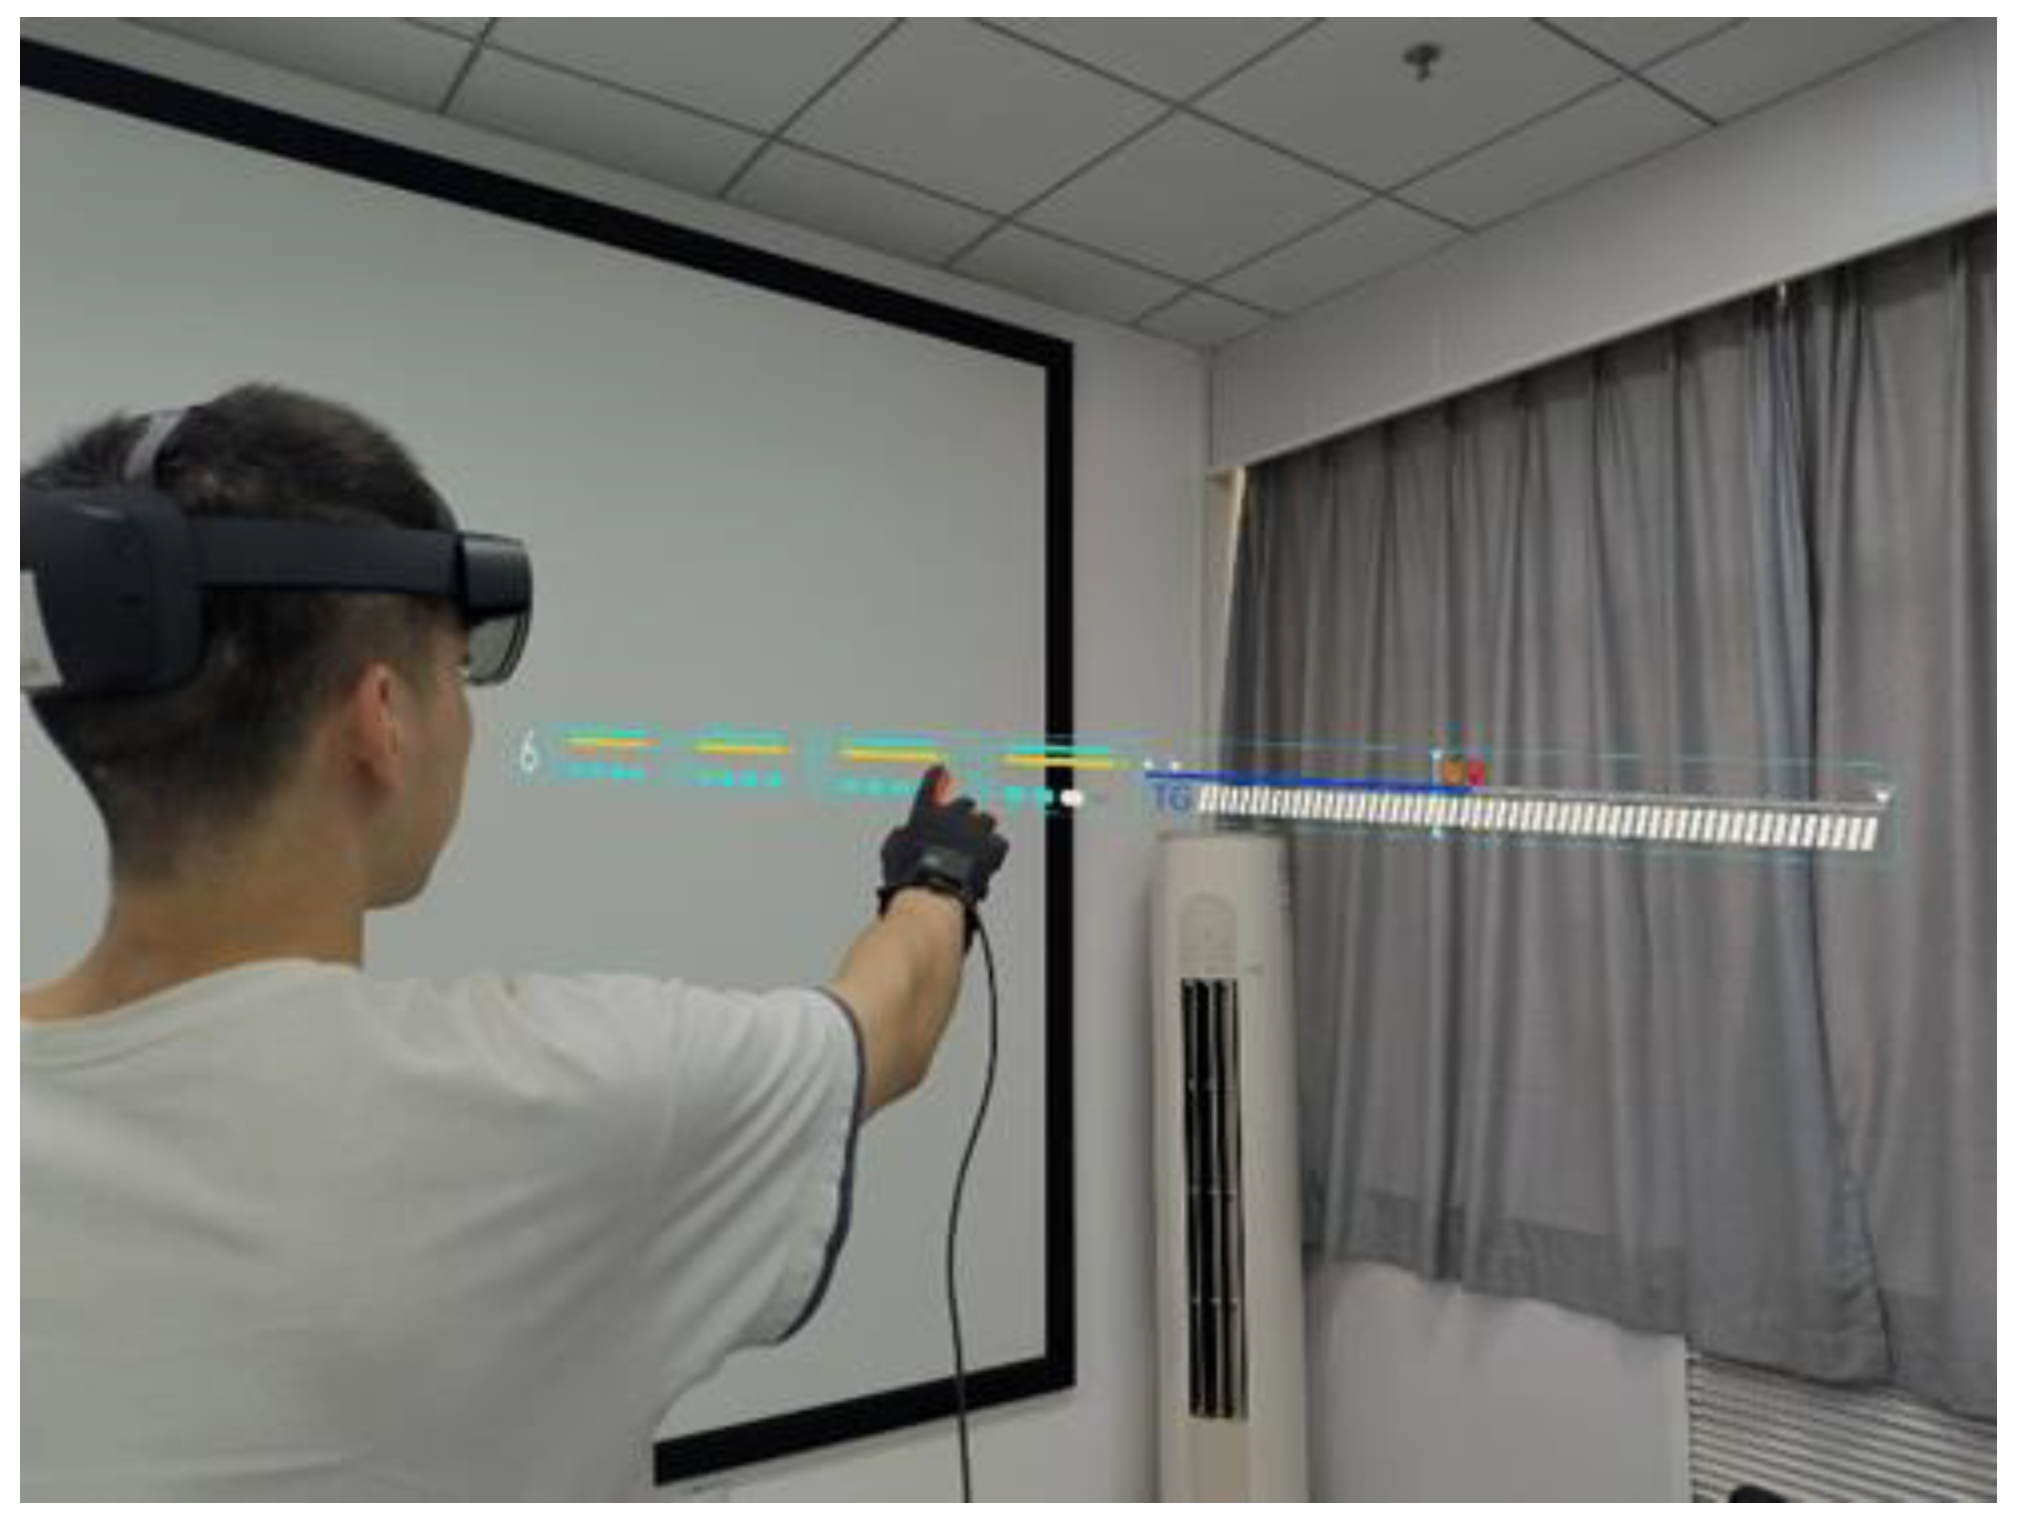
12]. This corresponds to two scenarios of multi-target and single-target tasks. In recent years, holographic tower control based on virtual reality and mixed reality devices is entering the daily work of aviation practitioners, and its advantages of easy interaction, large amount of information and full immersion show a good future development trend. As the elements in the mixed reality field of view become more and more, the dimensionality of information is increasing, the pressure of human visual cognition is increasing, and its perception of motion and tracking of the position will become less effective. Multimodal-assisted human–computer interaction is a method of adding other sensory feedback methods to assist visual interaction. It can improve the overall interaction effect and efficiency without adding the burden of visual fatigue [
13]. Studies have shown that tactile has a good cueing and warning effect for situations such as navigation and perceived object movement [
14,
15,
16]. Therefore, the use of tactile assistance to cue visual perception of motion is effective. In this paper, tactile feedback is incorporated in a mixed reality environment to assist the operator in multi-target decision making and accurate tracking. The tactile intensity and different types of tactile schemes are combined with the perception of velocity and position to assist the motion characteristics of targets in MR 3D environments.
The intensity of the sense of touch has an important effect on the human perception of target motion. Andrew A. Stanley [
17] showed that tactile cues can guide users through different intensity tactile vibration cues from wearable tactile devices to guide velocity-based motion processes, such as position localization and trajectory tracking. Experiments by I. Hachen [
18] found that applying different vibration stimuli to a person’s fingertips caused a bias in the judgment of average velocity, and the value of the bias increased between experimental groups as the duration of the experiment increased. Chris J. Dallmann [
19] determined tactile -based velocity changes by hypothesizing a combination of vibration induced motion and other tactile vibrations. The discrimination of vibration induced and tactile vibration velocities was derived from sensor measurements. Alison I. Weber [
20] simulated a human touching an object by using a stimulator to scan the human finger for stimulation, and when the scanning speed changed, the tactile sensation then changed, and the human perceived speed changed as well with its effect on neurons, which also concerned temporal and spatial coding. Motoki Tachiiri [
21] investigated the boundary model of velocity change based on velocity and acceleration due to haptics and the effect of human psychological response to that velocity perception, and the results showed that haptics can lead to bias in human perception of velocity.
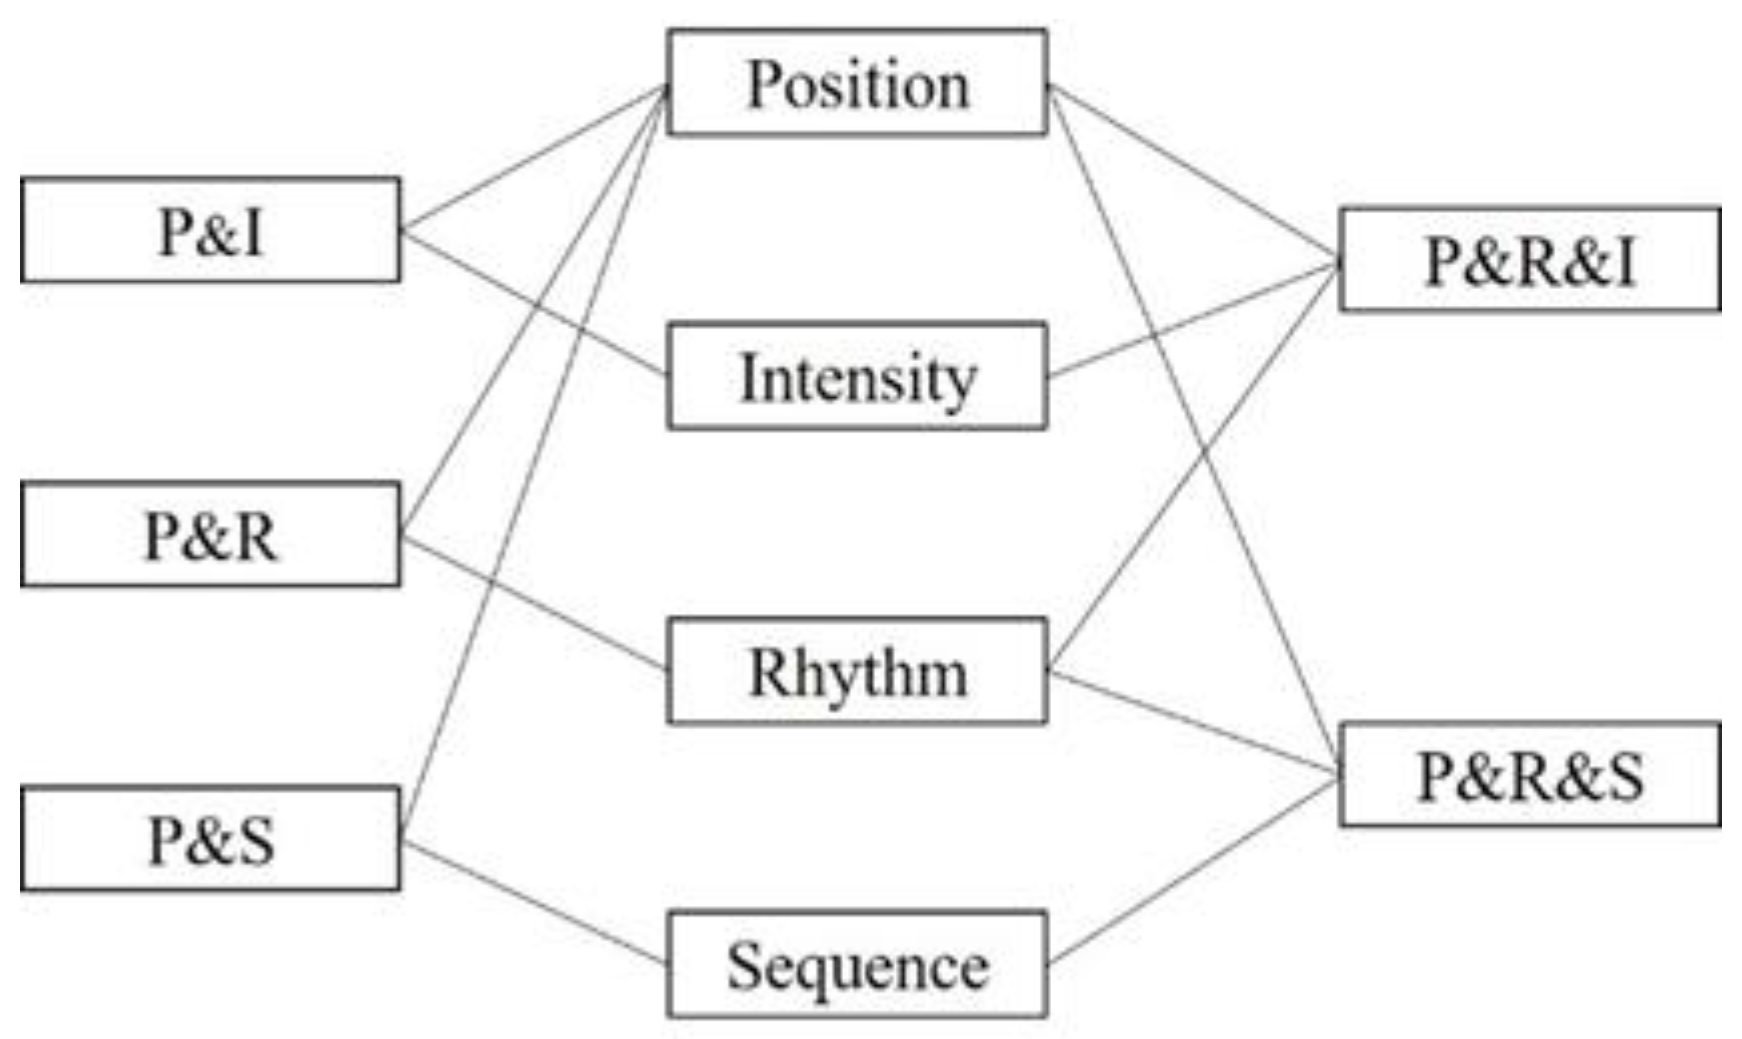
The variation of the tactile vibration modality is an important characteristic to distinguish the different tactile instructions. The variation of its mode depends on three elements: vibration position, vibration rhythm, and vibration sequence. They also constitute the vibration scheme of PRS (position, rhythm, vibration) [
22]. They also have important applications in motion, process scheduling, and decision-making judgments [
23]. The PRS indication scheme for tactile cues is used as an effective auxiliary indication scheme for precise description and analysis of tactile. Alexandra List [
24] noted that changes in tactile location interfere with human visual judgments of target objects, but that overall tactile feedback based on tactile location significantly contributes to the perceptual efficiency of vision, which reflects the emergence of a visual-touch cross-modal relationship. In-Seon Lee [
25] showed that the brain’s response to tactile stimuli would enable a person to distinguish the location of tactile stimuli on the body surface, and quantified the coding of said areas. Based on this principle, he also investigated the efficiency of human use of touch to perceive spatial location, and obtained more optimistic conclusions. Verena N. Buchholz [
26] analyzed the response of the human brain to positional information in a spatial coordinate system after adding fingertip stimuli of different rhythms, concluding that the cognitive induction effect of the brain is enhanced by simultaneous visual-tactile stimulation and that the efficiency of human perception of spatial representations increases. Jakob Voigts [
27] concluded the important role of tactile rhythm in discriminating the position of objects by studying the different vibration rhythms caused by the tremulous movements of the mouse whiskers in contact with objects. Wenbo Huang [
28] adopted a PRS vibration scheme to identify the pilot’s flight attitude, and the vibration position, rhythm, and sequence played a key role in prompting flight crew information, which also significantly improved the interaction efficiency. The work of Assumpcao [
29] investigated the reference system behind tactile contextual memory, in which different sequences of vibrations have different effects on manual gesture control and learning, and in which human spatial attention was found to be associated with relevant tactile cues to enhance learning efficiency.
In summary, it is shown that among visual and tactile cross-modal interactions, there is a strong correlation between tactile intensity and target velocity, and tactile indication scheme and target location acquisition. It is also widely used in the fields of transportation, aerospace, medicine, and geographic navigation. However, there is still a gap in the research of tactile-assisted visual perception of target motion in MR environments, and it is doubtful whether the above mechanism in the real state can be well adapted and applied in MR environments. This leaves a gap in the need for efficient perception of target velocity, position, and other motion characteristics in the MR environment, and also imposes constraints on the spatial perception in the holographic state. Therefore, this paper designs experiments to investigate the mapping between tactile intensity and velocity, the PRS vibration indication scheme and precise position localization, and the experiments are designed to verify the effect.
3. Data Analysis and Results
3.1. Data Analysis of Multi-Target Indication
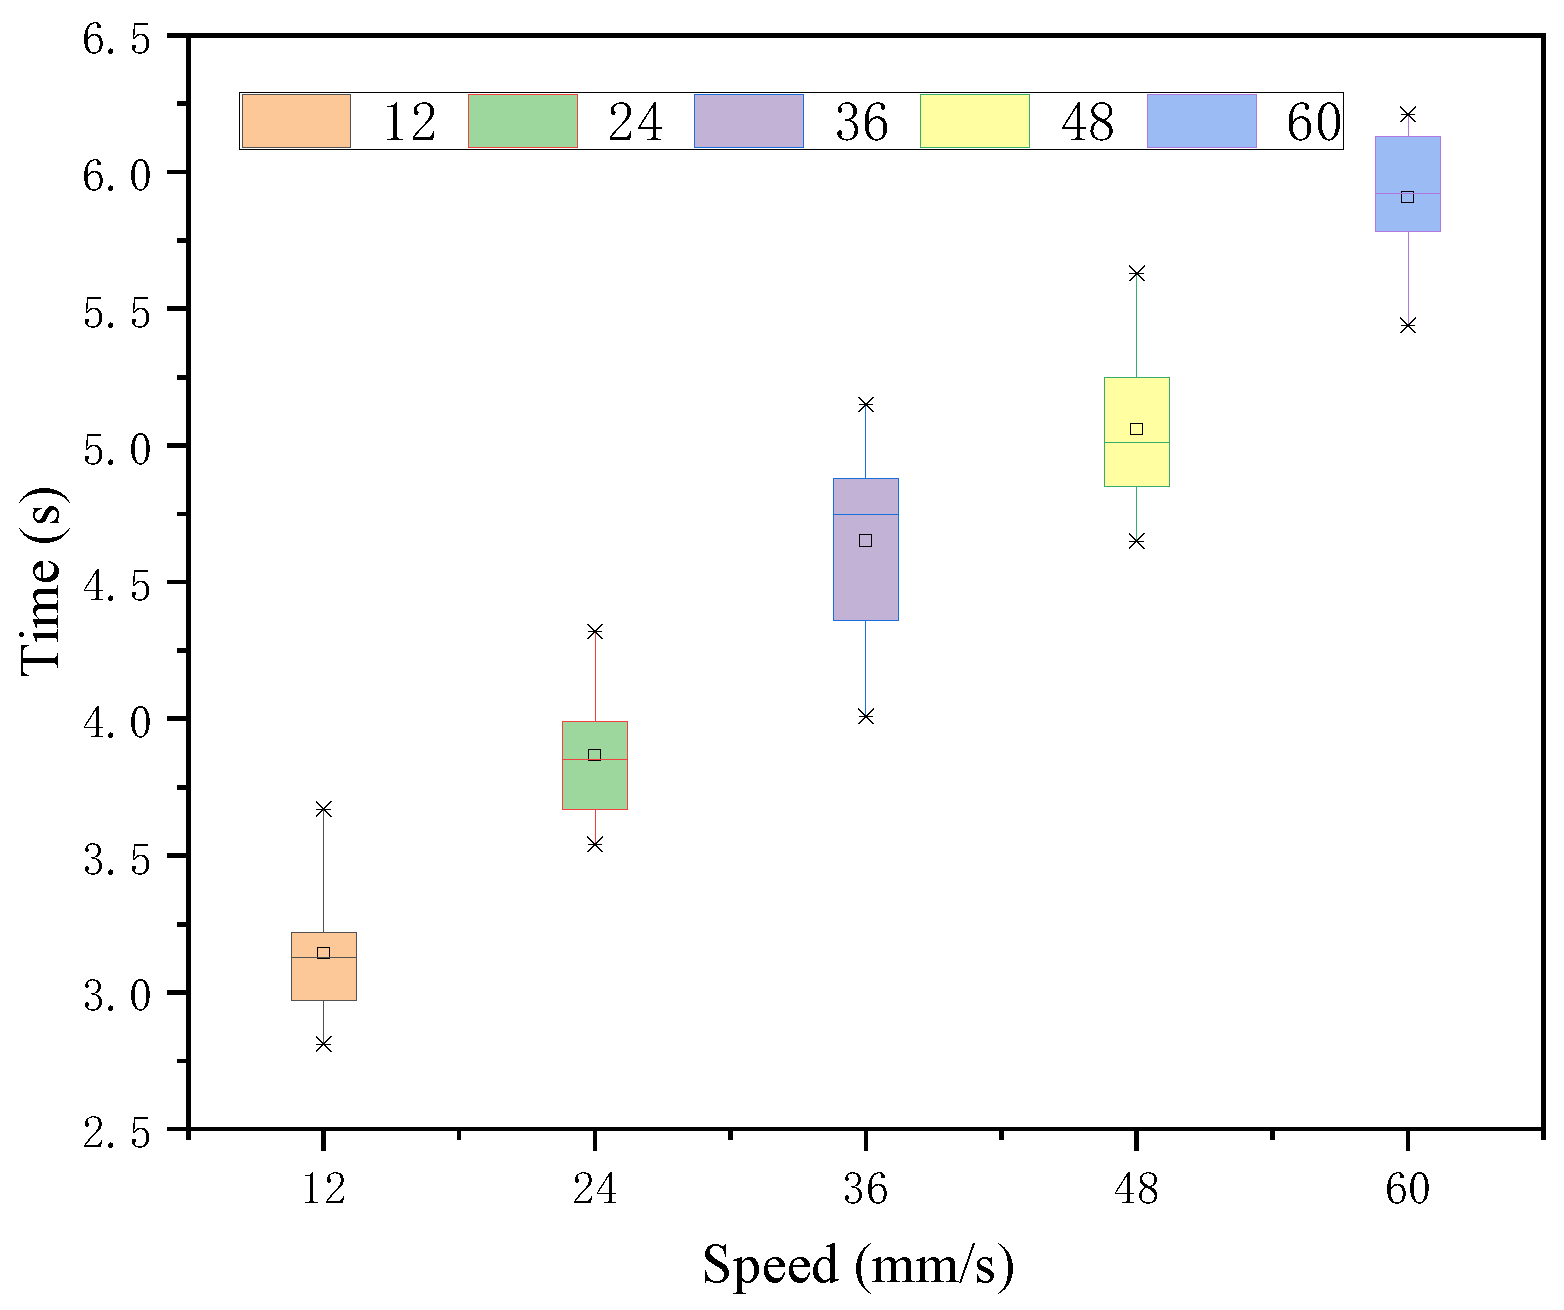
This section is divided into two parts, the correlation analysis of the tactile intensity-speed correspondence and the comparative analysis of whether this correspondence is applied to the degree of urgency judgment. The results are shown below. In the case of each speed judgment under the 32-intensity stimulus, using within-subject one-way ANOVA, it was shown that there were significant differences in the judgment effects of each speed target under this intensity stimulus, and the results are shown in
Table 4. As seen in the above
Figure 10, the 12 mm/s target took the shortest time and was judged the fastest. Additionally, the judgment time speed of all five-speed targets increased in an increasing trend. The variances of their time means were tested to be not significantly different.
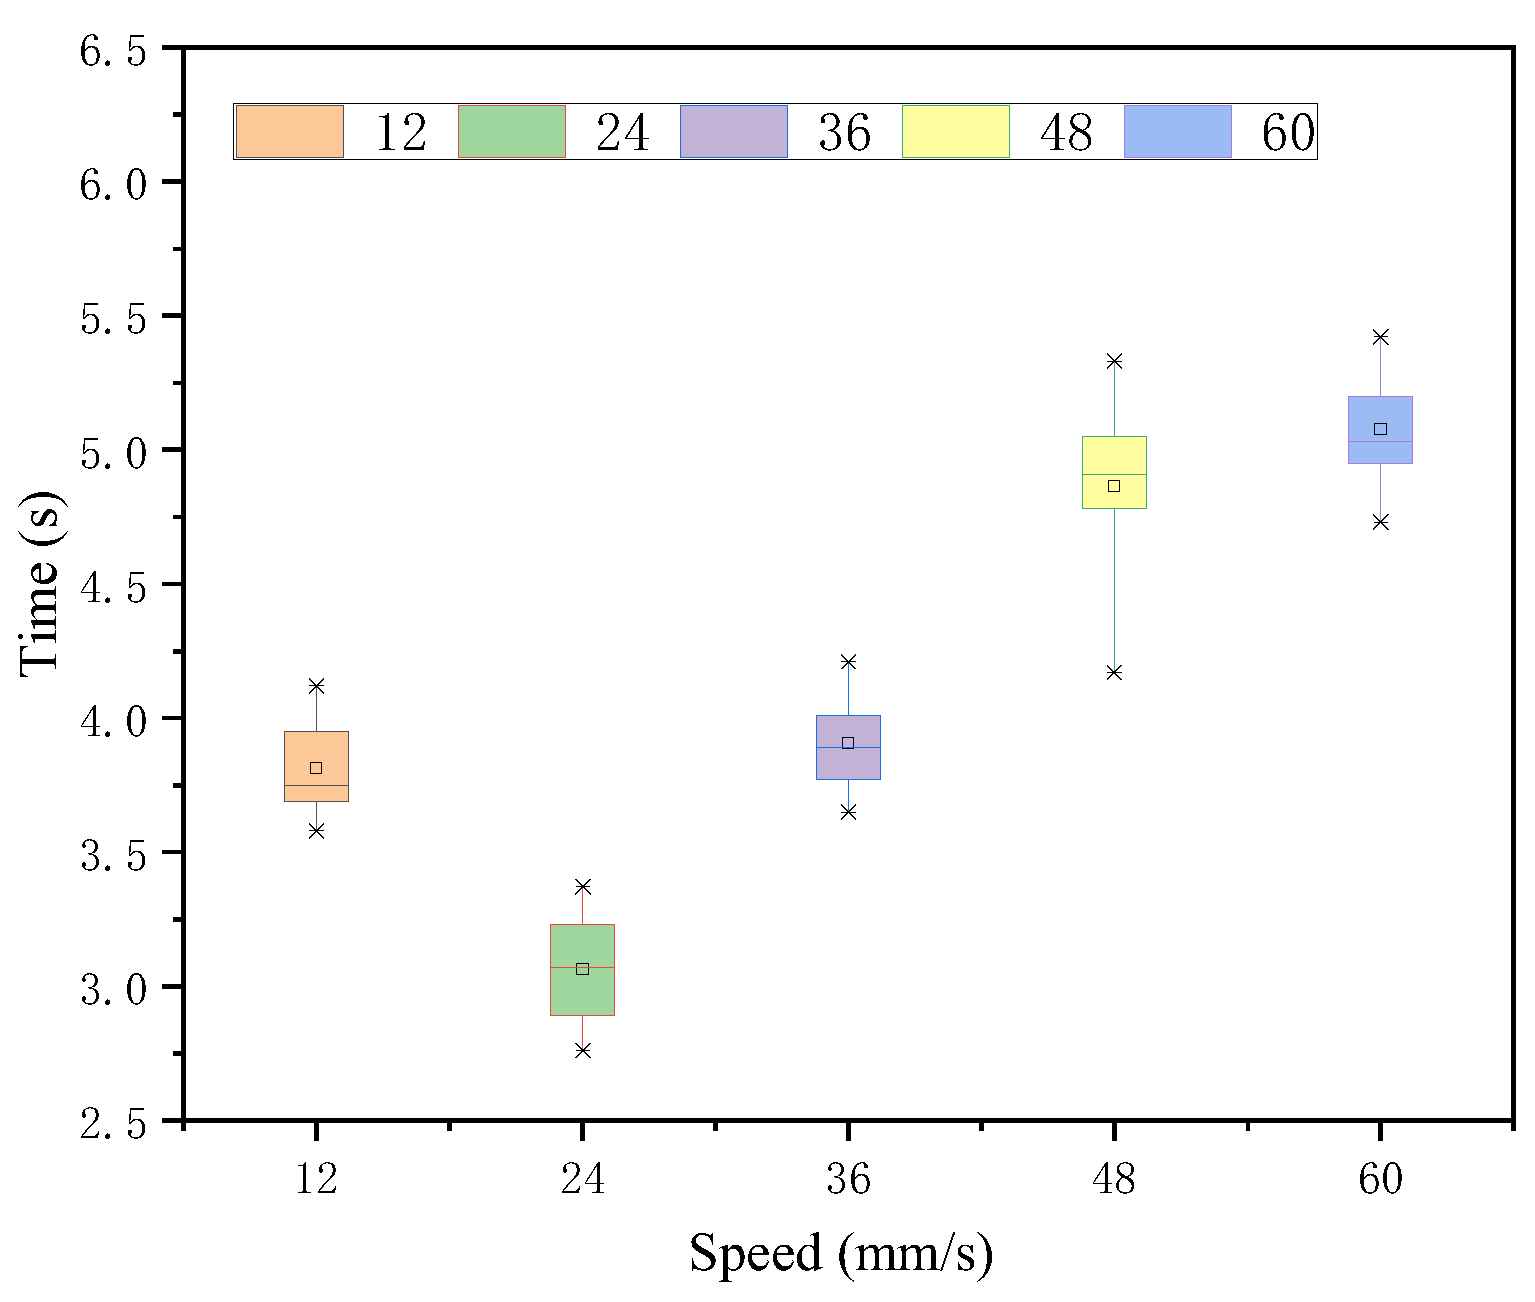
In the case of each speed judgment under the 87-intensity stimulus, the Greenhouse-Geisser method of analyzing the temporal averages illustrates that there is a significant difference in the judgment effect of each speed target under this intensity stimulus. As seen in
Figure 11 and
Table 5, 24 mm/s was judged to be the fastest. The time means of 12 mm/s and 36 mm/s, which had the smallest and equal difference with 24 mm/s, were slightly larger than the time of 24 mm/s and their time means were close to no significant difference, while the response times of 48 and 60, which had a larger difference, continued to increase linearly. The variance of their time means was tested to be not significantly different.
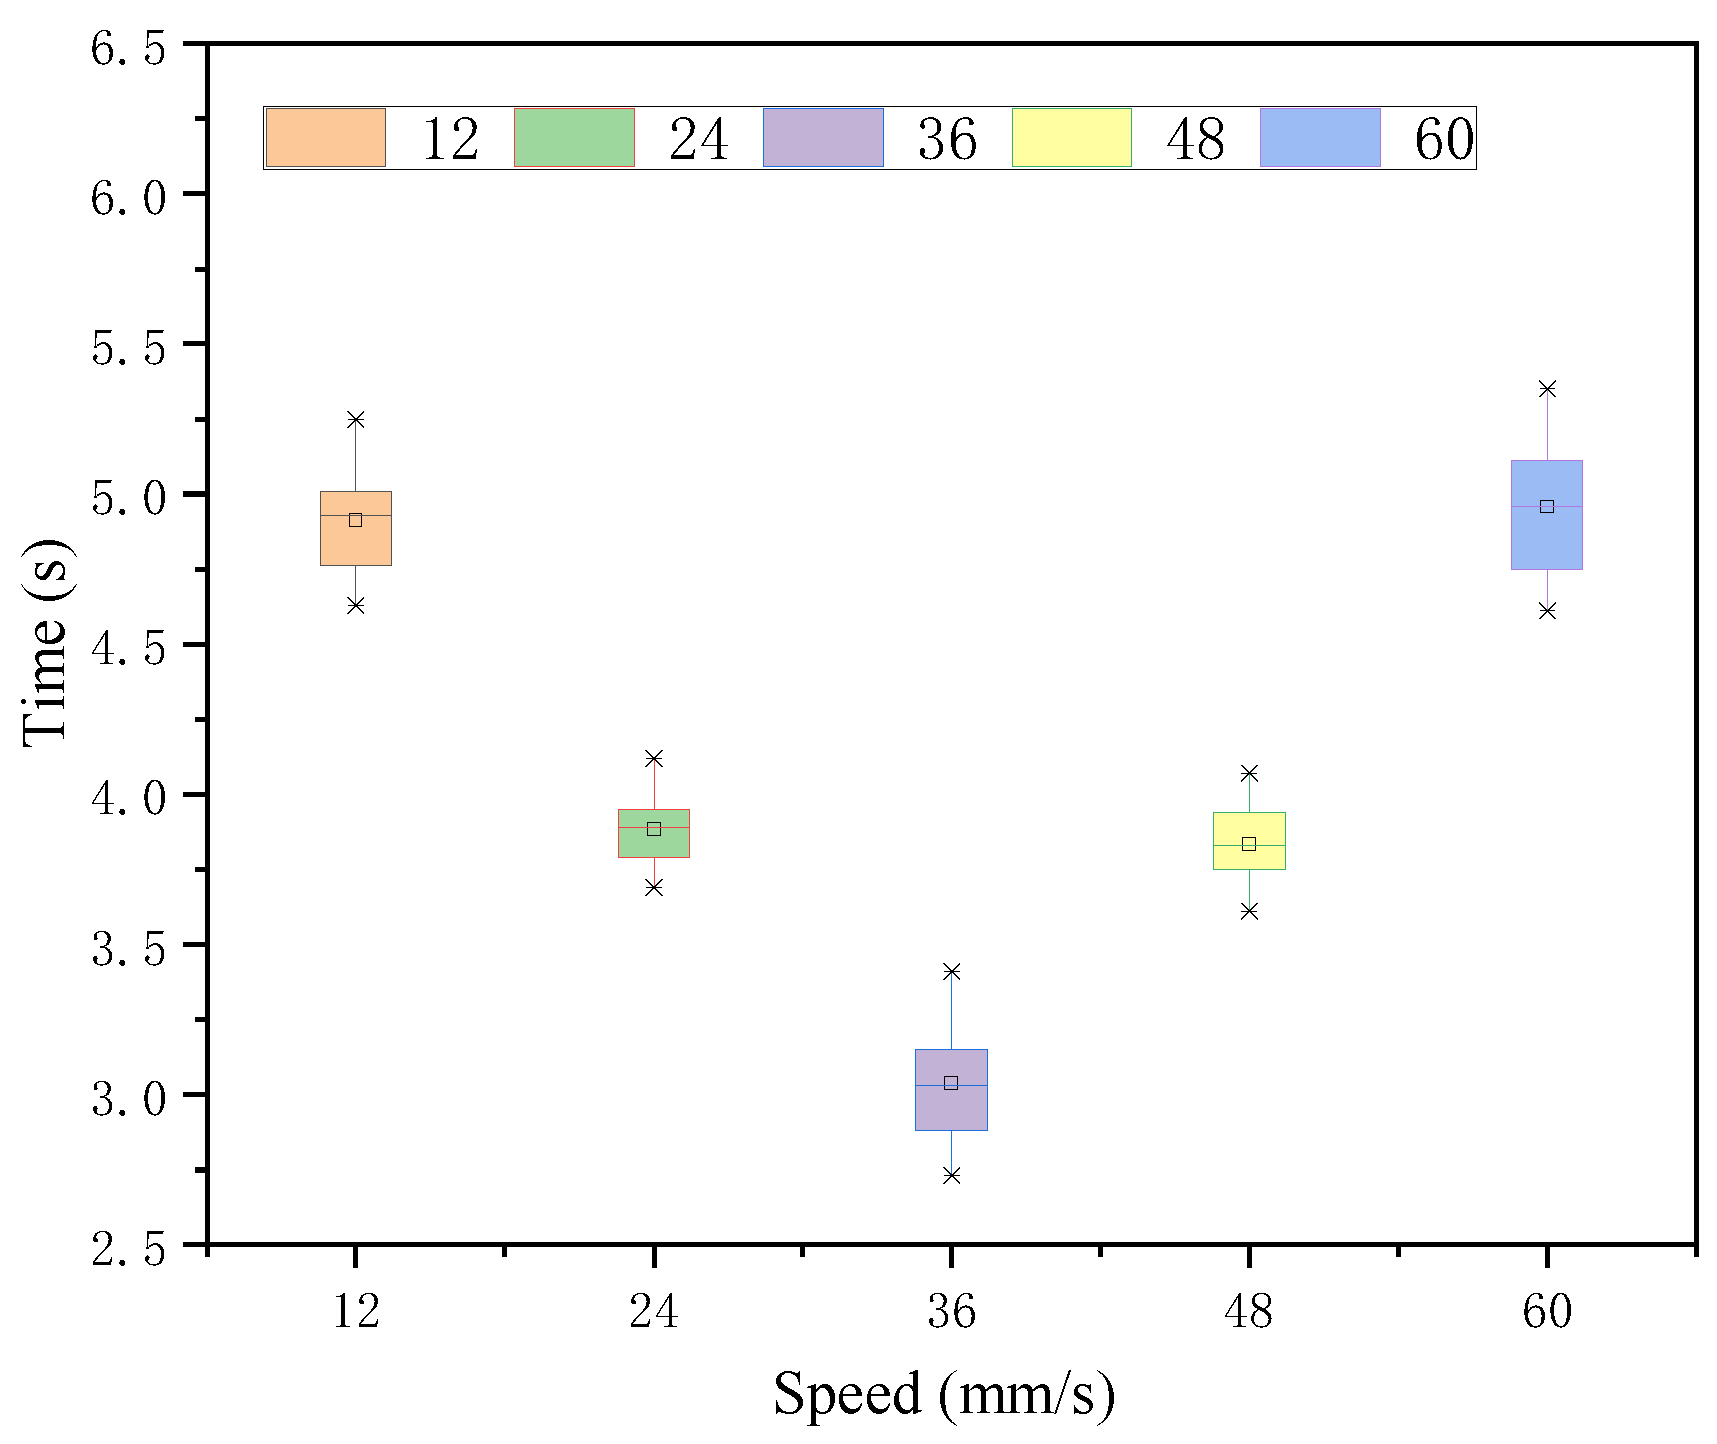
In the case of each velocity judgment under 142 intensity stimuli, the Greenhouse-Geisser method illustrates a significant difference in the judgment effect of each velocity target under this intensity stimulus. As seen in
Figure 12 and
Table 6, 36 mm/s was judged the fastest. The time means of 24 mm/s and 48 mm/s, which had the smallest and equal difference with 36 mm/s, were slightly larger than those of 24 mm/s and their time means were close to no significant difference, while the response time means of 48 mm/s and 60 mm/s, which had a larger difference, were larger, and both were similar and not significantly different. The variance of their time means was tested for no significant difference.
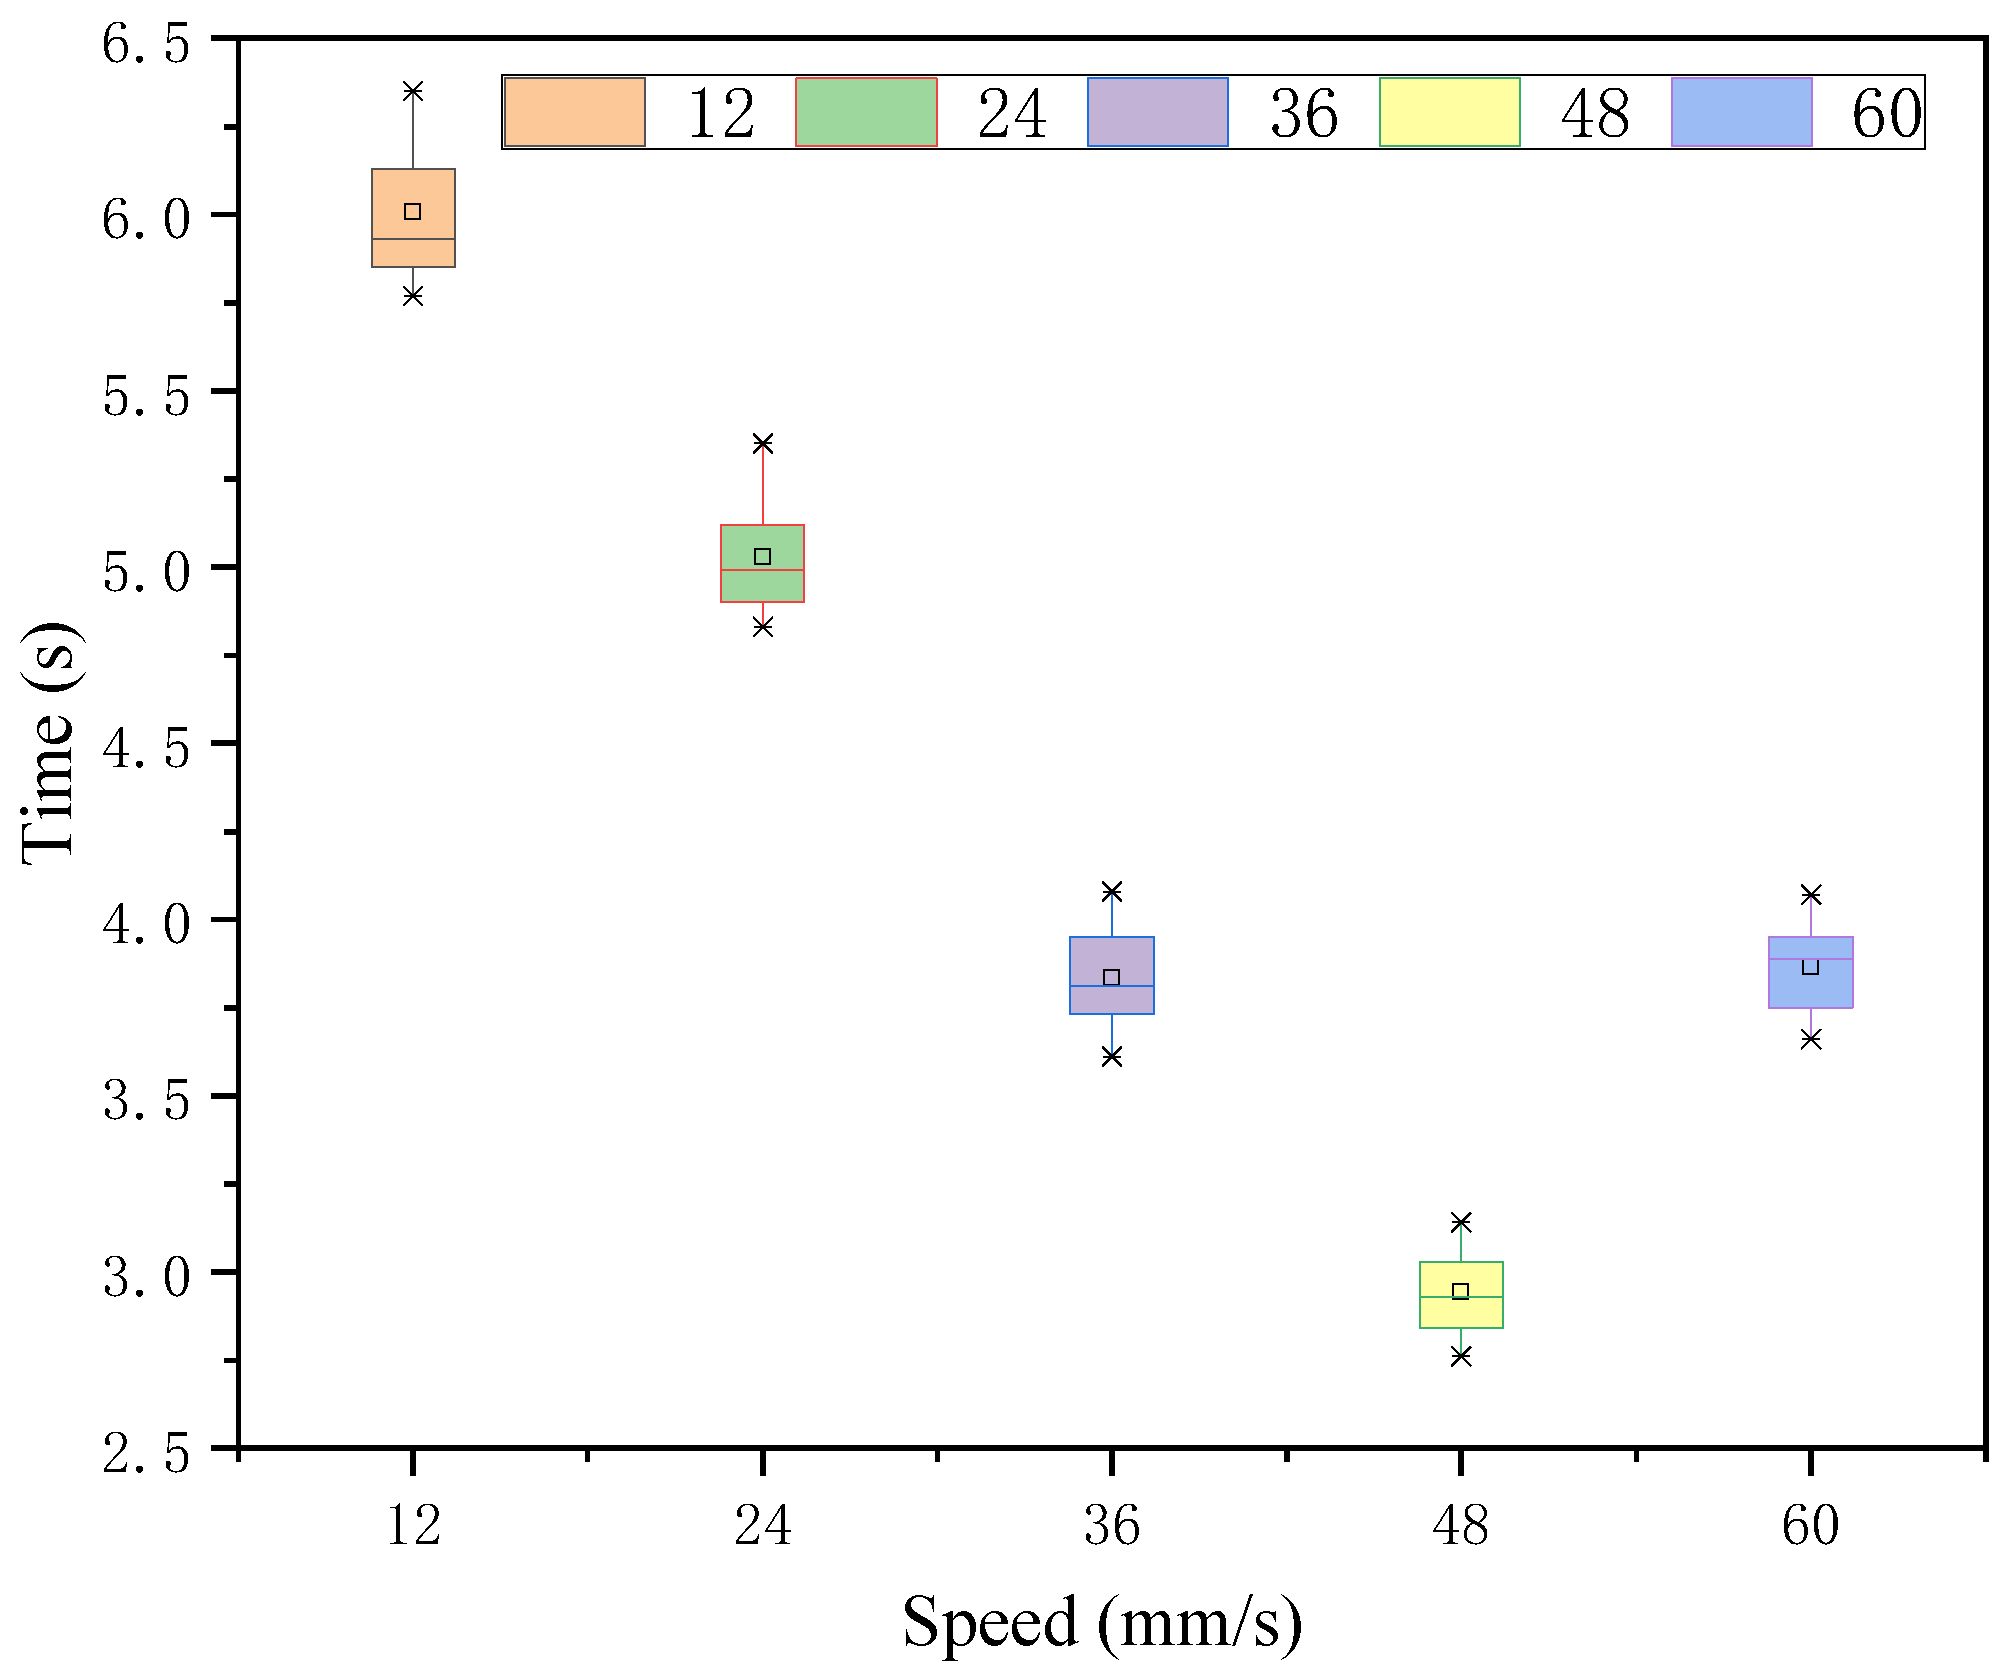
In the case of each speed judgment under 197 intensity stimuli, the Greenhouse-Geisser method of analyzing the time means illustrates that there is a significant difference in the effect of each speed target under this intensity stimulus. As seen in
Figure 13 and
Table 7, 48 mm/s was judged to be the fastest. The time means of 36 mm/s and 60 mm/s, which had the smallest and equal difference with 48 mm/s, were slightly larger than those of 48 mm/s and their time means were close to each other with no significant difference, while the response time means of 12 mm/s and 24 mm/s, which had a larger difference, were also similar and had no significant difference. The variance of their time means was tested for no significant difference.
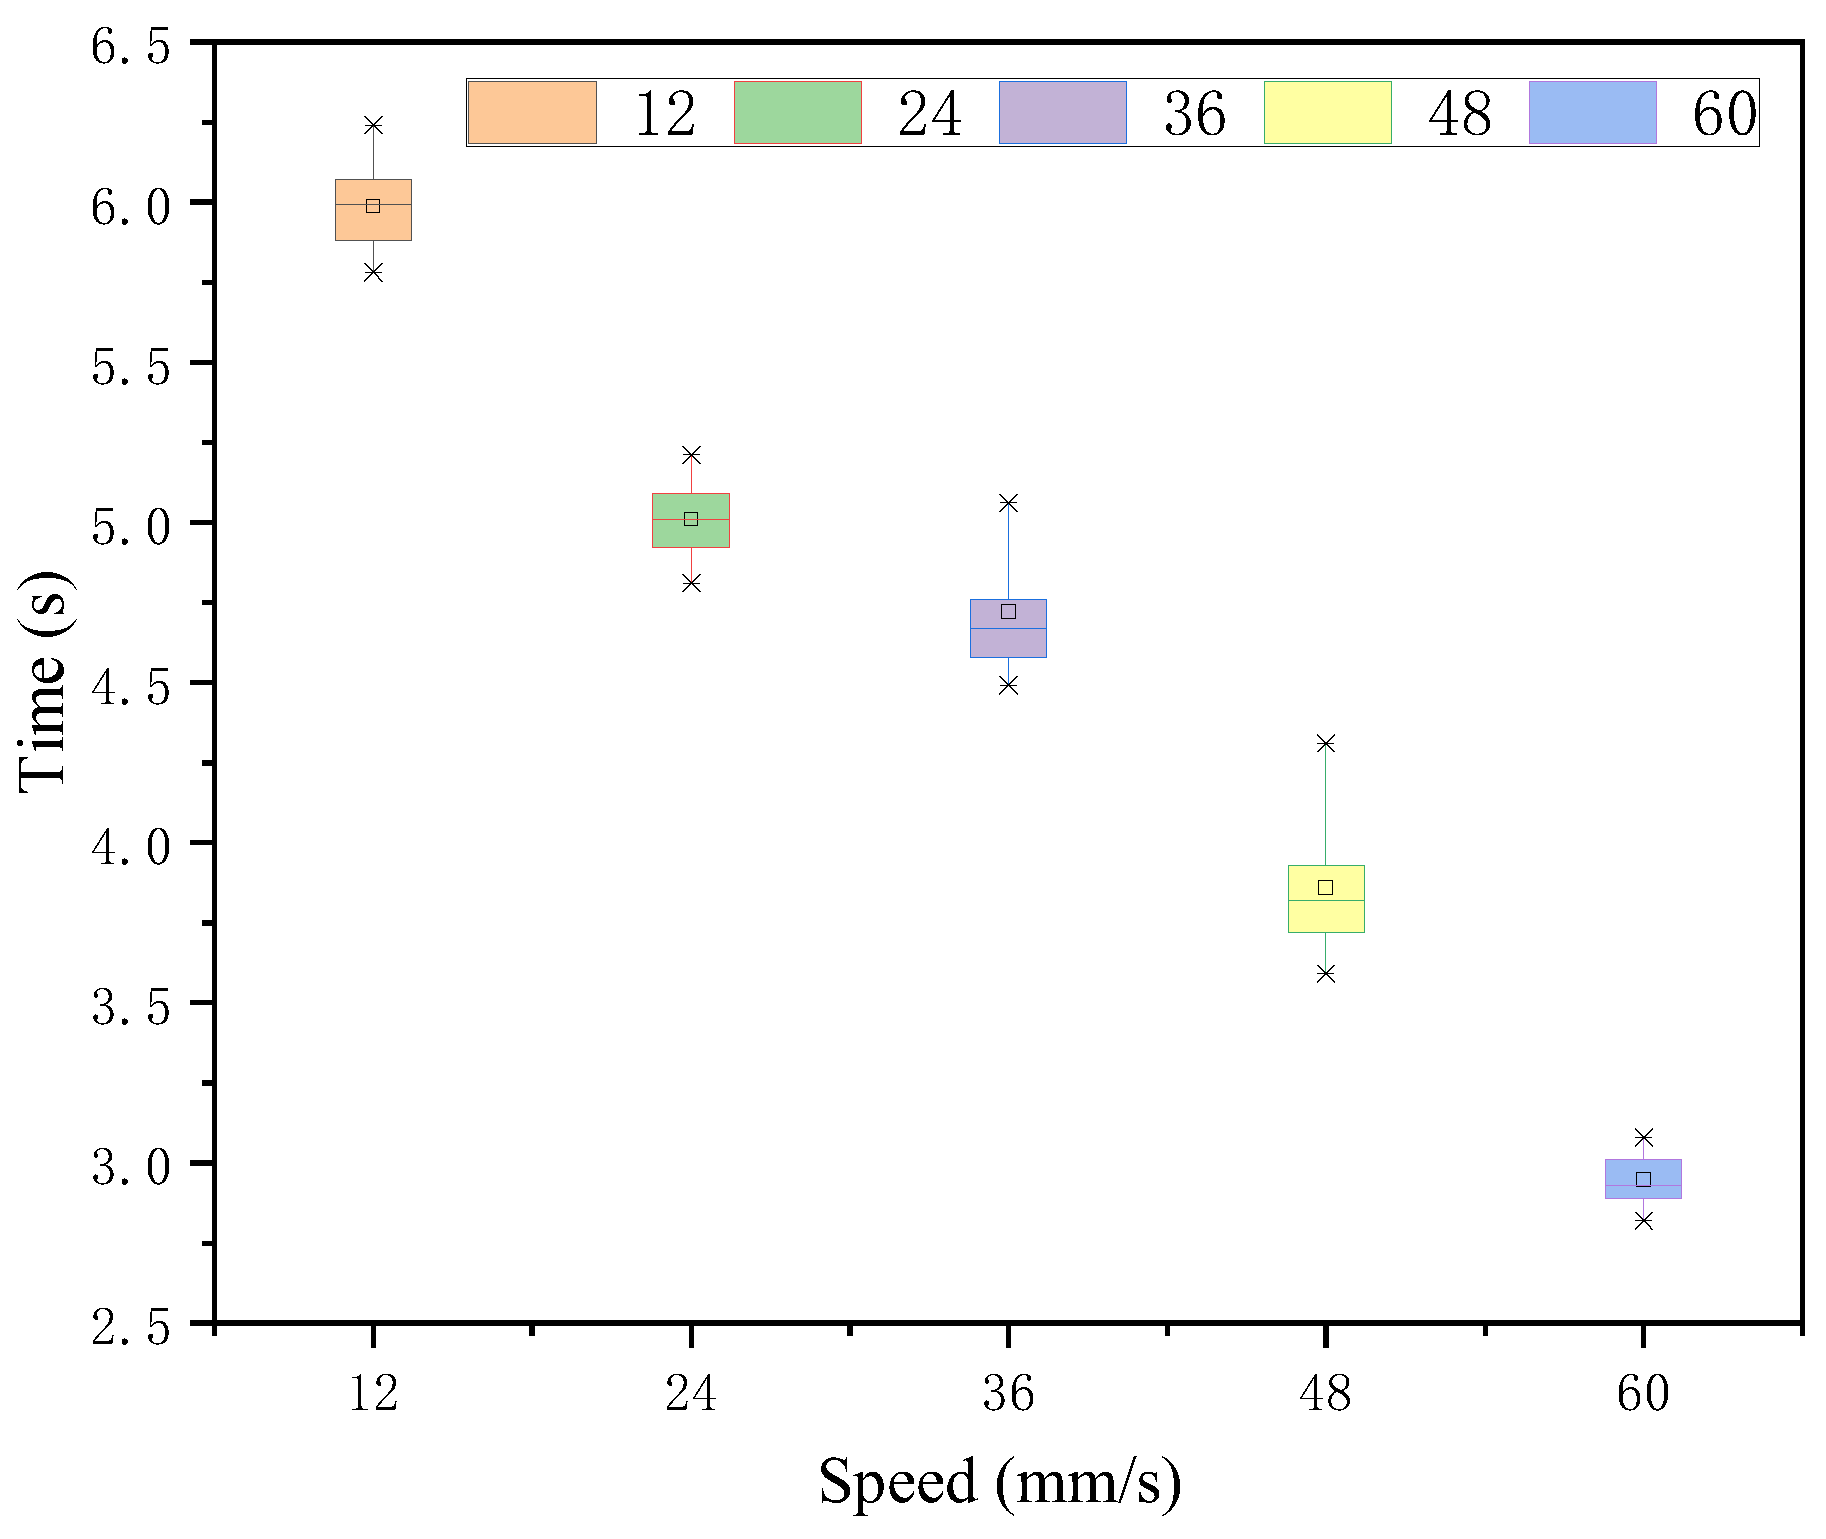
In the case of each speed judgment under 252 intensity stimuli, the Greenhouse-Geisser method of analyzing the time means illustrates that there is a significant difference in the effect of each speed target under this intensity stimulus. As seen in
Figure 14 and
Table 8, 60 mm/s was judged to be the fastest. The time means of 36 mm/s and 60 mm/s, which had the smallest and equal difference with 48 mm/s, were slightly larger than those of 48 mm/s and their time means were close to each other with no significant difference, while the response time means of 12 mm/s and 24 mm/s, which had a larger difference, were also similar and had no significant difference. The variance of their time means was tested for no significant difference.
In summary, the tactile intensity-assisted visual indication of motion speed works best when the degree of stimulus intensity is matched to the speed indication in the following
Table 9, and when the gap between target speed and tactile intensity and correspondence is larger, the indication is less effective, and subjects need to pay extra cognitive attention to correct the bias.
Additionally, the deviation of the target speed indication is larger for lower intensity (low, lower, medium) stimulus indication, and the error range of the matching indication is not significantly optimized, while the deviation of the target speed indication is smaller for higher intensity (higher, high) stimulus indication, and its optimization effect on the matching indication is more obvious, and the directionality of the indication is more clear and precise.
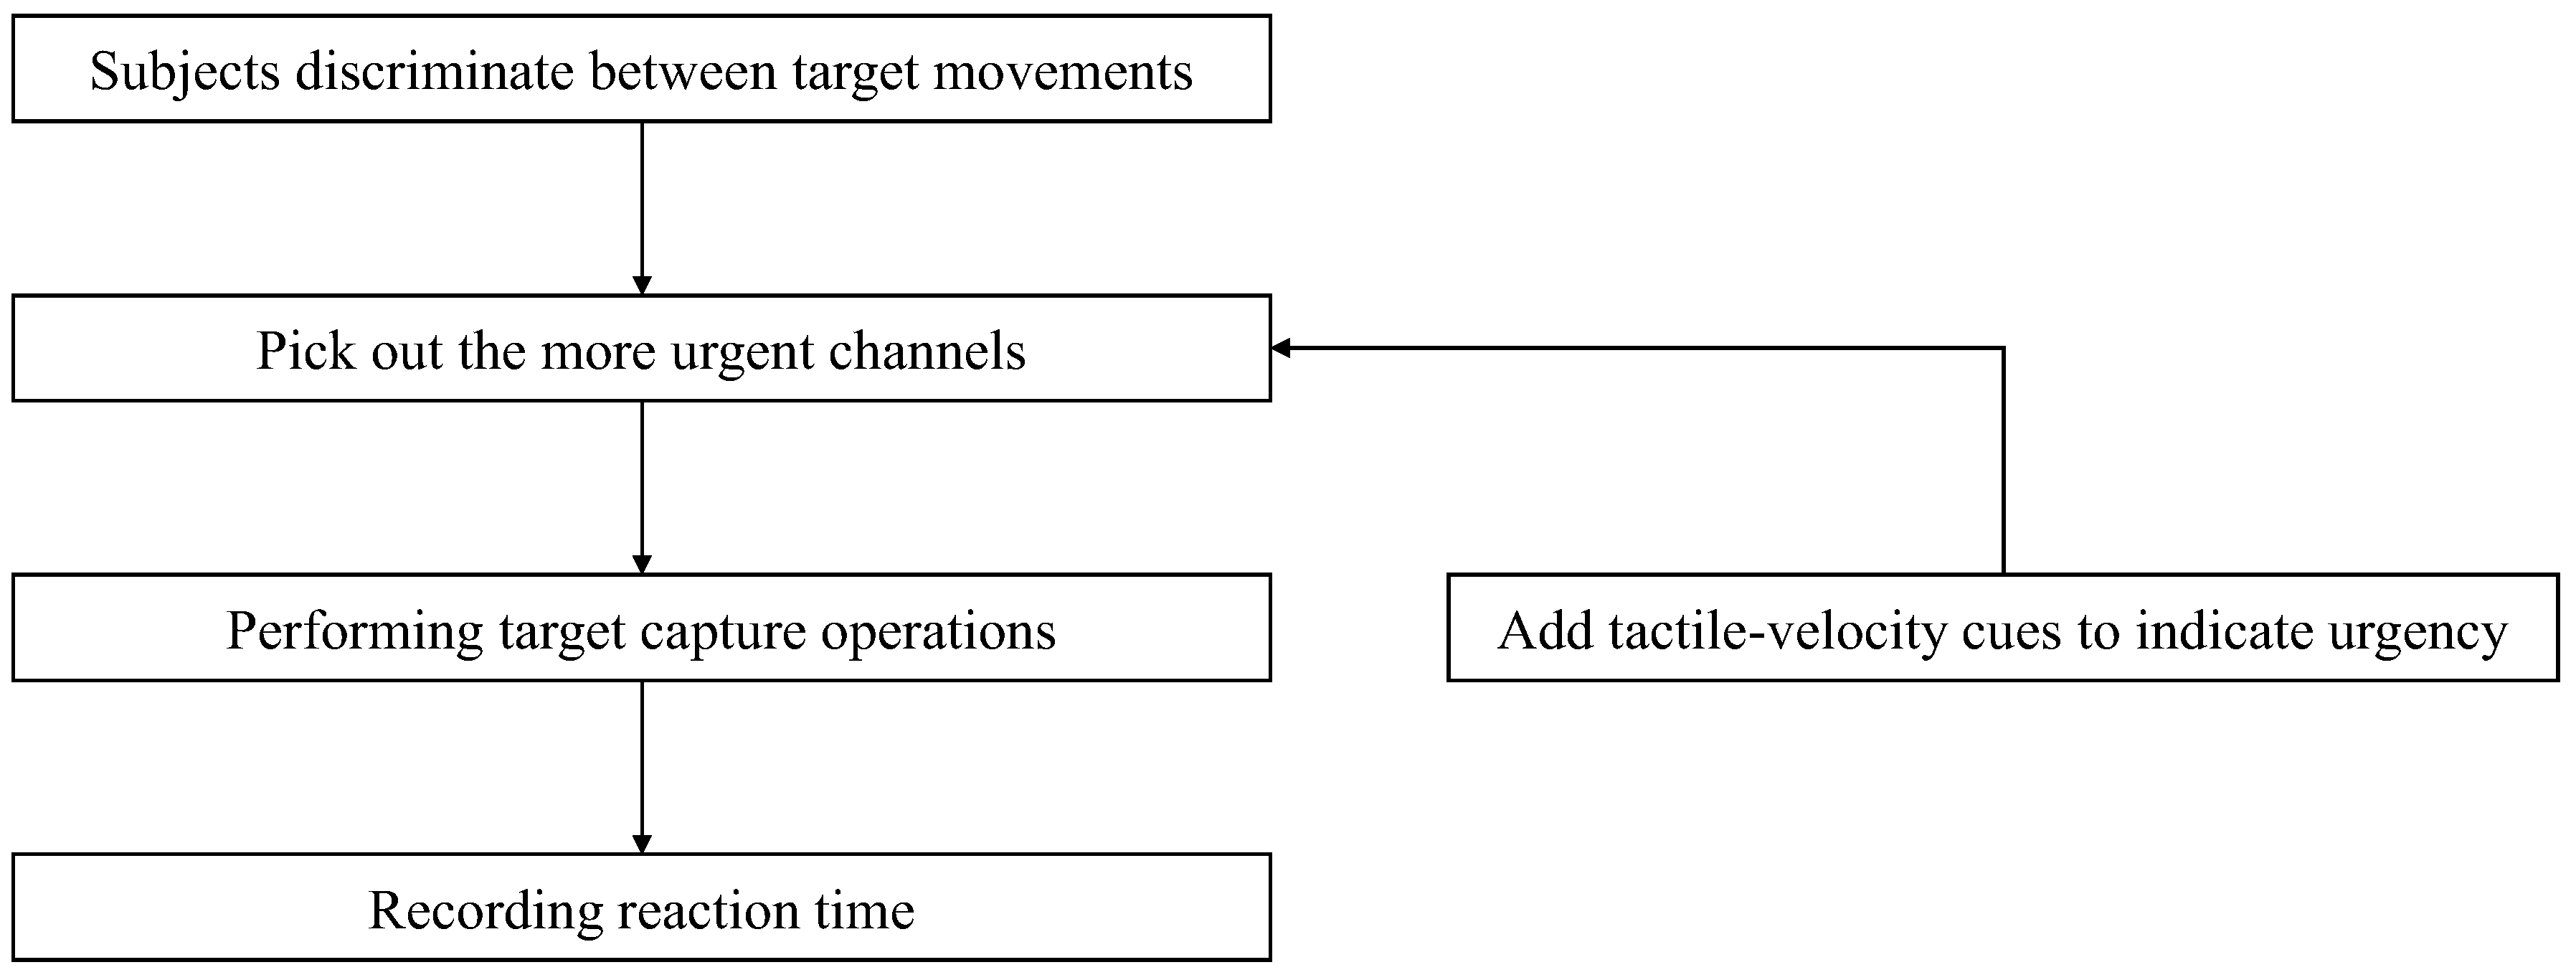
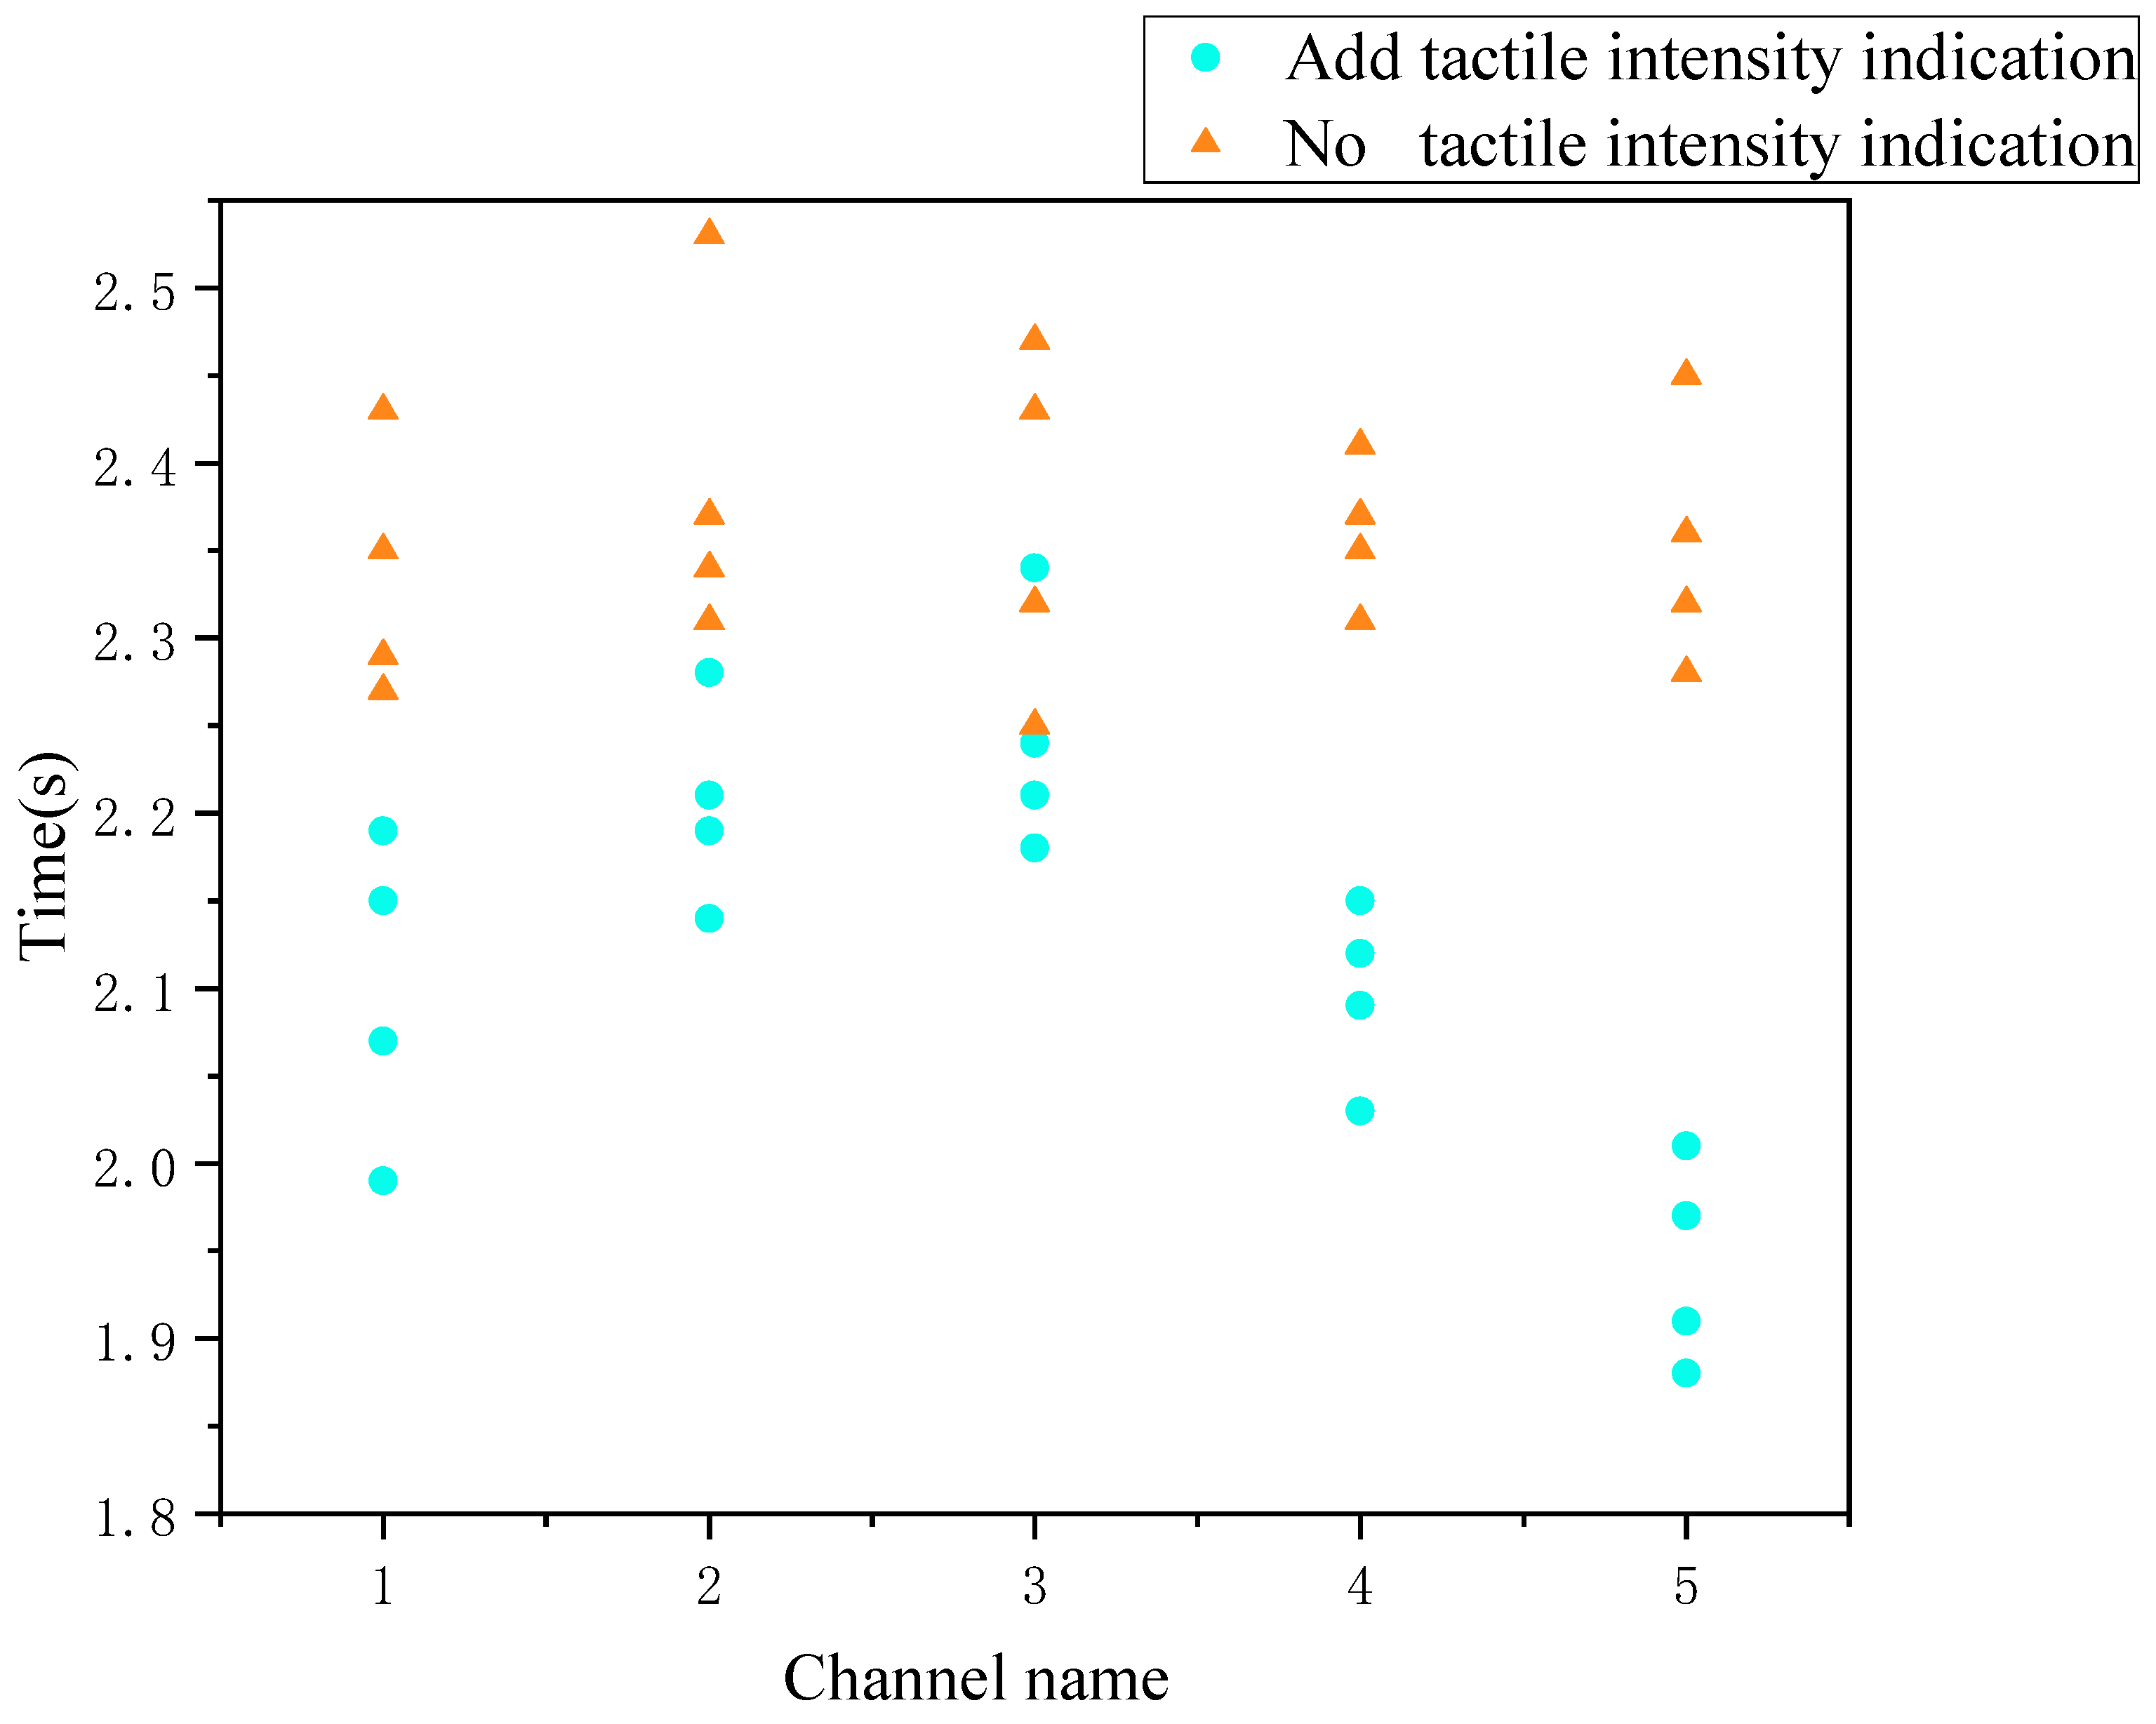
Whether to add tactile stimuli to judge the temporal distribution of urgency is such as
Figure 15.
As seen in the above figure, in general, adding tactile intensity instead of speed can significantly reduce the response decision time. An independent samples t-test for the two groups of data with and without instructions yielded that the response time of subjects who added tactile intensity cues (
M = 2.12,
SD = 0.12) was significantly lower than that of subjects who did not add intensity cues (
M = 2.36,
SD = 0.07),
t(38) = 7.62,
p = 0.00 < 0.05,
d = 2.41, the difference in time means was 11.48%. A one-way between subjects ANOVA was performed on the data from the two groups of different channels with and without the addition of tactile intensity cues:
p = 0.915 > 0.000 for the data group without the addition of tactile cues, indicating no significant difference. It can be seen that there is no difference in target discrimination between channels of different speeds with visual cues alone. While the data group with added tactile cues had a significant
p = 0.00 < 0.05 between groups, which shows that there is a significant difference when cueing the speed channel with different tactile intensities, and according to the within-group description of the group with added cues as shown in the following
Table 10.
As can be seen, channels 1 and 5, as the boundary values of the corresponding intensity cues, have a clearer effect on the subjects. Subjectively, the subjects were able to identify them better. The third channel is the middle value of the tactile vibration, and the subjects’ perception of it is somewhat ambiguous. This led to a less obvious optimization effect in this channel. The channel 5 and channel 1 time mean is 15.46%, 6.25% lower than channel 3 time with median intensity. Channels 2 and 4, as the transition channel between the boundary value and the intermediate value of the vibration intensity, also had a response efficiency between the two. The response rate of the subjects was faster when the tactile vibration intensity was higher (channels 4 and 5) than when the vibration intensity was lower (channels 1, 2, and 3). Overall, the addition of tactile intensity stimuli aided subjects well in the operation and perception of the urgency judgment task.
3.2. Data Analysis of Single Target Indication
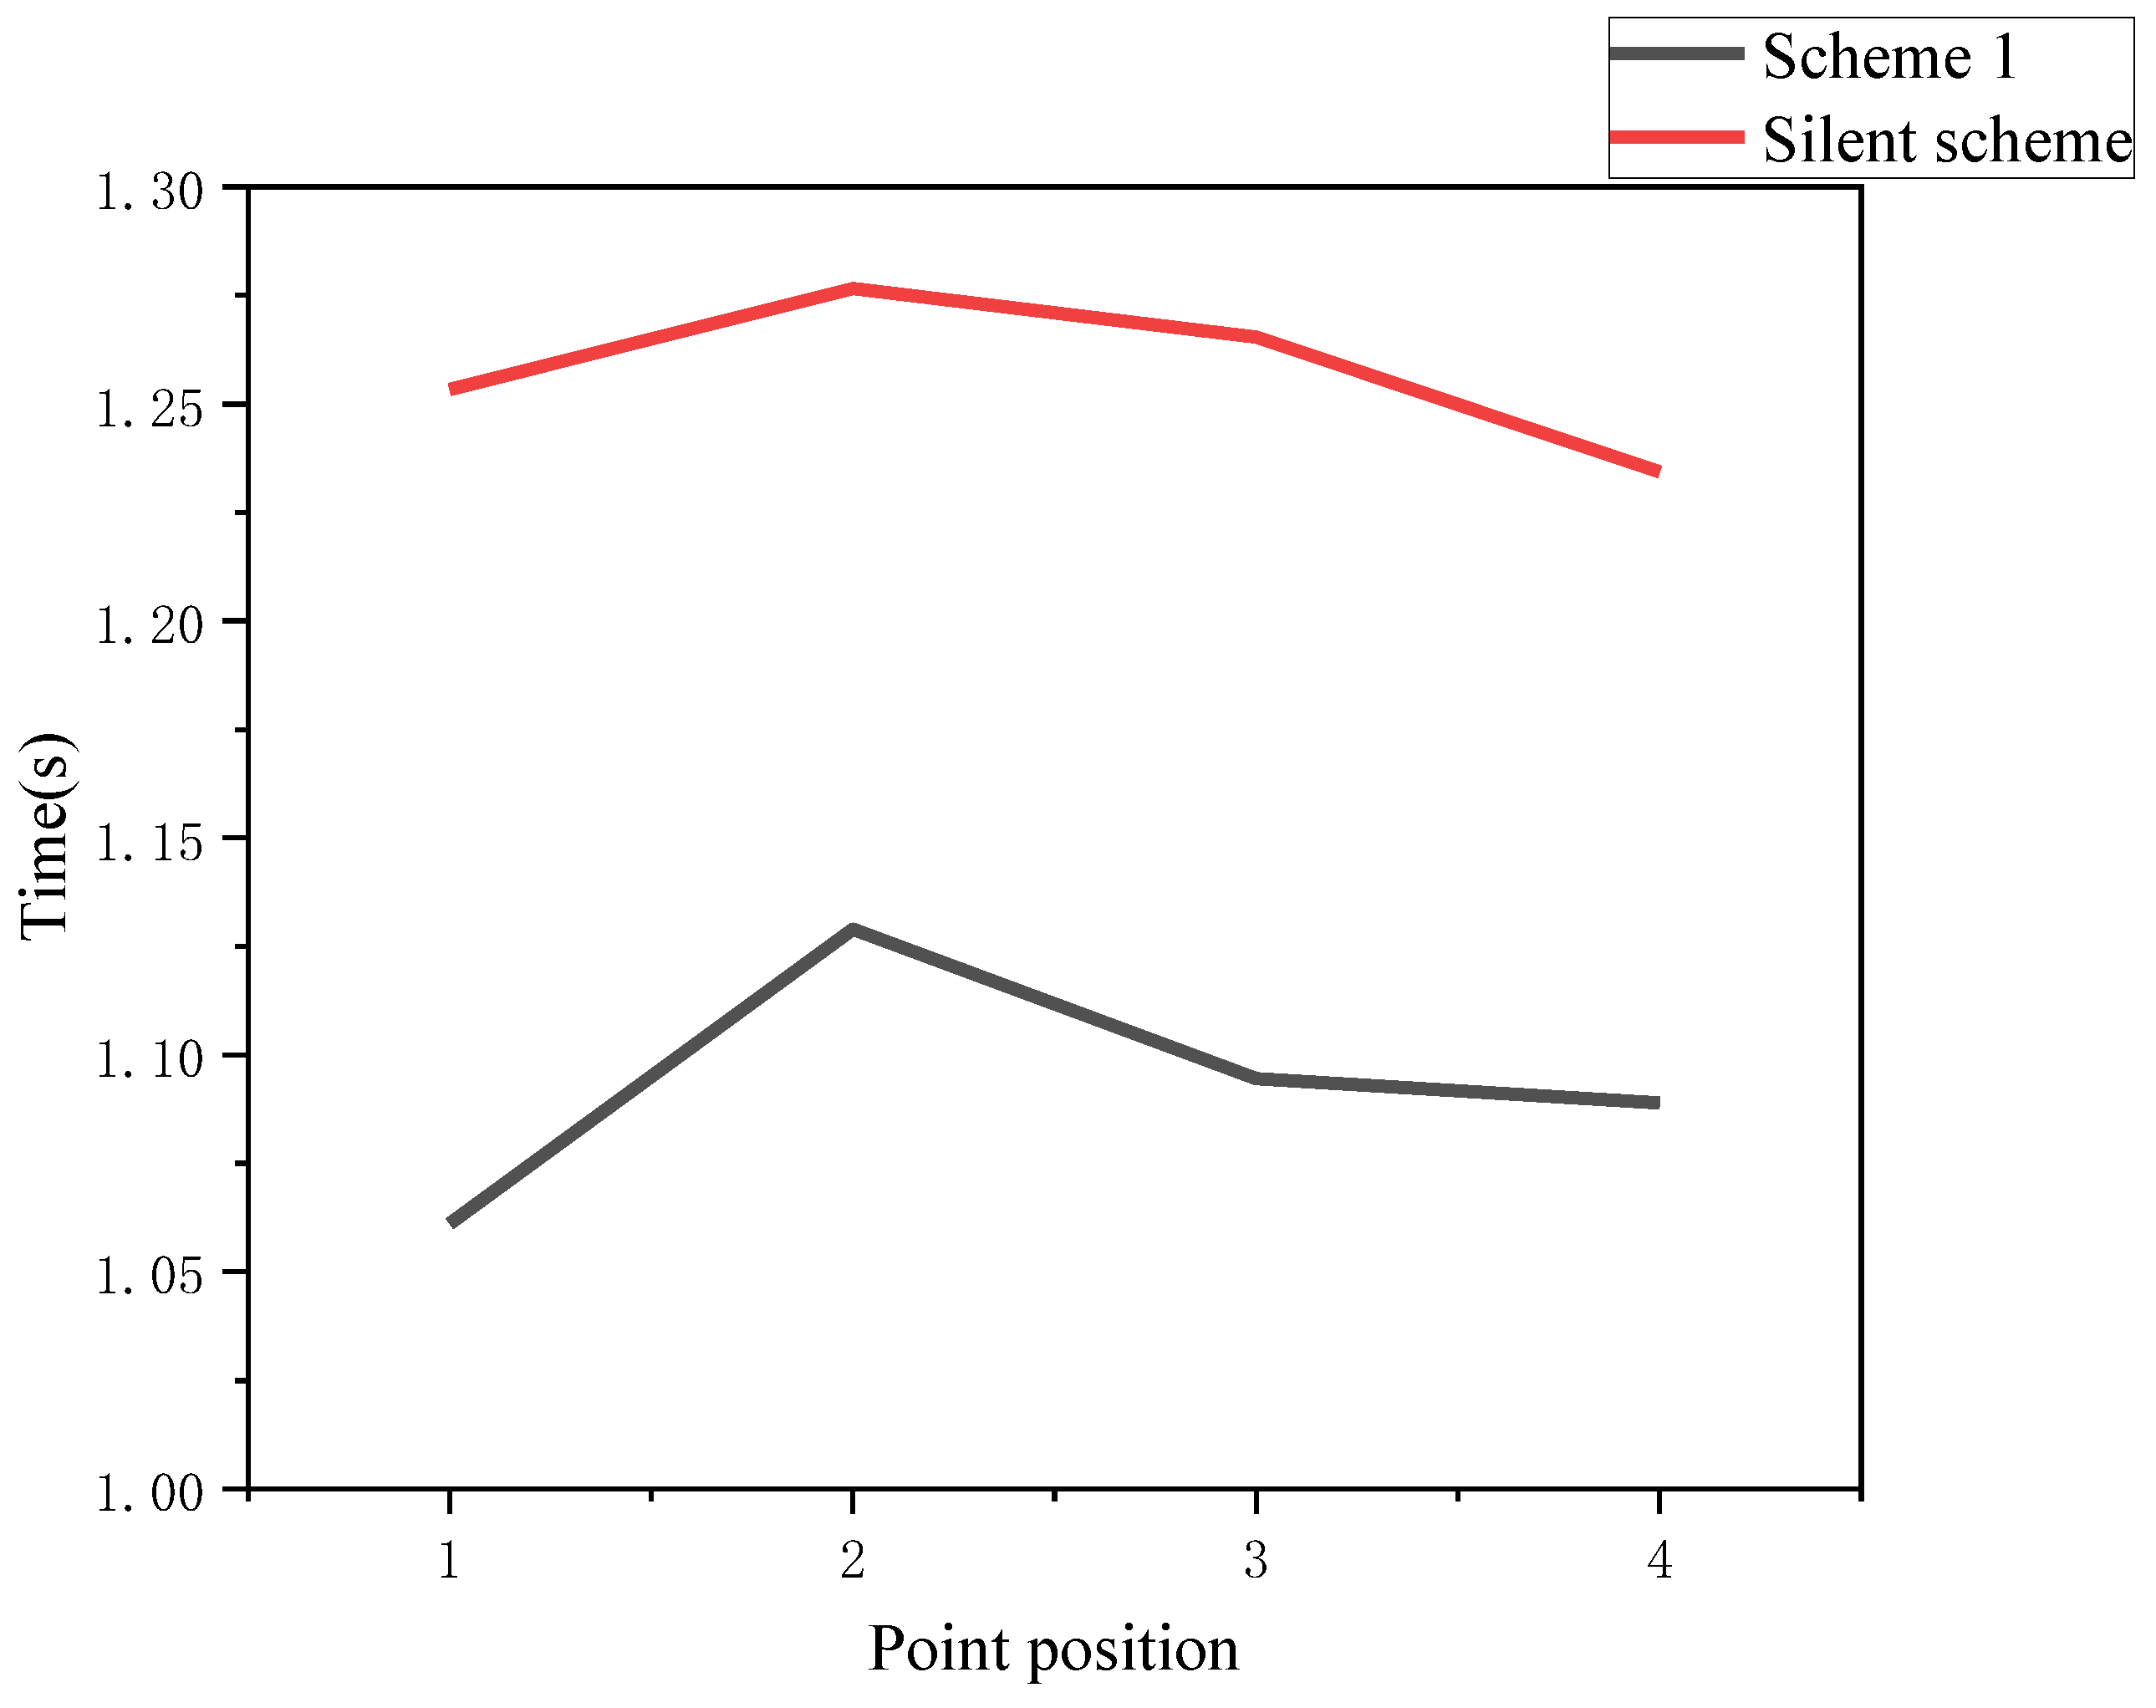
This section specifically analyzes the impact of tactile auxiliary indication scheme on subjects. First, compare the tactile scheme 1 with the non-tactile scheme in
Figure 16.
It can be seen that after adding the location tactile aid cue, the subjects’ reaction time was significantly reduced, with the magnitude reaching 18.12%, 13.08%, 15.61%, and 13.36% at each point, respectively, which shows that the basic tactile cue has a better optimization effect for the location tracking task. The following analysis shows the degree of optimization of each scenario after adding the tactile cue, and the values of reaction time under each scenario are shown as
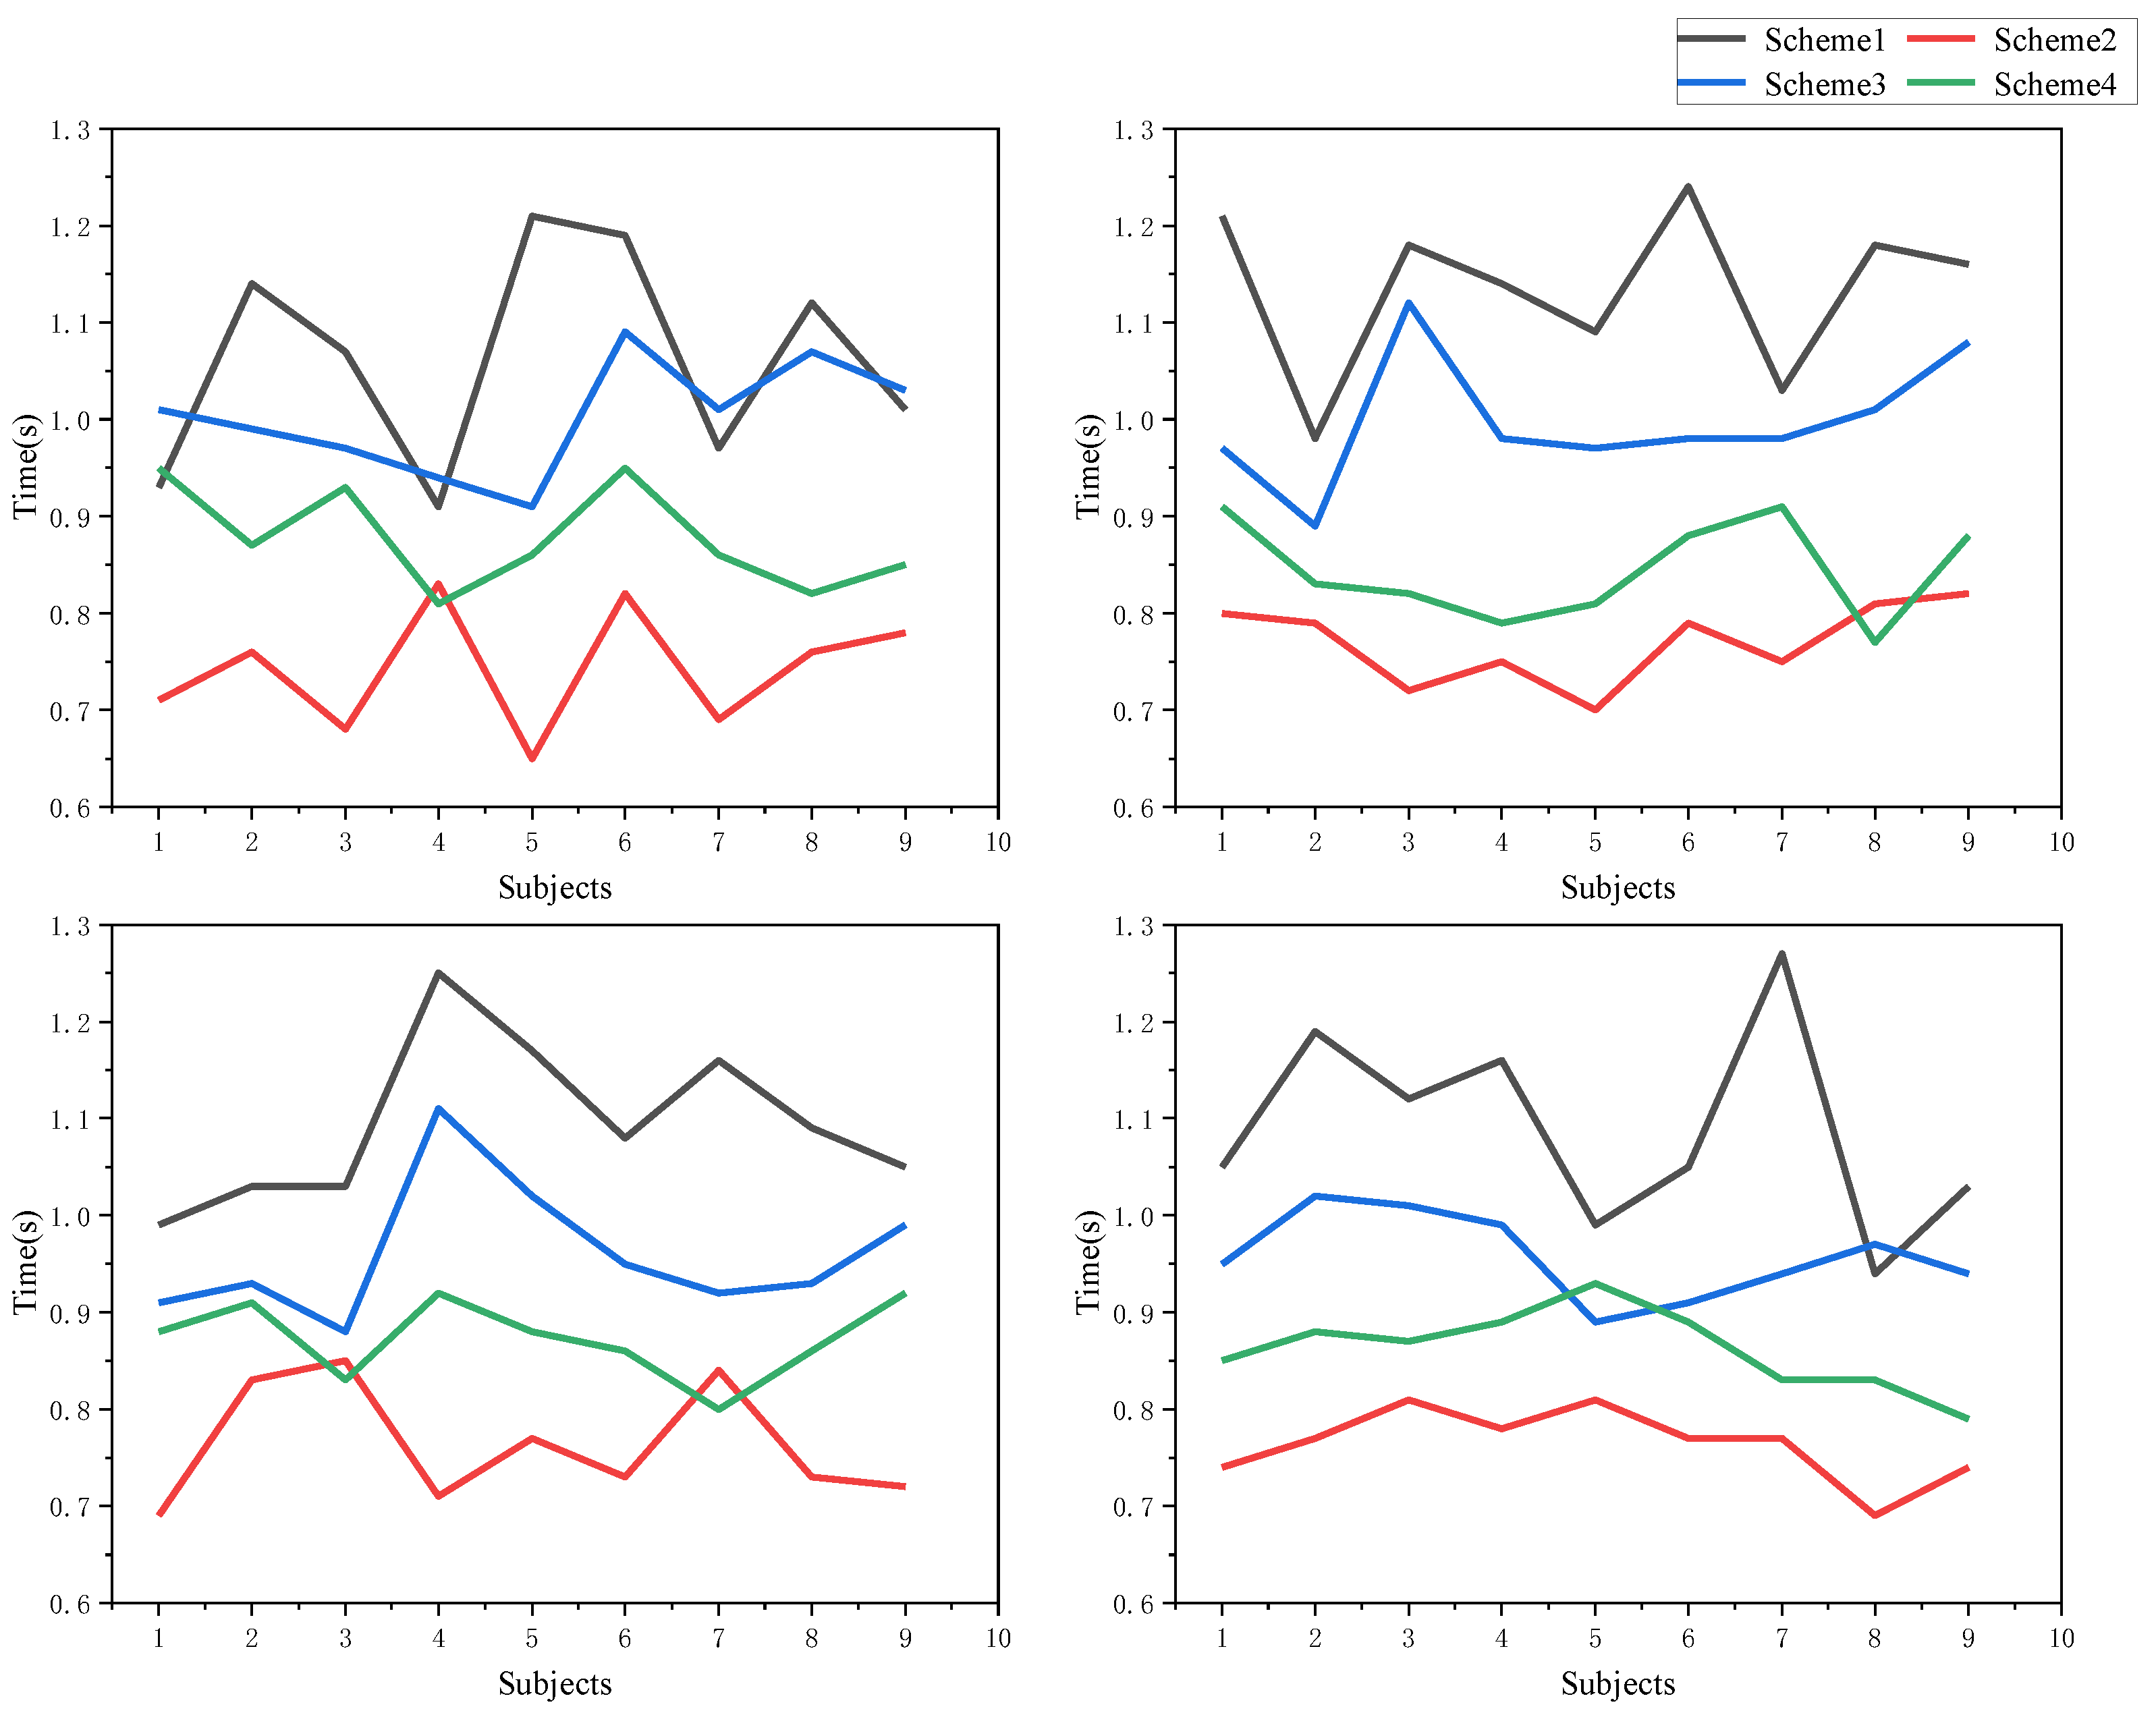
Figure 17:
The raw data under the different indication schemes for each subject were subjected to significance analysis: adjusted F values obtained after one-way ANOVA for the response times at the four-time monitoring points for each subject of Scheme 1 F(2.47,7.40) = 0.299, p = 0.791 > 0.05, adjusted F values for each subject in Scheme 2 F(1.65,4.94) = 0.430, p = 0.640 > 0.05, adjusted F values for each subject in Scheme 3 F(2.19,6.56) = 1.000, p = 0.425 > 0.05, adjusted F values for each subject in Scheme 4 F(2.59,7.73) = 0.507, p = 0.664 > 0.05. It indicates that there is no significant difference in judgment time between individual subjects, and that the variability of different people can be disregarded when conducting mechanistic studies, and only the cognitive characteristics of people as a group can be considered.
The temporal data obtained above were integrated, and the 36 data indicated by the same program were divided into four groups from Program 1 to Program 4 as a group, and their data are shown in the following
Table 11.
Following the scenario design in the methodology in
Section 2, the presence and absence of vibration rhythm and the presence and absence of vibration sequence were used as statistical elements to distinguish the four scenarios, i.e., scenario 1 was no rhythm and no sequence, scenario 2 was rhythm and no sequence, scenario 3 was no rhythm and sequence, and scenario 4 was rhythm and sequence, provided that the vibration location was always present. For the presence and absence of rhythm and the presence and absence of sequence, a between-subjects two-factor ANOVA was performed on the temporal data for each scenario: where the dependent variable was response time, and the independent variables were vibration rhythm (presence and absence) and vibration sequence (presence and absence). The results showed that the main effect of vibration rhythm was significant, F(1,140) = 406.19,
p = 0.00 < 0.05,
, according to the evaluation criteria given by Cohen [
36], the effect value is large where the reaction time of the cueing scheme with vibrational rhythms involved was significantly smaller than that without rhythms. The main effect of vibrational sequence is not significant, F(1,140) = 0.24,
p = 0.628 > 0.05,
, the effect value is small. The response time with the vibration sequence cue was slightly smaller than that without the cue but the difference was not significant. The interaction of rhythm and sequence is significant, F(1,20) = 96.96,
p = 0.00 < 0.05,
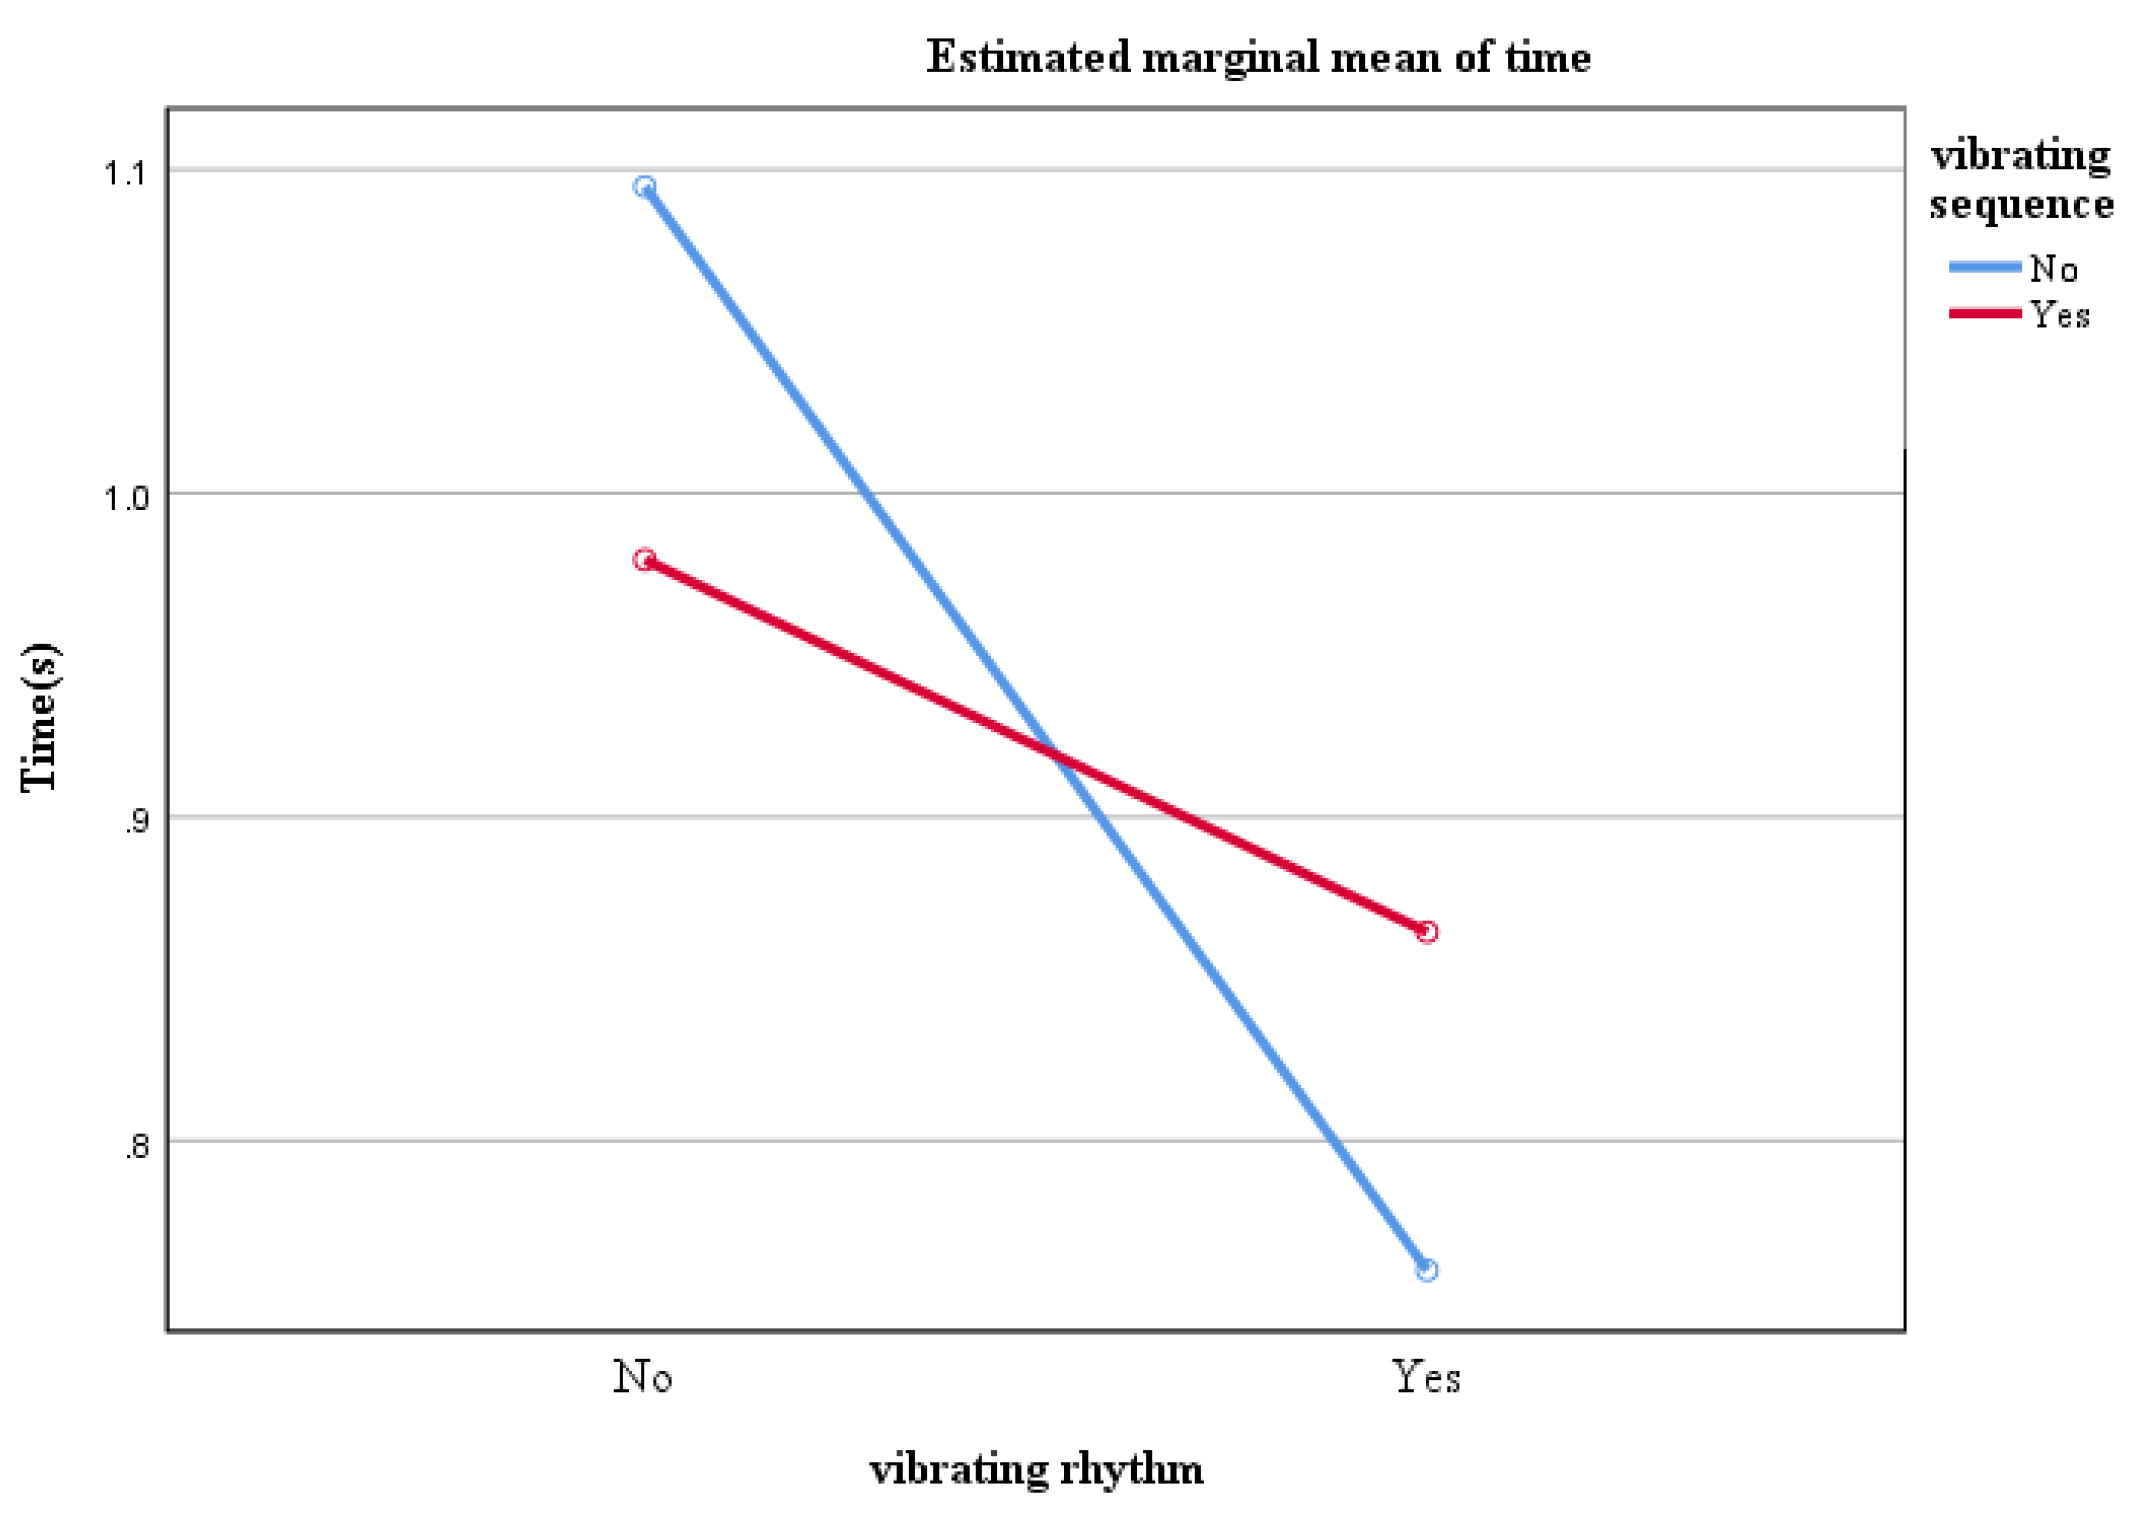
, the effect value is large. For the overall cue, the vibration rhythm can improve the response efficiency with or without the vibration sequence, but the improvement effect is better when there is no sequence; while in the premise of the vibration rhythm, adding the vibration sequence cue will reduce the response efficiency, which reflects that too many tactile cue elements will cause redundancy to human cognition as shown in
Figure 18.
Additionally, through the above analysis, after excluding human subjective differences, in order to reduce the impact of a single experiment on the overall error, we summarized the time data of all subjects at each point according to the following mean value principle, where
is the calculated experimental data,
the time value of the subject
i, and
n is the number of subjects:
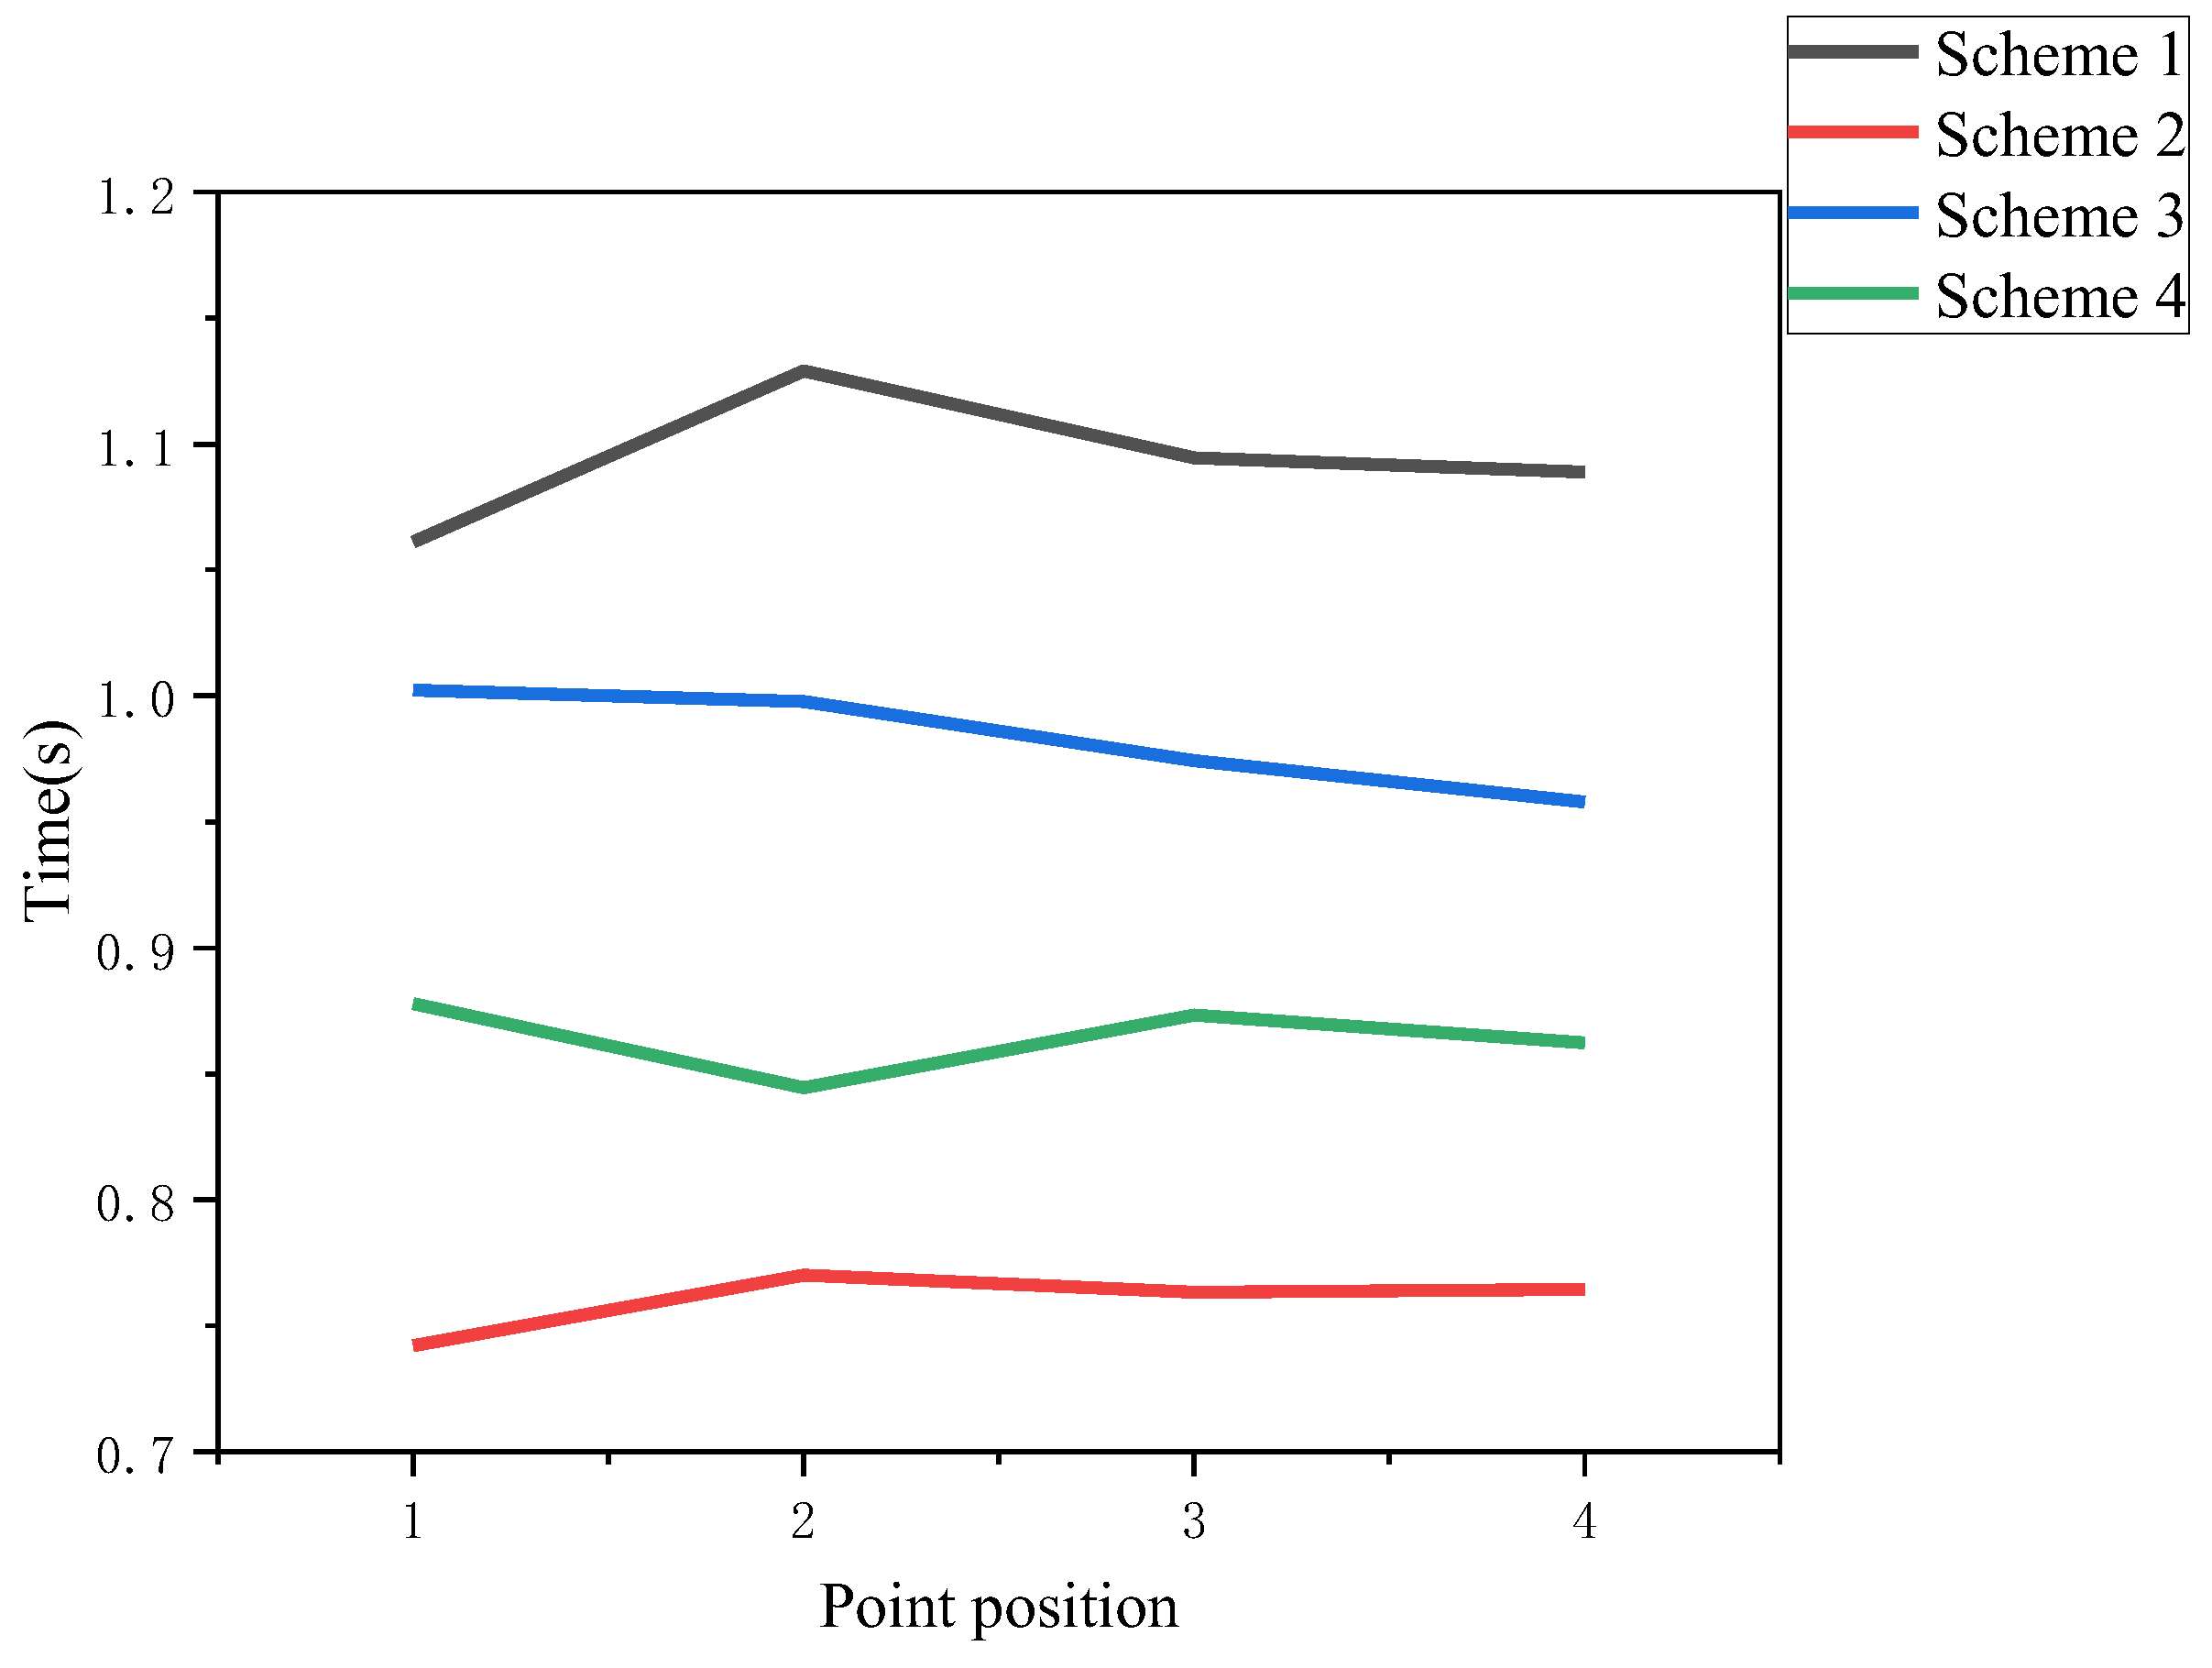
Additionally, the time mean distribution of different schemes at each point is plotted as shown in
Figure 19:
Analyzing the above data, the time averages of scheme 2, 3, and 4 decreased by 30.49%, 10.09%, and 20.93%, respectively, compared to that of scheme 1, and scheme 2 where it is less difficult to implement and use less equipment than the more efficient scheme 3 at the same time. Therefore, scheme 2 has the best prompting effect, followed by scheme 4 and scheme 3, and scheme 1 has a slightly inferior prompting effect.
3.3. Data Analysis of Comprehensive Experiment
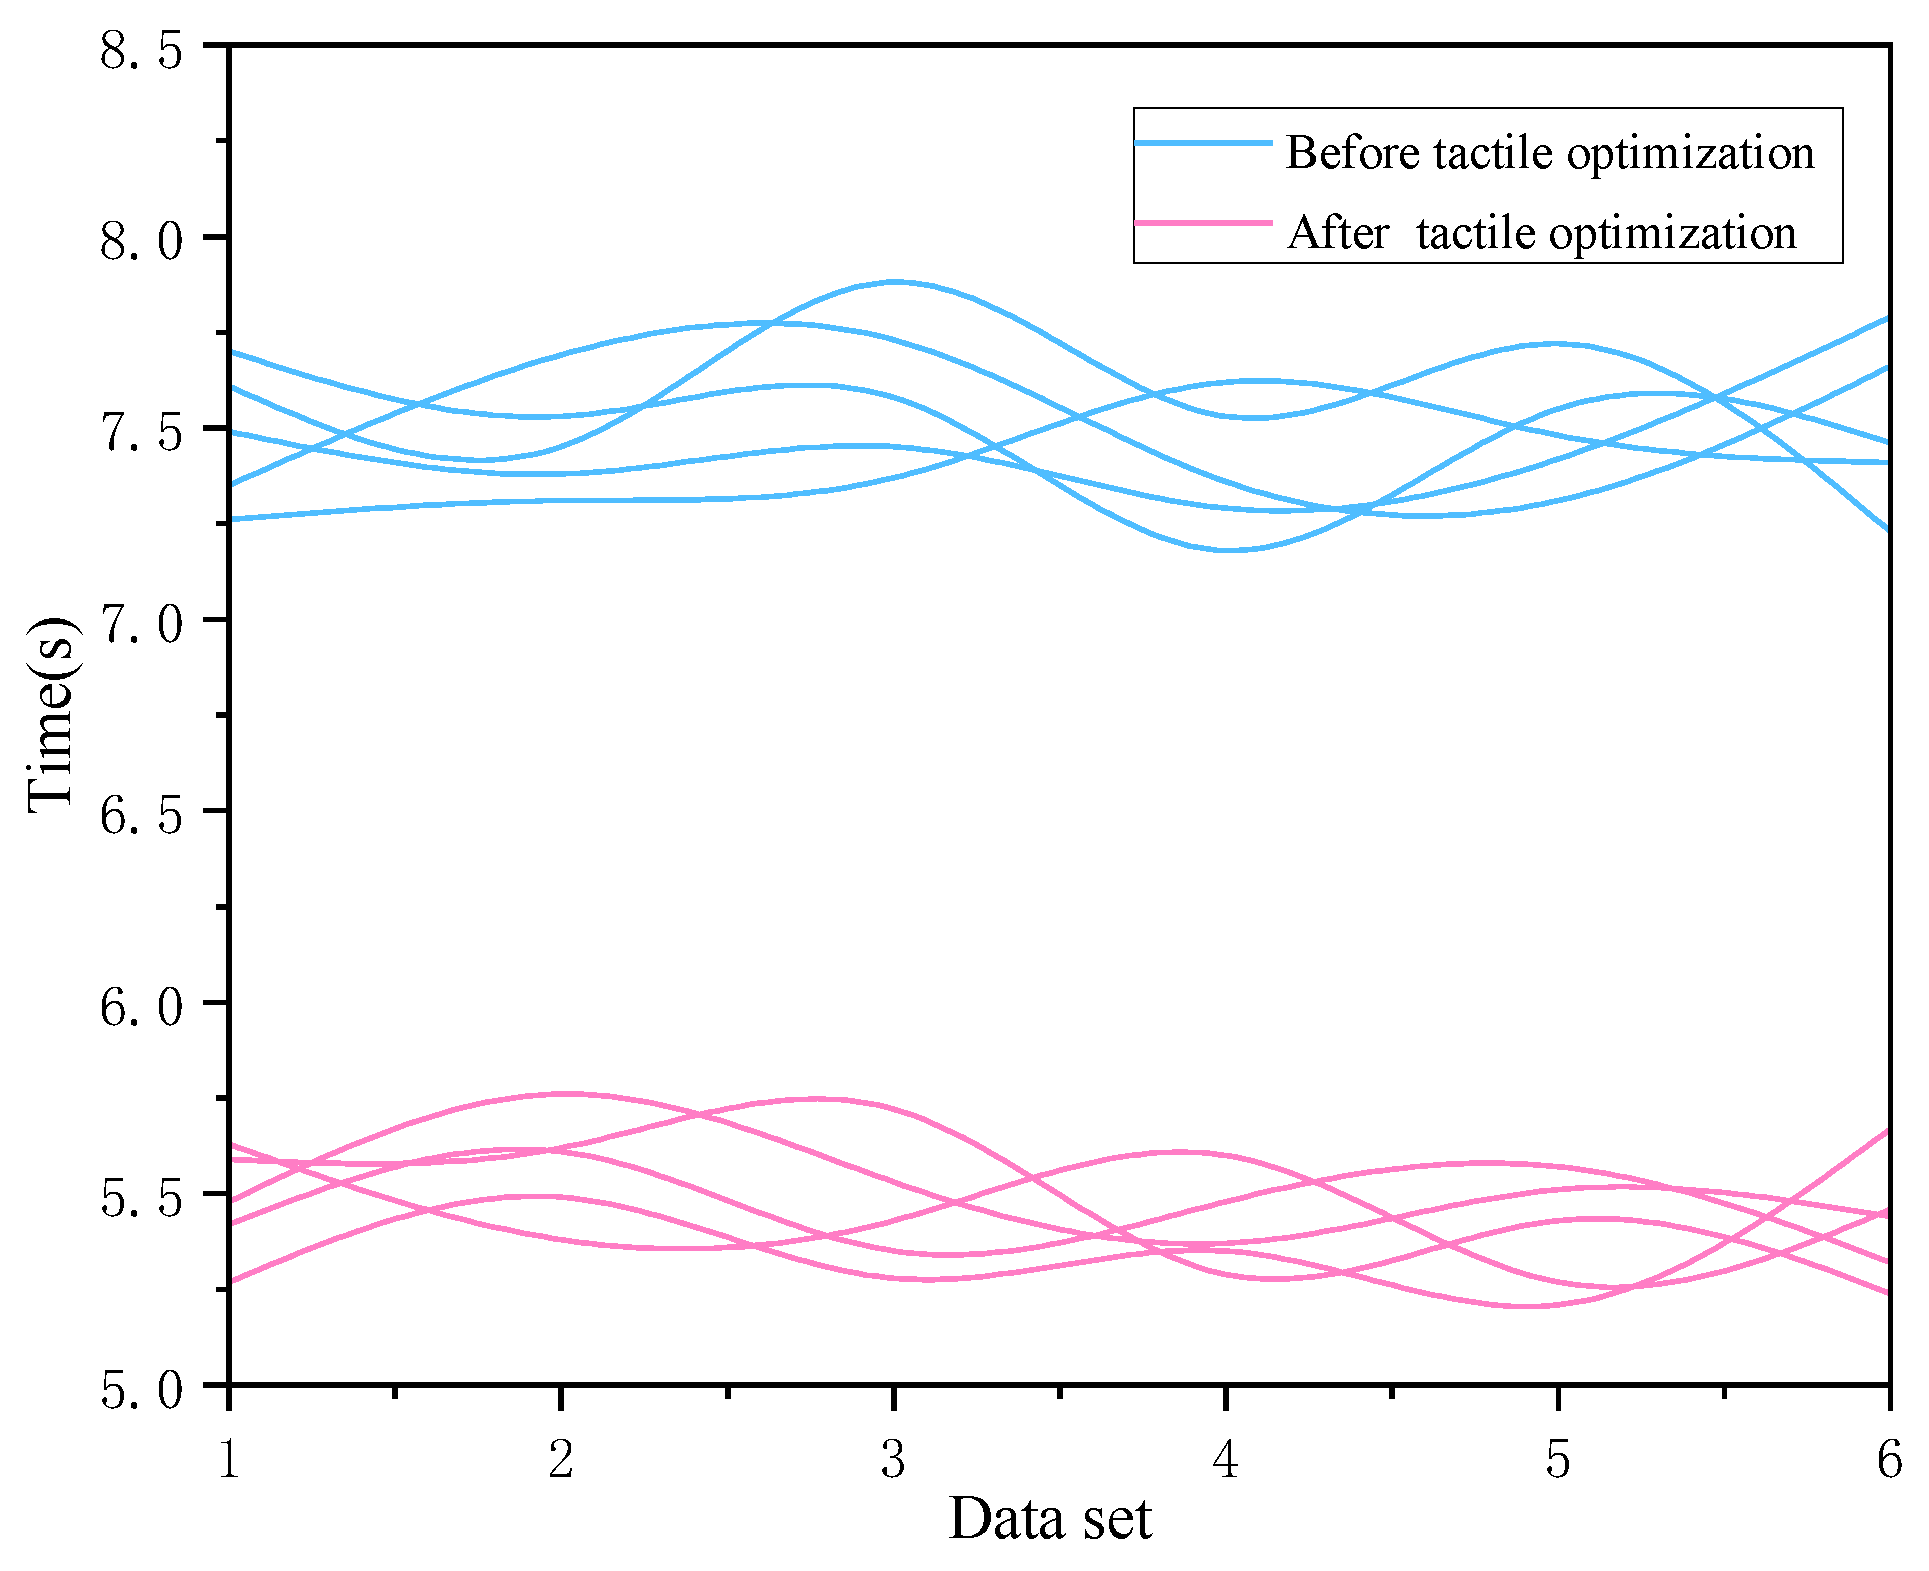
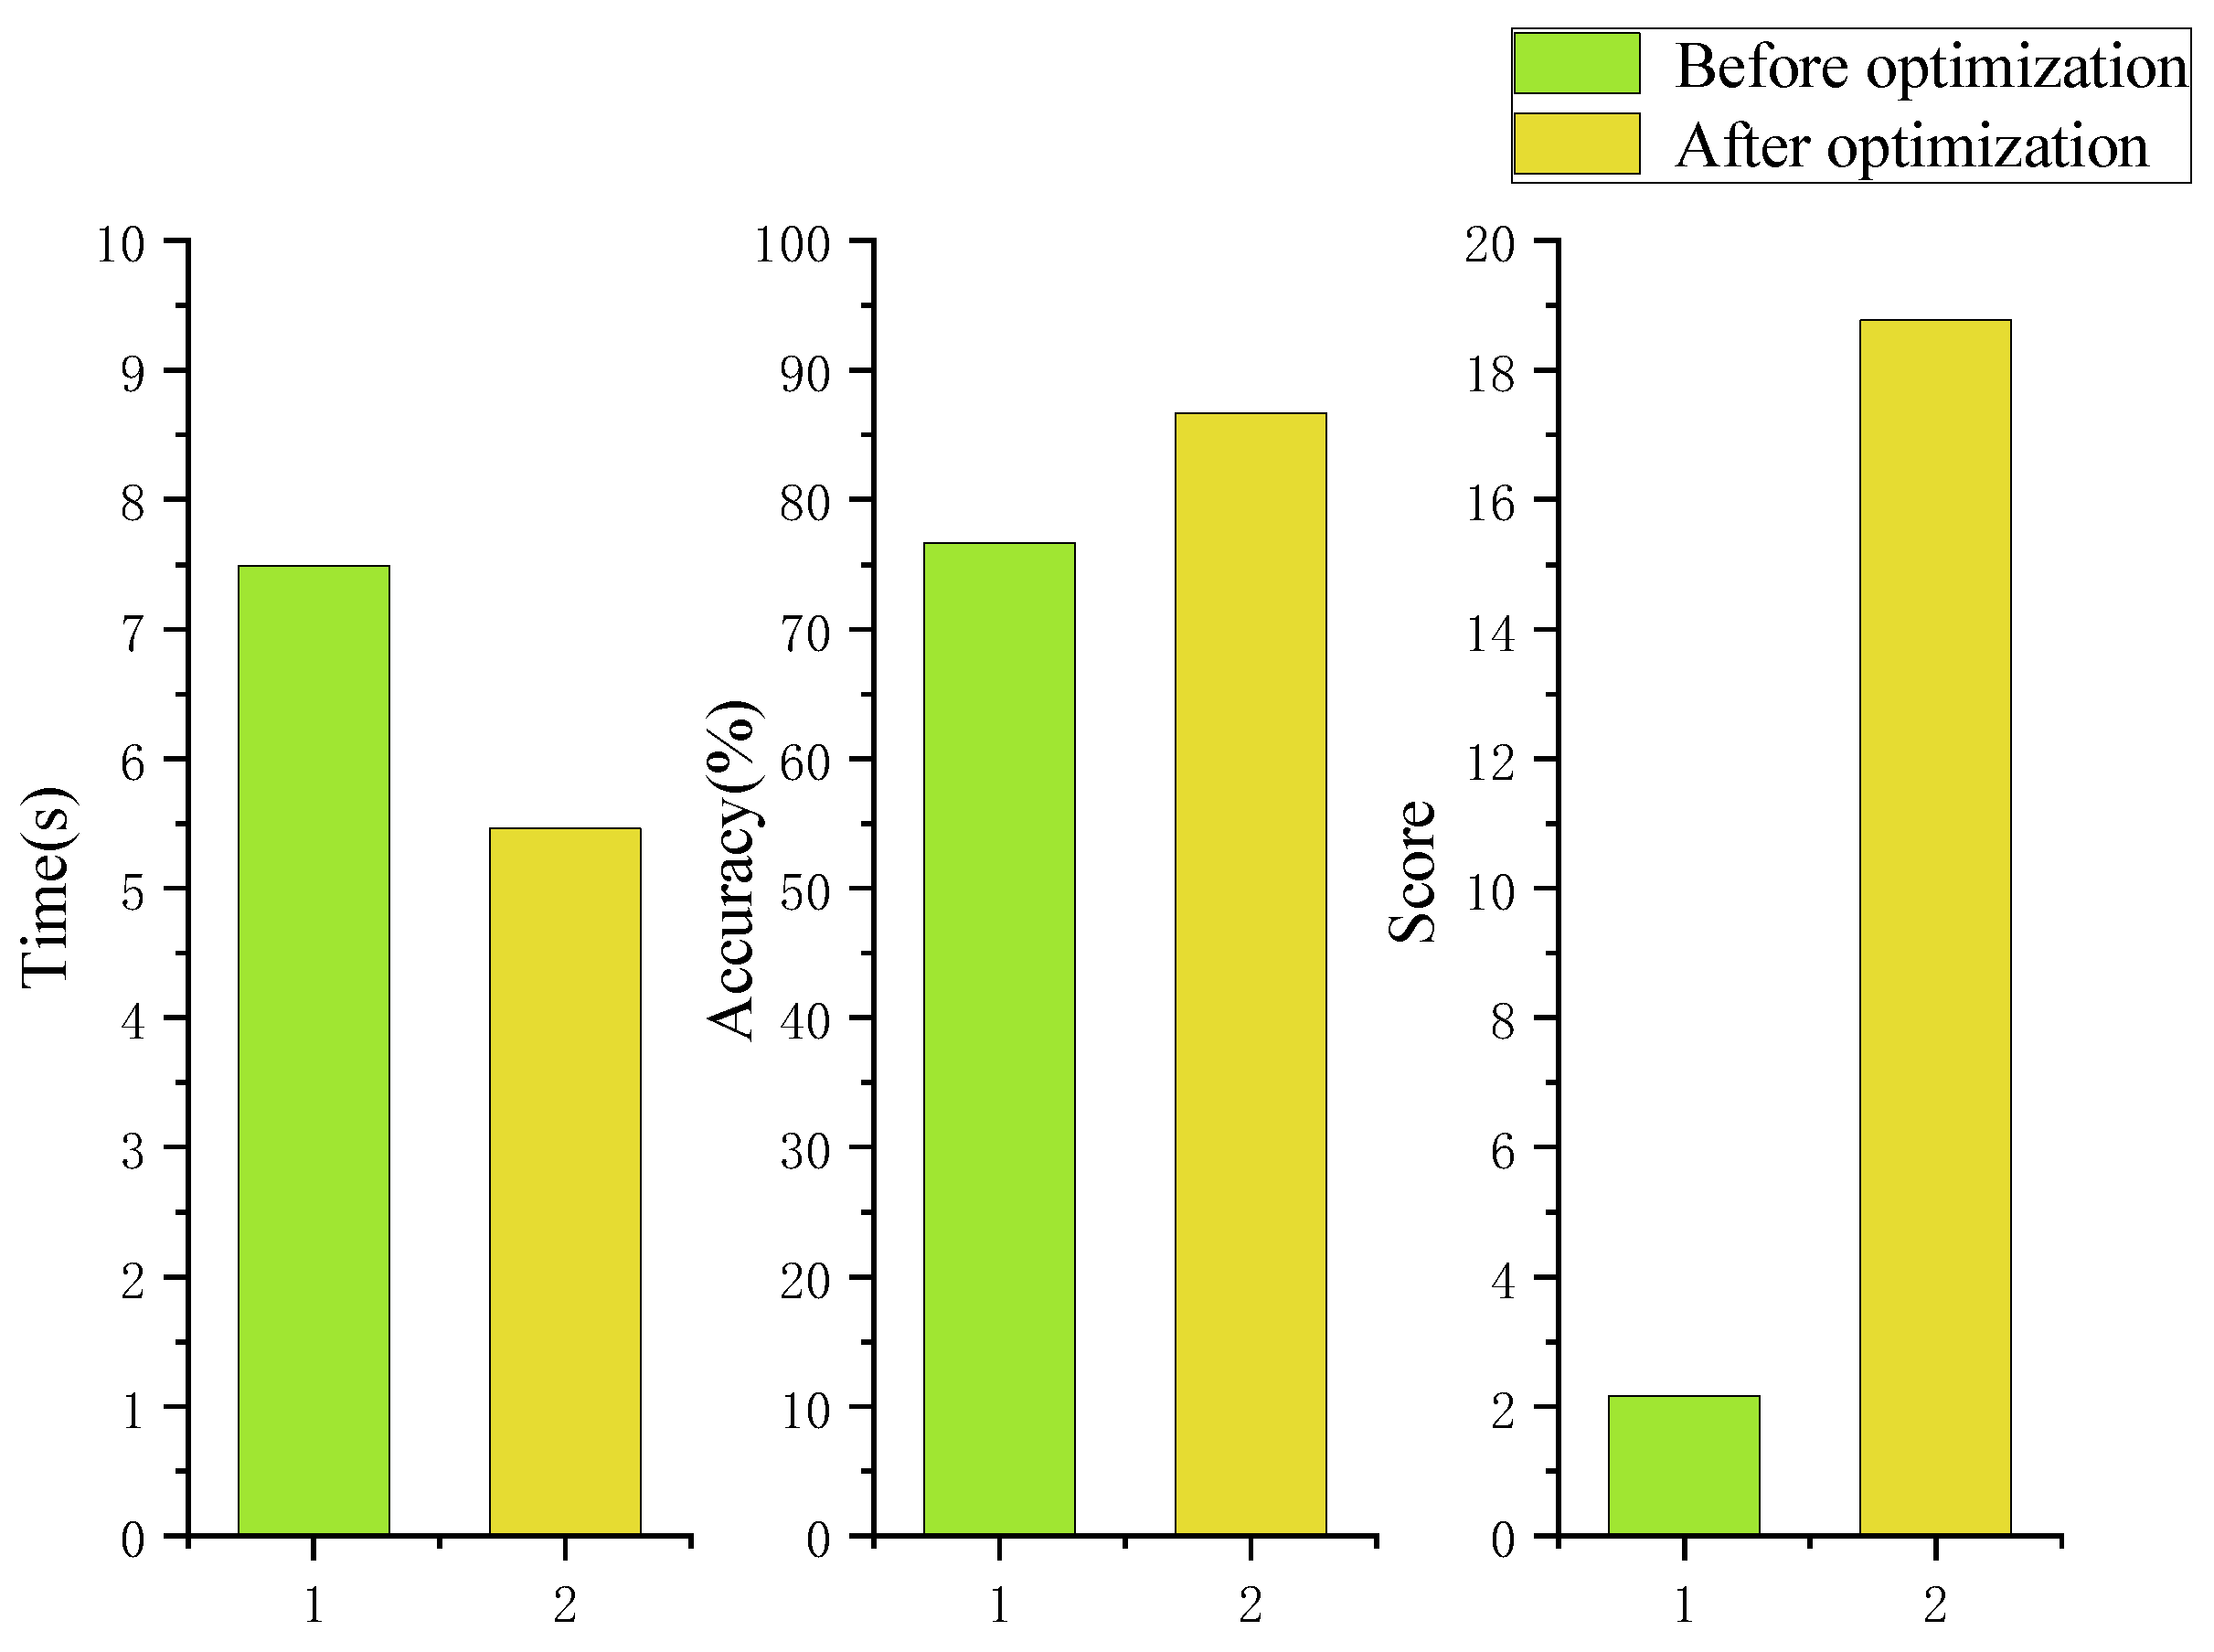
The time distribution of the comprehensive experiment is shown in the
Figure 20 below:
Analysis of variance was performed on the time data before and after the above optimization, the reaction time of the experimental group with a tactile cue (M = 5.45, SD = 0.15) was significantly lower than that of the experimental group without a tactile cue (M = 7.49, SD = 0.18), t(29) = 54.88, p = 0.000 < 0.05, d = 10.02, This effect data is large.
This task requires a combination of time and accuracy. According to the time accuracy comprehensive evaluation model of Maris Gunter [
37]:
where
is the judgment performance, the value is 1 when the judgment is correct, 0 when it is wrong,
is the coefficient of increase of the fraction when the reaction is correct,
is the reduction factor of the fraction in case of incorrect reaction, and
d is the time limit. This value is generally the maximum time to complete the task,
is the time to respond. Since the time of all judgments is less than 8 s, we set the time d in the formula to 8. The evaluation method of Maris Gunter was optimized into the following Equation (14) applicable to this experiment.
where the values of
and
, as the core part of the overall scoring method need to be set by expert opinion in the field. Here, we analyze the importance of the four experts related to the time and correctness of completing the task by adopting the AHP method [
38]. Set
and
ratio to 4.65:1. As shown in the following formula:
The final correct rate and reaction time were brought into the above equation to obtain a combined performance score of 18.77 after tactile optimization and 2.16 before optimization. The combined correctness, response time, and score of the combined experiment are displayed in order in
Figure 21.
4. Discussion and Analysis
Based on the current demand for precise and rapid judgment of motion perception tasks in the MR environment, this paper innovatively uses tactile sensors to assist human visual interaction and assists people’s multi-target urgency perception and single-target accurate tracking perception through tactile intensity prompts and different vibration scheme prompts. Through experiments in two different scenarios and a comprehensive experiment, the relationship between motion speed and tactile intensity in MR environment and its application in urgency discrimination, as well as the relationship between single-target precise positioning and different tactile indication schemes, are explored, and the effectiveness of tactile-assisted visual comprehensive indication is confirmed, the specific conclusions are as follows:
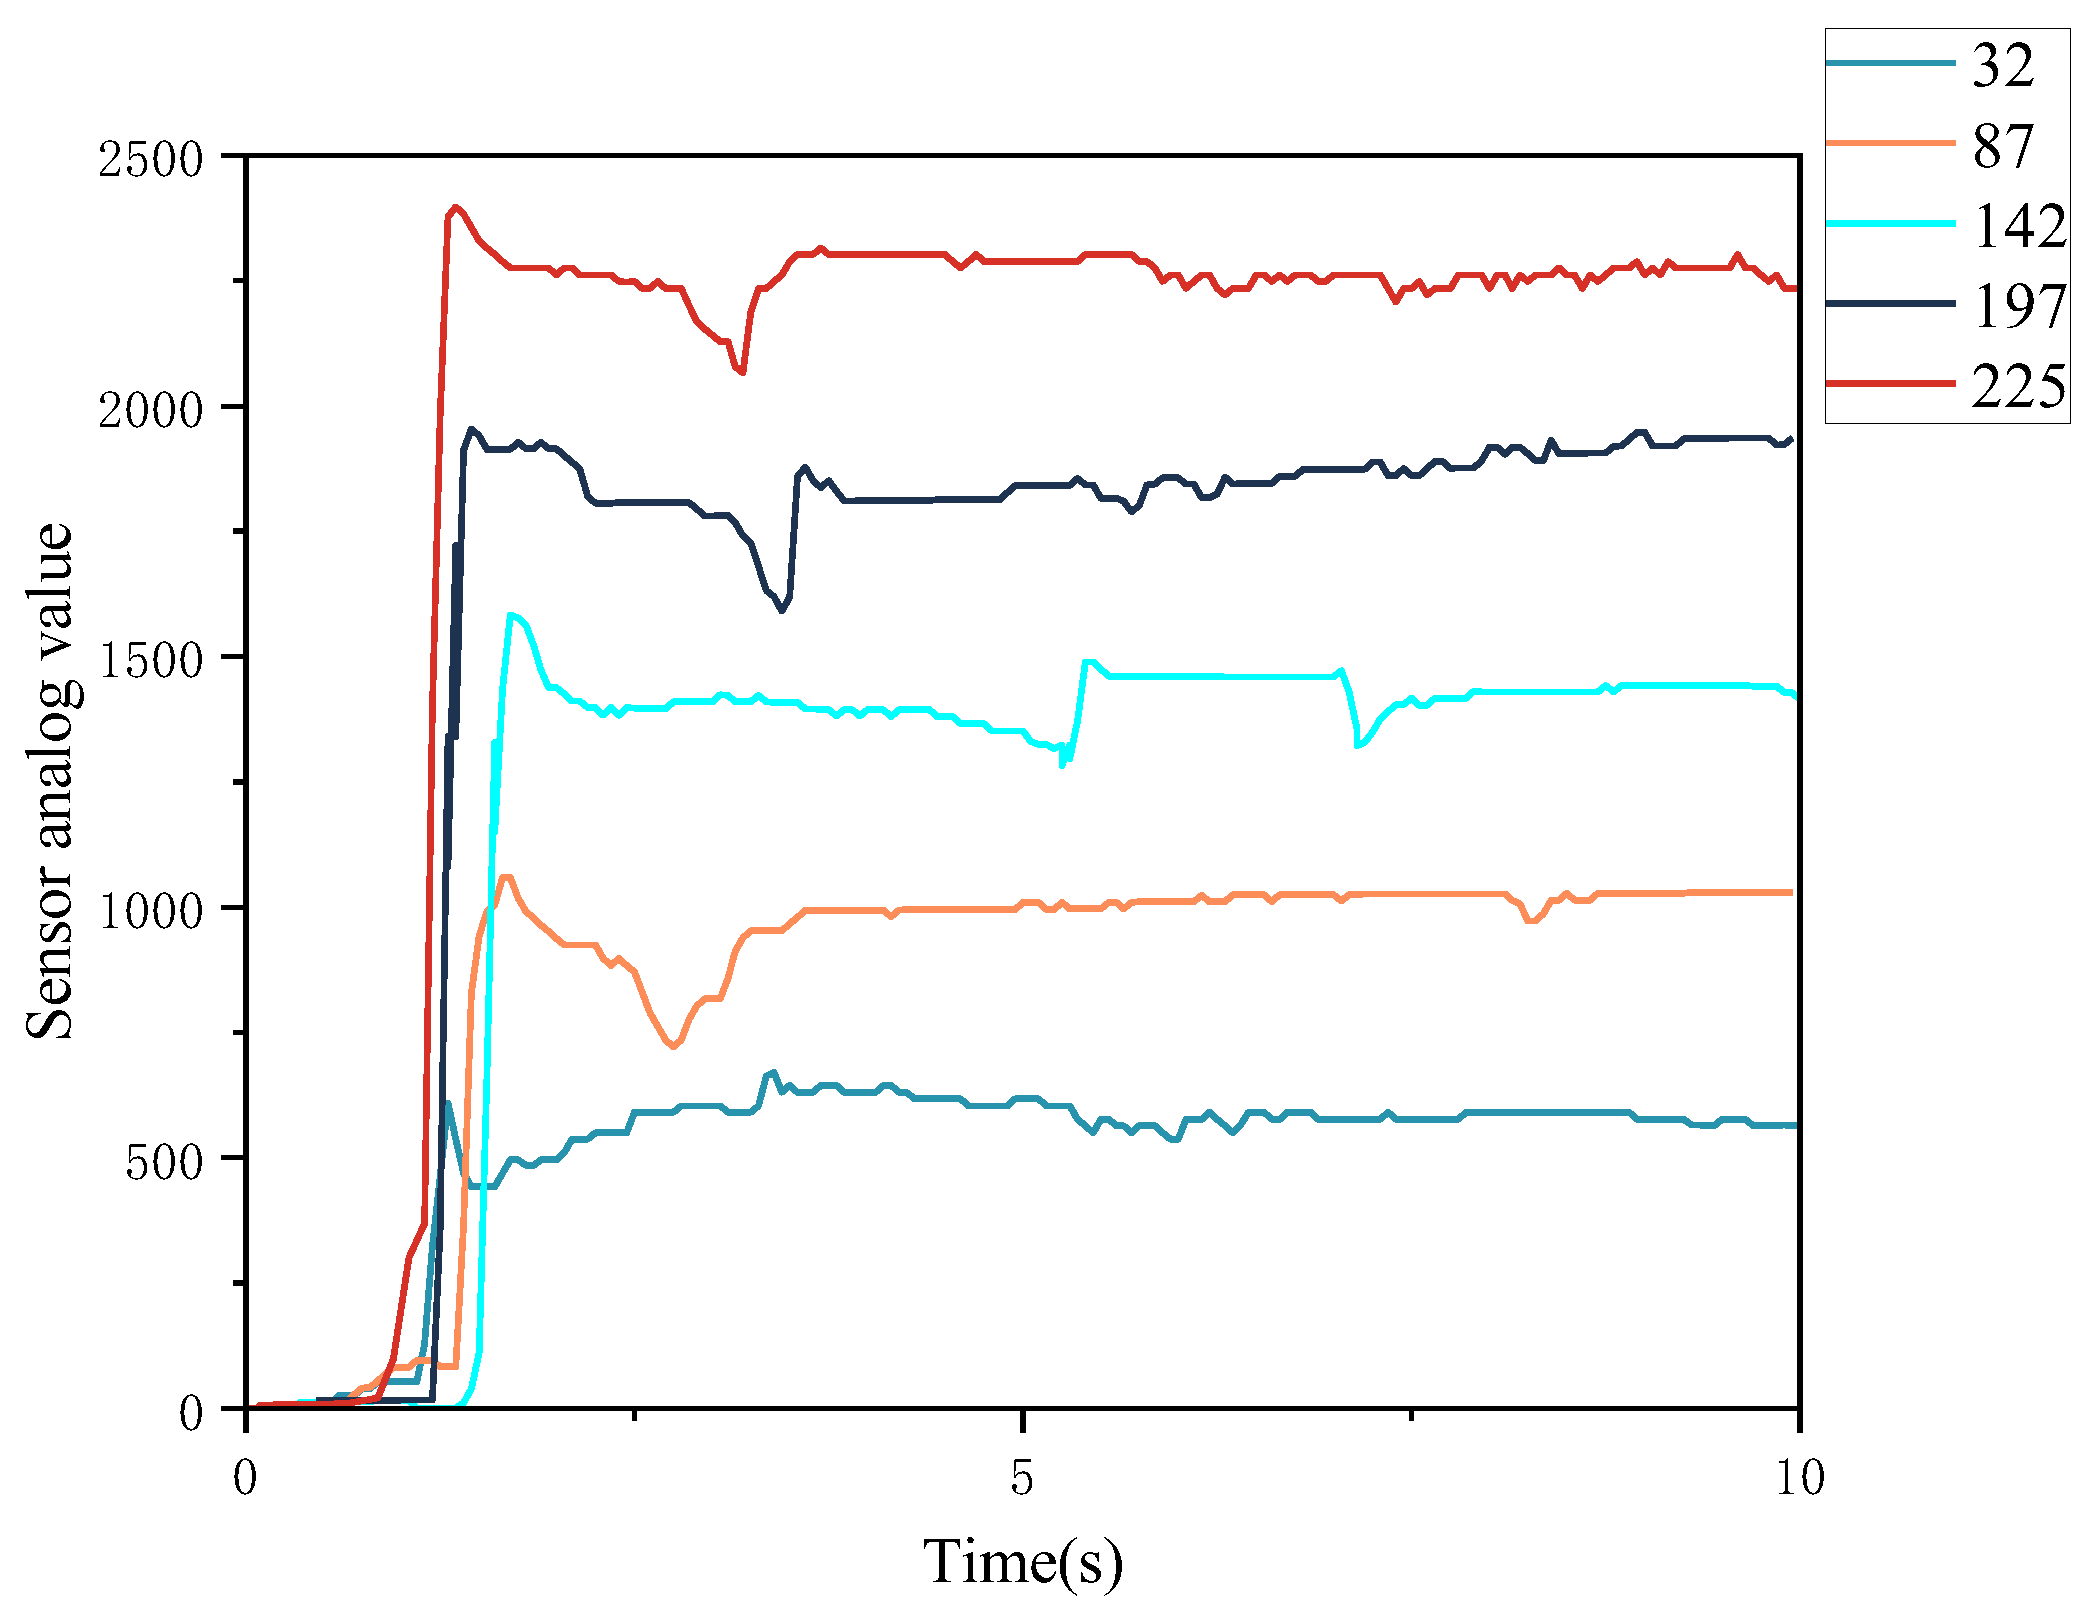
(1) Experiment 1 is an experiment on the discrimination of velocity and importance of multi-target channels in MR environment, and its purpose is to explore the application effect of the tactile intensity-velocity relationship in importance judgment. In the first stage, the coupling relationship between speed and vibration intensity is explored by setting vibration of different intensities to match the speed channel. The obtained reaction time is used as a judgment indicator. After data analysis, the p-value of the significance test for each data set under each intensity was less than 0.05. That is, when each intensity corresponds to a target at different speeds, the participant’s judgment time is significantly different. When the vibration intensity-target speed (sensor value-target speed) correspond to low-slow (32–12 mm/s), lower-slower (87–24 mm/s), medium-medium (142–36 mm/s), higher-faster (197–48 mm/s), and high-fast (252–60 mm/s), the judgment time is the shortest and the effect is the best. In the second stage, this paper applies this relationship to the judgment of target urgency, and through comparative experimental analysis, the mean reaction time of the experimental group with tactile intensity-velocity relationship cue is at least 11.48% lower than that of the control group without tactile intensity cue, and the difference between the groups is p = 0.00 < 0.05, t(38) = 7.62, and the effect value d = 2.41(large), which is a large overall difference. Moreover, under the premise of adding the tactile intensity indicator, the prompt effect is also significantly different between different channels (p = 0.00 < 0.05), among which the time means of channel 5 with the highest intensity and channel 1 with the smallest intensity are 15.46% and 6.25% lower than that of channel 3 with intermediate intensity.
(2) Experiment 2 is an experiment of single-target channel target tracking in MR environment, the purpose of which is to assist the participant in obtaining the precise position of a single target and tracking through different PRS-based tactile indication schemes, so as to obtain the effectiveness of the specific tactile scheme based on PRS for visual judgment position. Firstly, the difference between scheme 1 (position) and no vibration scheme cues was compared. After adding the positional tactile assist cue, the reaction time of the participants decreased by 18.12%, 13.08%, 15.61%, and 13.36% at each point, respectively. Then, through the design experiment, the effect of each tactile indication scheme on the auxiliary vision to accurately locate the moving target was explored, and the conclusion was as follows: the time of schemes two, three, and four decreased by 30.49%, 10.09%, and 20.93%, respectively, compared with scheme 1. Therefore, the cueing effect of scheme 2 is the best, followed by scheme 4 and scheme 3. The cueing effect of scheme 1 was slightly less effective. The ANOVA is performed on the scheme group that adds rhythm, rhythm & sequence, and sequence on the basis of position. The vibration rhythm and rhythm & order of p = 0.00 < 0.05, the F values were 406.19 and 96.96, and the effect values were 0.74 and 0.41, respectively, indicating that the influence of both on the reduction of judgment time was significant, and the optimization degree of vibration rhythm was high. However, the p-value of the addition sequence scheme is 0.628 is greater than 0.05, the F value is 0.24, and the effect value is 0.002, indicating that its effect on time reduction is not significant.
(3) Experiment 3 is a comprehensive process case experiment combining the first two experimental tasks, and its purpose is to judge the effect of adding the above tactile cue optimization on the overall dynamic target perception. Through the analysis, the optimized reaction time is reduced by 27.15% compared with the pre-optimization period, and the accuracy rate is increased by 11.54%. Additionally, through the score of comprehensive time and correct rate, it is 18.77 after optimization and 2.16 before optimization, which has a large improvement and good optimization effect.


