


A Method for Statistical Processing of Magnetic Field Sensor Signals for Non-Invasive Condition Monitoring of Synchronous Generators
 , , and
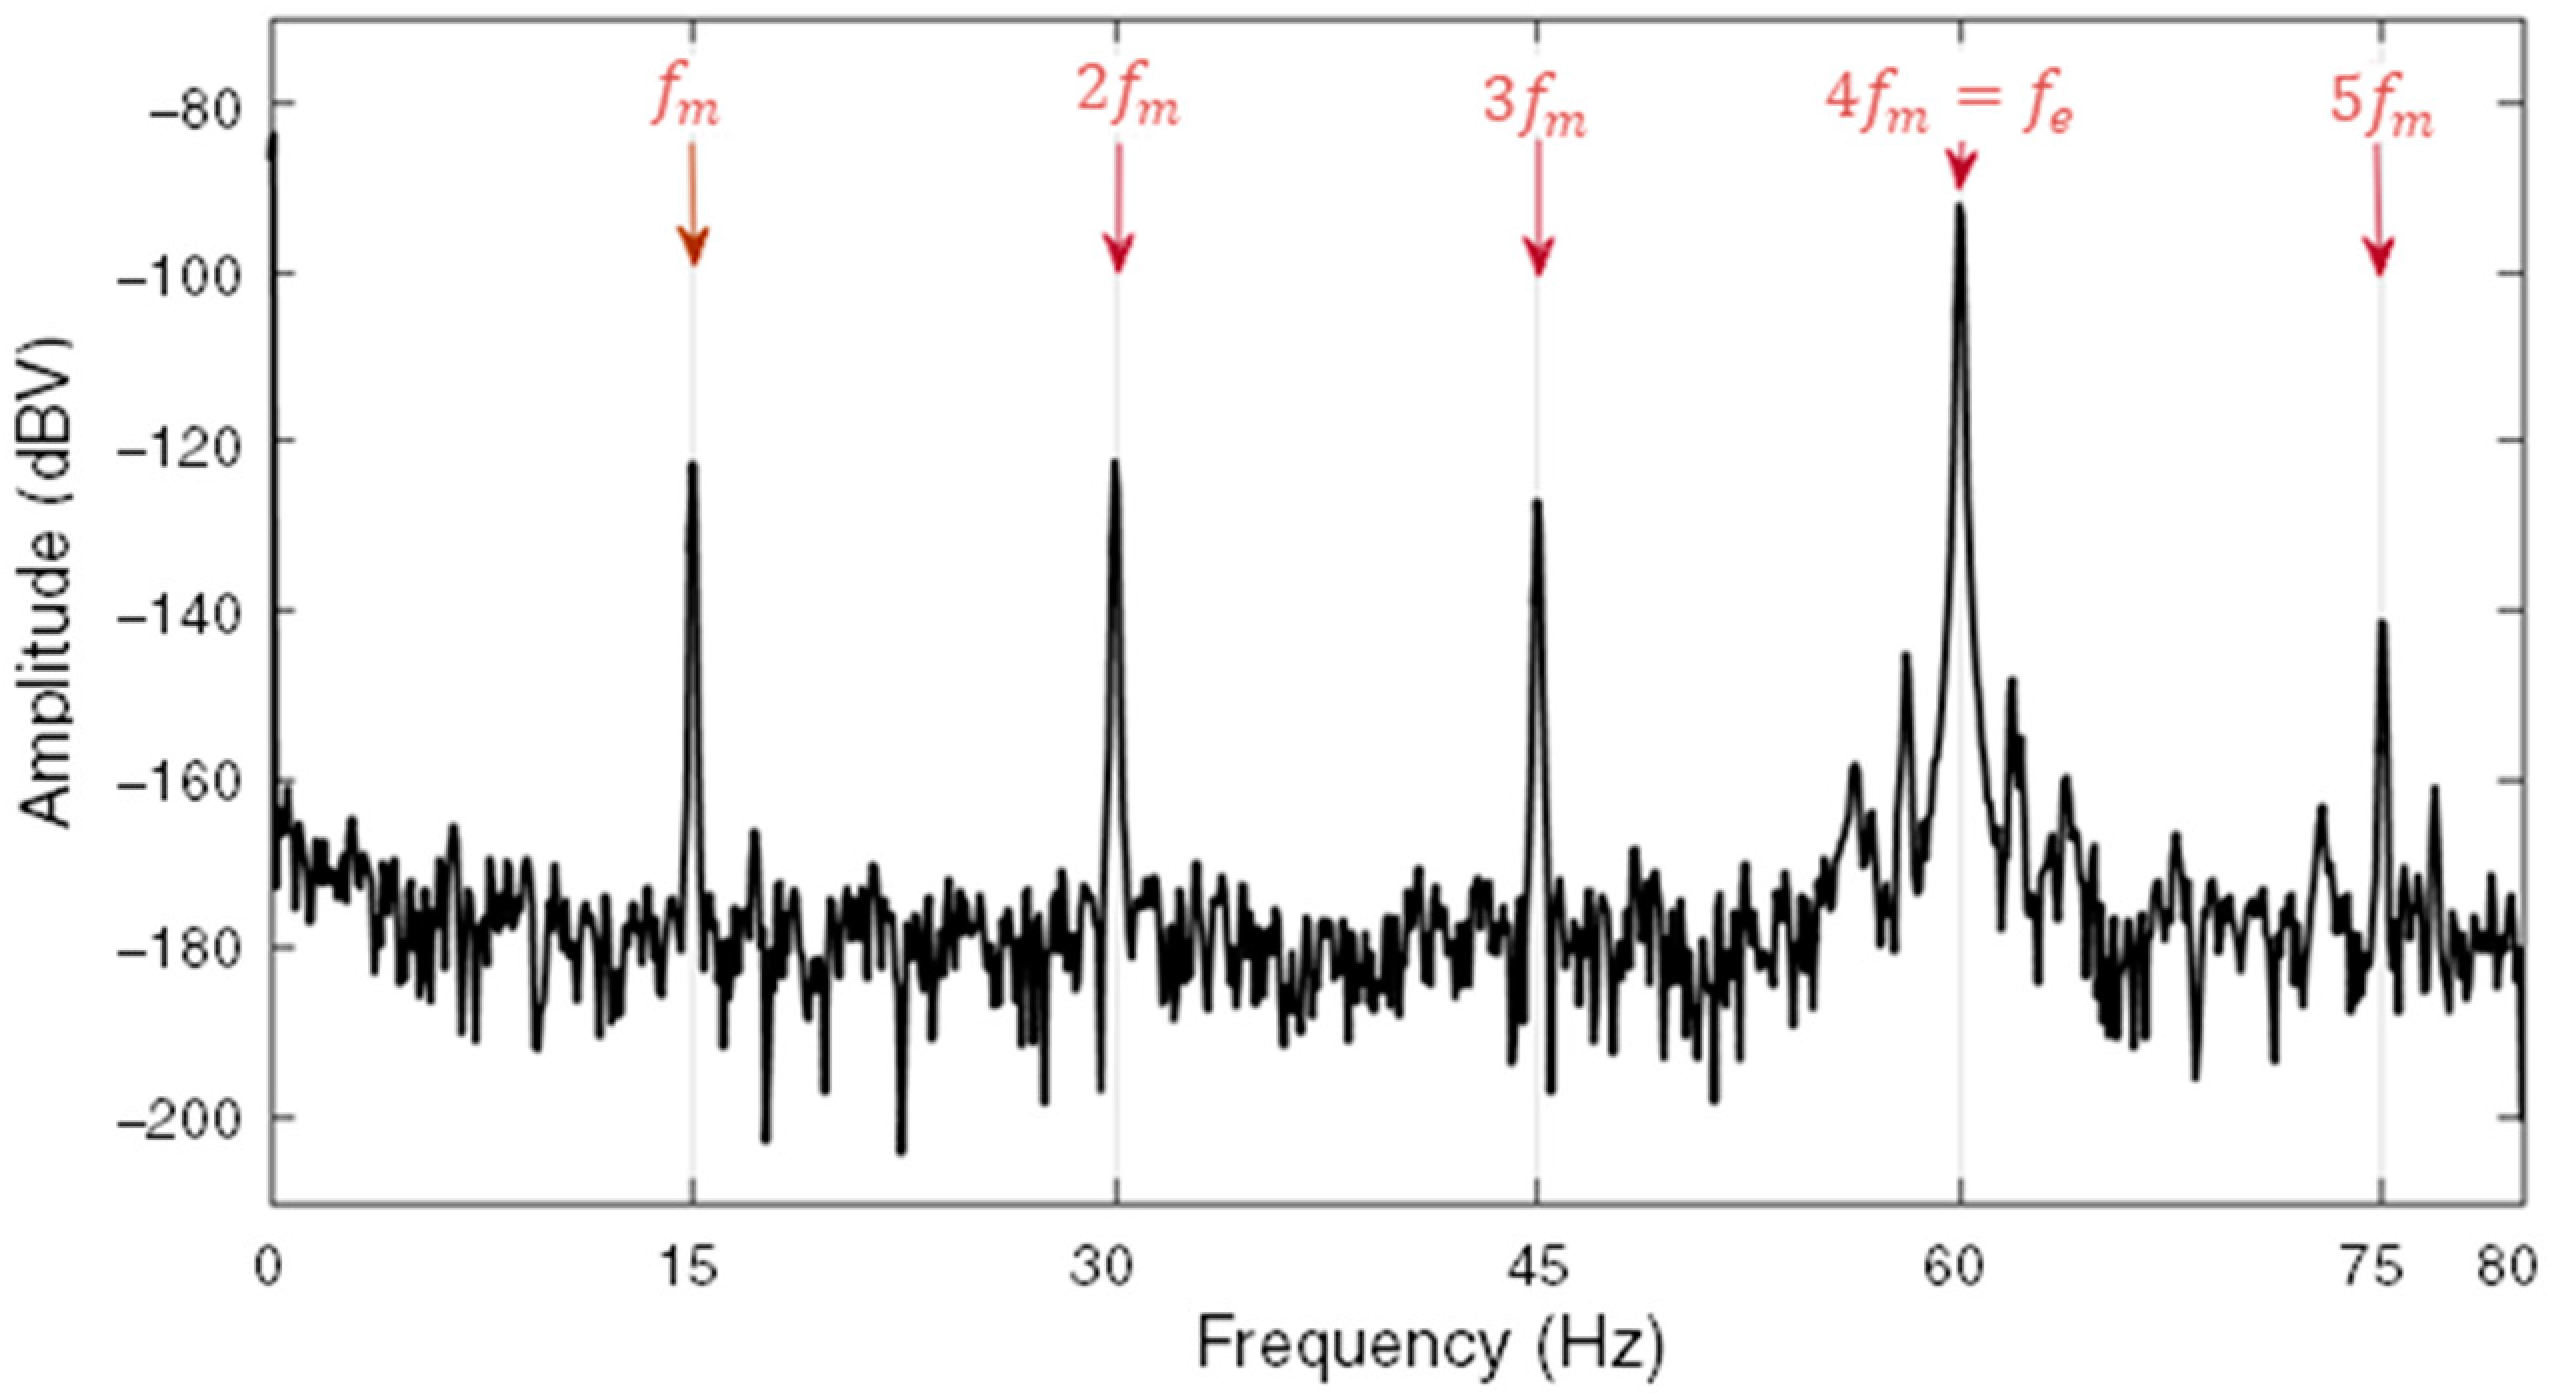
Abstract
:1. Introduction
- The evaluation of statistical techniques of control charts for detecting anomalies in the continued magnetic signature of SGs obtained by periodic monitoring of the machine synchronized with the electrical grid;
- The proposal of a statistical data analysis method with simple computational implementation for automatic fault detection in synchronous generators based on the continuous monitoring of the external magnetic field;
- The validation of the proposed method employing datasets measured in an experimental bench with controlled imposition of stator and rotor faults. Validation of the methodology with a dataset obtained by monitoring a 305 MVA SG during the evolution of an incipient mechanical vibration fault.
2. Magnetic Signature Monitoring
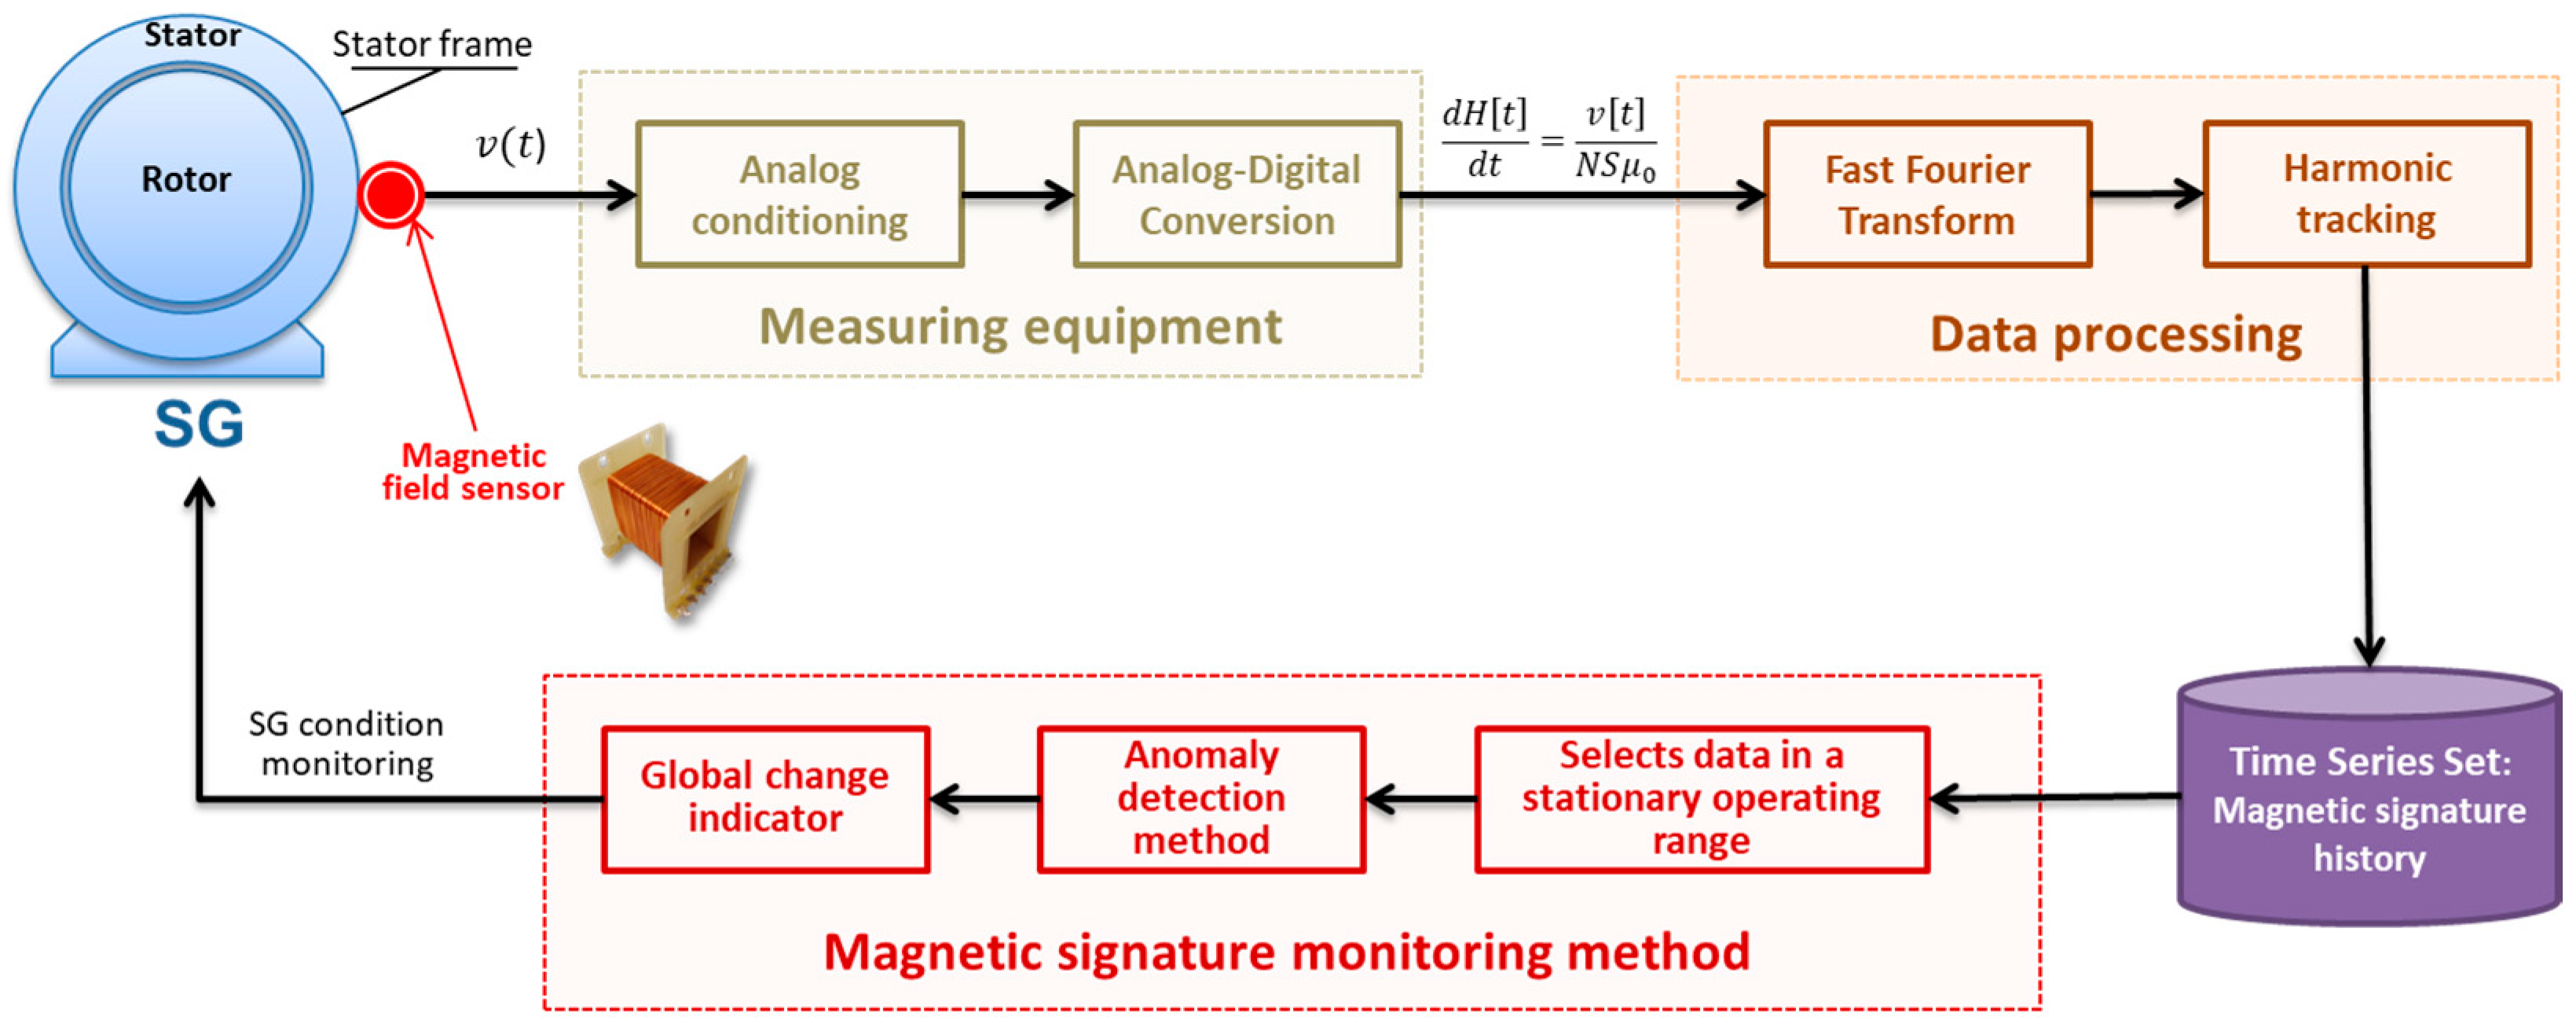
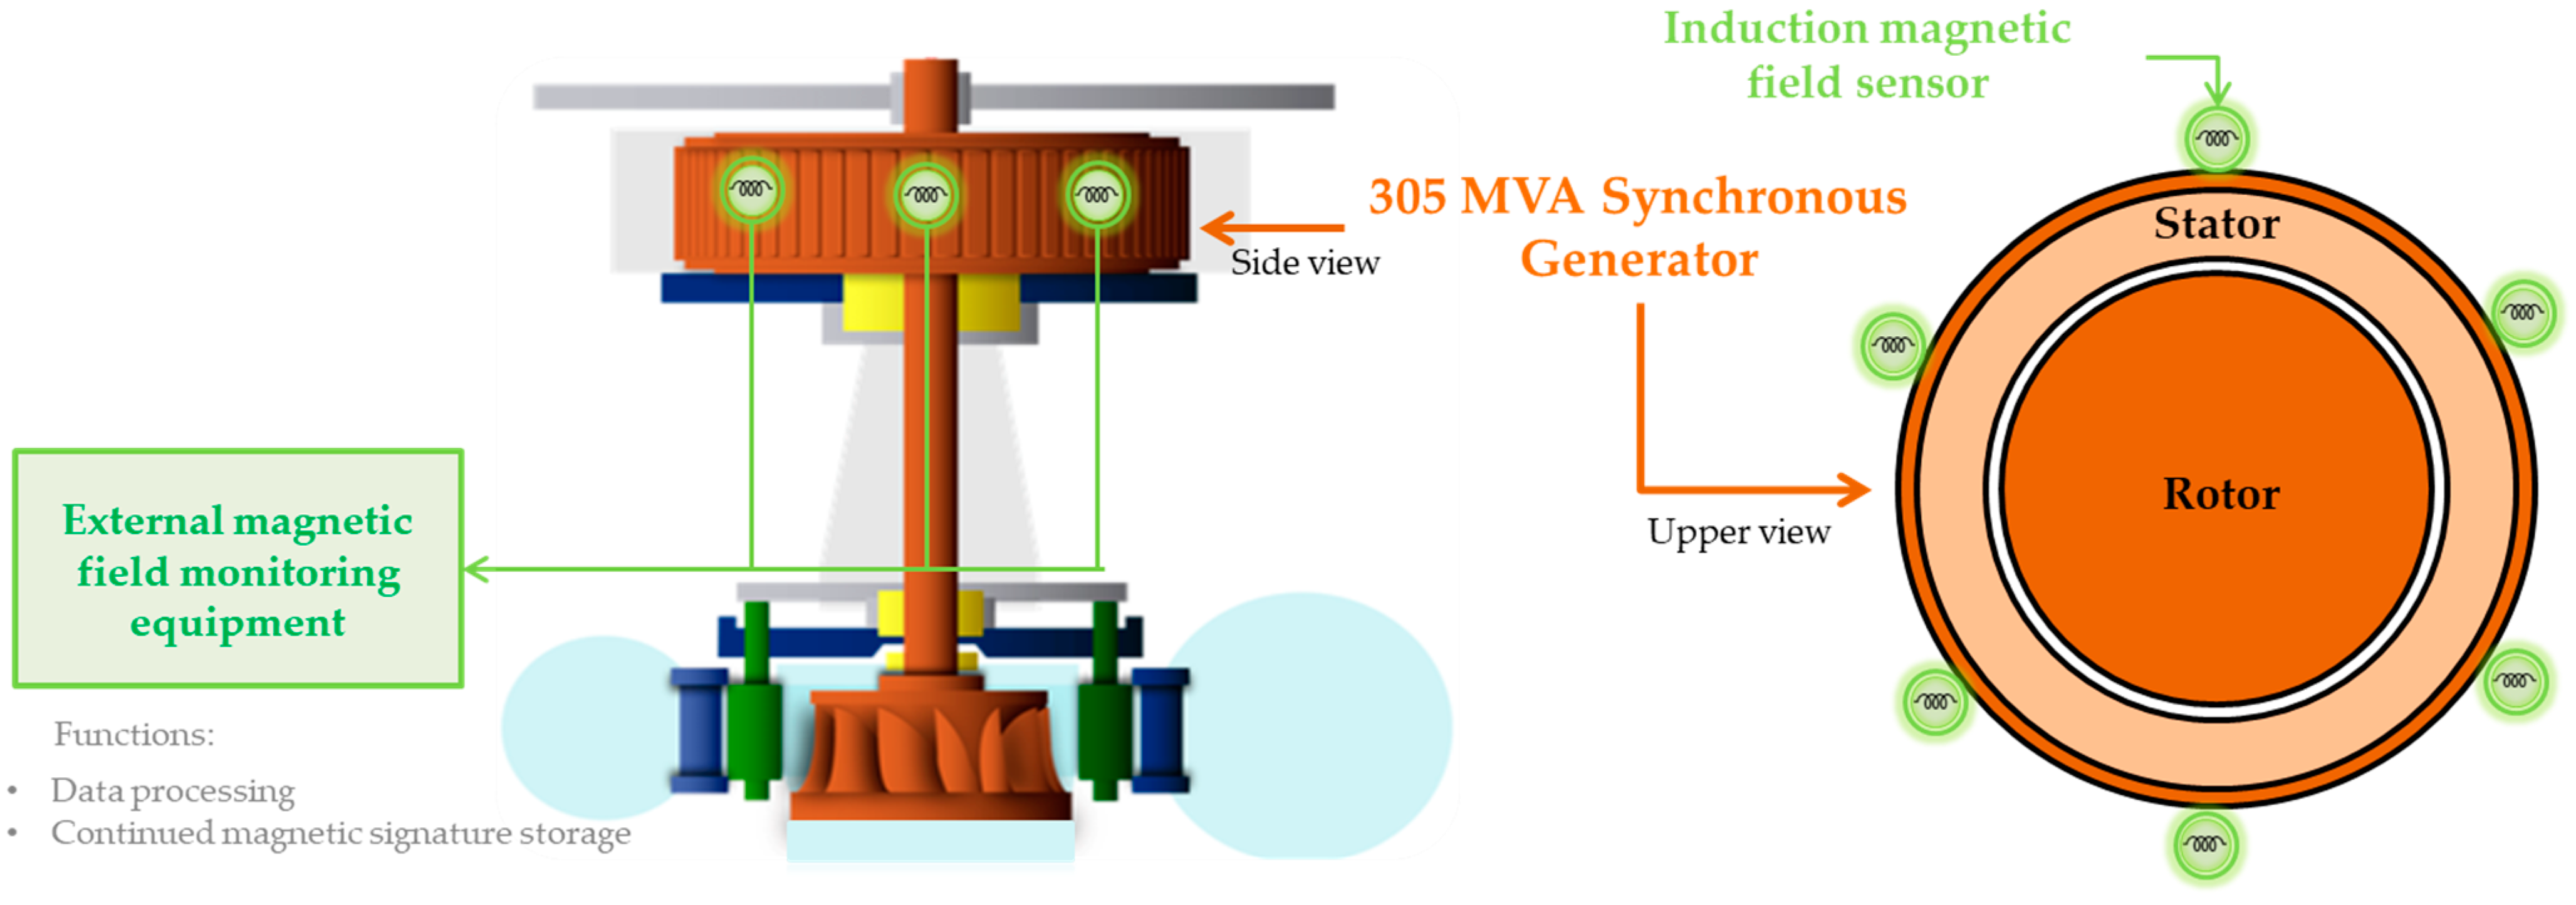
2.1. Monitoring Principle
2.2. External Magnetic Field Measurement and Magnetic Signature Processing
3. Statistical Processing Method for Automatic Fault Detection in SGs
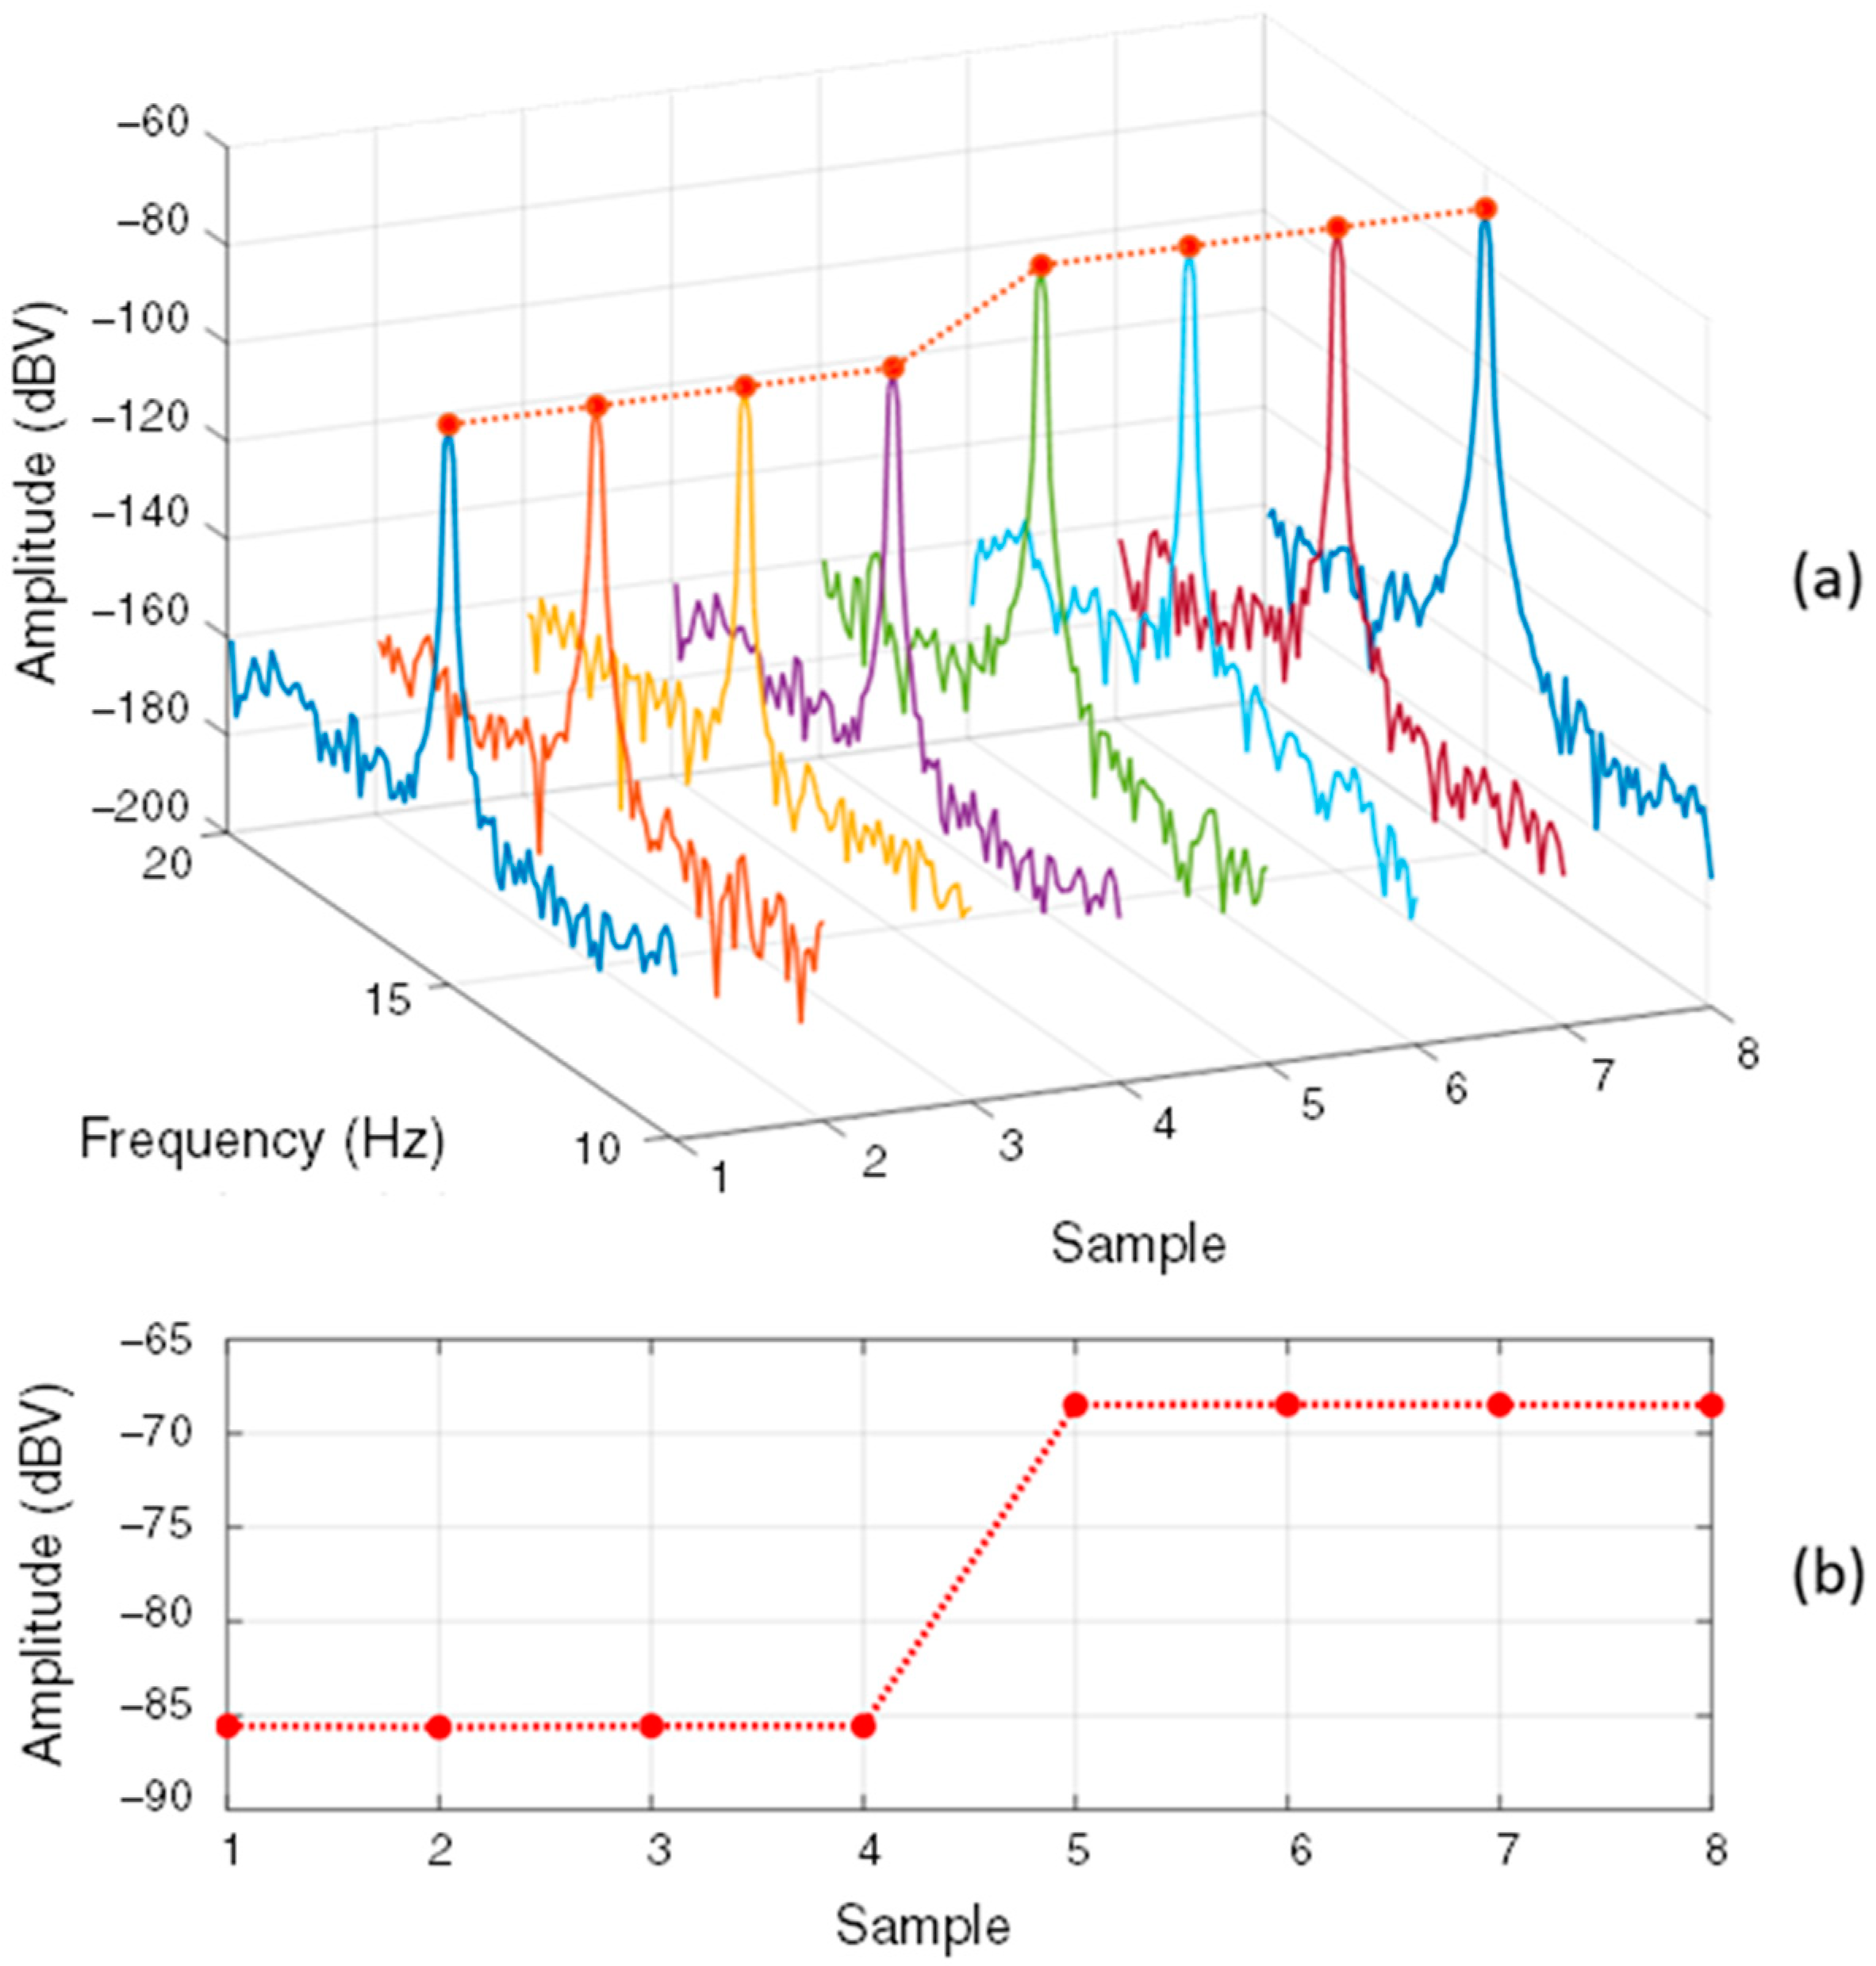
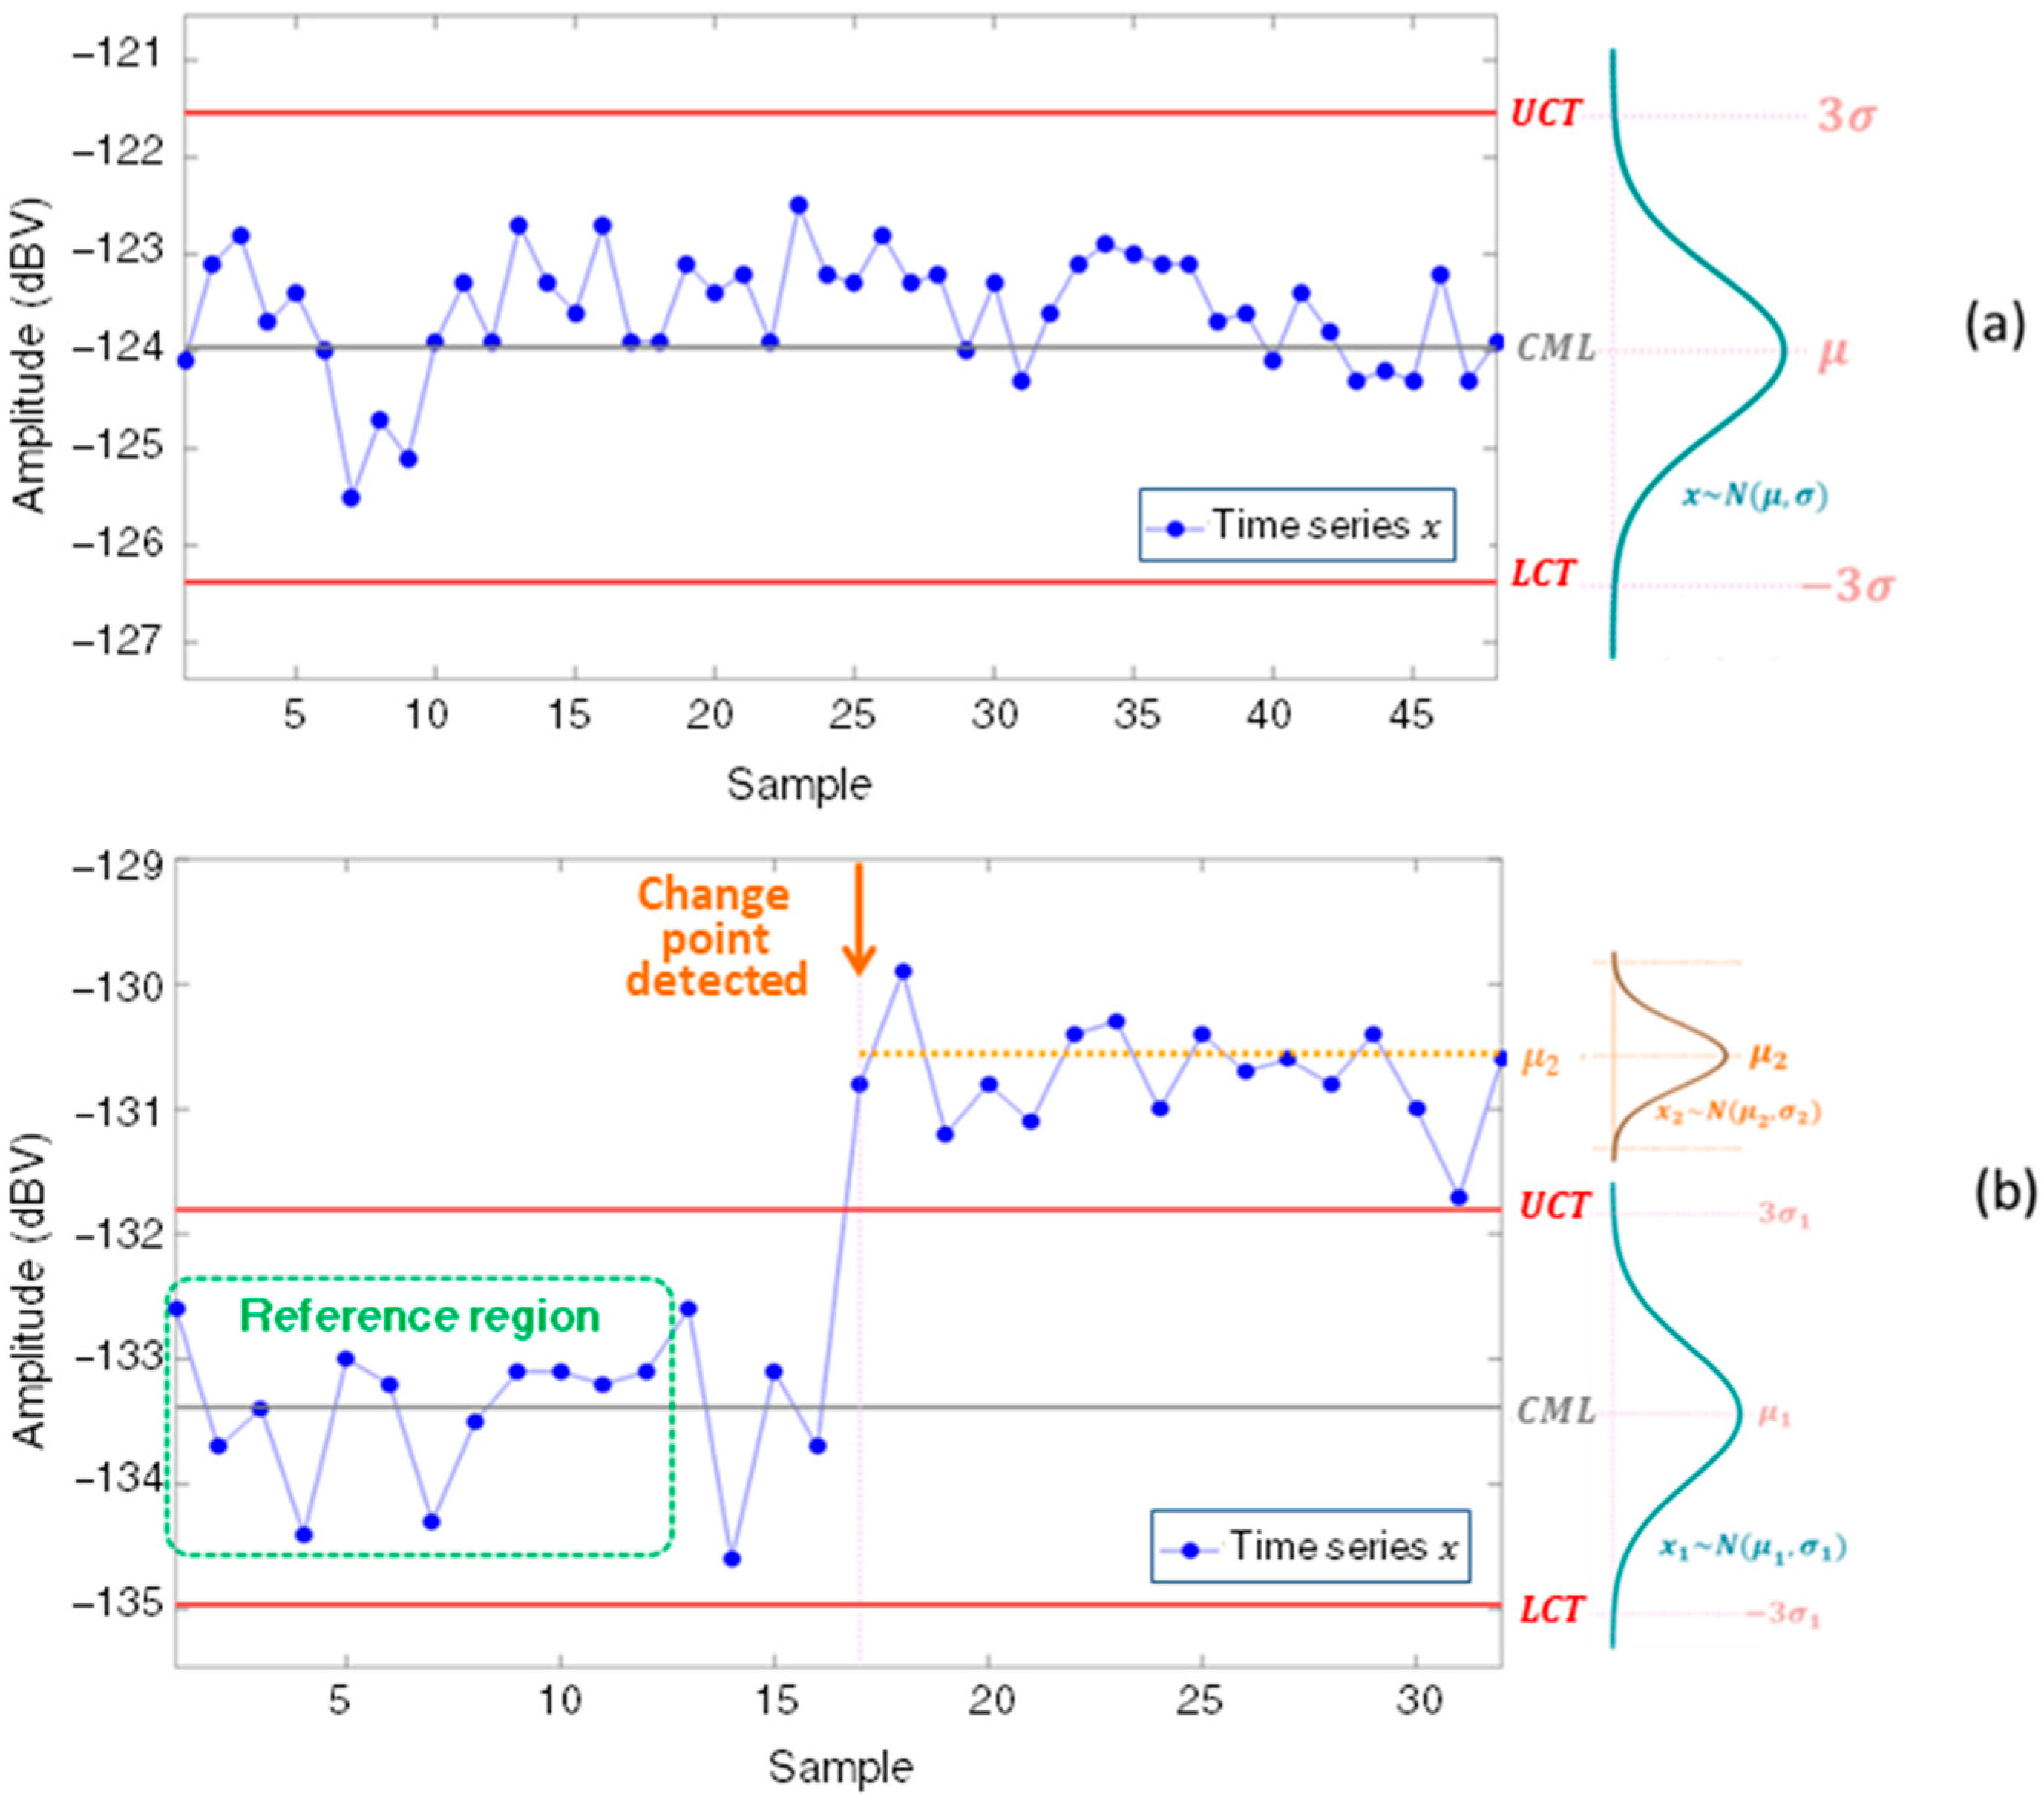
3.1. Anomaly Detection Method
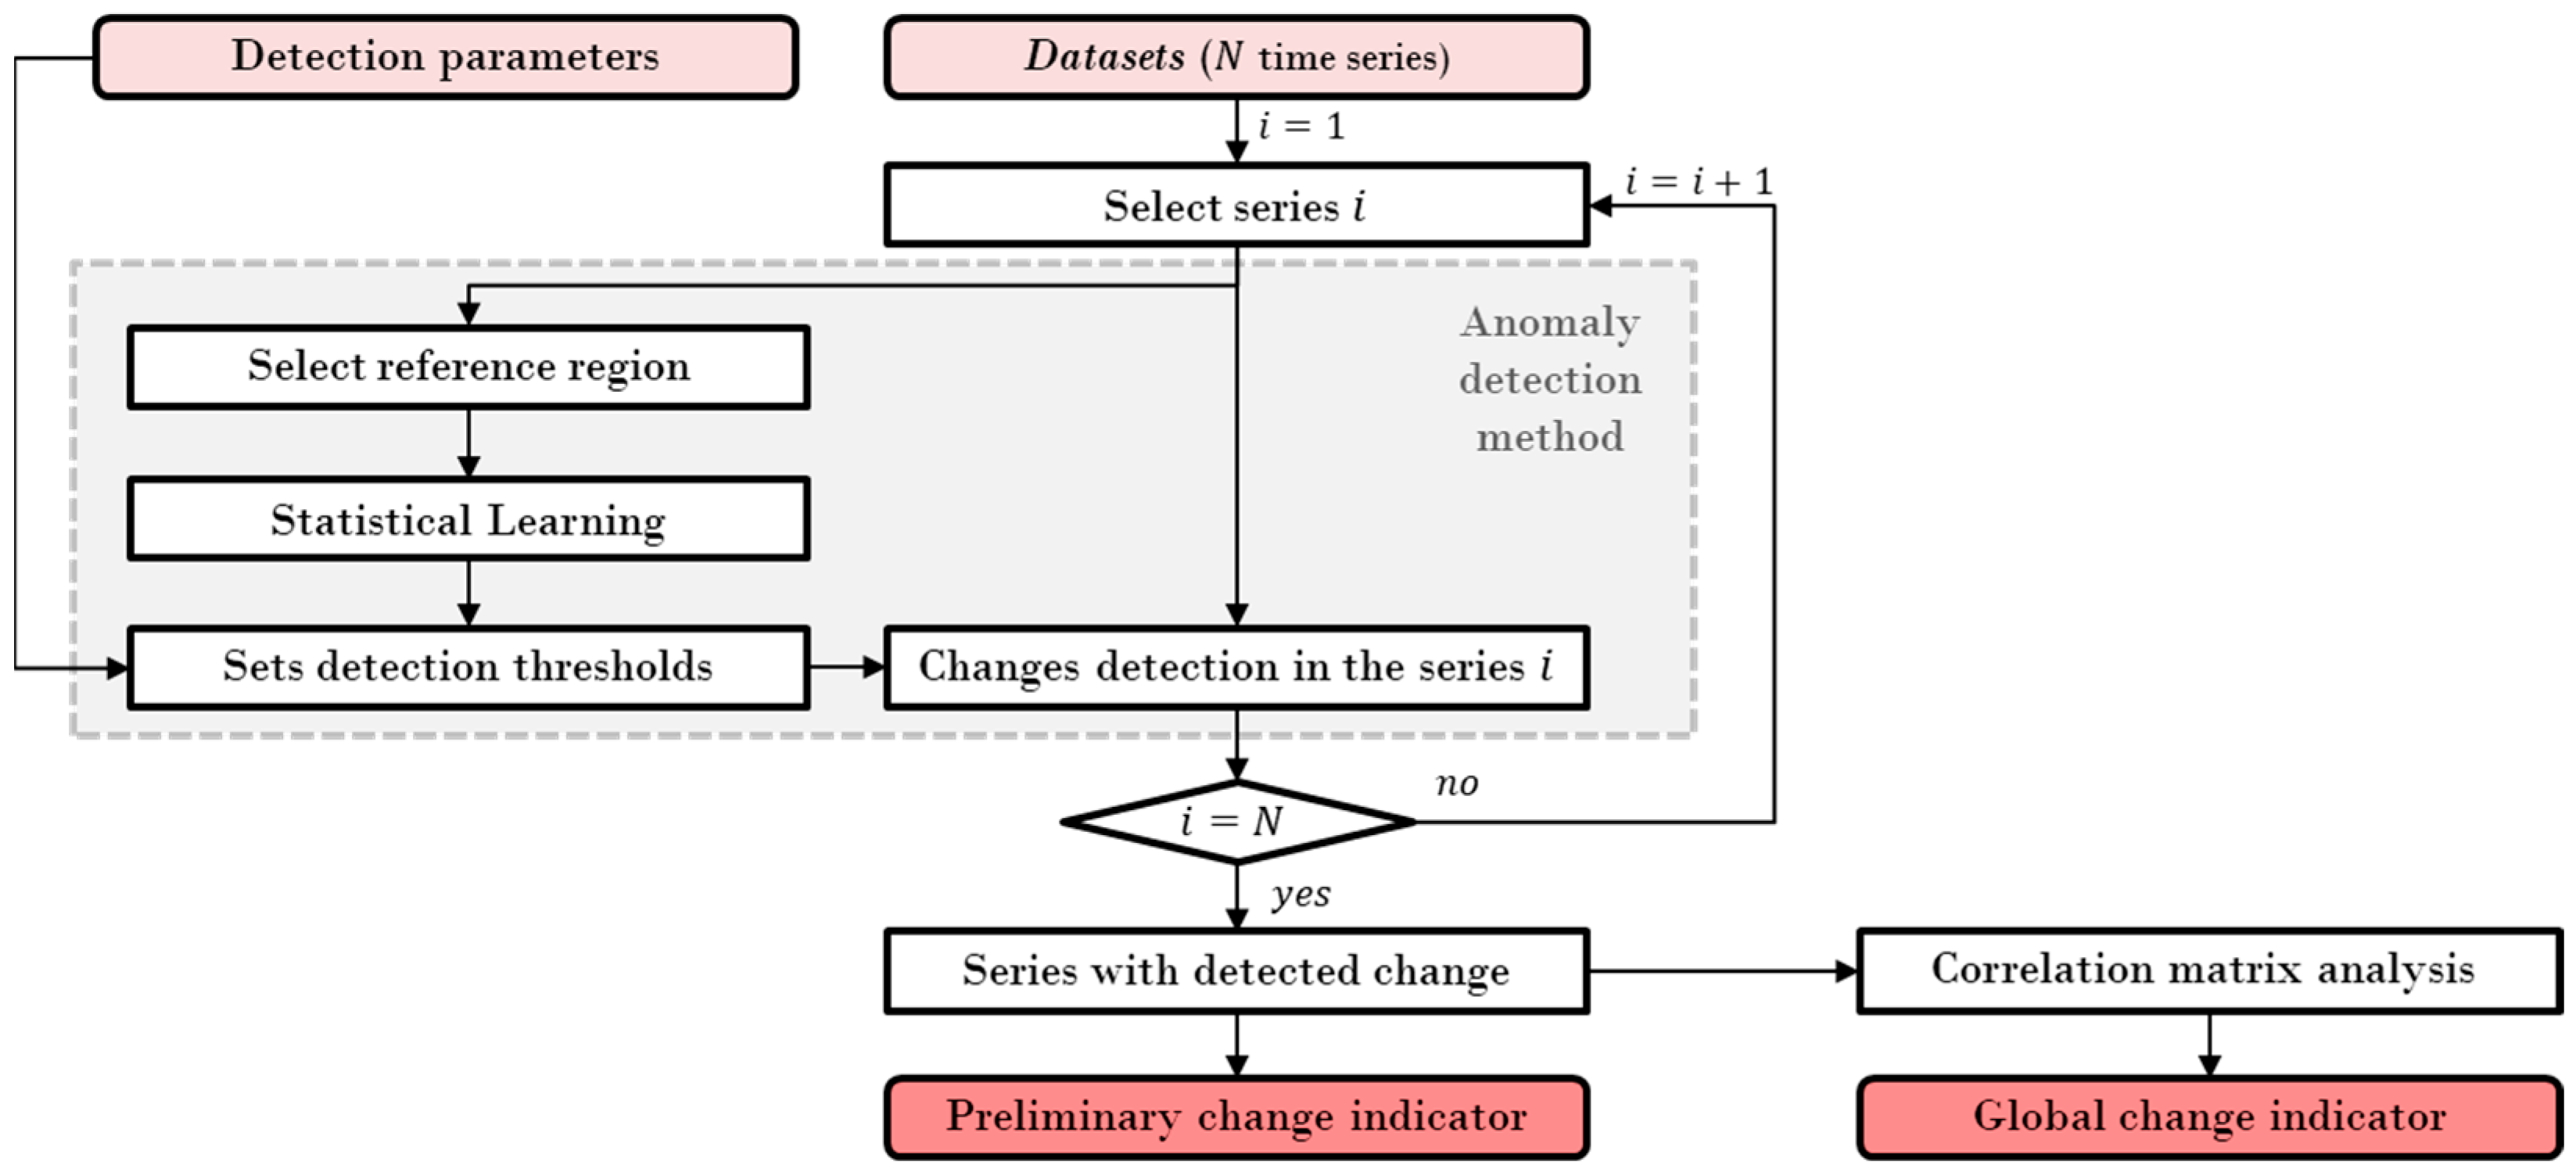
3.2. Algorithm for the Evaluation of Each Sensor
4. Experimental Results and Discussion
4.1. Datasets Obtained in the Laboratory
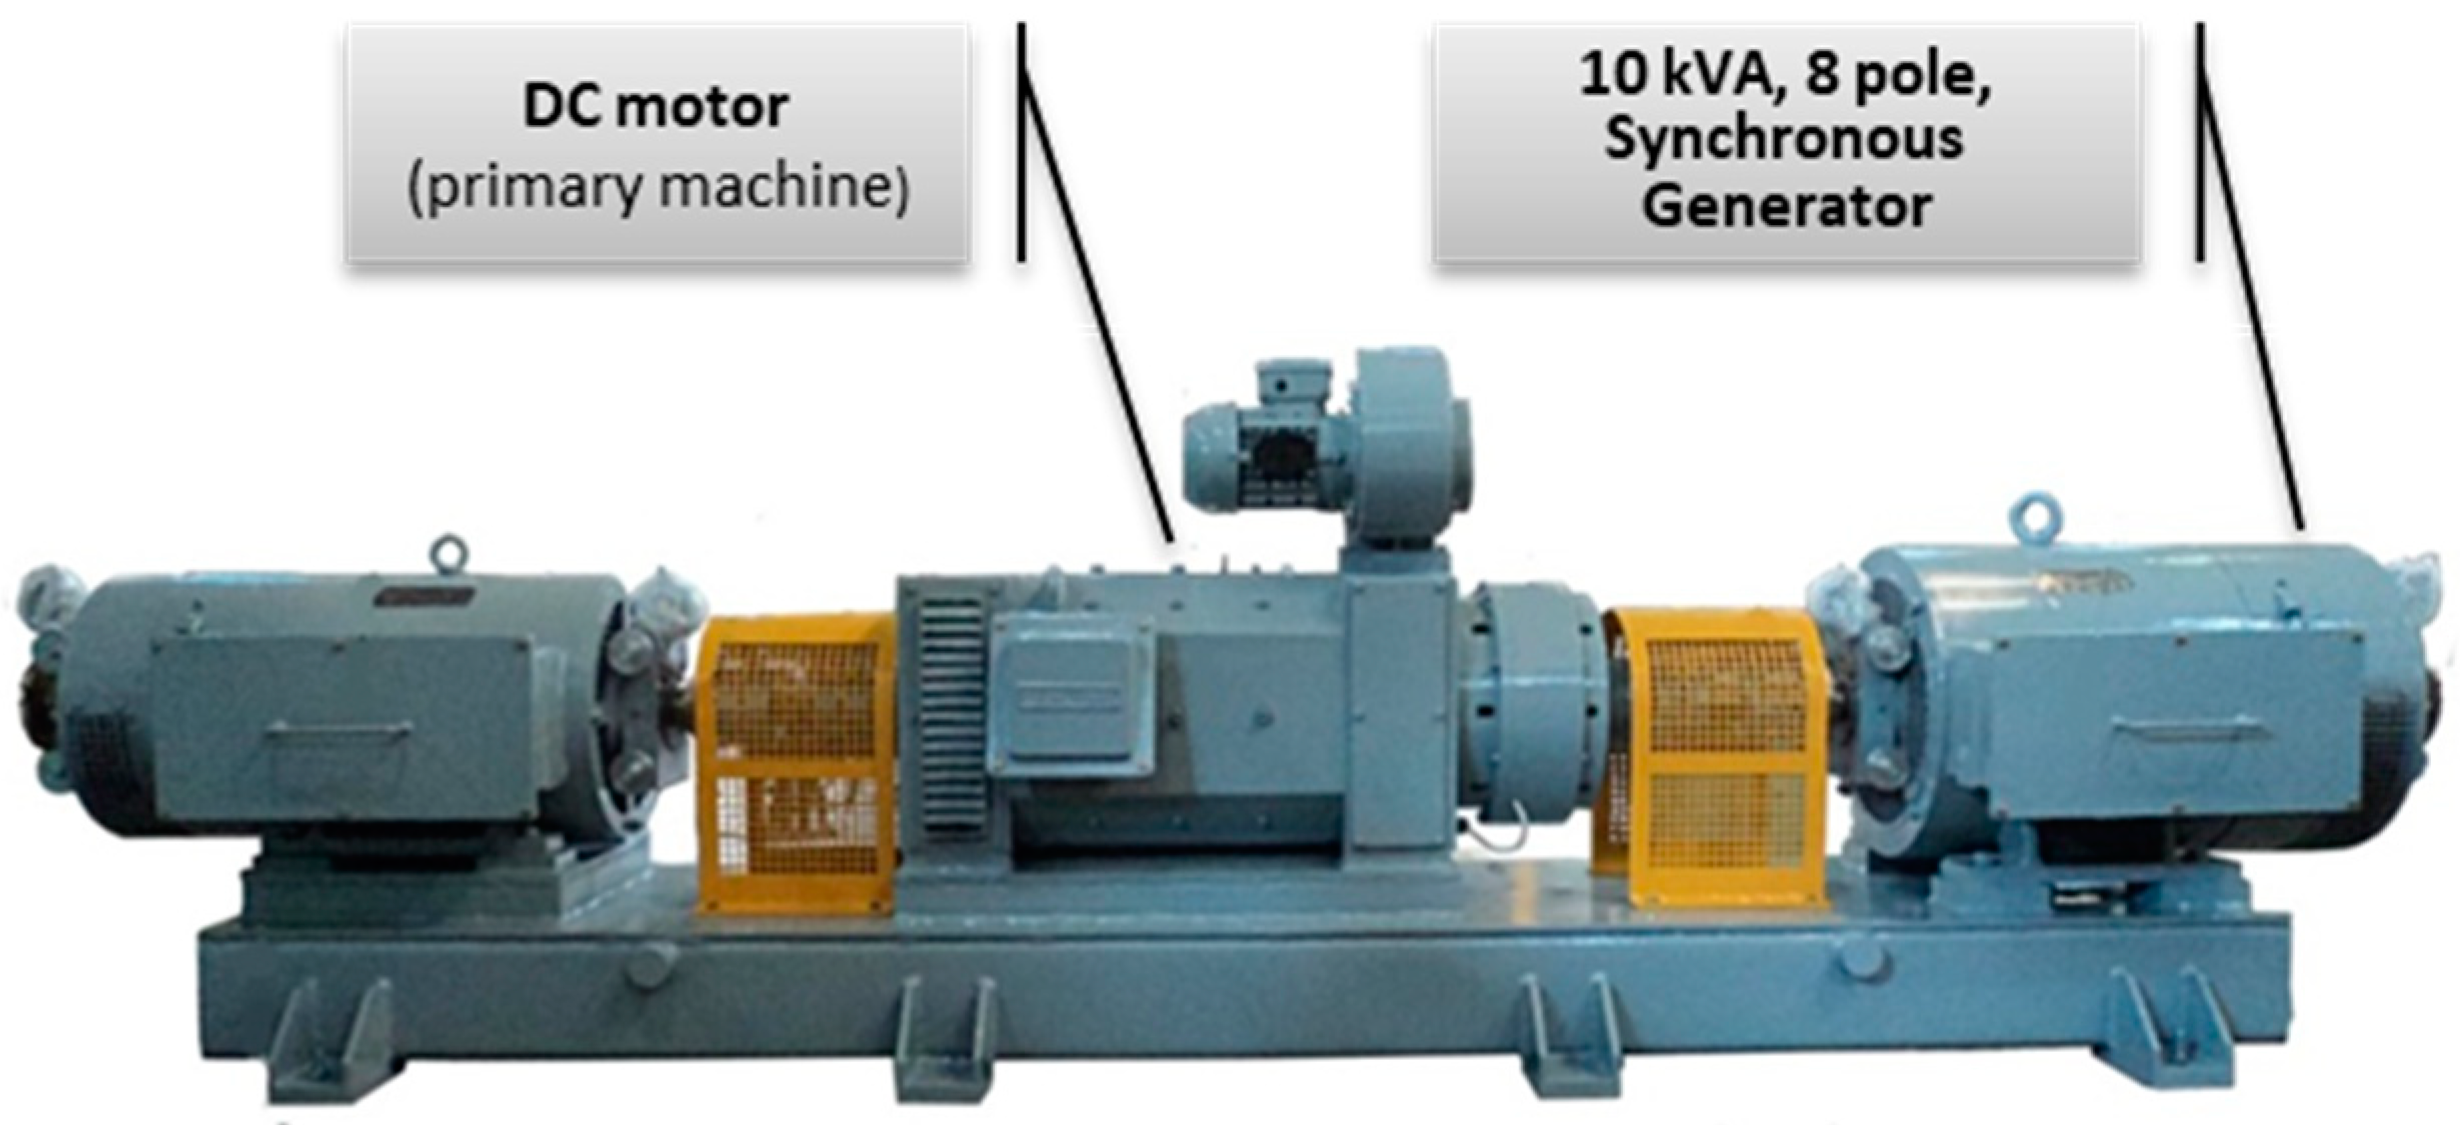
4.1.1. Experimental Bench and Evaluated Faults
- Removal of 20% or 50% of the turns from a rotor pole;
- Removal of 50% of the turns from a stator pole in one phase;
- Short-circuit of 17% of the turns of a stator pole in one phase;
- Short-circuit of a set of stator core sheets.
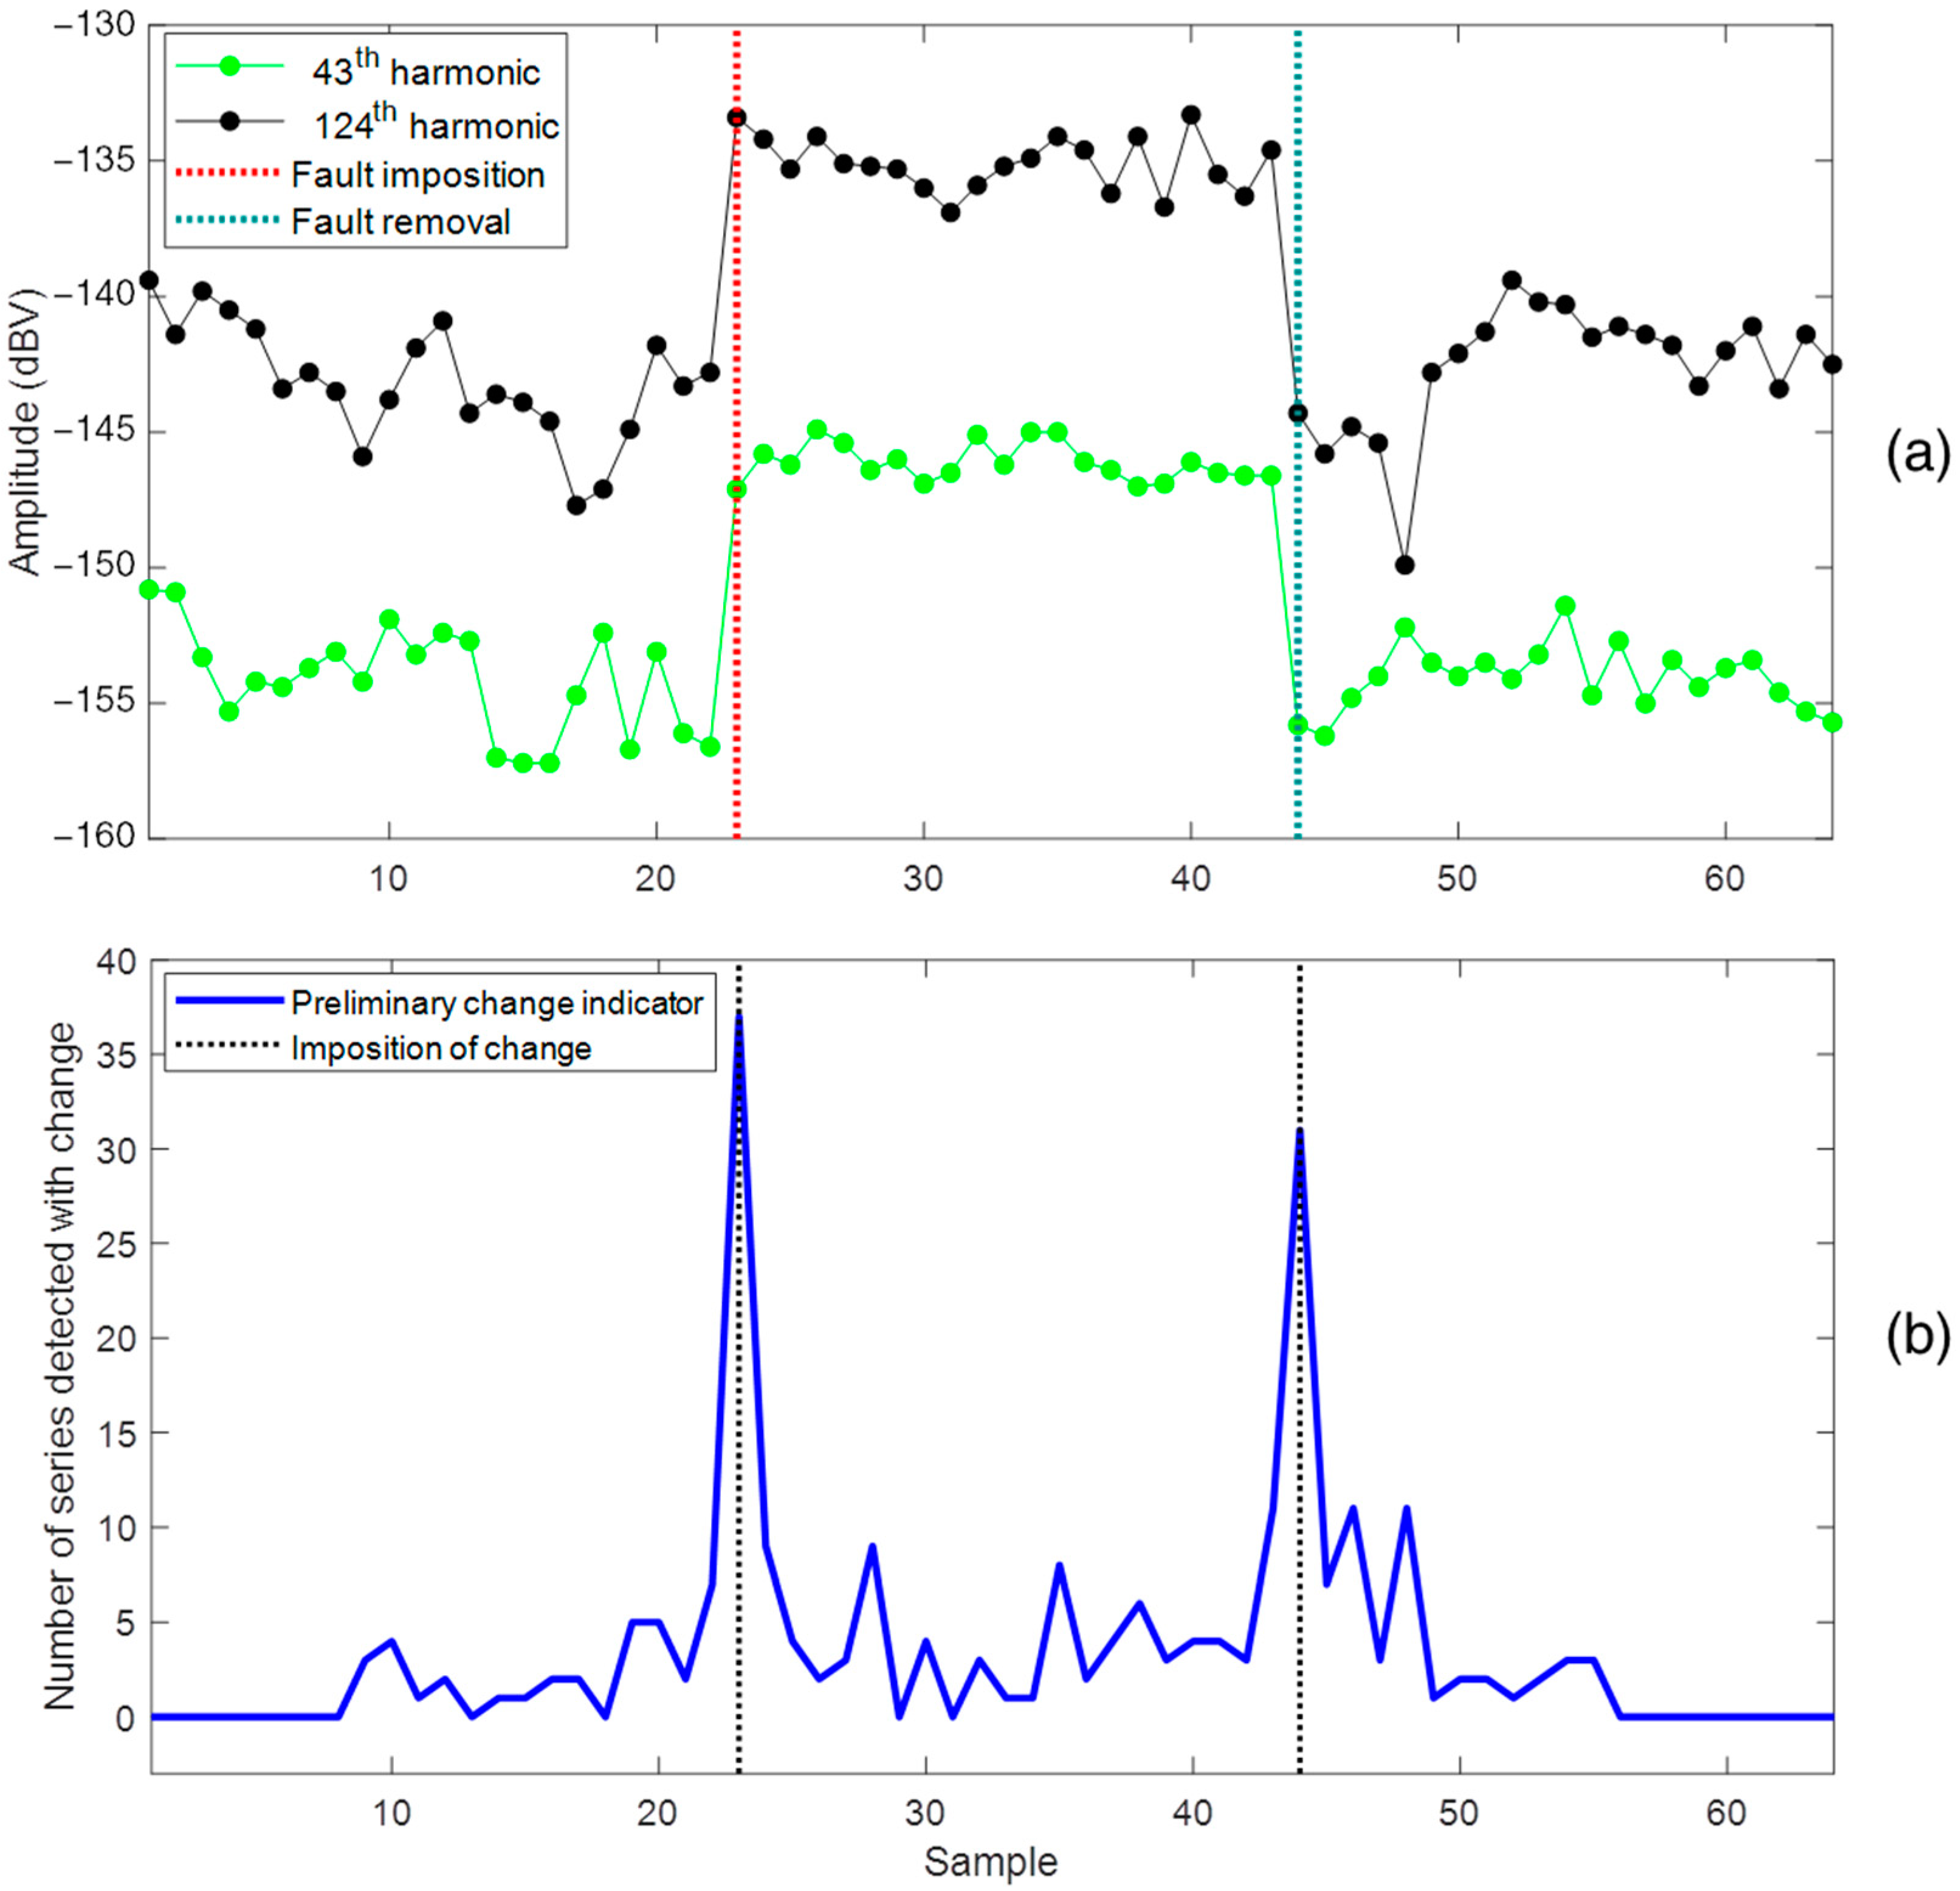
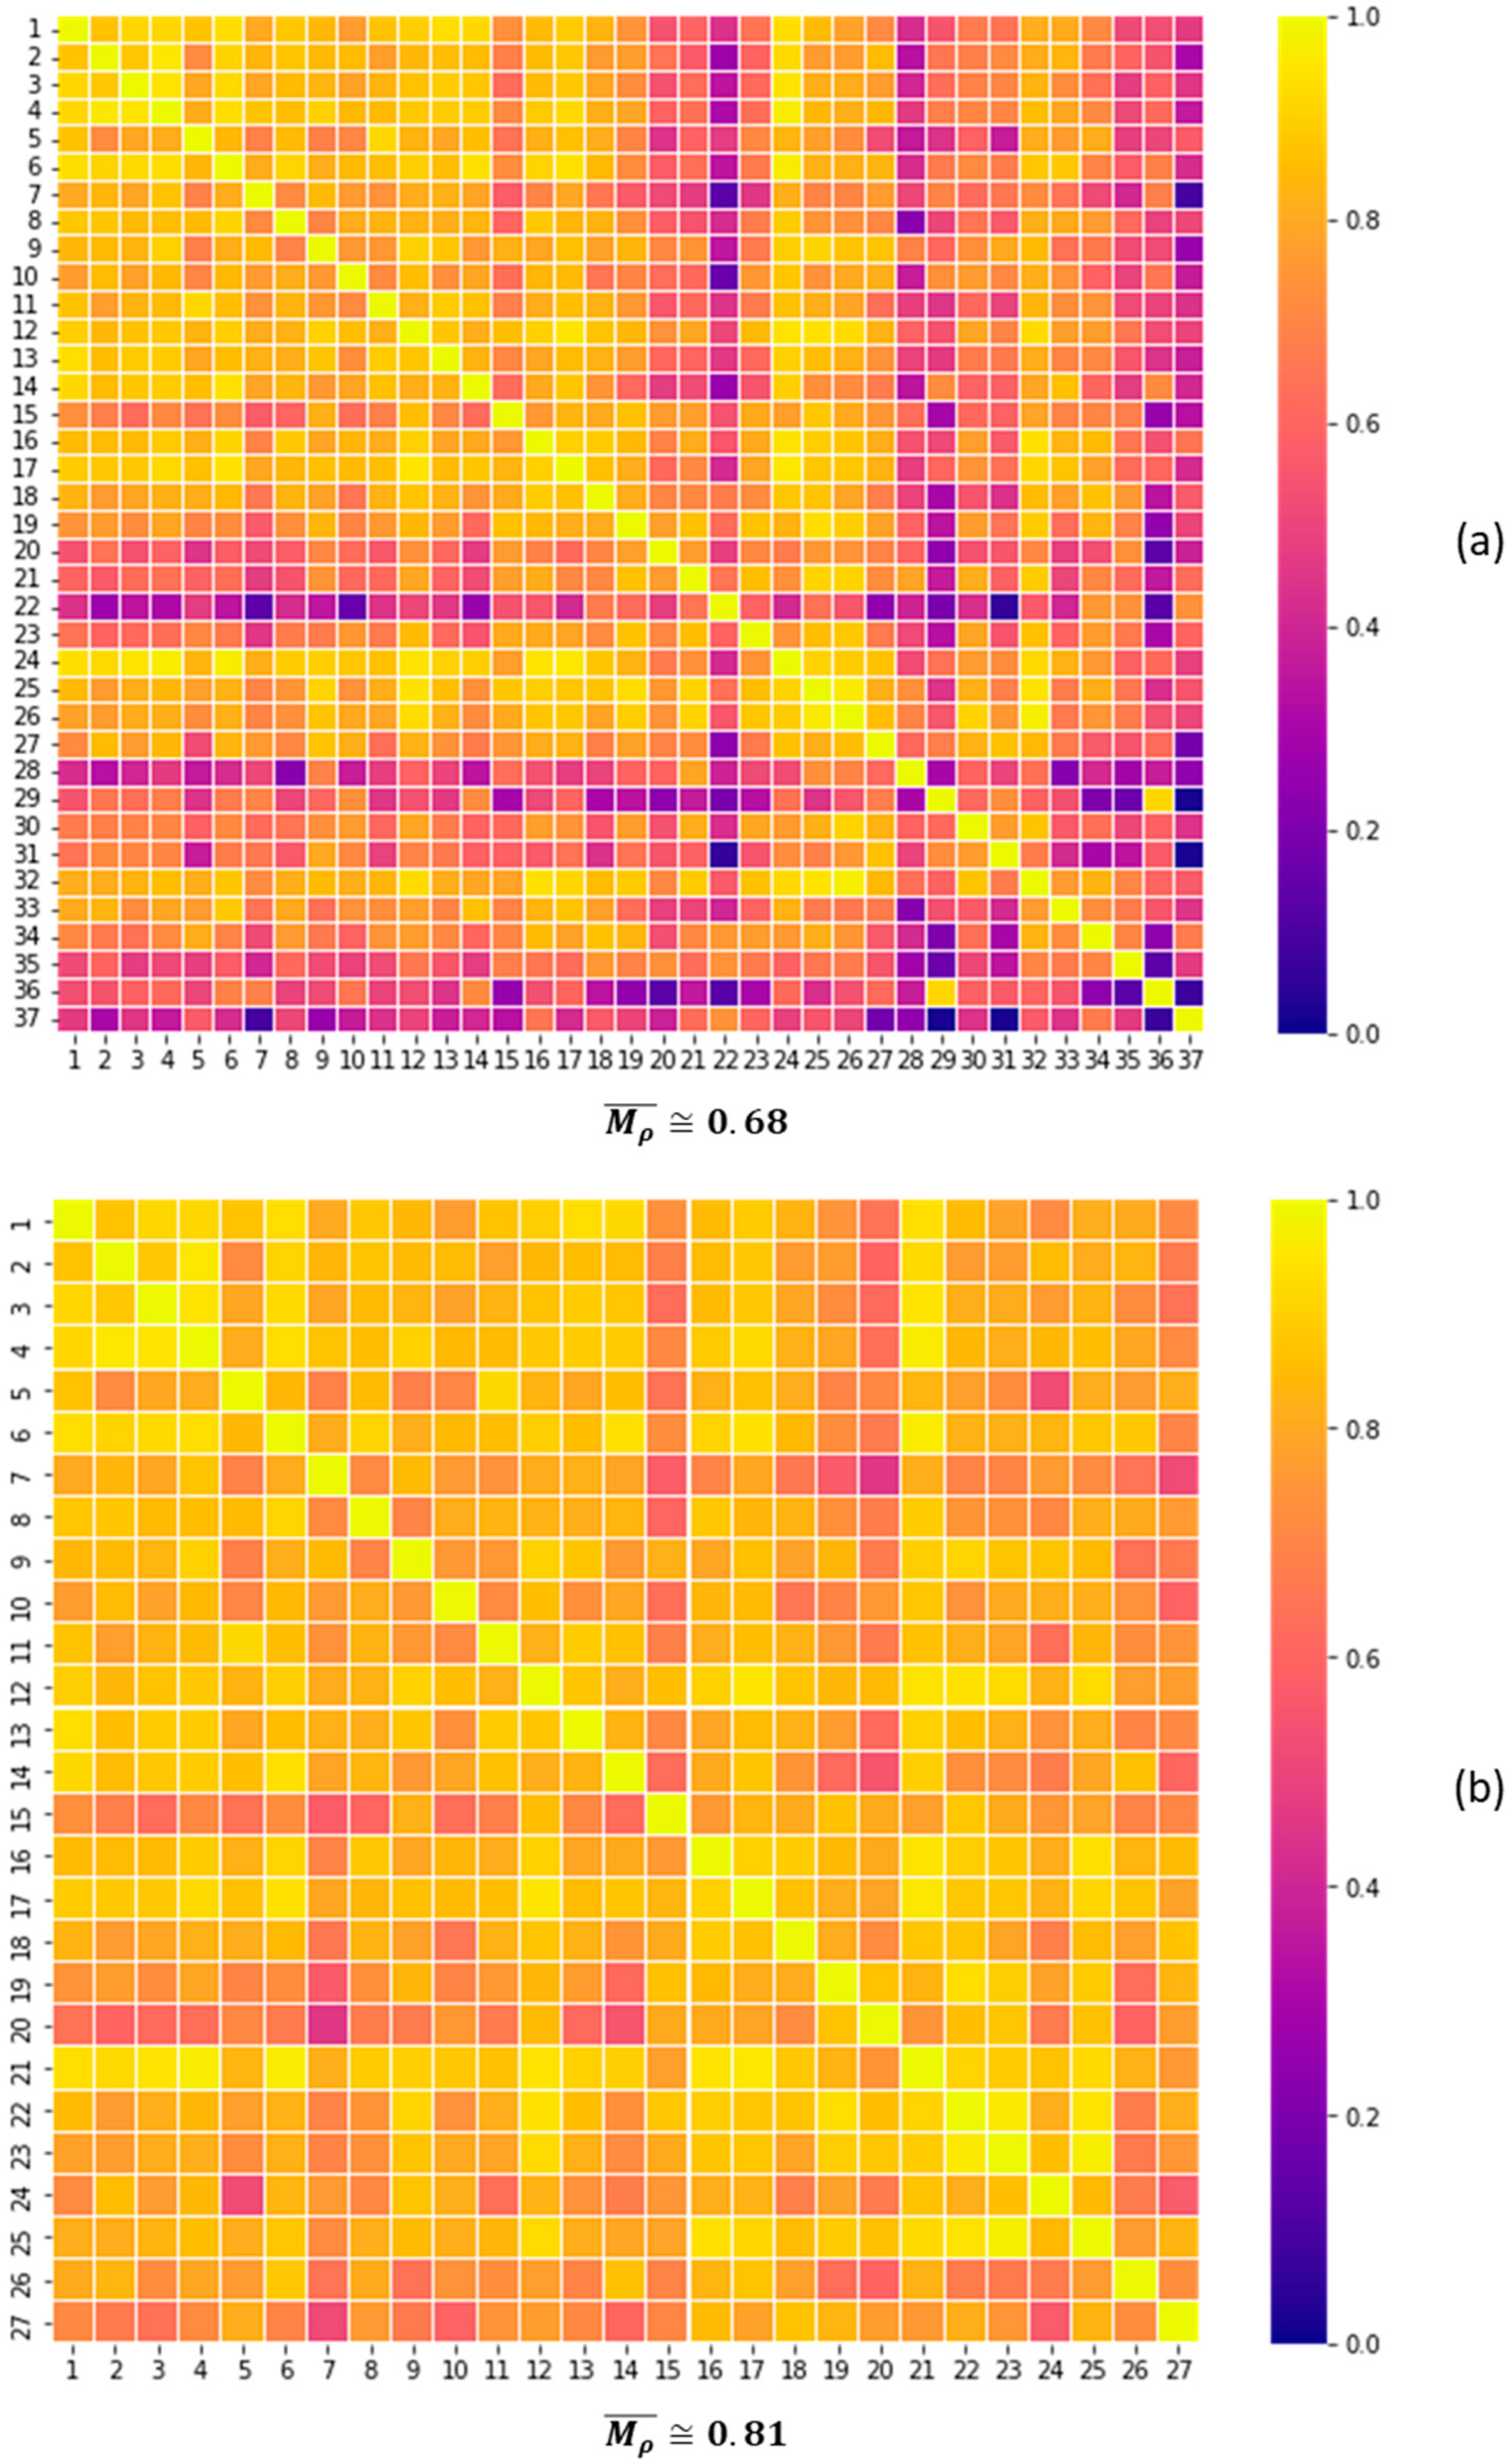
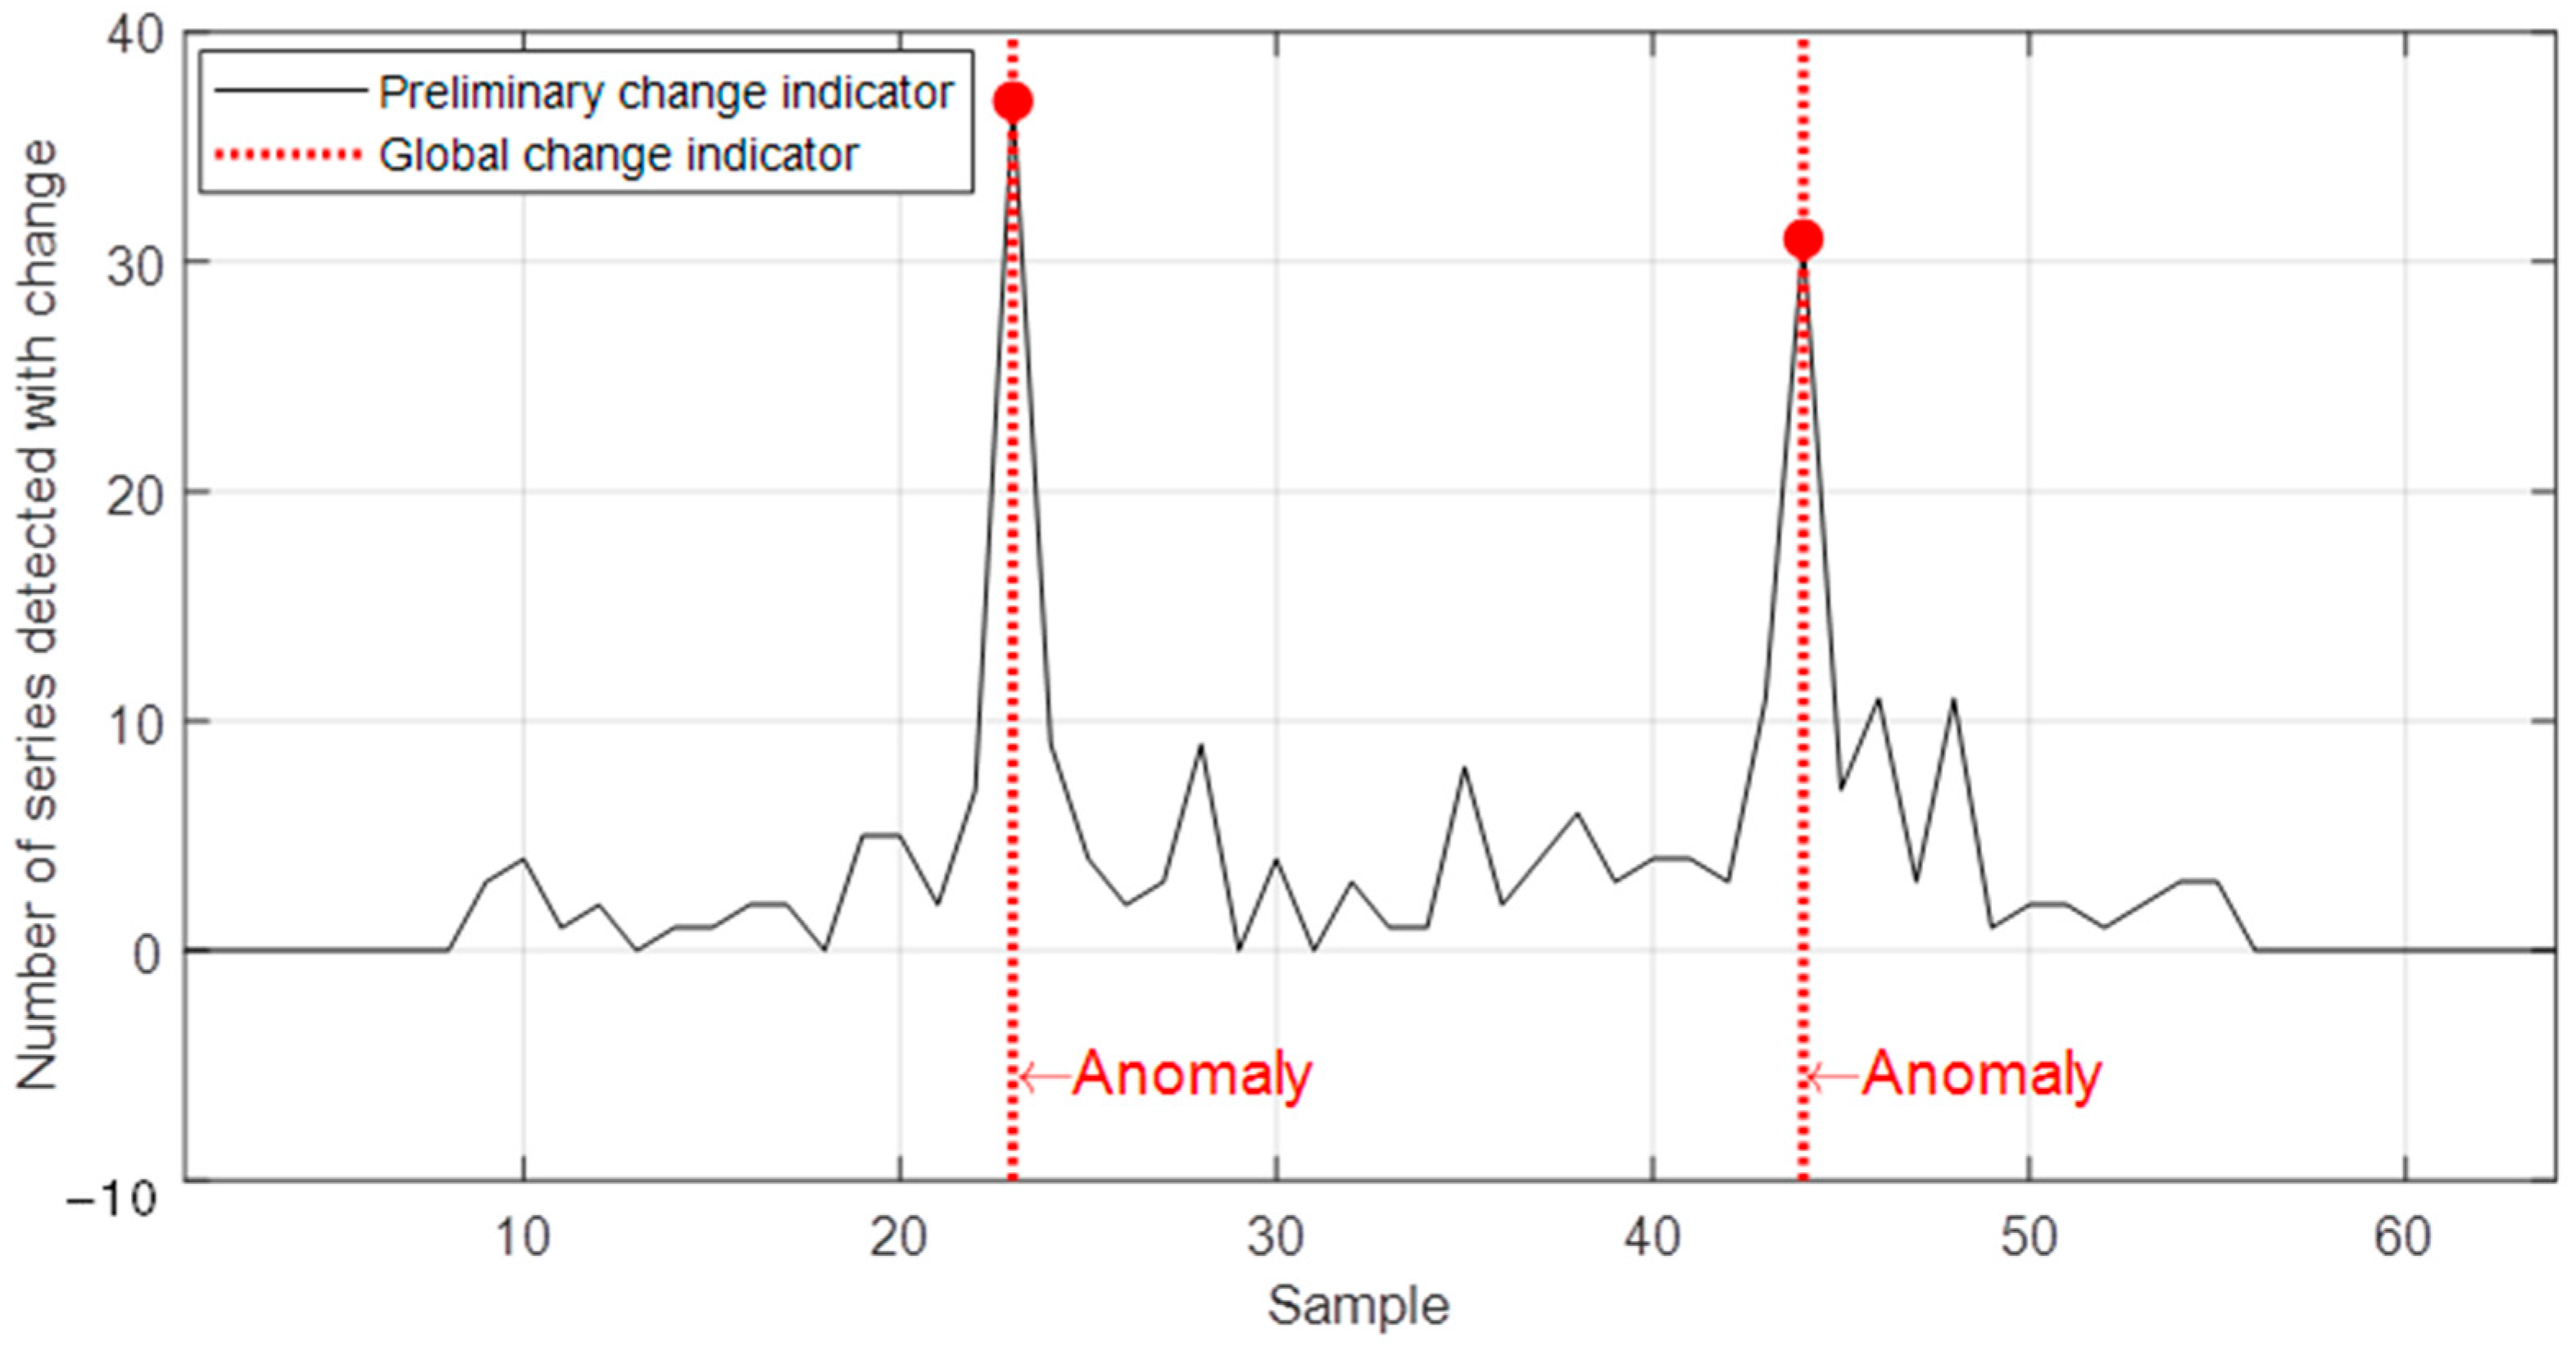
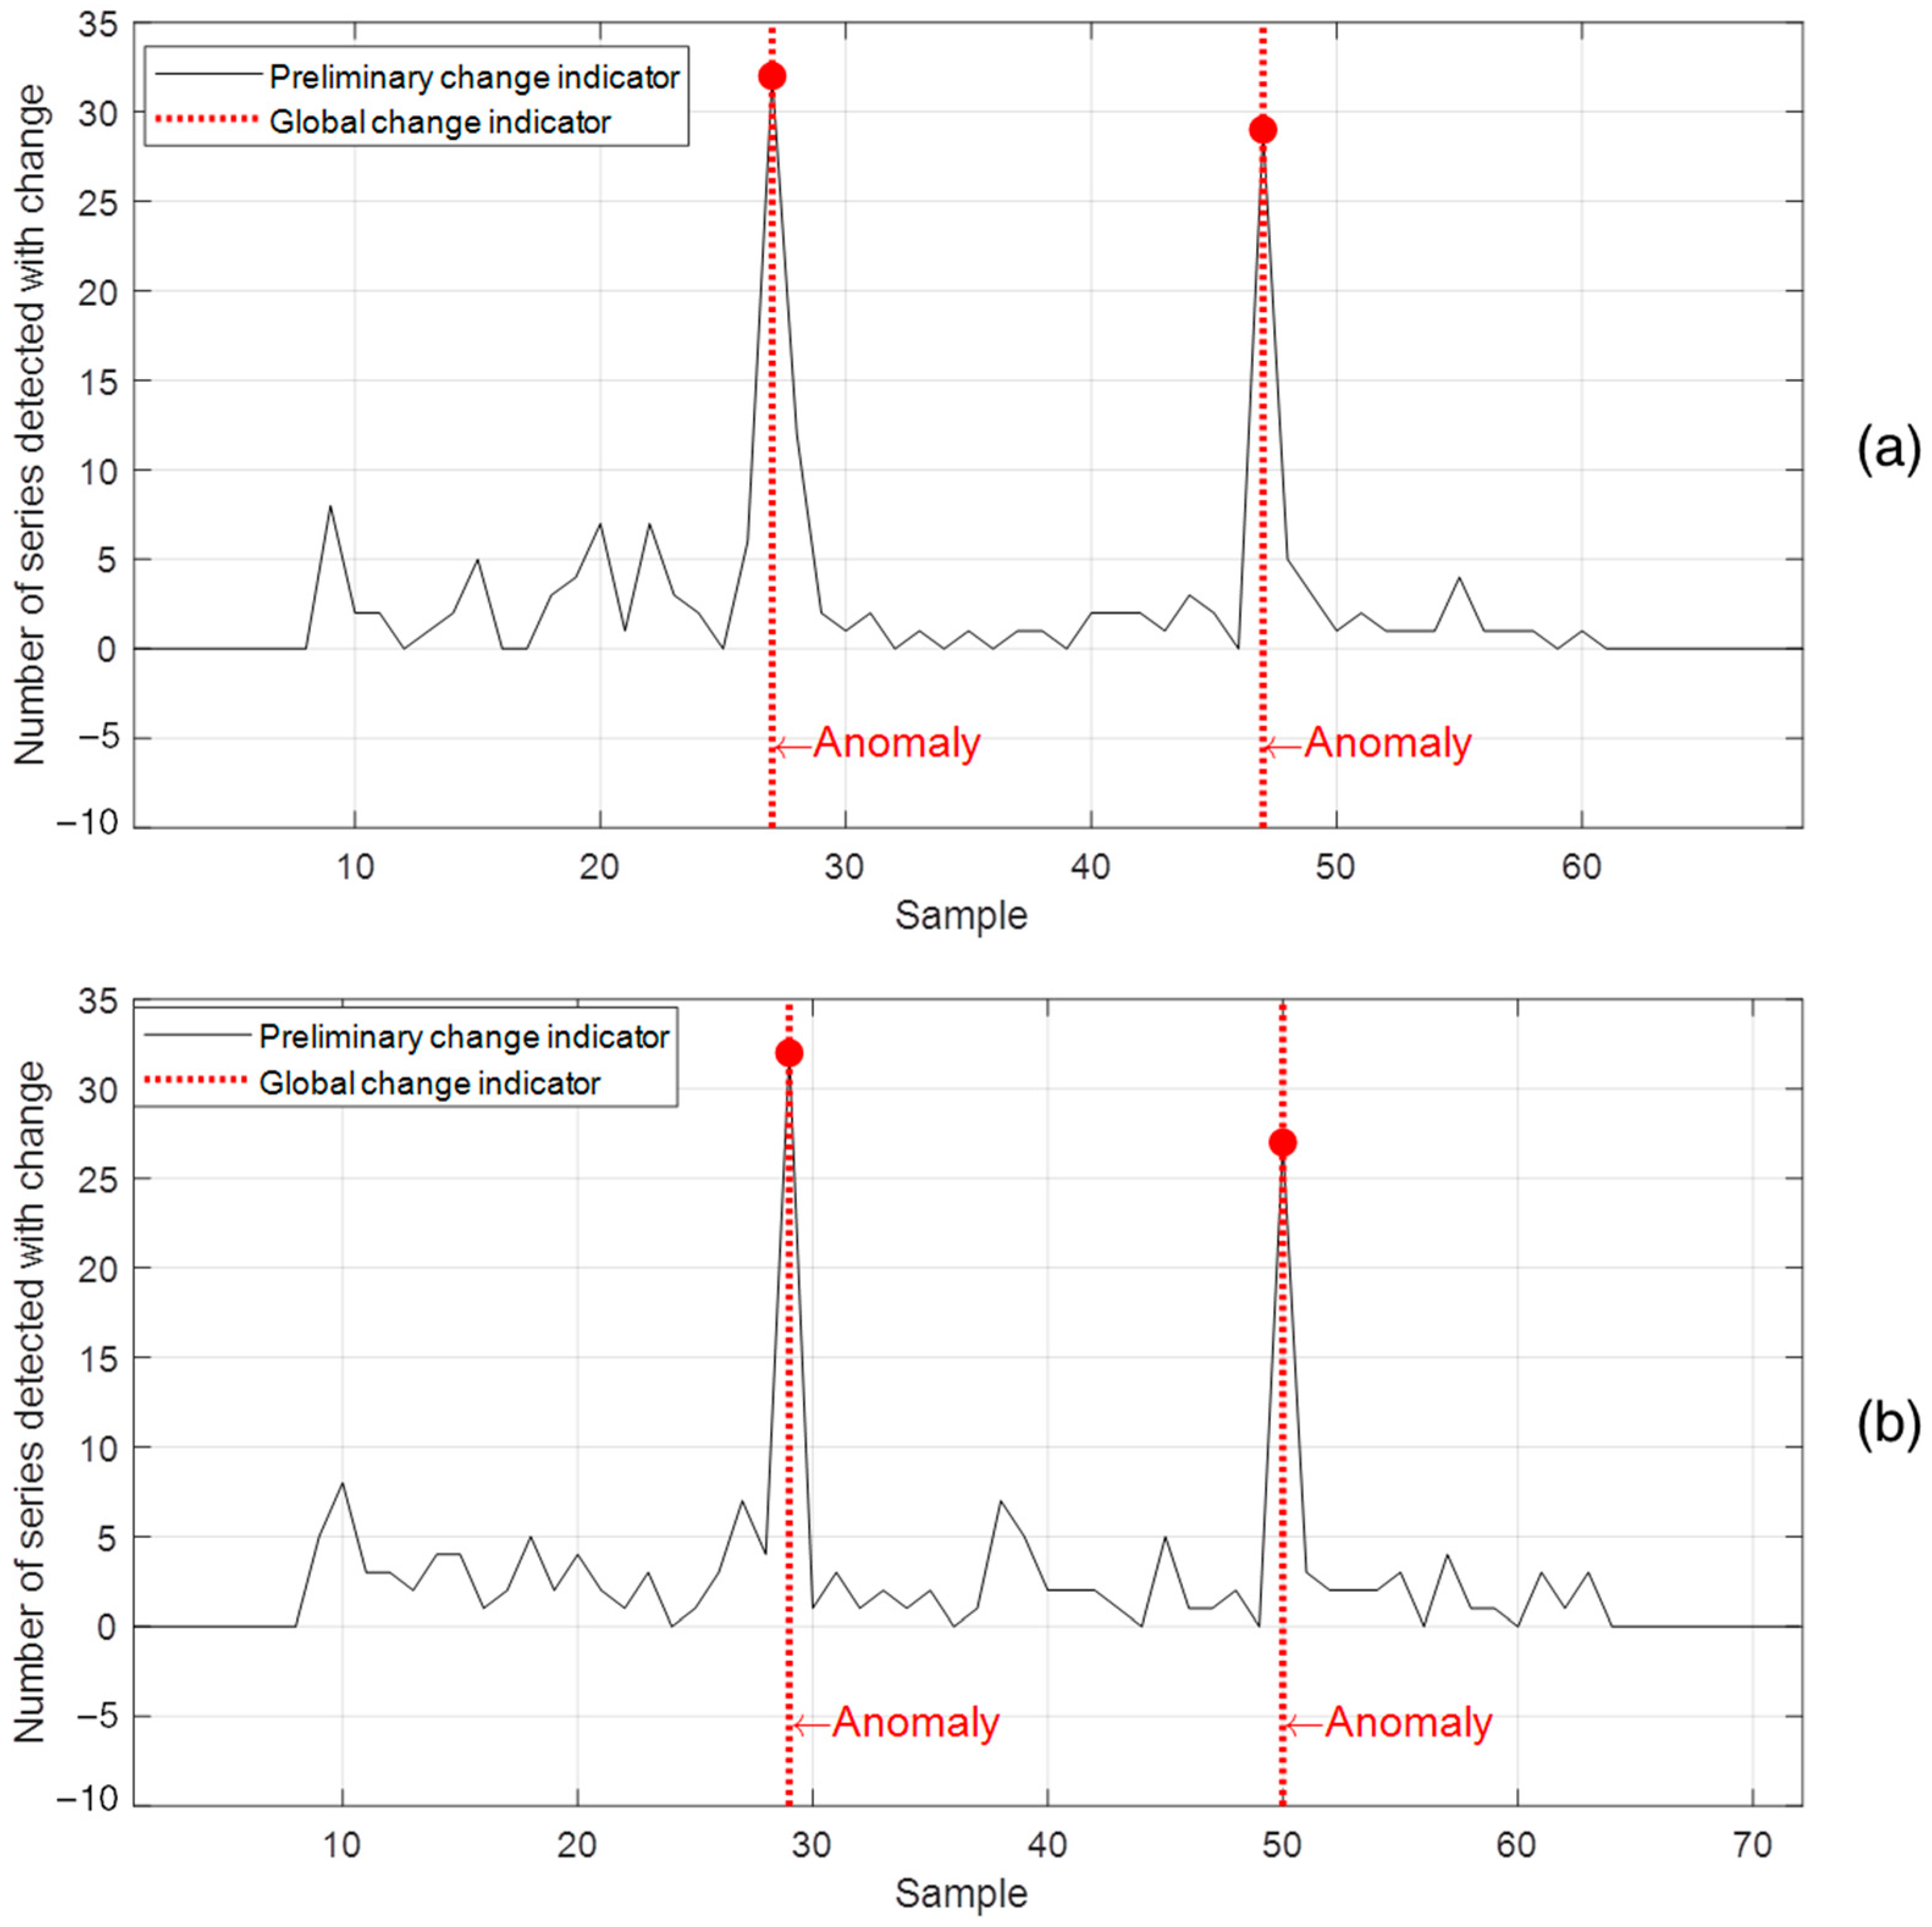
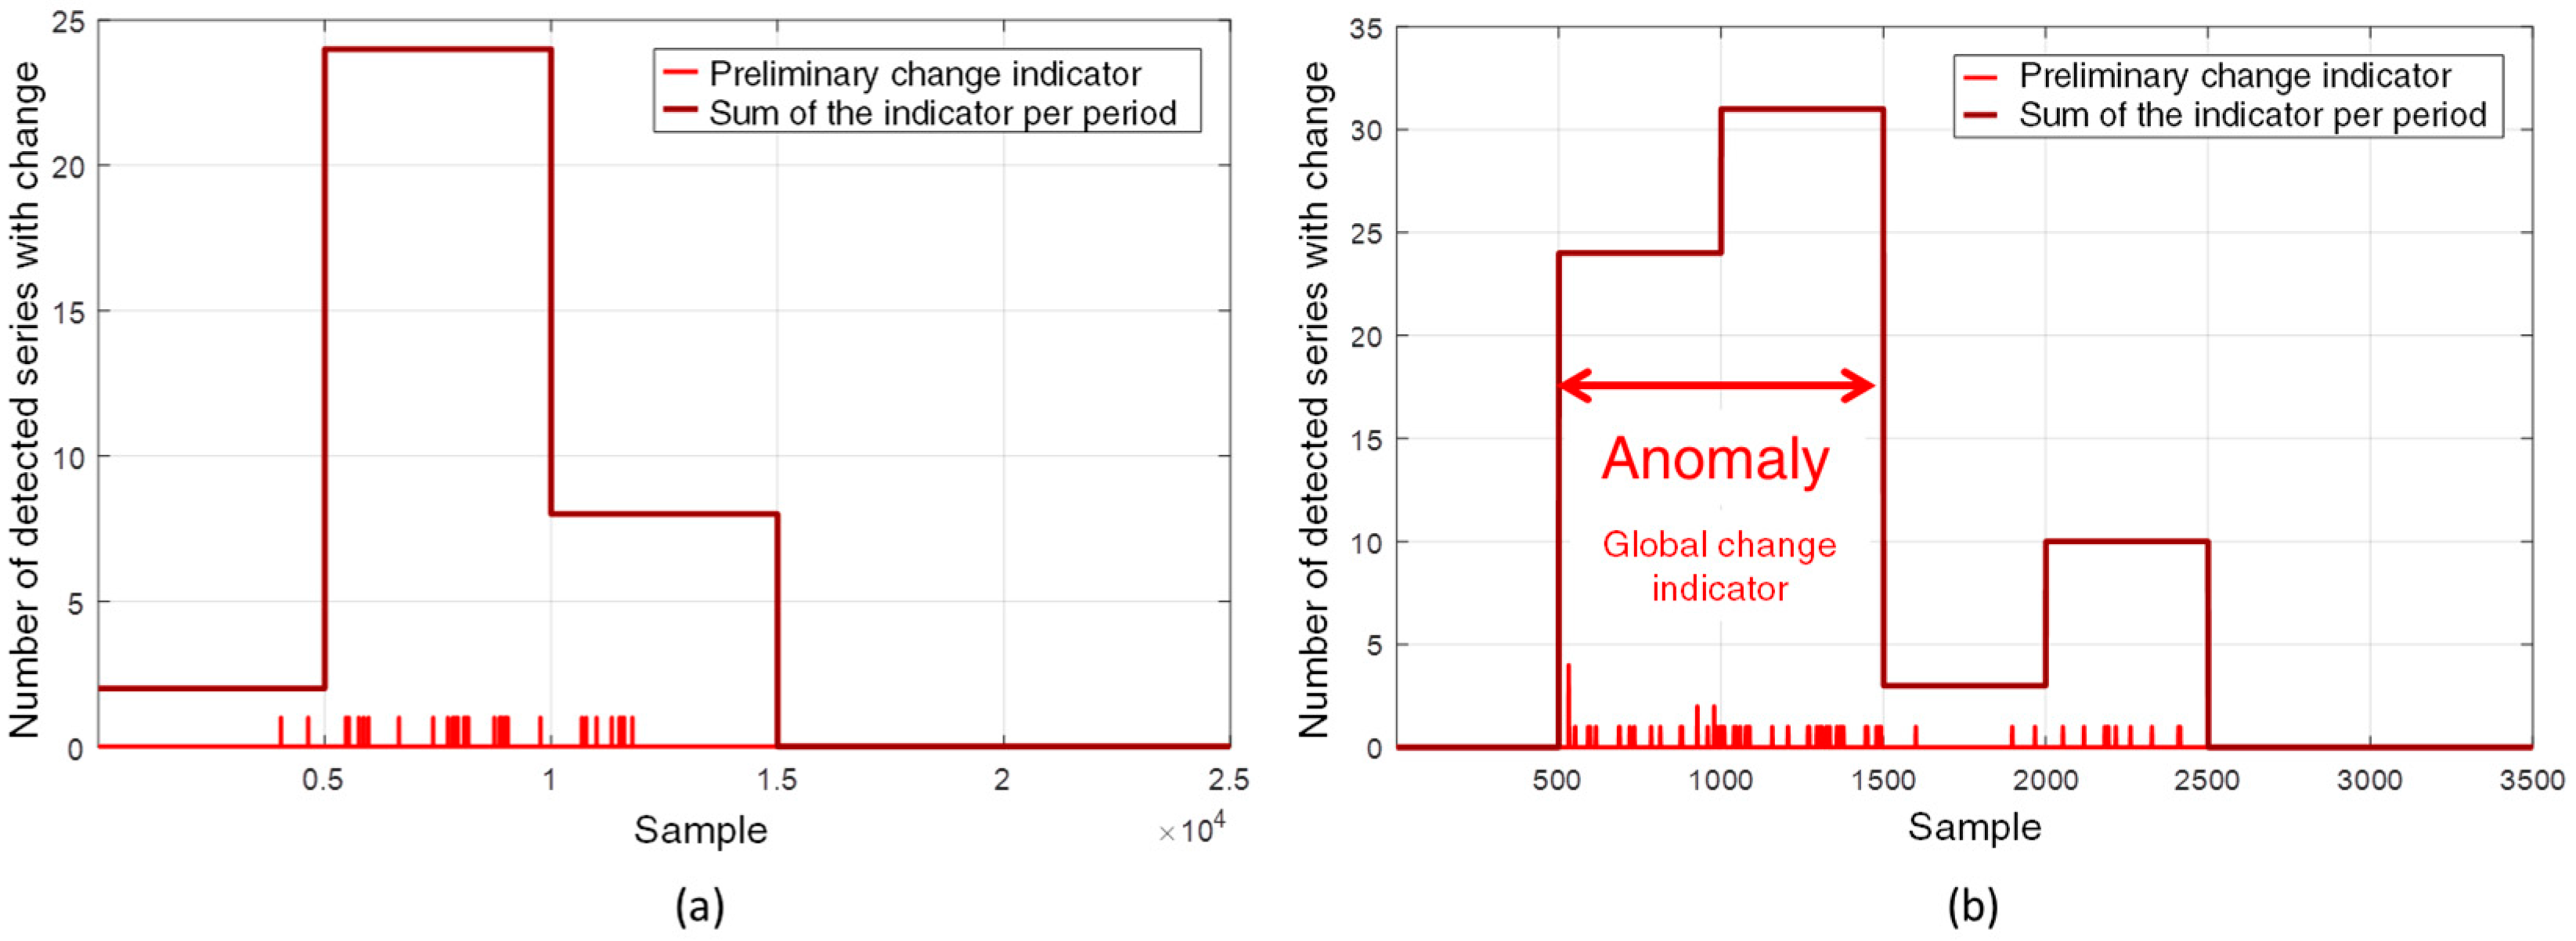
4.1.2. Application of the Proposed Algorithm to Experimental Data
4.2. Datasets Obtained from a SG of a Hydroelectric Power Plant
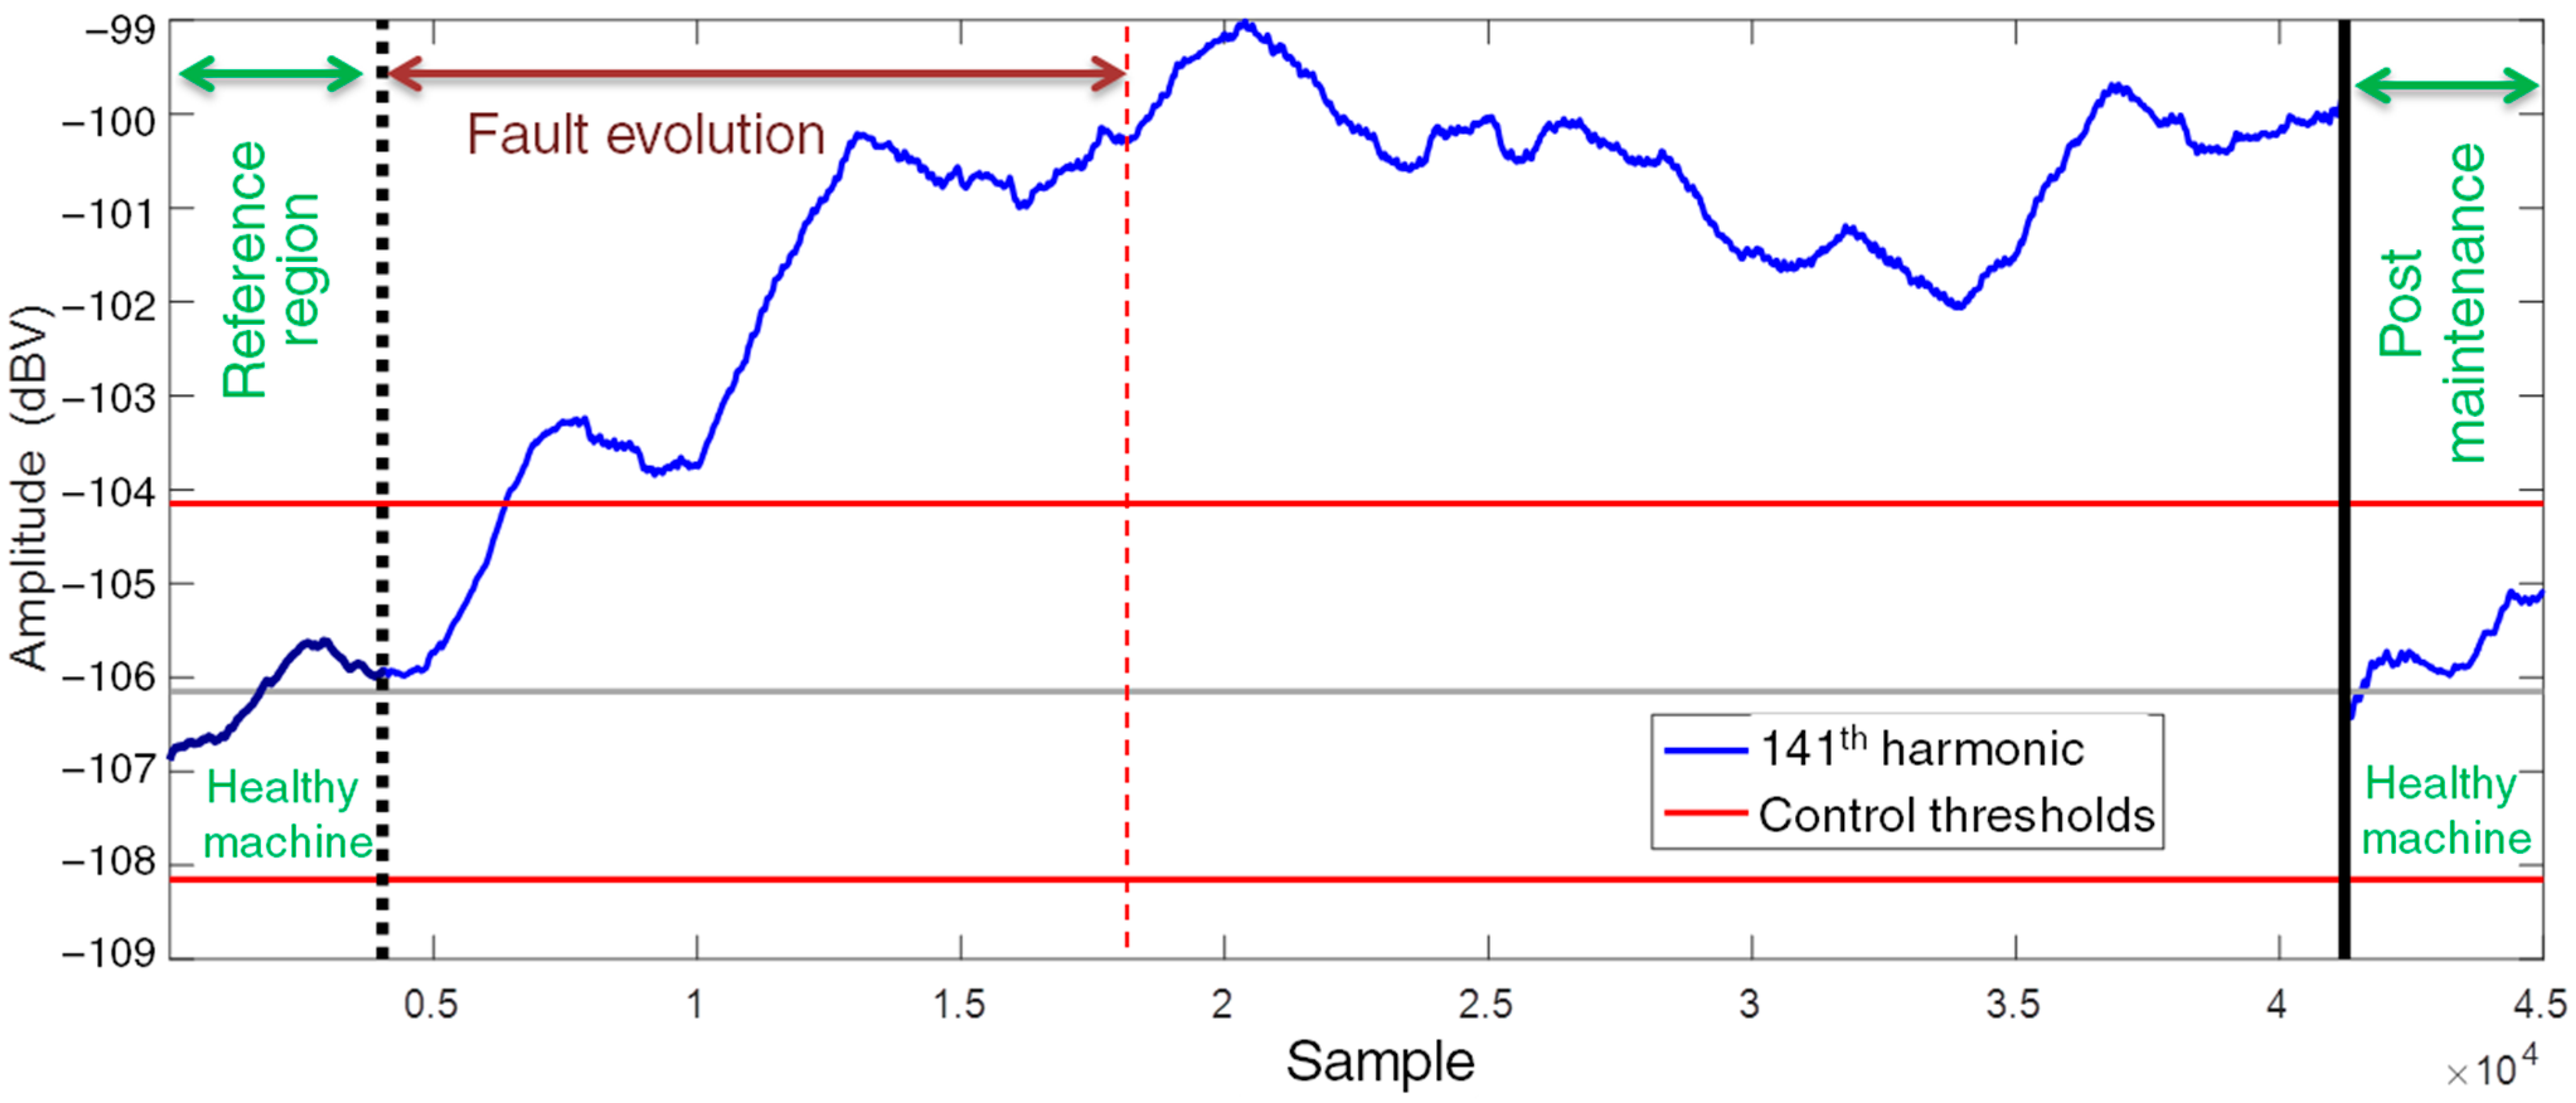
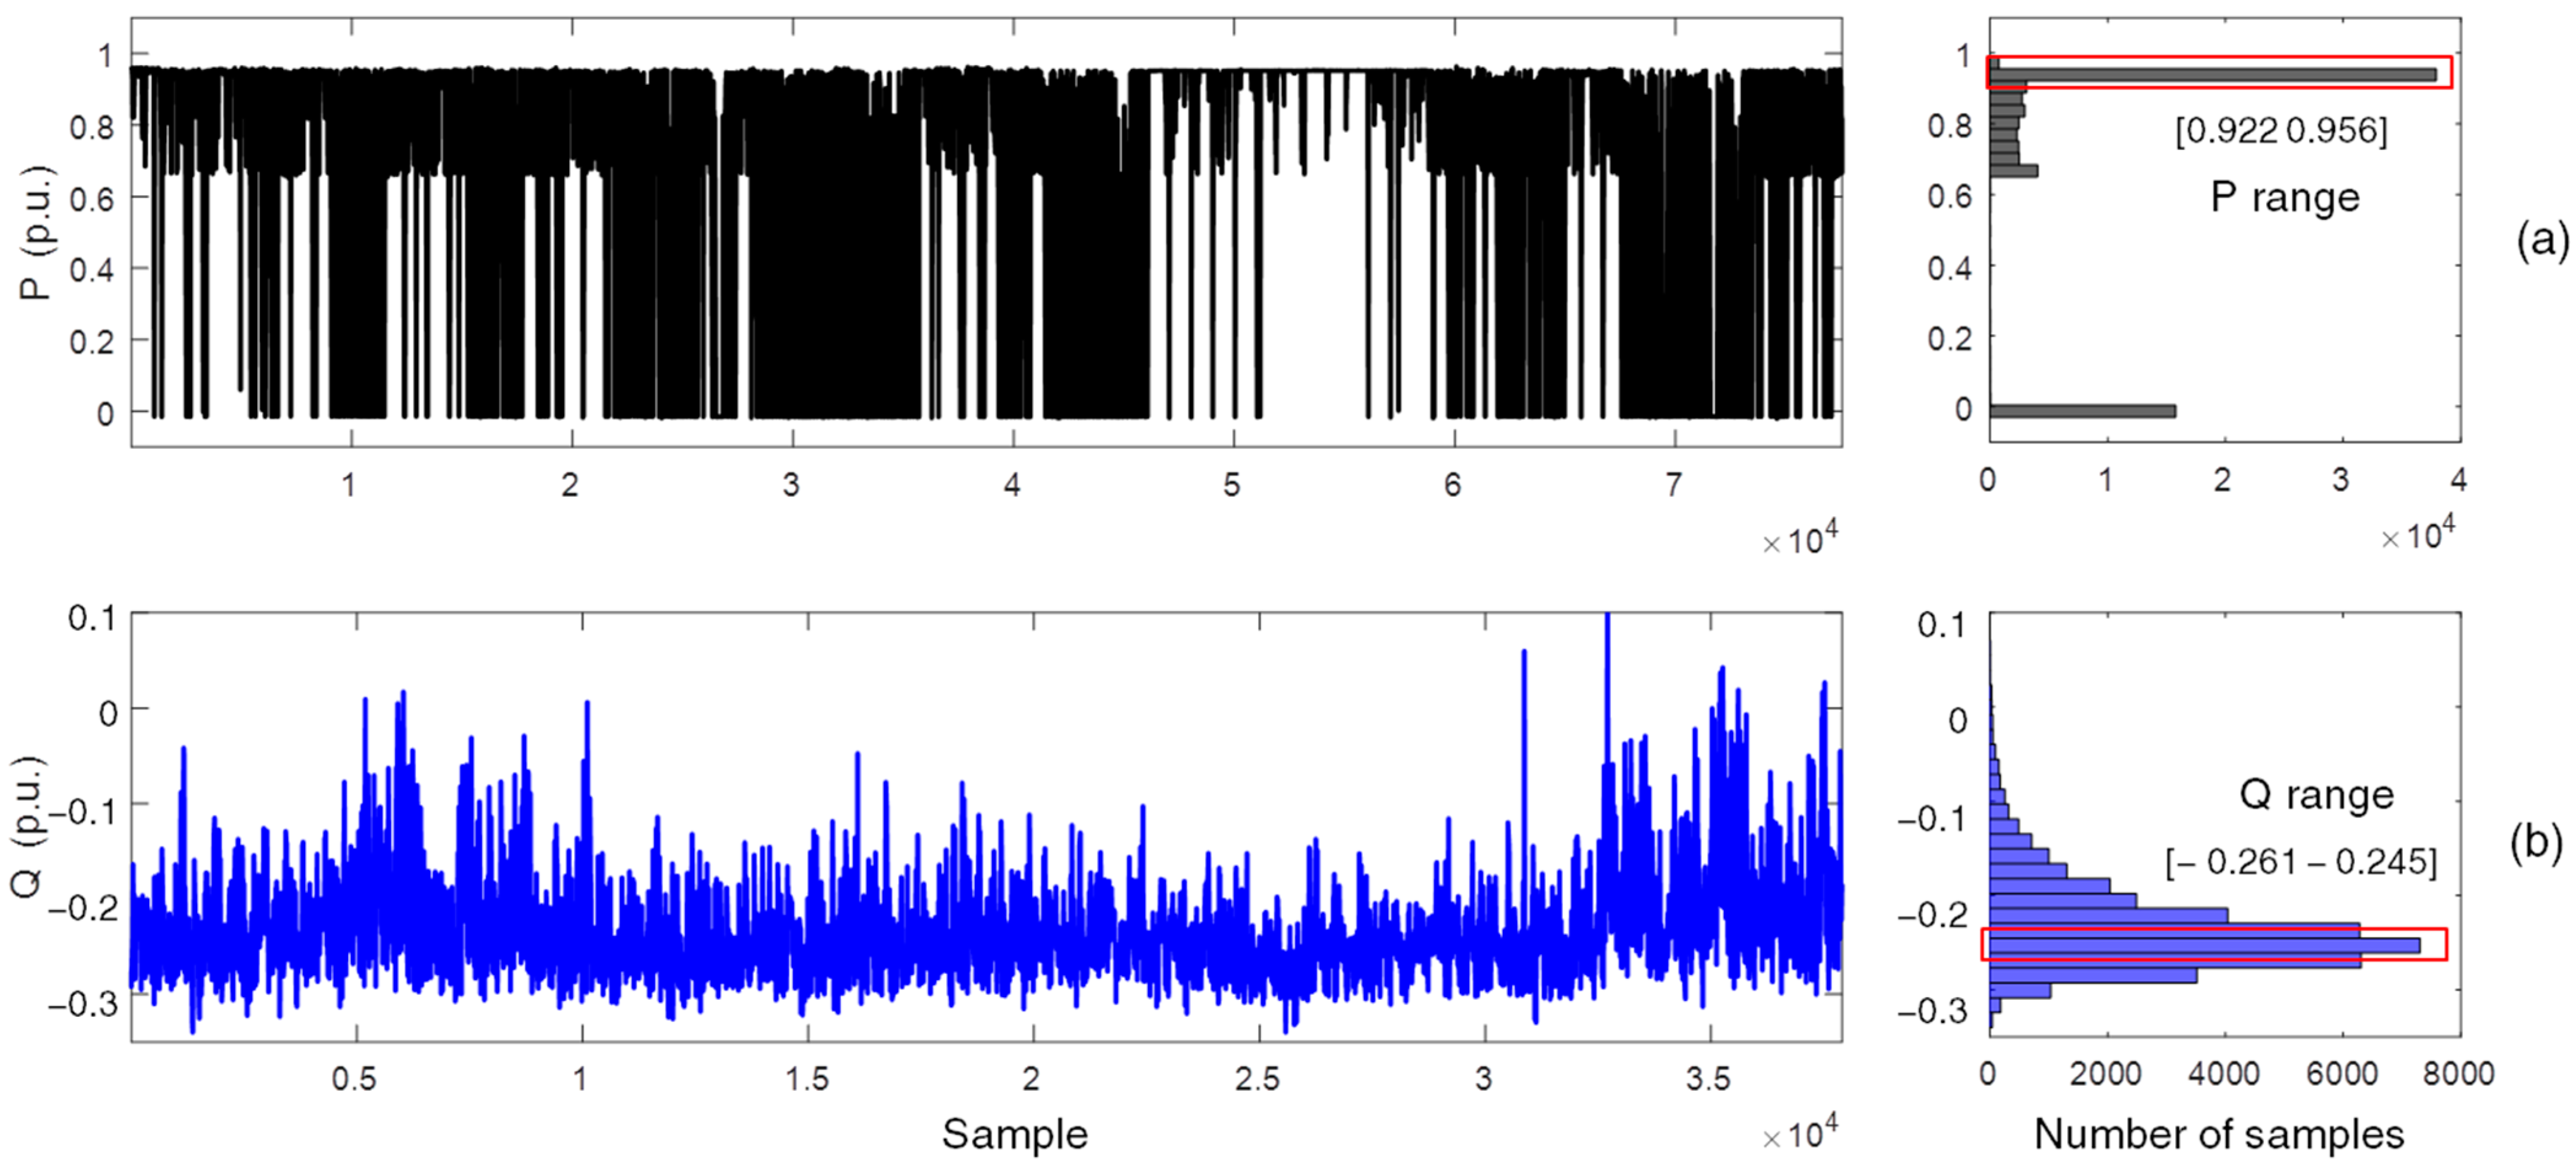
4.2.1. Description of the Investigated Case
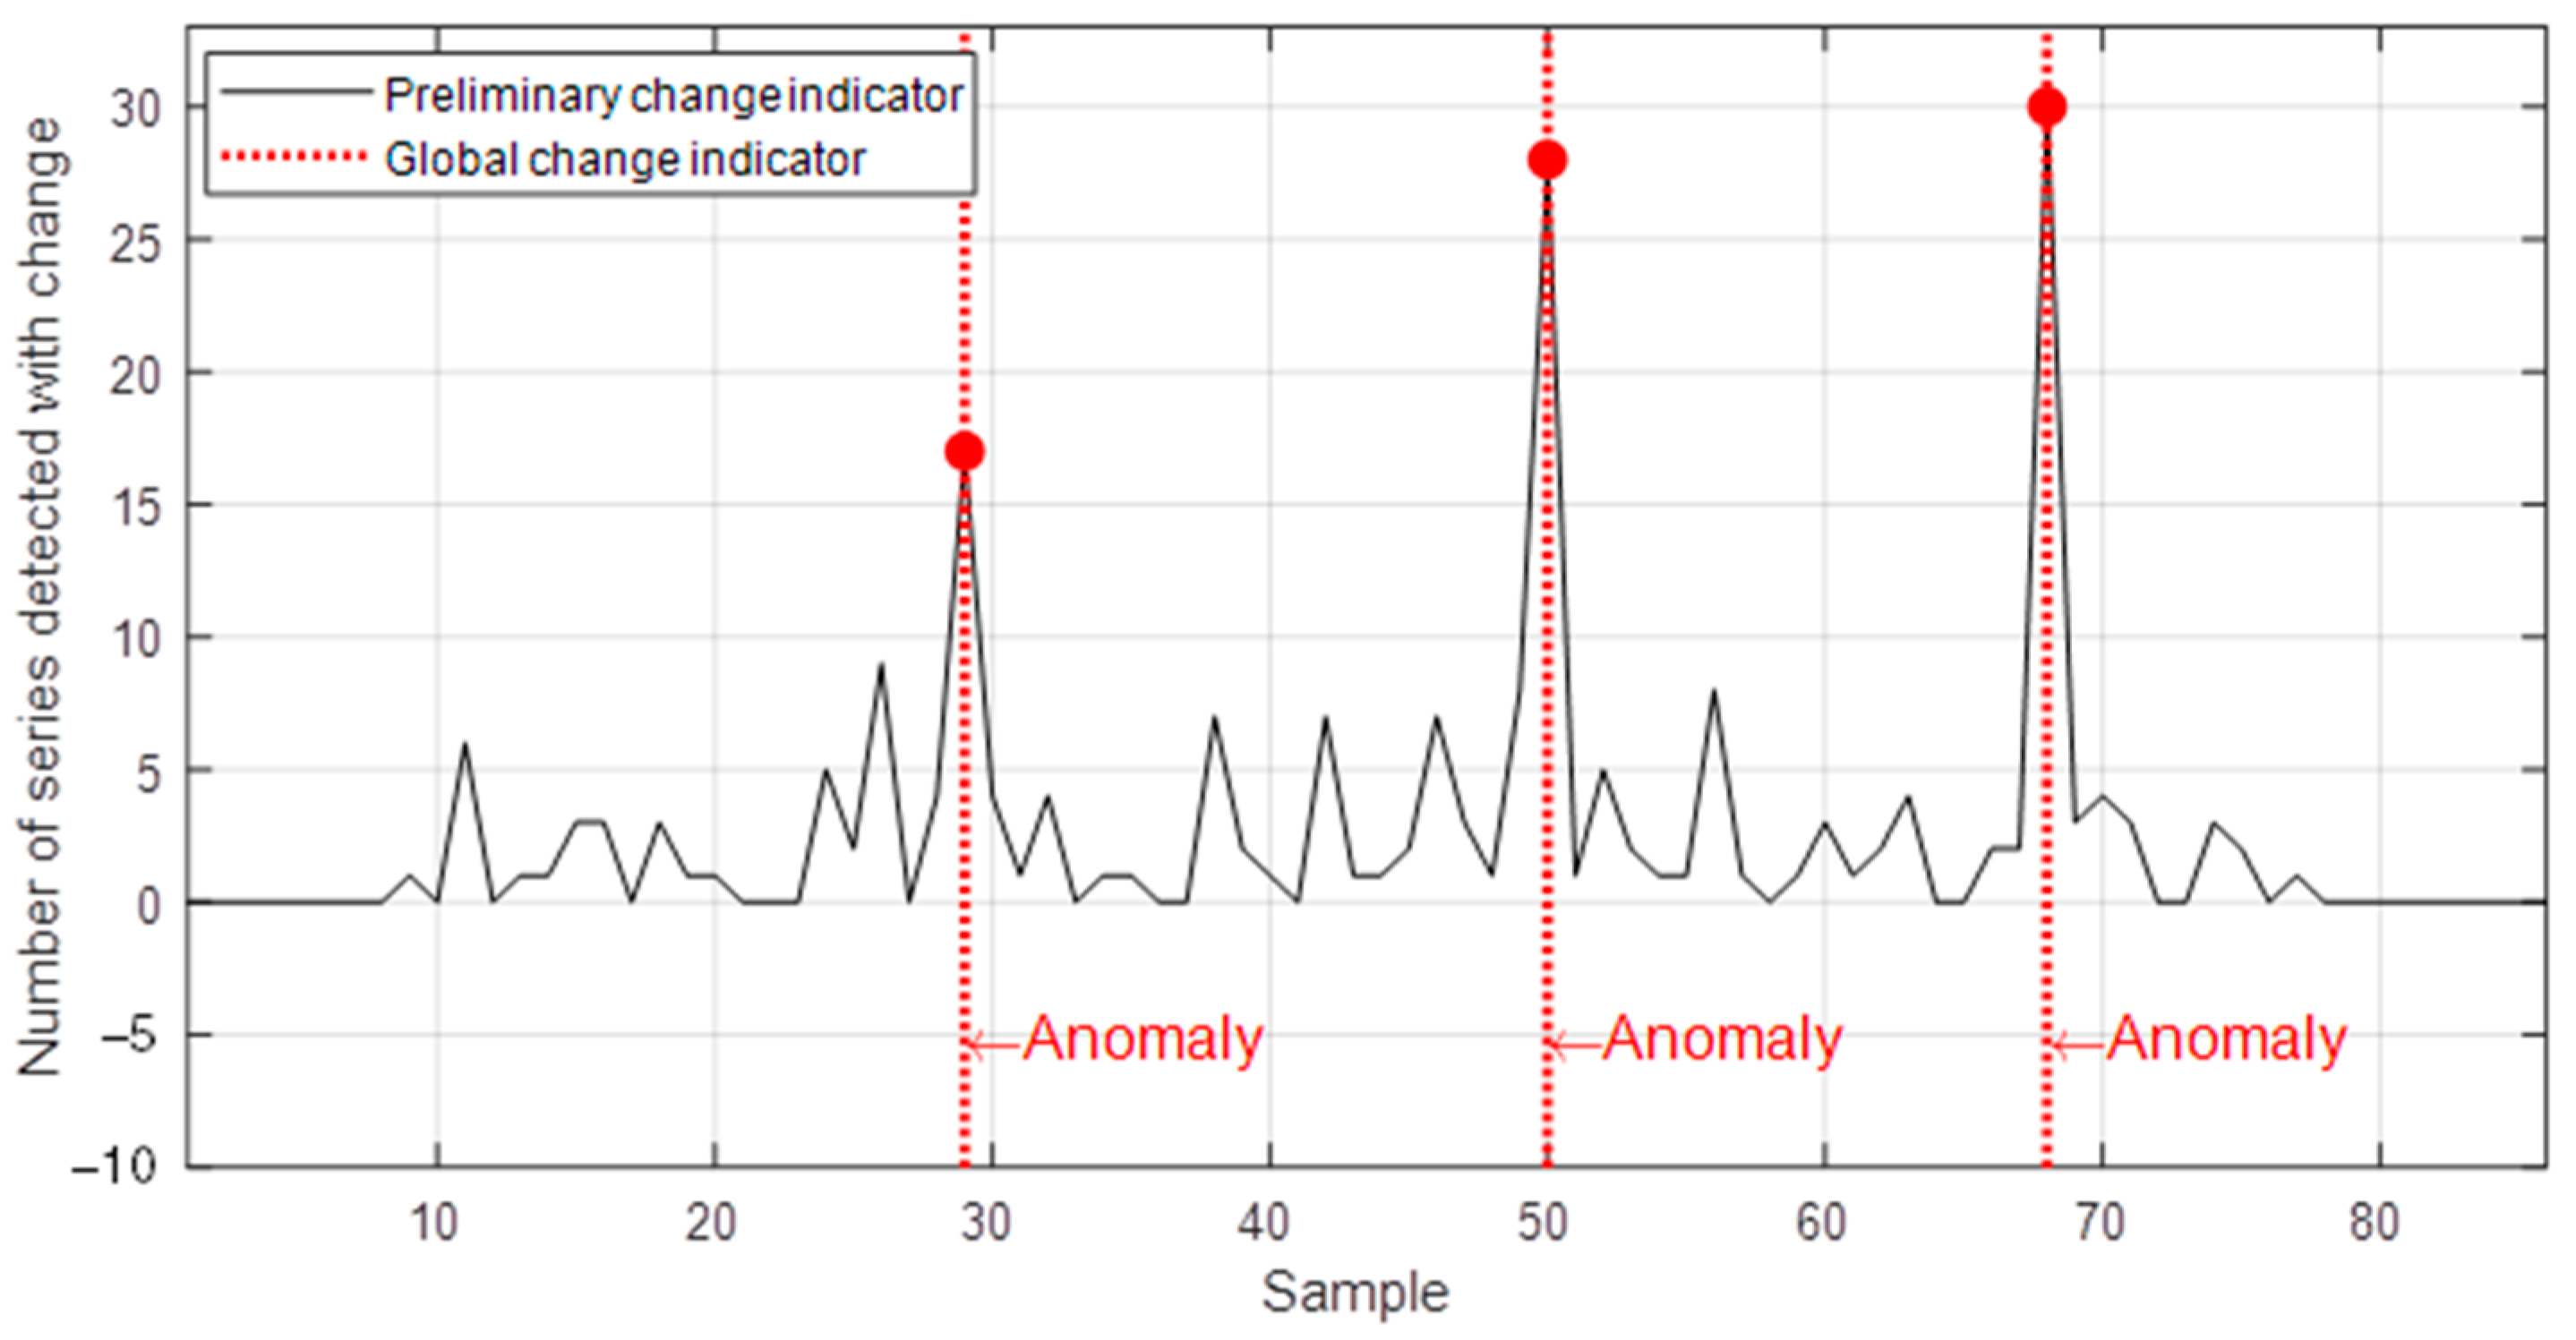
4.2.2. Application of the Proposed Algorithm
5. Conclusions
Author Contributions
Funding
Institutional Review Board Statement
Informed Consent Statement
Data Availability Statement
Conflicts of Interest
References
- Henao, H.; Capolino, G.-A.; Fernandez-Cabanas, M.; Filippetti, F.; Bruzzese, C.; Strangas, E.; Pusca, R.; Estima, J.; Riera-Guasp, M.; Hedayati-Kia, S. Trends in Fault Diagnosis for Electrical Machines: A Review of Diagnostic Techniques. IEEE Ind. Electron. Mag. 2014, 8, 31–42. [Google Scholar] [CrossRef]
- IEEE Guide for Online Monitoring of Large Synchronous Generators (10 MVA and Above); IEEE Std 1129-2014; IEEE: New York, NY, USA, 2014; pp. 1–62. [CrossRef]
- Mostafaei, M.; Faiz, J. An Overview of Various Faults Detection Methods in Synchronous Generators. IET Electr. Power Appl. 2021, 15, 391–404. [Google Scholar] [CrossRef]
- Kedjar, B.; Merkhouf, A.; Al-Haddad, K. Large Synchronous Machines Diagnosis Based on Air-Gap and Stray Fluxes—An Overview. In Proceedings of the 2020 International Conference on Electrical Machines (ICEM), Gothenburg, Sweden, 23 August 2020; pp. 1384–1389. [Google Scholar]
- Mazaheri-Tehrani, E.; Faiz, J. Airgap and Stray Magnetic Flux Monitoring Techniques for Fault Diagnosis of Electrical Machines: An Overview. IET Electr. Power Appl. 2022, 16, 277–299. [Google Scholar] [CrossRef]
- Zamudio-Ramirez, I.; Osornio-Rios, R.A.; Antonino-Daviu, J.A.; Razik, H.; Romero-Troncoso, R. Magnetic Flux Analysis for the Condition Monitoring of Electric Machines: A Review. IEEE Trans. Ind. Inf. 2022, 18, 2895–2908. [Google Scholar] [CrossRef]
- Rigoni, M.; Batistela, N.J.; Sadowski, N.; Feler, L.A.; Gameiro, C.S.P.; dos Santos, H.F.; de Elias, R.A.; Kuo-Peng, P.; Bastos, J.P.A.; de Freitas, L.M. System and Method for Identifying the Characteristics of an Electric Machine. BR Patent BR102015011438-9, 19 April 2015. (In Portuguese). [Google Scholar]
- Dos Santos, H.F.; Rigoni, M.; de Elias, R.A.; Feler, L.A.; Wengerkievicz, C.A.C.; Batistela, N.J.; Sadowski, N.; Kuo-Peng, P.; Bastos, J.P.A.; de Freitas, L.M. Non-Invasive Monitoring System of Synchronous Generator Using External Field. J. Microw. Optoelectron. Electromagn. Appl. 2017, 16, 70–89. [Google Scholar] [CrossRef] [Green Version]
- Albright, D. Interturn Short-Circuit Detector for Turbine-Generator Rotor Windings. IEEE Trans. Power Appar. Syst. 1971, PAS-90, 478–483. [Google Scholar] [CrossRef]
- Rotor Flux Monitoring (Synchronous Machines). Available online: https://irispower.com/monitoring/rotor-flux-monitoring/ (accessed on 3 October 2022).
- Dos Santos, H.F.; Sadowski, N.; Batistela, N.J.; Bastos, J.P.A. Synchronous Generator Fault Investigation by Experimental and Finite-Element Procedures. IEEE Trans. Magn. 2016, 52, 7001304. [Google Scholar] [CrossRef]
- Yun, J.; Lee, S.B.; Sasic, M.; Stone, G.C. Reliable Flux-Based Detection of Field Winding Failures for Salient Pole Synchronous Generators. IEEE Trans. Energy Convers. 2019, 34, 1715–1718. [Google Scholar] [CrossRef]
- Afrandideh, S.; Milasi, M.E.; Haghjoo, F.; Cruz, S.M.A. Turn to Turn Fault Detection, Discrimination, and Faulty Region Identification in the Stator and Rotor Windings of Synchronous Machines Based on the Rotational Magnetic Field Distortion. IEEE Trans. Energy Convers. 2020, 35, 292–301. [Google Scholar] [CrossRef]
- Thailly, D.; Romary, R.; Lecointe, J.-P.; Brudny, J.-F.; Suau, P. Synchronous Machine Diagnosis Using an External Magnetic Flux Sensor. In Proceedings of the International Conference on Electrical Machines—ICEM, Chania, Crête, 2–5 September 2006. [Google Scholar]
- Neti, P.; Dehkordi, A.B.; Gole, A.M. A New Robust Method To Detect Rotor Faults in Salient-Pole Synchronous Machines Using Structural Asymmetries. In Proceedings of the 2008 IEEE Industry Applications Society Annual Meeting, Edmonton, AB, Canada, 5–9 October 2008; pp. 1–8. [Google Scholar]
- Neti, P.; Nandi, S. Stator Interturn Fault Detection of Synchronous Machines Using Field Current and Rotor Search-Coil Voltage Signature Analysis. IEEE Trans. Ind. Appl. 2009, 45, 911–920. [Google Scholar] [CrossRef]
- Cuevas, M.; Romary, R.; Lecointe, J.-P.; Jacq, T. Non-Invasive Detection of Rotor Short-Circuit Fault in Synchronous Machines by Analysis of Stray Magnetic Field and Frame Vibrations. IEEE Trans. Magn. 2016, 52, 8105304. [Google Scholar] [CrossRef]
- Irhoumah, M.; Pusca, R.; Lefevre, E.; Mercier, D.; Romary, R. Detection of the Stator Winding Inter-Turn Faults in Asynchronous and Synchronous Machines through the Correlation between Harmonics of the Voltage of Two Magnetic Flux Sensors. IEEE Trans. Ind. Appl. 2019, 55, 2682–2689. [Google Scholar] [CrossRef]
- Pusca, R.; Romary, R.; Touti, E.; Livinti, P.; Nuca, I.; Ceban, A. Procedure for Detection of Stator Inter-Turn Short Circuit in AC Machines Measuring the External Magnetic Field. Energies 2021, 14, 1132. [Google Scholar] [CrossRef]
- Ehya, H.; Nysveen, A. Pattern Recognition of Interturn Short Circuit Fault in a Synchronous Generator Using Magnetic Flux. IEEE Trans. Ind. Appl. 2021, 57, 3573–3581. [Google Scholar] [CrossRef]
- Irhoumah, M.; Pusca, R.; Lefèvre, E.; Mercier, D.; Romary, R. Stray Flux Multi-Sensor for Stator Fault Detection in Synchronous Machines. Electronics 2021, 10, 2313. [Google Scholar] [CrossRef]
- Grillo, L.O.S.; Wengerkievicz, C.A.C.; dos Santos, H.F.; Batistela, N.J.; Kuo-Peng, P.; Sadowski, N.; Matsuo, T.K.; de Souza, C.L.; De Freitas, L.M.; Nascimento, R.J. Equipment for Monitoring Synchronous Generators Condition through External Magnetic Field Waveforms. J. Microw. Optoelectron. Electromagn. Appl. 2022; accepted. [Google Scholar]
- ISO 13373; Condition Monitoring and Diagnostics of Machines—Vibration Condition Monitoring. International Organization for Standardization (ISO): Geneva, Switzerland, 2002.
- Dias, C.G.; Pereira, F.H. Broken Rotor Bars Detection in Induction Motors Running at Very Low Slip Using a Hall Effect Sensor. IEEE Sens. J. 2018, 18, 4602–4613. [Google Scholar] [CrossRef]
- Dias, C.G.; da Silva, L.C.; Chabu, I.E. Fuzzy-Based Statistical Feature Extraction for Detecting Broken Rotor Bars in Line-Fed and Inverter-Fed Induction Motors. Energies 2019, 12, 2381. [Google Scholar] [CrossRef] [Green Version]
- Zamudio-Ramírez, I.; Osornio-Ríos, R.A.; Antonino-Daviu, J.A.; Quijano-Lopez, A. Smart-Sensor for the Automatic Detection of Electromechanical Faults in Induction Motors Based on the Transient Stray Flux Analysis. Sensors 2020, 20, 1477. [Google Scholar] [CrossRef] [Green Version]
- Zamudio-Ramirez, I.; Ramirez-Nunez, J.A.; Antonino-Daviu, J.; Osornio-Rios, R.A.; Quijano-Lopez, A.; Razik, H.; Romero-Troncoso, R.J. Automatic Diagnosis of Electromechanical Faults in Induction Motors Based on the Transient Analysis of the Stray Flux via MUSIC Methods. IEEE Trans. Ind. Appl. 2020, 56, 3604–3613. [Google Scholar] [CrossRef]
- Chiang, L.H.; Russell, E.L.; Braatz, R.D. Fault Detection and Diagnosis in Industrial Systems; Advanced Textbooks in Control and Signal Processing; Springer: London, UK, 2000; ISBN 978-1-85233-327-0. [Google Scholar]
- Capolino, G.-A.; Romary, R.; Henao, H.; Pusca, R. State of the Art on Stray Flux Analysis in Faulted Electrical Machines. In Proceedings of the 2019 IEEE Workshop on Electrical Machines Design, Control and Diagnosis (WEMDCD), Athens, Greece, 22–23 April 2019; pp. 181–187. [Google Scholar]
- Rigoni, M.; Antonio Junior, A.C.; dos Santos, T.L.; Batistela, N.J.; Sadowski, N. A Differential Analog Amplification Circuit for Small Signals from Induction Coil Sensors. In Proceedings of the Soft Magnetic Materials 19, Torino, Italy, 6–9 September 2009. [Google Scholar]
- Bastos, J.P.A.; Sadowski, N. Magnetic Materials and 3D Finite Element Modeling; CRC Press: Boca Raton, FL, USA, 2013. [Google Scholar]
- Zidat, F.; Lecointe, J.-P.; Morganti, F.; Brudny, J.-F.; Jacq, T.; Streiff, F. Non Invasive Sensors for Monitoring the Efficiency of AC Electrical Rotating Machines. Sensors 2010, 10, 7874–7895. [Google Scholar] [CrossRef] [PubMed] [Green Version]
- Tian, P.; Platero, C.A.; Gyftakis, K.N.; Guerrero, J.M. Stray Flux Sensor Core Impact on the Condition Monitoring of Electrical Machines. Sensors 2020, 20, 749. [Google Scholar] [CrossRef] [PubMed]
- Montgomery, D.C. Introduction to Statistical Quality Control, 7th ed.; John Wiley & Sons: Hoboken, NJ, USA, 2013. [Google Scholar]
- Montgomery, D.C.; Runger, G.C. Applied Statistics and Probability for Engineers, 6th ed.; John Wiley & Sons: Hoboken, NJ, USA, 2013. [Google Scholar]


Publisher’s Note: MDPI stays neutral with regard to jurisdictional claims in published maps and institutional affiliations. |
© 2022 by the authors. Licensee MDPI, Basel, Switzerland. This article is an open access article distributed under the terms and conditions of the Creative Commons Attribution (CC BY) license (https://creativecommons.org/licenses/by/4.0/).
Share and Cite
Grillo, L.O.S.; Wengerkievicz, C.A.C.; Batistela, N.J.; Kuo-Peng, P.; Freitas, L.M.d. A Method for Statistical Processing of Magnetic Field Sensor Signals for Non-Invasive Condition Monitoring of Synchronous Generators. Sensors 2022, 22, 8631. https://doi.org/10.3390/s22228631
Grillo LOS, Wengerkievicz CAC, Batistela NJ, Kuo-Peng P, Freitas LMd. A Method for Statistical Processing of Magnetic Field Sensor Signals for Non-Invasive Condition Monitoring of Synchronous Generators. Sensors. 2022; 22(22):8631. https://doi.org/10.3390/s22228631
Chicago/Turabian StyleGrillo, Luis O. S., Carlos A. C. Wengerkievicz, Nelson J. Batistela, Patrick Kuo-Peng, and Luciano M. de Freitas. 2022. "A Method for Statistical Processing of Magnetic Field Sensor Signals for Non-Invasive Condition Monitoring of Synchronous Generators" Sensors 22, no. 22: 8631. https://doi.org/10.3390/s22228631