
Physical Load While Using a Tablet at Different Tilt Angles during Sitting and Standing
 , , and
Abstract
:1. Introduction
2. Materials and Methods
2.1. Participants
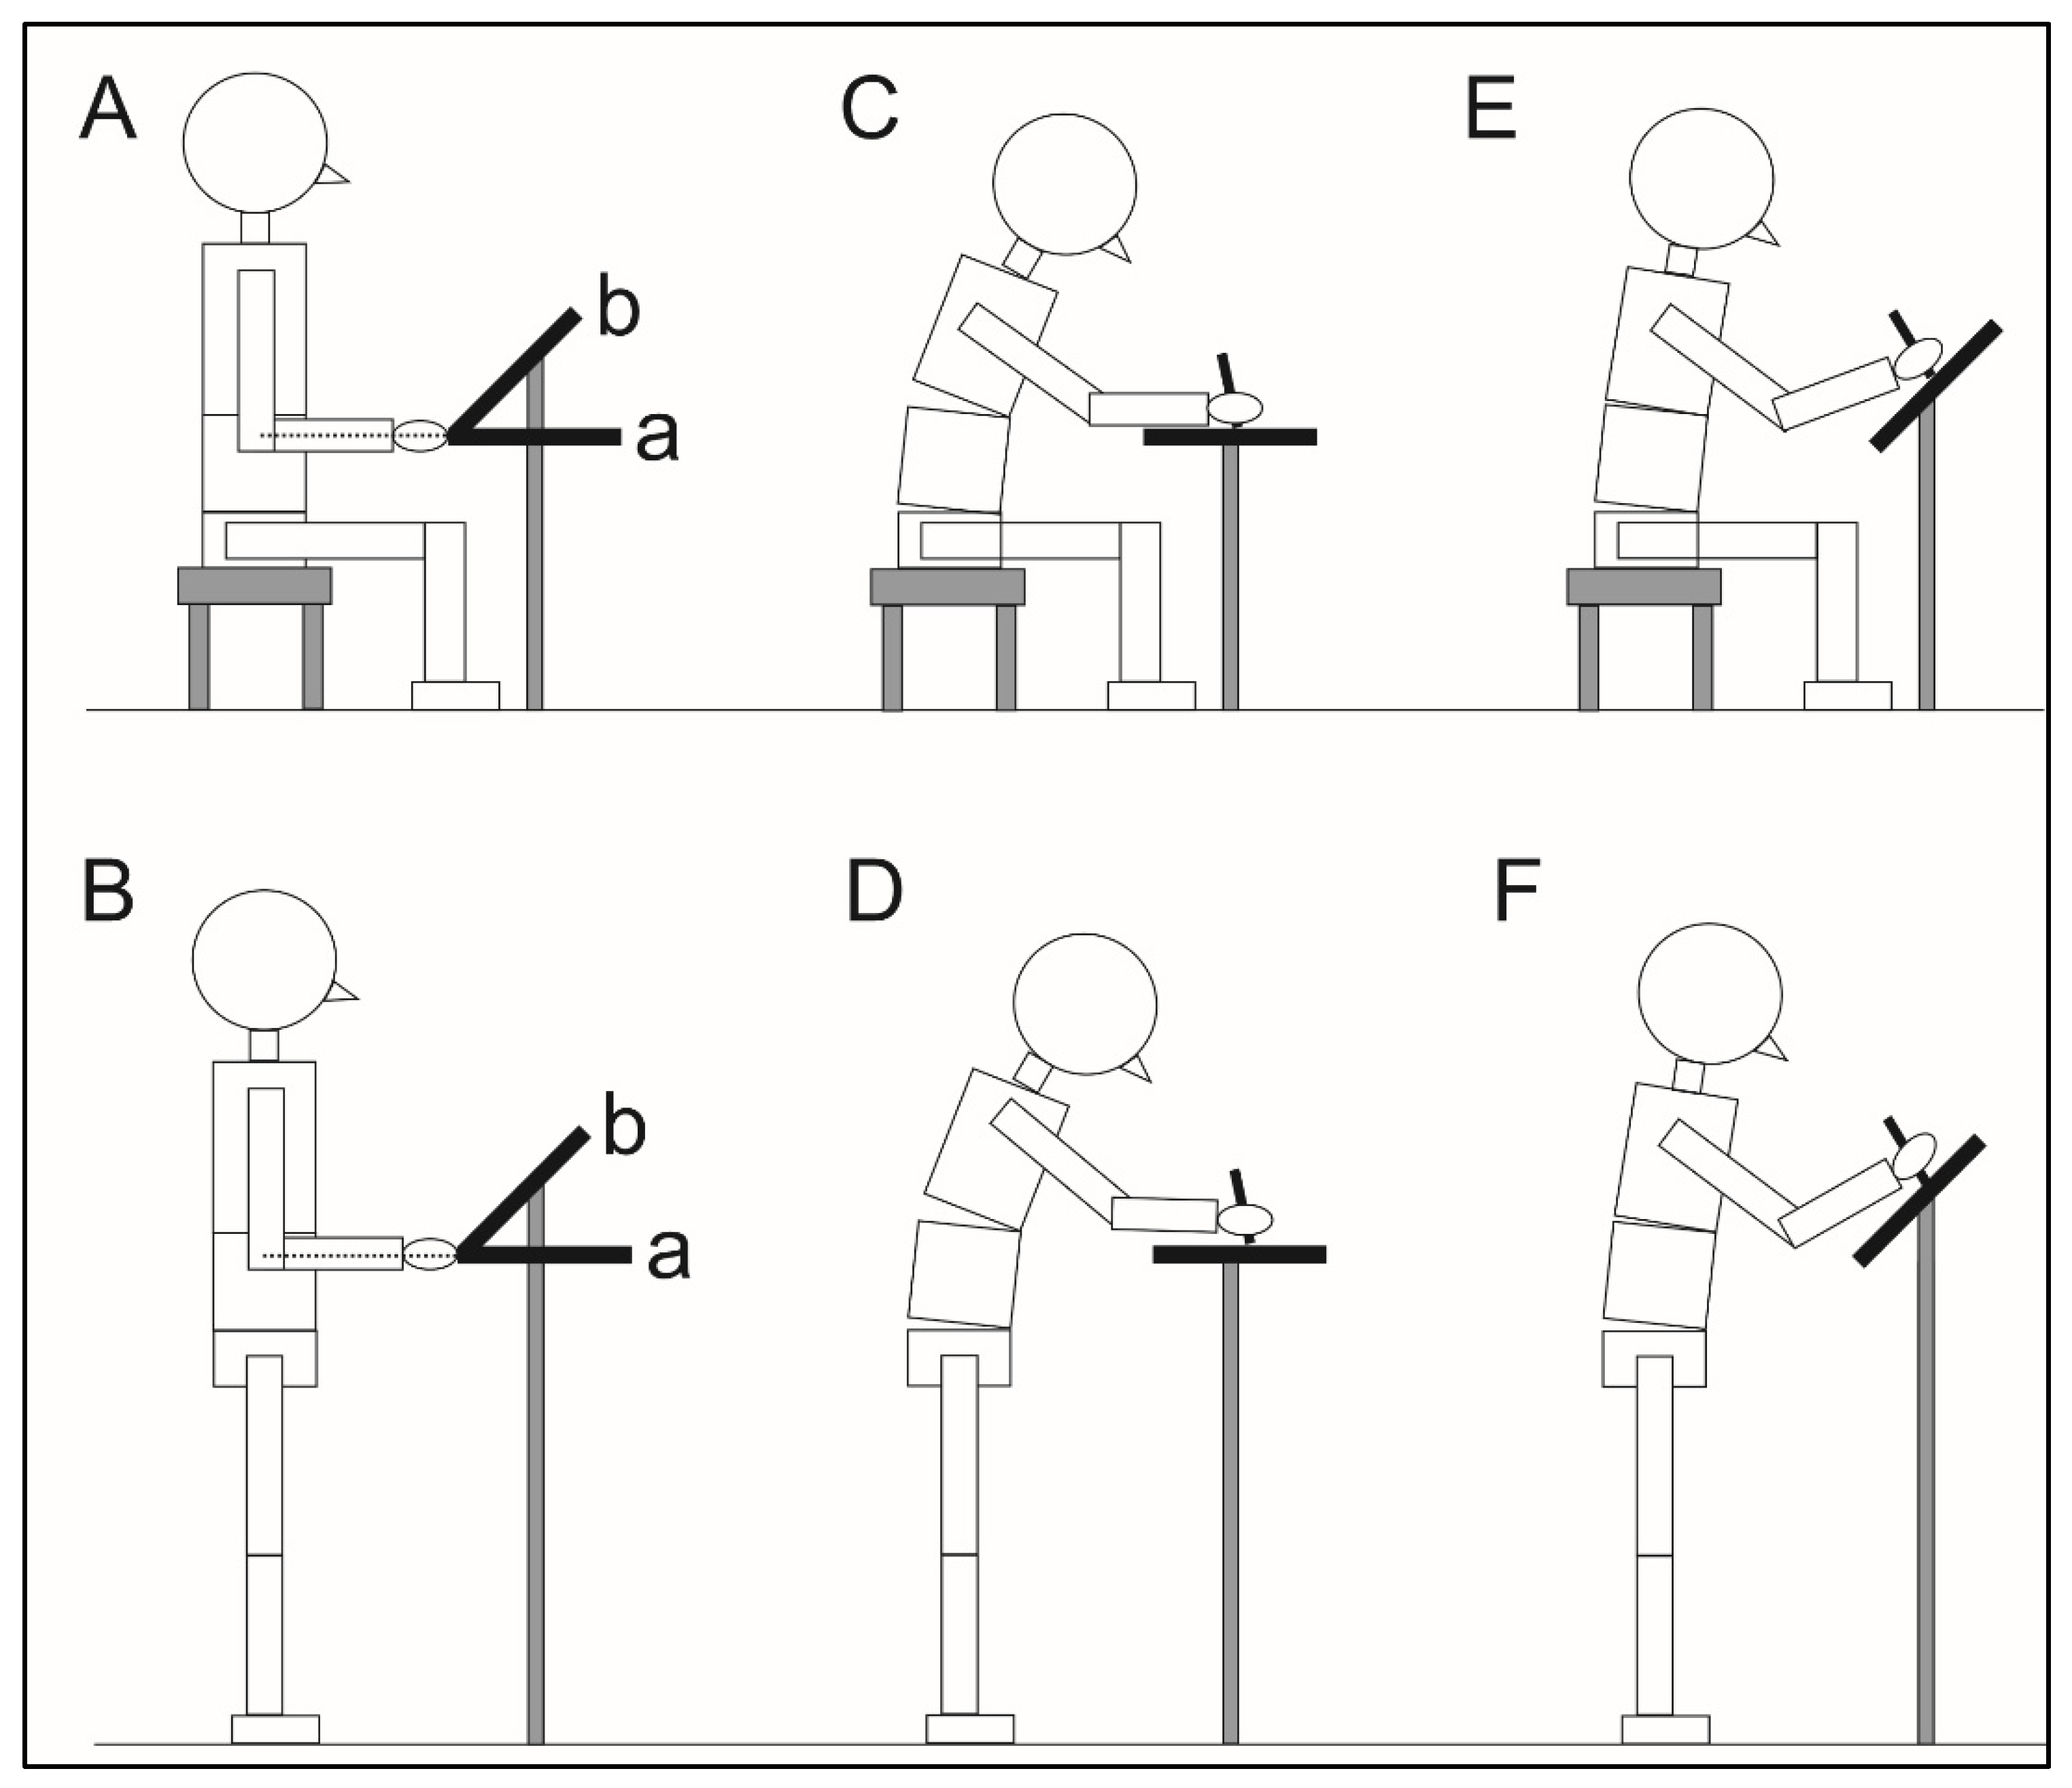
2.2. Experimental Procedures
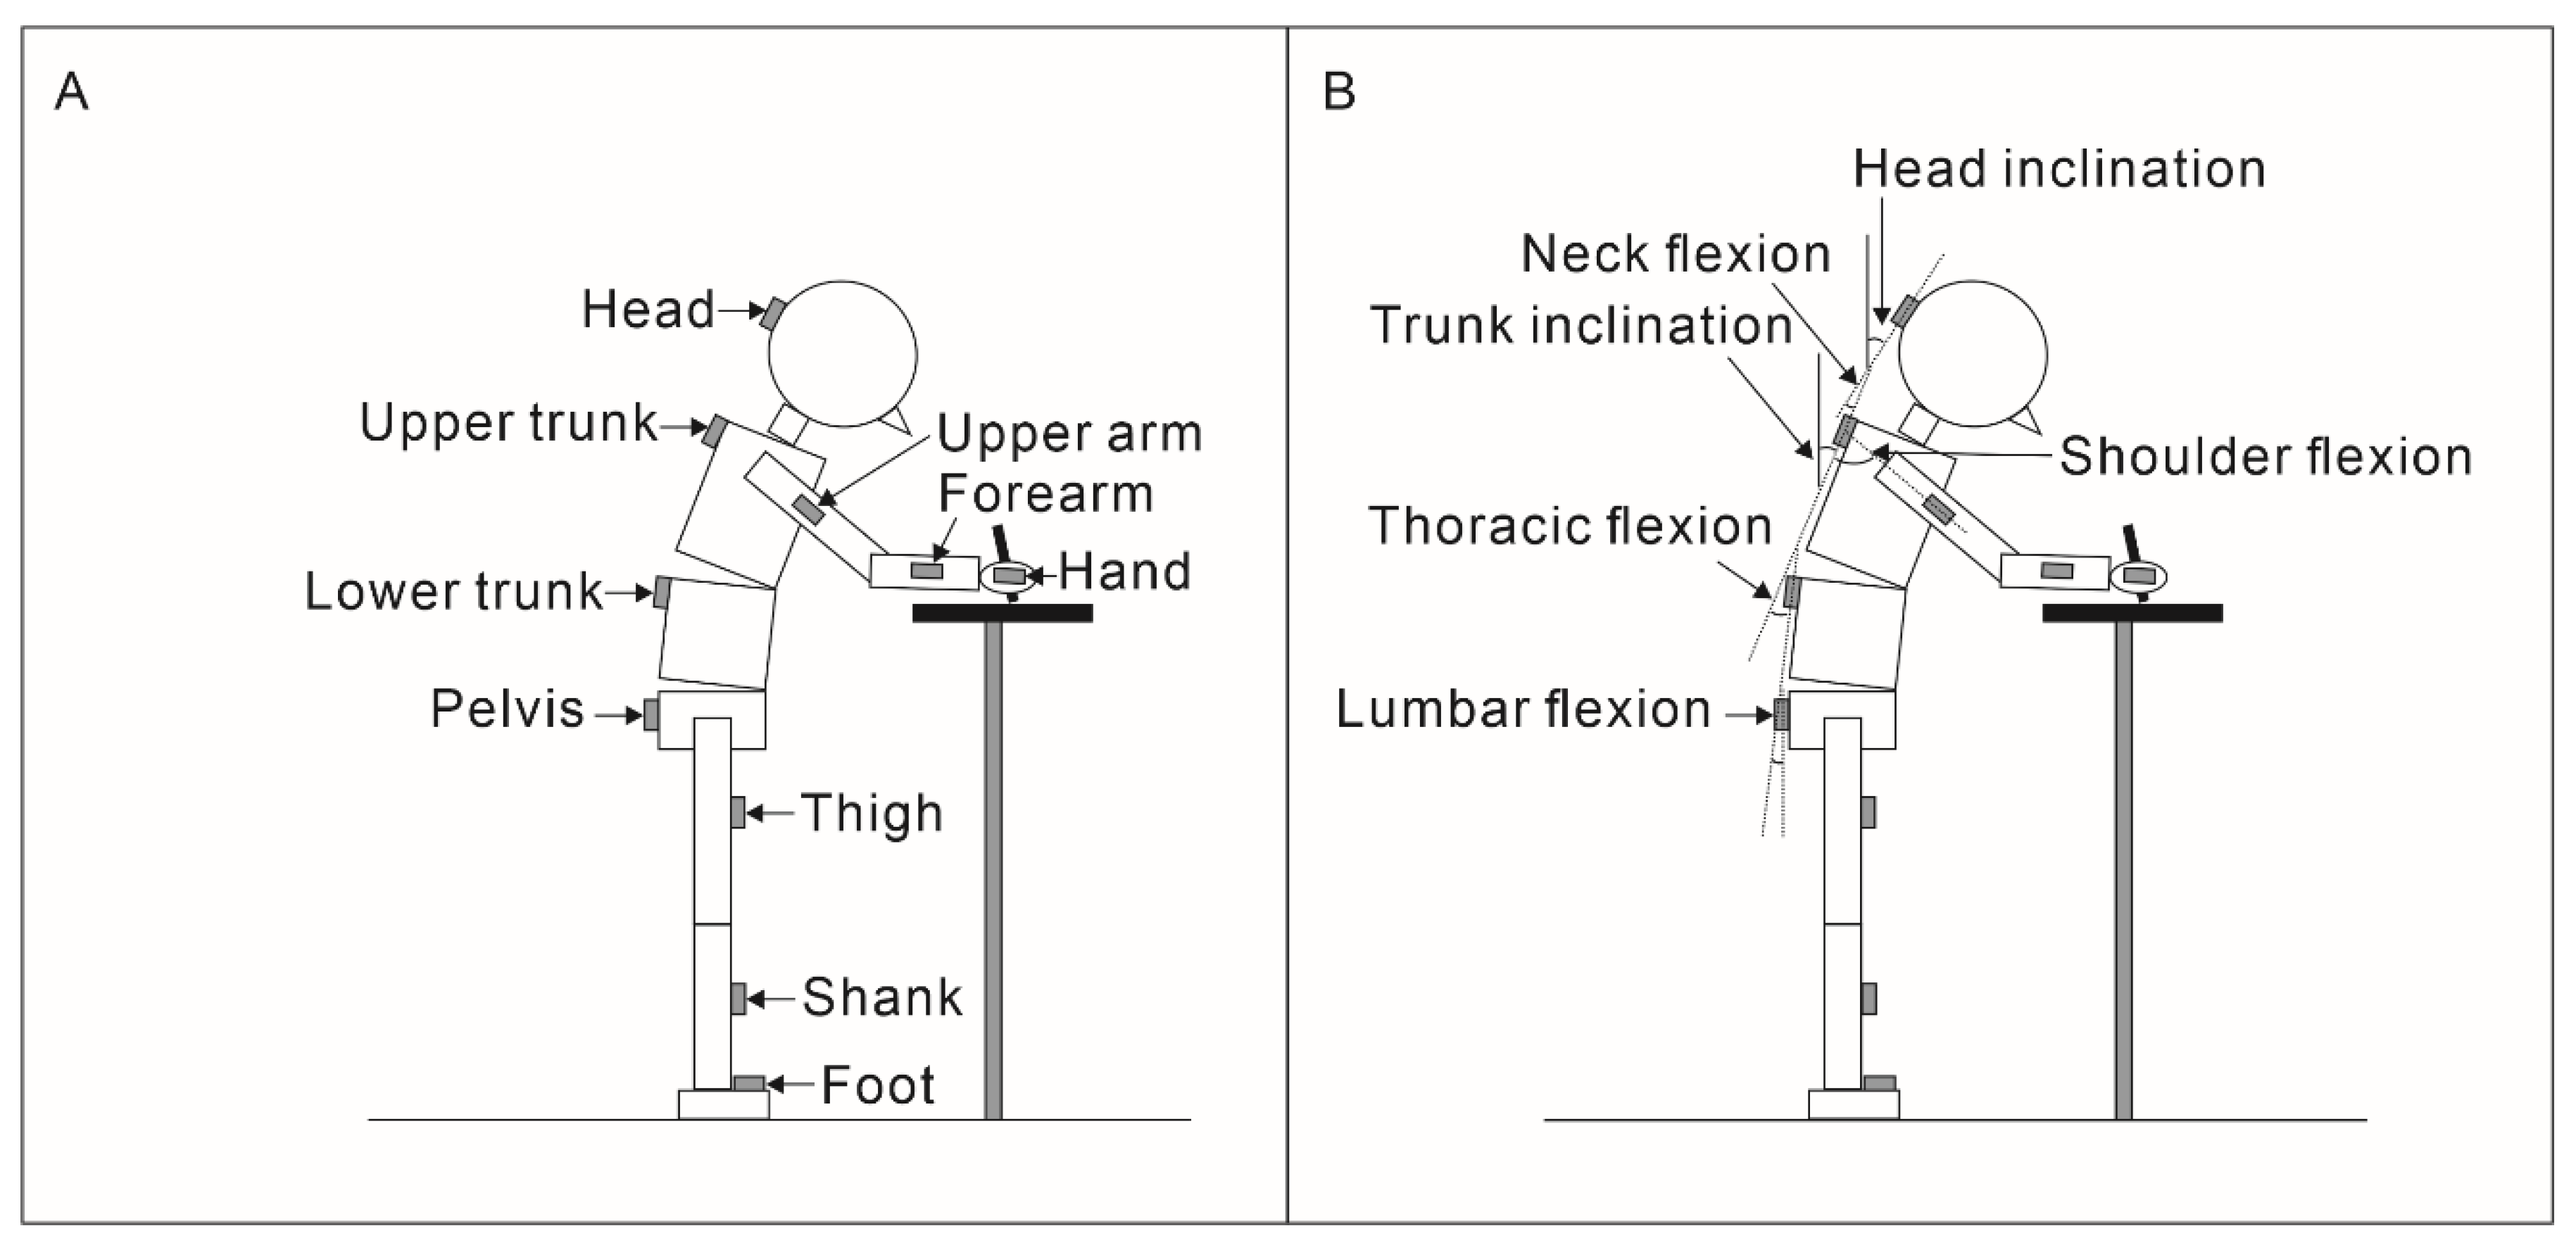
2.3. Data Analysis
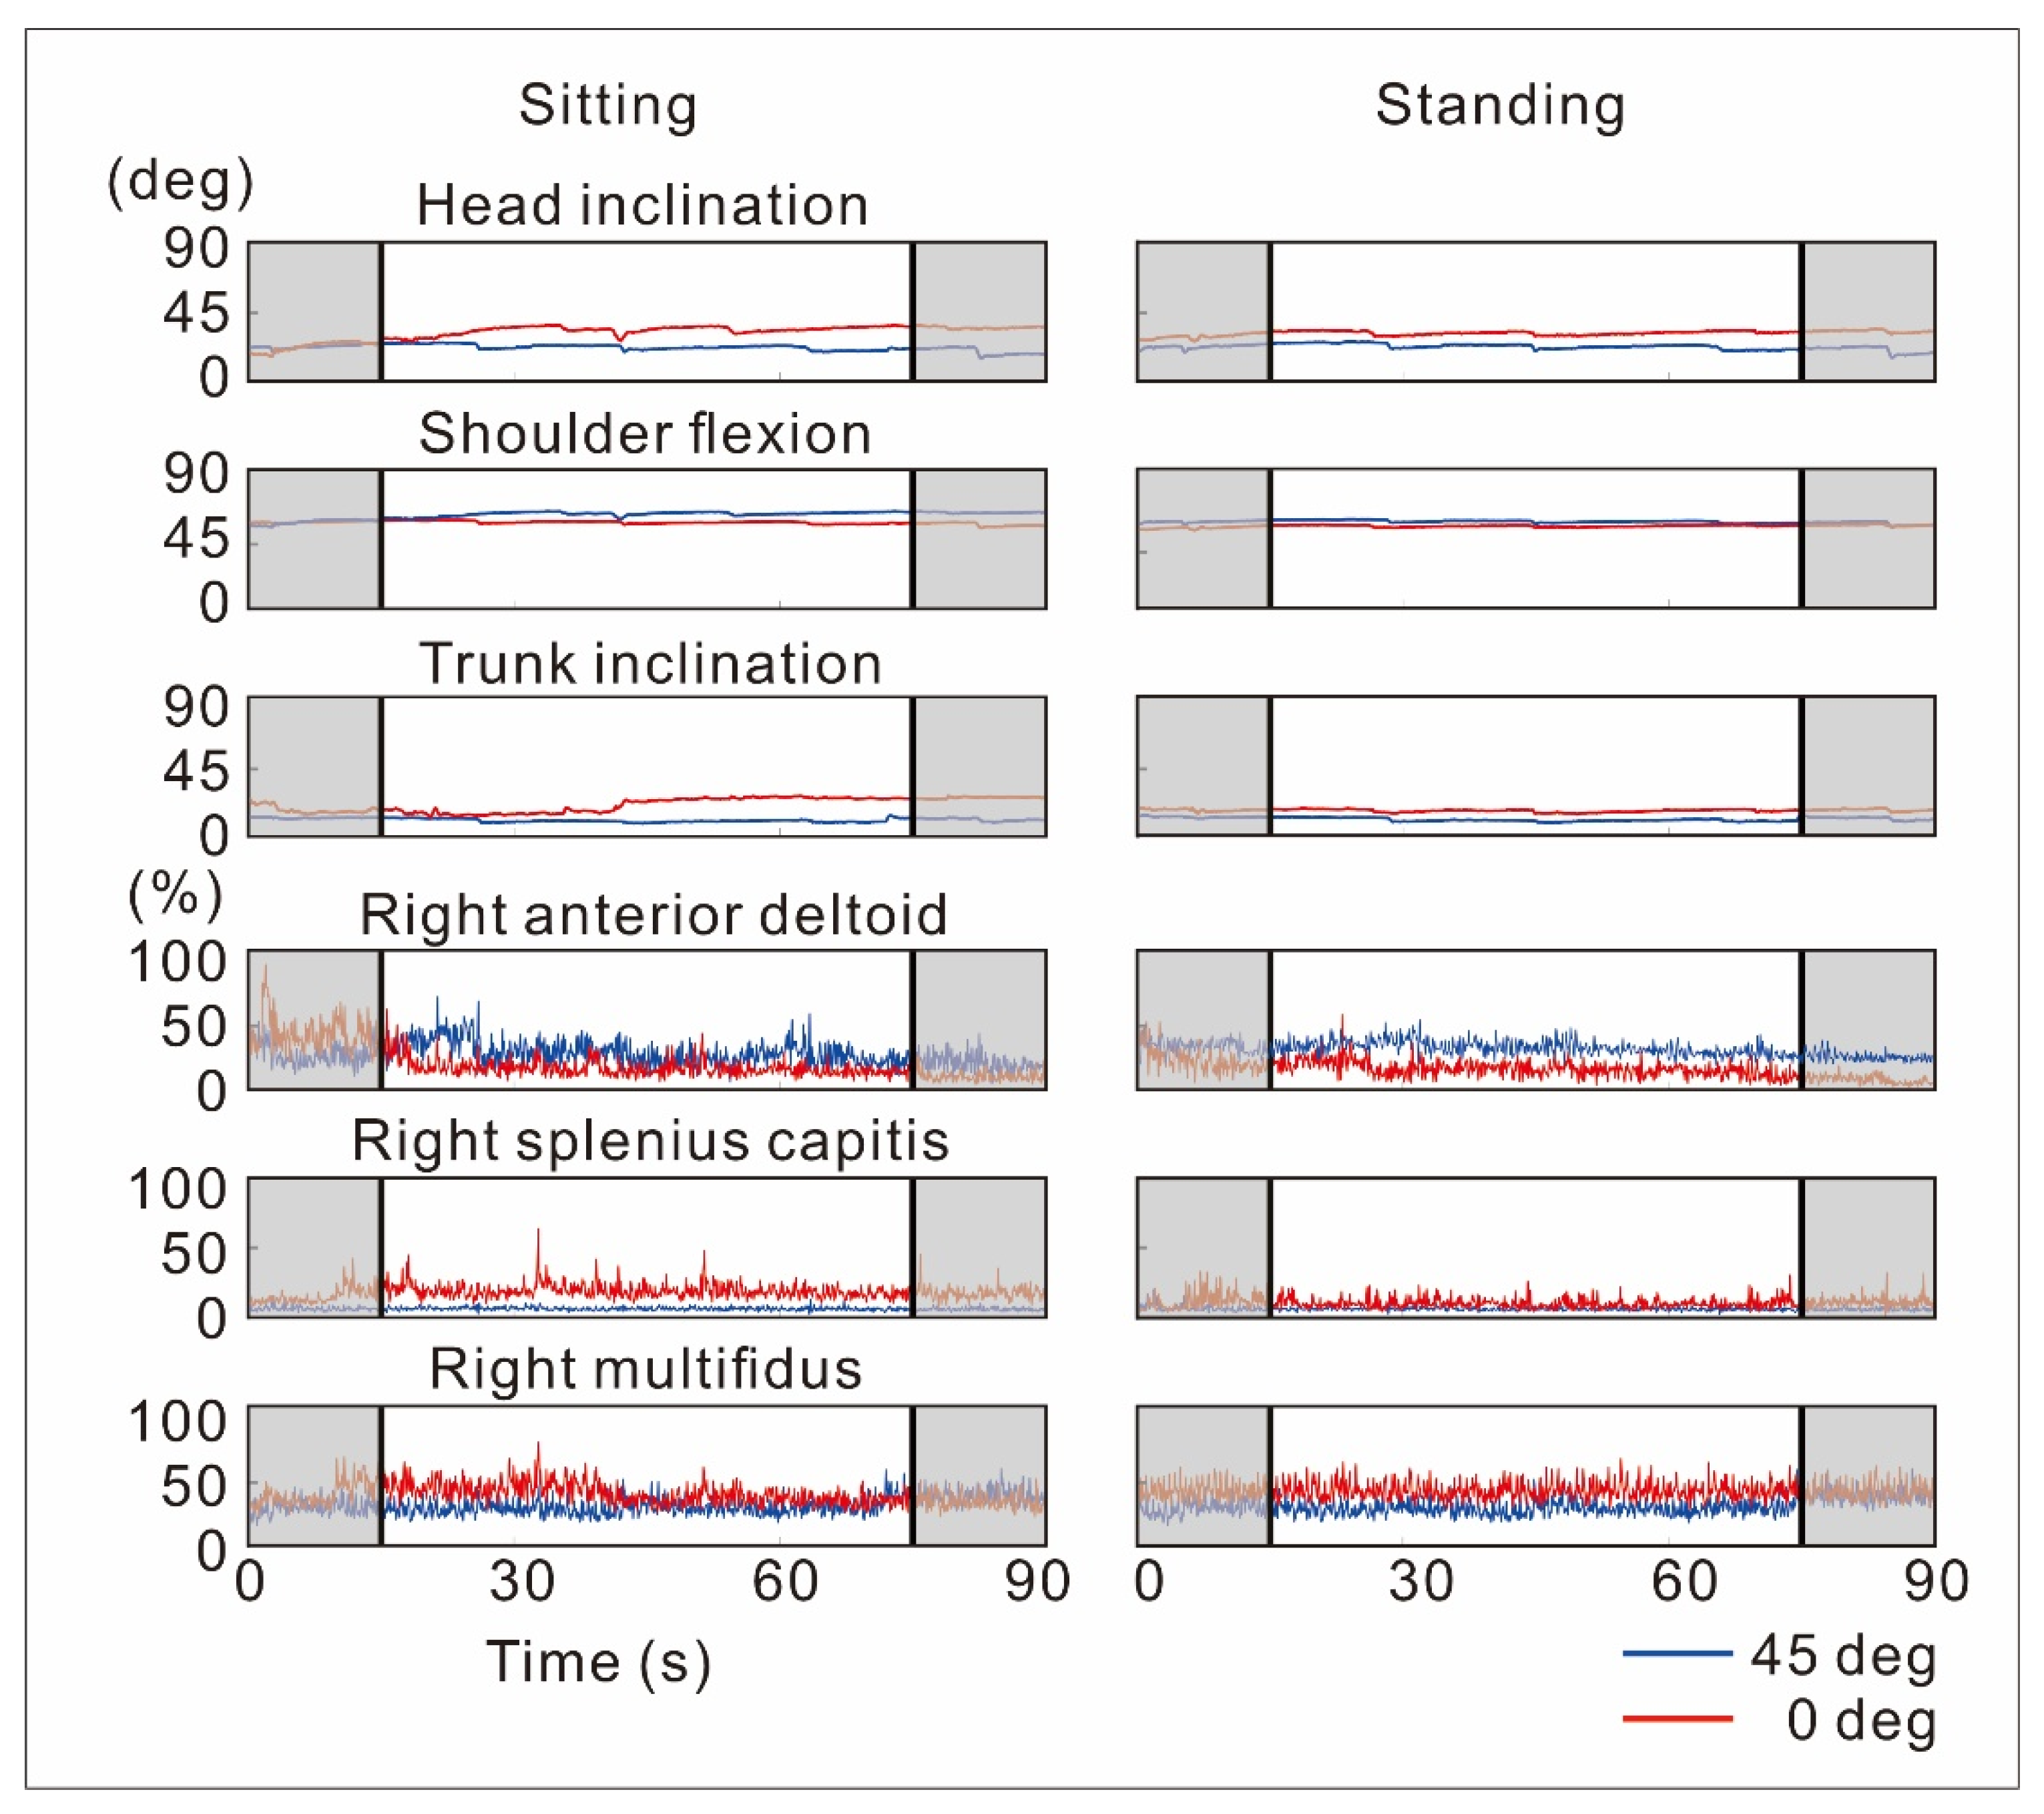
3. Results
4. Discussion
5. Conclusions
Author Contributions
Funding
Institutional Review Board Statement
Informed Consent Statement
Data Availability Statement
Acknowledgments
Conflicts of Interest
References
- Japanese Cabinet Office. Polycystic Ovary Syndrome. Survey on the Internet Use Environment among Youth. Available online: https://www8.cao.go.jp/youth/youth-harm/chousa/net-jittai_list.html (accessed on 25 September 2022).
- ITU. Measuring Digital Development: Facts and Figures 2021. Available online: https://www.itu.int/itu-d/reports/statistics/2021/11/15/youth-internet-use/ (accessed on 25 September 2022).
- Ministry of Education, Culture, Sports, Science and Technology-Japan. Ministry of Education, Culture, Sports, Science and Technology FY2020 Budget Highlights. Available online: https://www.mext.go.jp/en/unesco/mext_00002.html (accessed on 25 September 2022).
- Chiang, H.Y.; Liu, C.H. Exploration of the associations of touch-screen tablet computer usage and musculoskeletal discomfort. Work 2016, 53, 917–925. [Google Scholar] [CrossRef] [PubMed] [Green Version]
- Burgess-Limerick, R.; Mon-Williams, M.; Coppard, V.L. Visual display height. Hum. Factors 2000, 42, 140–150. [Google Scholar] [CrossRef] [PubMed]
- Burgess-Limerick, R.; Plooy, A.; Fraser, K.; Ankrum, D.R. The influence of computer monitor height on head and neck posture. Int. J. Ind. Ergon. 1999, 23, 171–179. [Google Scholar] [CrossRef]
- Turville, K.L.; Psihogios, J.P.; Ulmer, T.R.; Mirka, G.A. The effects of video display terminal height on the operator: A comparison of the 15 degree and 40 degree recommendations. Appl. Ergon. 1998, 29, 239–246. [Google Scholar] [CrossRef]
- Straker, L.M.; Coleman, J.; Skoss, R.; Maslen, B.A.; Burgess-Limerick, R.; Pollock, C.M. A comparison of posture and muscle activity during tablet computer, desktop computer and paper use by young children. Ergonomics 2008, 51, 540–555. [Google Scholar] [CrossRef] [PubMed]
- Psihogios, J.P.; Sommerich, C.M.; Mirka, G.A.; Moon, S.D. A field evaluation of monitor placement effects in VDT users. Appl. Ergon. 2001, 32, 313–325. [Google Scholar] [CrossRef]
- Hoe, V.C.; Urquhart, D.M.; Kelsall, H.L.; Zamri, E.N.; Sim, M.R. Ergonomic interventions for preventing work-related musculoskeletal disorders of the upper limb and neck among office workers. Cochrane Database Syst. Rev. 2018, 10, CD008570. [Google Scholar] [CrossRef] [PubMed]
- Callaghan, J.P.; McGill, S.M. Low back joint loading and kinematics during standing and unsupported sitting. Ergonomics 2001, 44, 280–294. [Google Scholar] [CrossRef] [PubMed]
- Toy, K.J.; Peres, S.C.; David, T.Y.; Nery, A.; Phillips, R.G., Jr. Examining user preferences in interacting with touchscreen devices. In Proceedings of the Human Factors and Ergonomics Society Annual Meeting, Los Angeles, CA, USA, 22–26 October 2012; Volume 56, pp. 1862–1866. [Google Scholar]
- Basmajian, J.V. Electromyography—Dynamic gross anatomy: A review. Am. J. Anat. 1980, 159, 245–260. [Google Scholar] [CrossRef] [PubMed]
- Kanekar, N.; Aruin, A.S. Improvement of anticipatory postural adjustments for balance control: Effect of a single training session. J. Electromyogr. Kinesio. 2015, 25, 400–405. [Google Scholar] [CrossRef] [PubMed]
- Mark, H.; Karen, G. Normalization of EMG Signals: To Normalize or Not to Normalize and What to Normalize to? In Computational Intelligence in Electromyography Analysis; Ganesh, R.N., Ed.; Intech Open: Rijeka, Yugoslavia, 2012. [Google Scholar]
- Yoon, W.; Choi, S.; Han, H.; Shin, G. Neck muscular load when using a smartphone while sitting, standing, and walking. Hum. Factors 2021, 63, 868–879. [Google Scholar] [CrossRef] [PubMed]
- Drzaƚ-Grabiec, J.; Truszczyńska, A.; Fabjańska, M.; Trzaskoma, Z. Changes of the body posture parameters in the standing versus relaxed sitting and corrected sitting position. J. Back Musculoskelet. Rehabil. 2016, 29, 211–217. [Google Scholar] [CrossRef] [PubMed]
- Claus, A.P.; Hides, J.A.; Moseley, G.L.; Hodges, P.W. Thoracic and lumbar posture behaviour in sitting tasks and standing: Progressing the biomechanics from observations to measurements. Appl. Ergon. 2016, 53, 161–168. [Google Scholar] [CrossRef] [PubMed] [Green Version]
- Yu, Z.; James, C.; Edwards, S.; Snodgrass, S.J. Differences in posture kinematics between using a tablet, a laptop, and a desktop computer in sitting and in standing. Work 2018, 61, 257–266. [Google Scholar] [CrossRef] [PubMed] [Green Version]
- Seghers, J.; Jochem, A.; Spaepen, A. Posture, muscle activity and muscle fatigue in prolonged VDT work at different screen height settings. Ergonomics 2003, 46, 714–730. [Google Scholar] [CrossRef] [PubMed]
- Riddell, M.F.; Gallagher, K.M.; McKinnon, C.D.; Callaghan, J.P. Influence of input device, work surface angle, and task on spine kinematics. Work 2016, 55, 773–782. [Google Scholar] [CrossRef] [PubMed]
- Aarås, A.; Fostervold, K.I.; Ro, O.; Thoresen, M.; Larsen, S. Postural load during VDU work: A comparison between various work postures. Ergonomics 1997, 40, 1255–1268. [Google Scholar] [CrossRef] [PubMed]


| Sitting | Standing | χ2 Value (Kendall’s W) | p-Value | Post Hoc Test Result | |||
|---|---|---|---|---|---|---|---|
| 45 Deg | 0 Deg | 45 Deg | 0 Deg | ||||
| Perceived discomfort | 3.0 ± 3.0 | 3.0 ± 3.0 | 3.0 ± 3.0 | 4.0 ± 2.0 | 13.796 (0.271) | 0.003 | † |
| Sitting | Standing | χ2 Value (Kendall’s W) | p-Value | Post Hoc Test Result | |||
|---|---|---|---|---|---|---|---|
| 45 Deg | 0 Deg | 45 Deg | 0 Deg | ||||
| Head inclination | 15.2 ± 6.6 | 40.3 ± 14.9 | 15.2 ± 6.4 | 39.5 ± 13.8 | 40.835 (0.801) | <0.001 | † |
| Trunk inclination | 16.6 ± 10.8 | 32.8 ± 14.3 | 4.9 ± 4.2 | 18.8 ± 12.9 | 39.988 (0.784) | <0.001 | * † |
| Neck flexion | 0.8 ± 10.0 | 8.8 ± 12.8 | 10.8 ± 8.1 | 18.5 ± 10.6 | 36.035 (0.707) | <0.001 | * † |
| Thoracic flexion | 2.3 ± 5.2 | 5.8 ± 8.7 | 2.8 ± 4.7 | 6.7 ± 9.8 | 28.694 (0.563) | <0.001 | † |
| Lumbar flexion | 18.1 ± 24.2 | 27.3 ± 21.0 | 3.3 ± 4.8 | 8.9 ± 9.6 | 35.612 (0.698) | <0.001 | * † |
| Shoulder flexion | 51.9 ± 8.3 | 47.9 ± 16.1 | 39.2 ± 13.4 | 28.8 ± 11.3 | 31.800 (0.624) | <0.001 | * |
| Sitting | Standing | χ2 Value (Kendall’s W) | p-Value | Post Hoc Test Result | |||
|---|---|---|---|---|---|---|---|
| 45 Deg | 0 Deg | 45 Deg | 0 Deg | ||||
| Right | |||||||
| Anterior deltoid | 37.0 ± 13.4 | 22.7 ± 16.3 | 30.1 ± 14.9 | 13.7 ± 5.1 | 40.553 (0.795) | <0.001 | * † |
| Splenius capitis | 29.1 ± 18.3 | 31.9 ± 16.1 | 25.0 ± 13.3 | 26.1 ± 14.0 | 19.235 (0.377) | <0.001 | * |
| Upper trapezius | 25.5 ± 12.0 | 25.8 ± 9.8 | 21.6 ± 13.5 | 22.3 ± 17.8 | 13.941 (0.273) | 0.003 | * |
| Middle trapezius | 31.8 ± 17.6 | 29.8 ± 7.8 | 25.3 ± 19.8 | 23.7 ± 18.5 | 14.435 (0.283) | 0.002 | * |
| Erector spinae | 37.7 ± 14.5 | 36.8 ± 22.1 | 28.3 ± 17.9 | 28.2 ± 22.1 | 11.521 (0.226) | 0.009 | * |
| Multifidus | 38.5 ± 15.7 | 52.8 ± 29.6 | 32.4 ± 13.3 | 50.1 ± 18.3 | 15.706 (0.308) | 0.001 | † |
| Left | |||||||
| Anterior deltoid | 14.7 ± 8.5 | 17.4 ± 10.1 | 17.4 ± 6.1 | 18.6 ± 9.1 | 5.400 (0.106) | 0.145 | - |
| Splenius capitis | 34.1 ± 9.4 | 45.4 ± 12.5 | 31.3 ± 9.8 | 37.6 ± 12.5 | 25.165 (0.493) | <0.001 | * † |
| Upper trapezius | 22.7 ± 22.9 | 27.4 ± 25.5 | 19.9 ± 22.0 | 25.6 ± 23.5 | 25.165 (0.493) | <0.001 | * † |
| Middle trapezius | 25.7 ± 21.6 | 30.0 ± 31.1 | 20.7 ± 17.2 | 24.5 ± 18.0 | 18.459 (0.362) | <0.001 | * † |
| Erector spinae | 32.1 ± 19.9 | 35.9 ± 11.3 | 19.7 ± 7.5 | 22.2 ± 10.6 | 17.500 (0.486) | 0.001 | * |
| Multifidus | 28.0 ± 15.8 | 37.6 ± 16.2 | 16.8 ± 9.6 | 33.1 ± 23.3 | 8.976 (0.178) | 0.035 | † |
Publisher’s Note: MDPI stays neutral with regard to jurisdictional claims in published maps and institutional affiliations. |
© 2022 by the authors. Licensee MDPI, Basel, Switzerland. This article is an open access article distributed under the terms and conditions of the Creative Commons Attribution (CC BY) license (https://creativecommons.org/licenses/by/4.0/).
Share and Cite
Tomita, Y.; Suzuki, Y.; Shibagaki, A.; Takahashi, S.; Matsuka, Y. Physical Load While Using a Tablet at Different Tilt Angles during Sitting and Standing. Sensors 2022, 22, 8237. https://doi.org/10.3390/s22218237
Tomita Y, Suzuki Y, Shibagaki A, Takahashi S, Matsuka Y. Physical Load While Using a Tablet at Different Tilt Angles during Sitting and Standing. Sensors. 2022; 22(21):8237. https://doi.org/10.3390/s22218237
Chicago/Turabian StyleTomita, Yosuke, Yoshitaka Suzuki, Akari Shibagaki, Shingo Takahashi, and Yoshizo Matsuka. 2022. "Physical Load While Using a Tablet at Different Tilt Angles during Sitting and Standing" Sensors 22, no. 21: 8237. https://doi.org/10.3390/s22218237