
Drone-Based Environmental Monitoring and Image Processing Approaches for Resource Estimates of Private Native Forest
 , and
, and
Abstract
:1. Introduction
2. Recent Works on Drone-Based Approaches for Environmental Monitoring
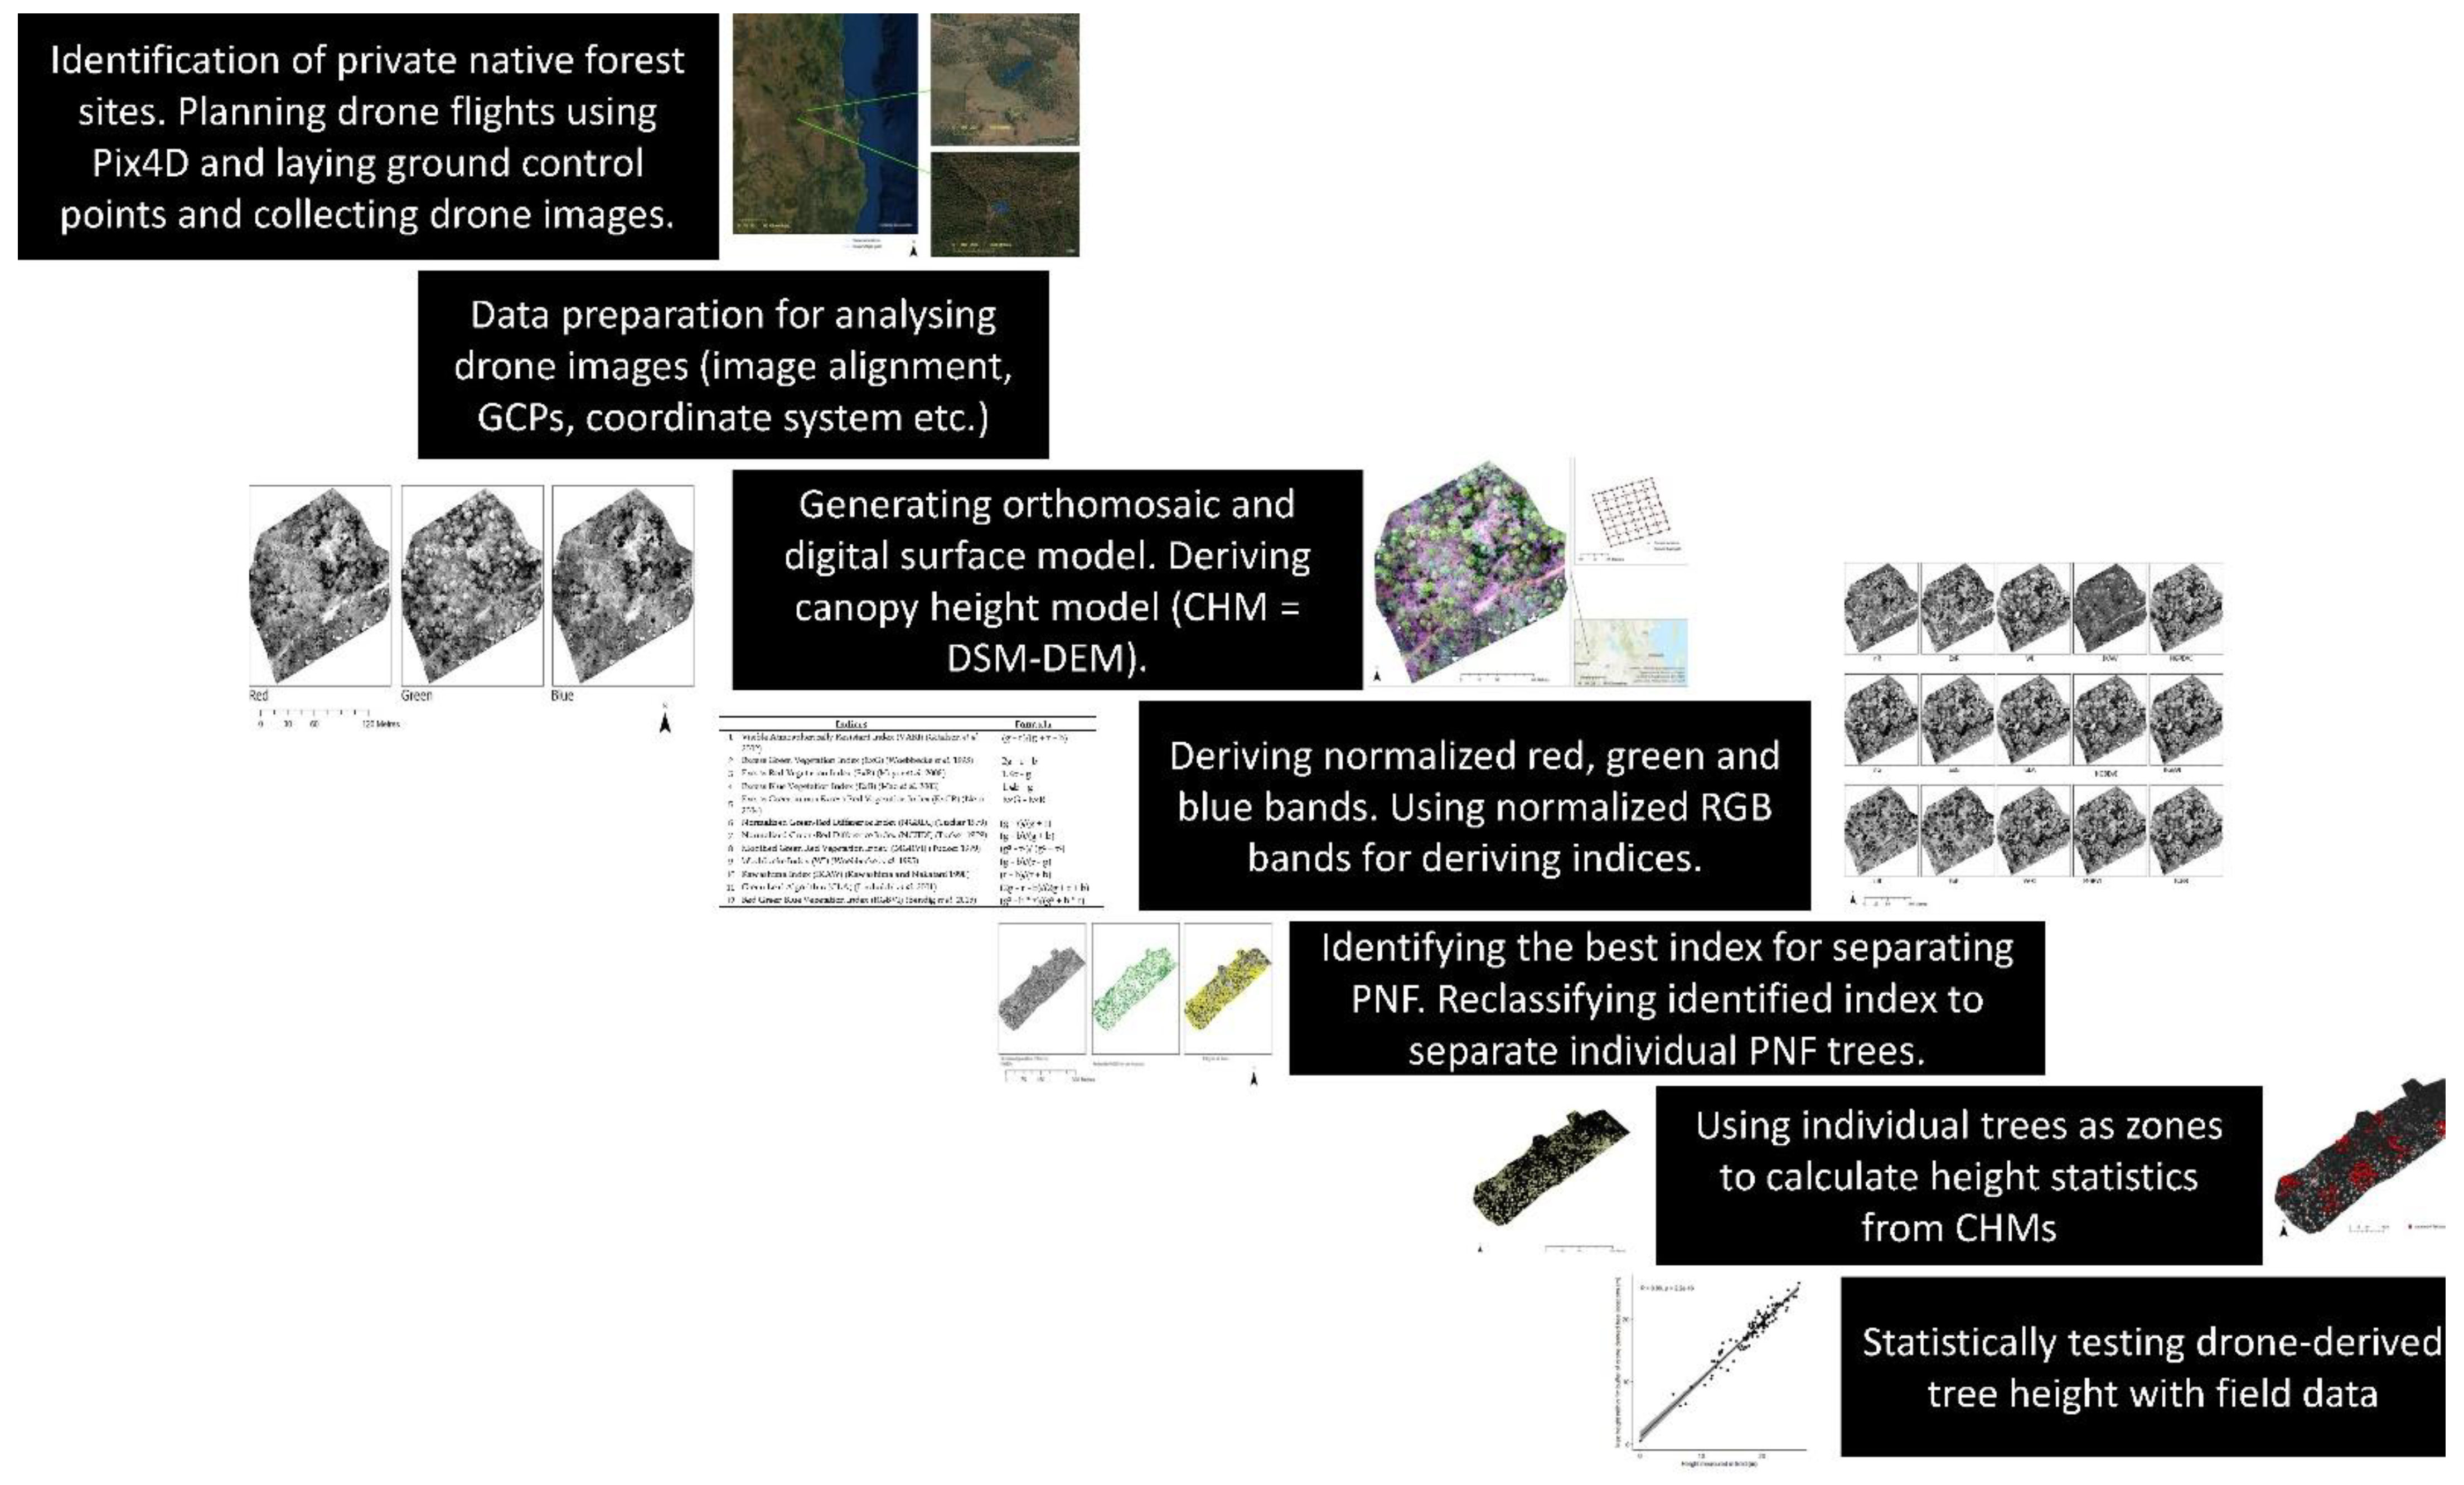
3. Methodology and Data Collection
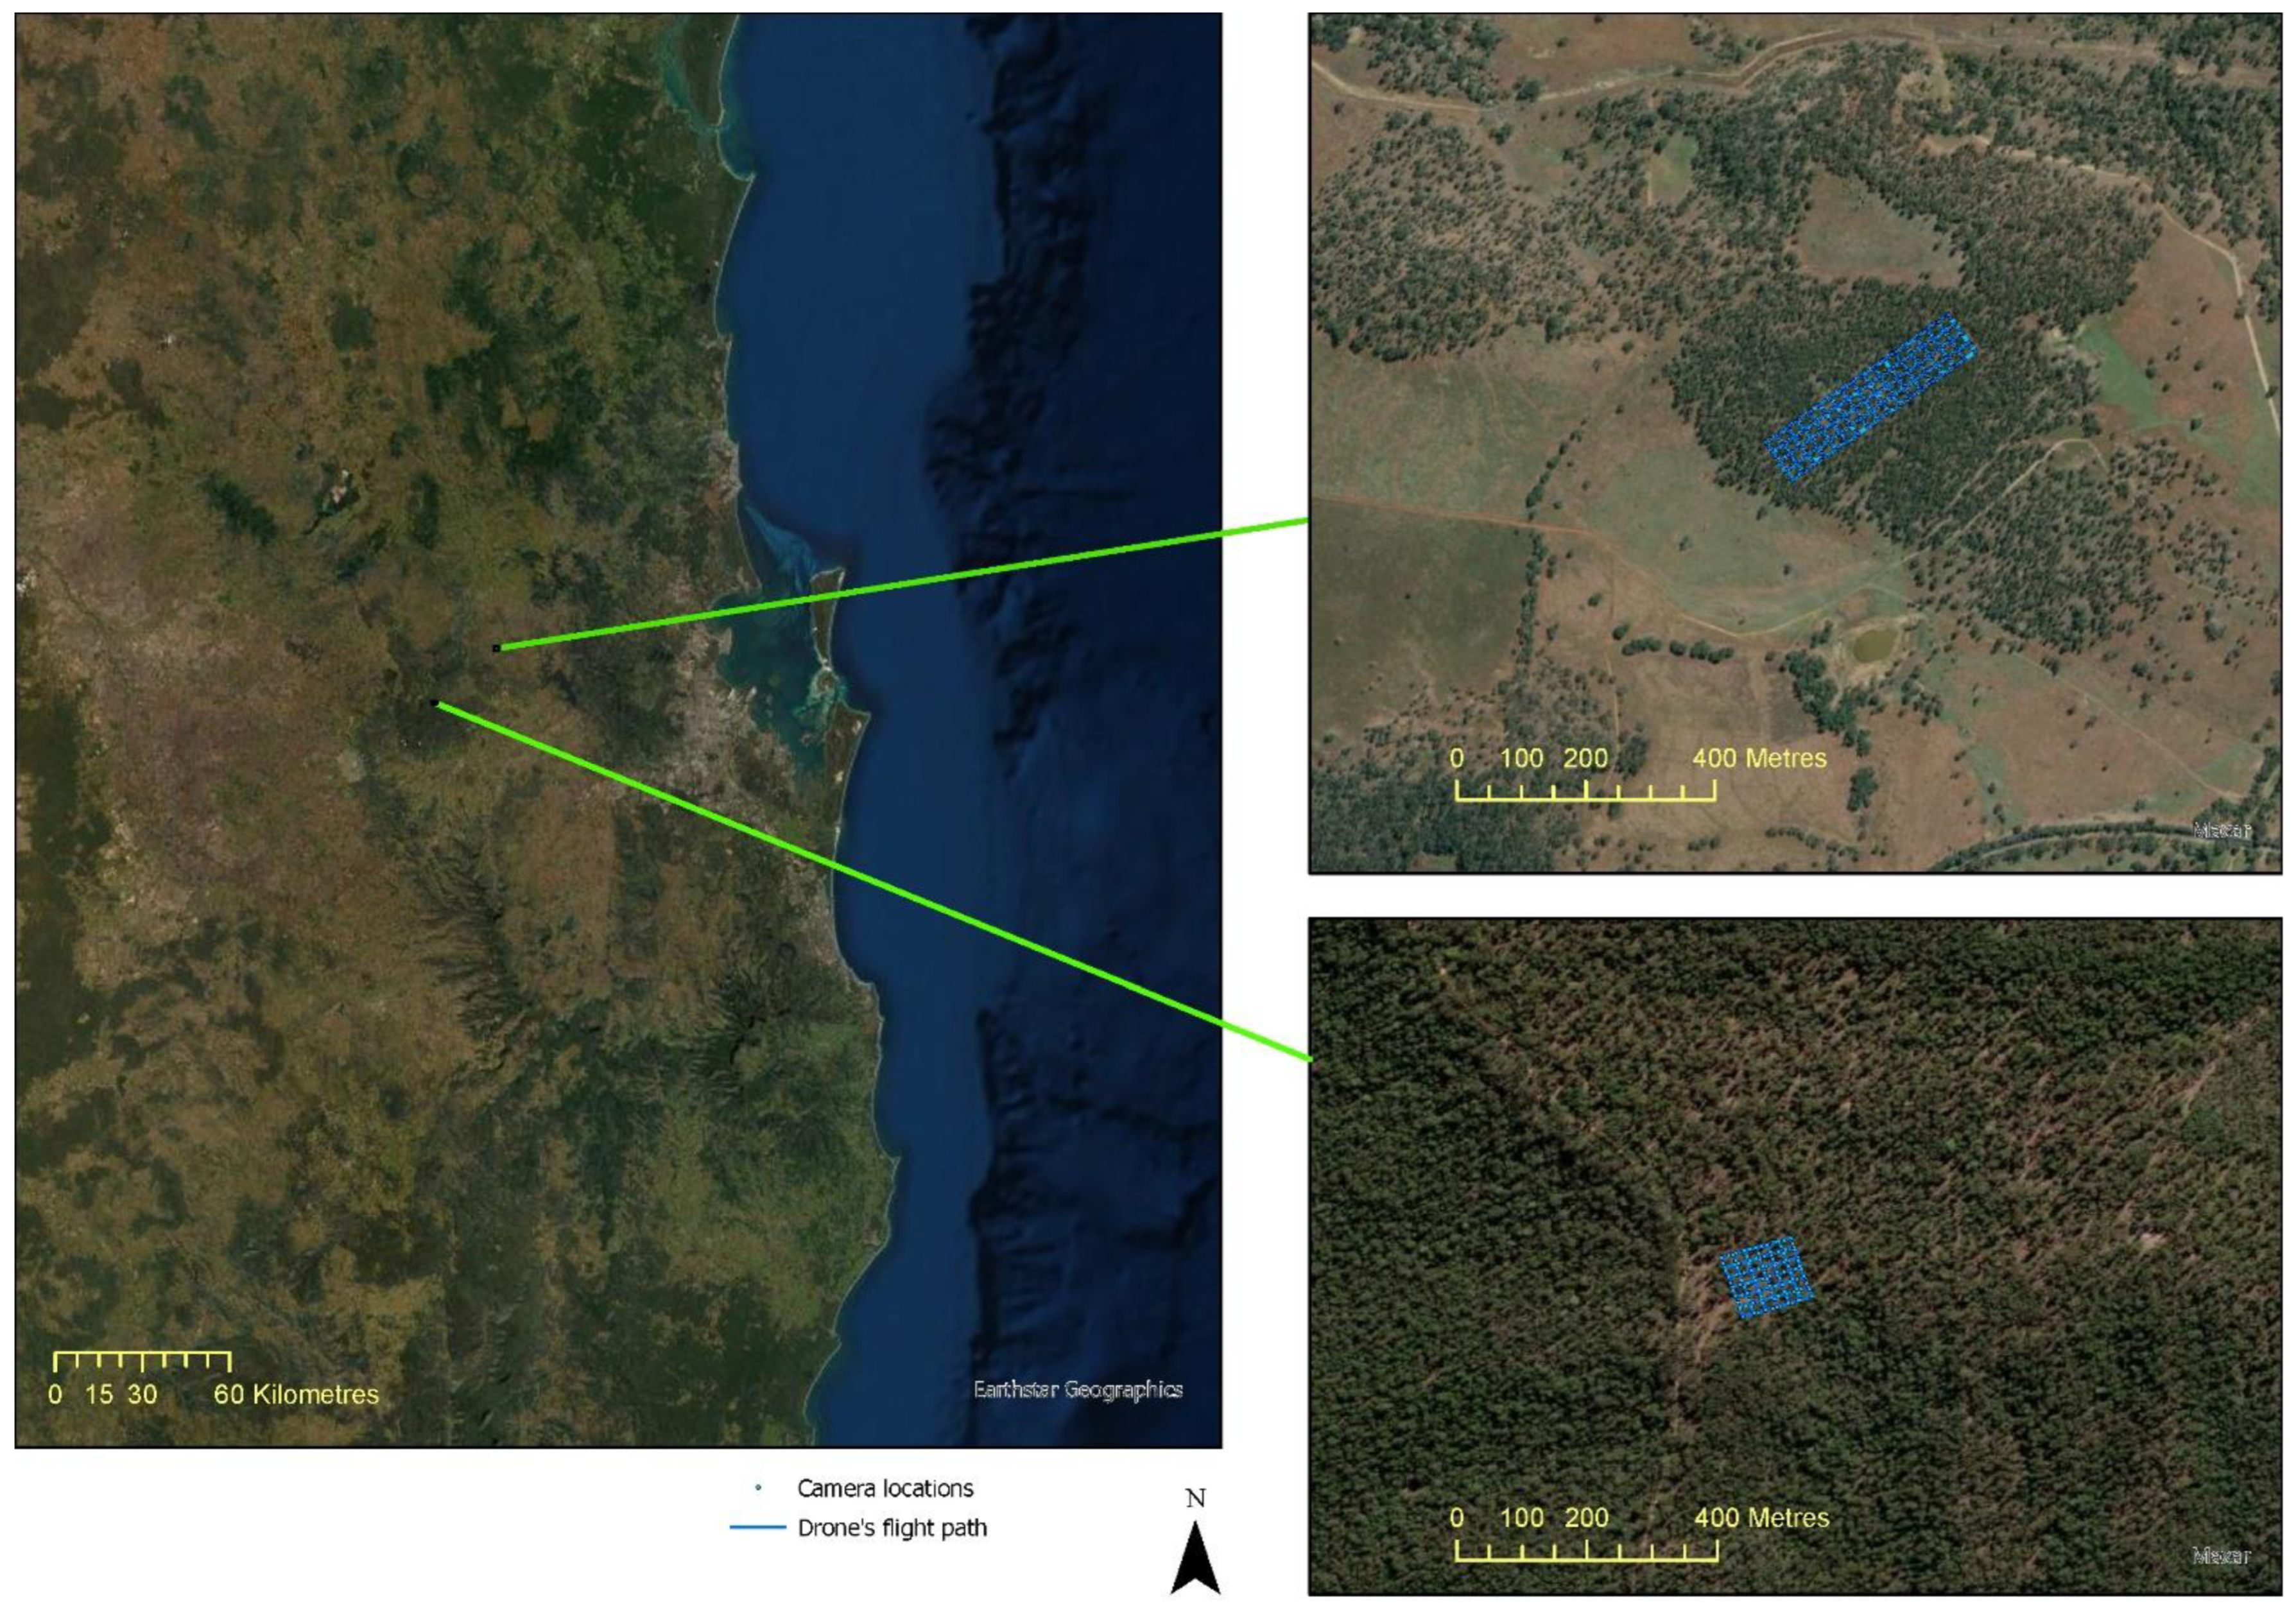
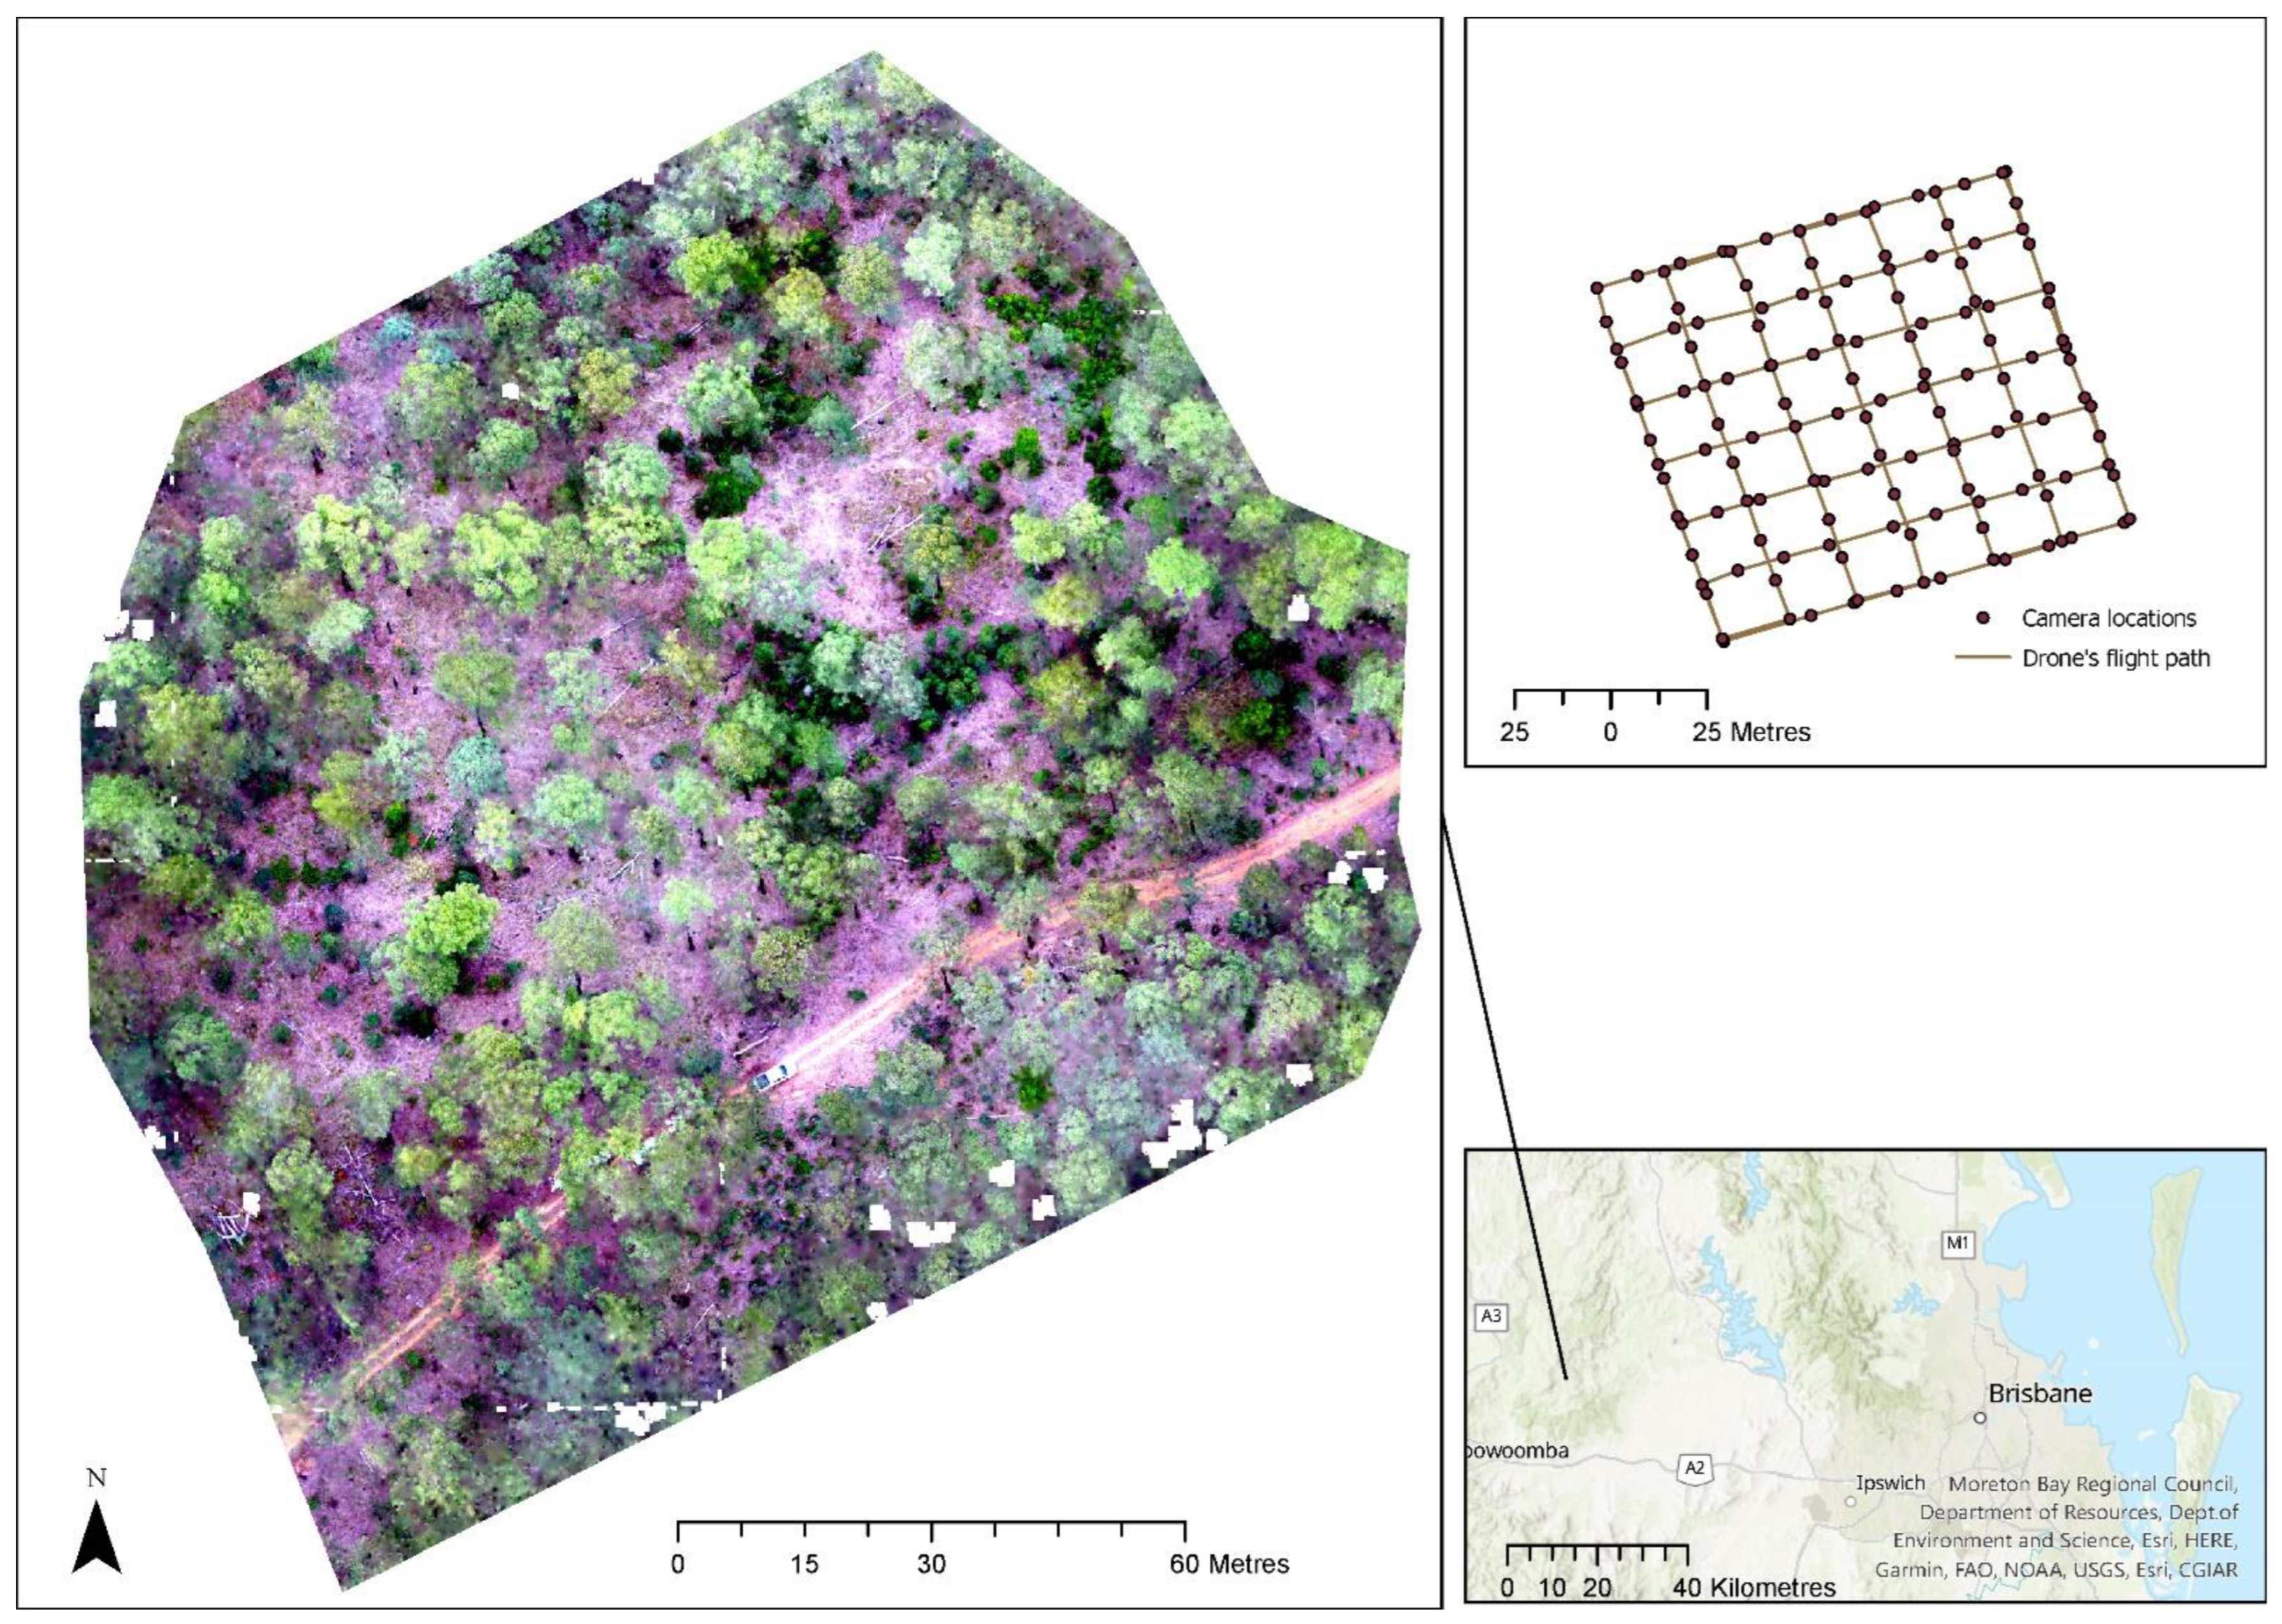
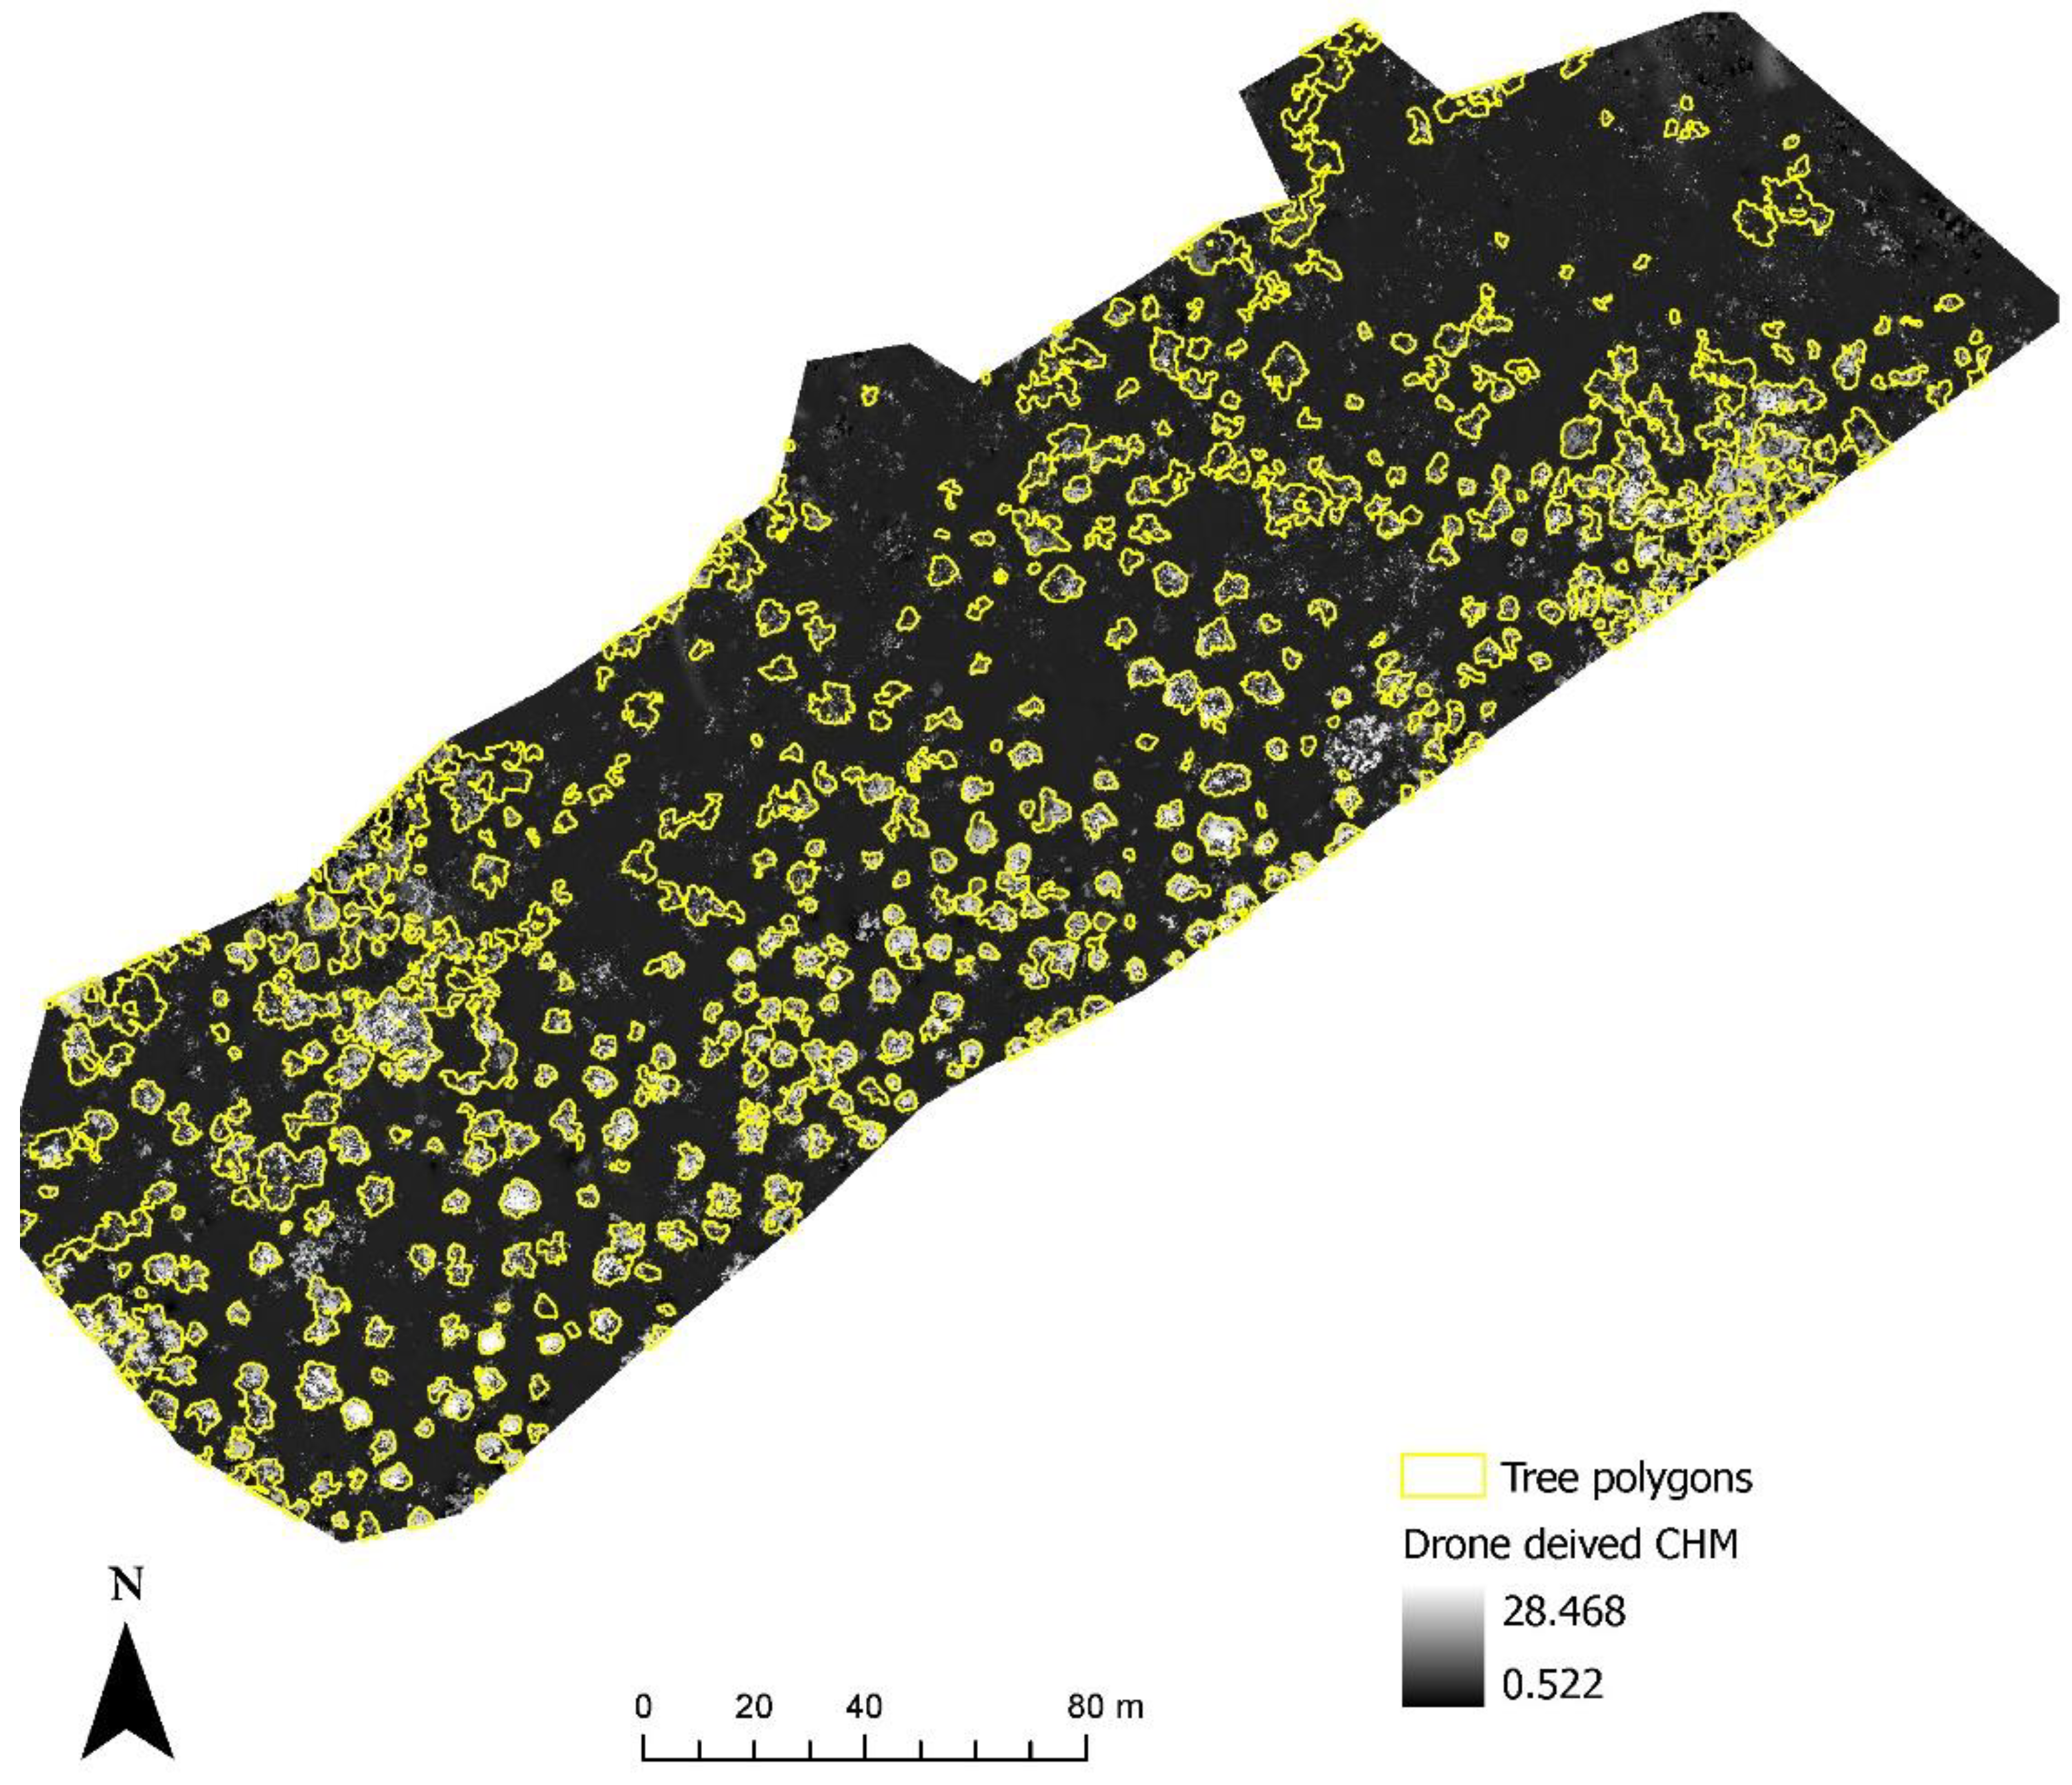
3.1. Site Selection for Drone Monitoring
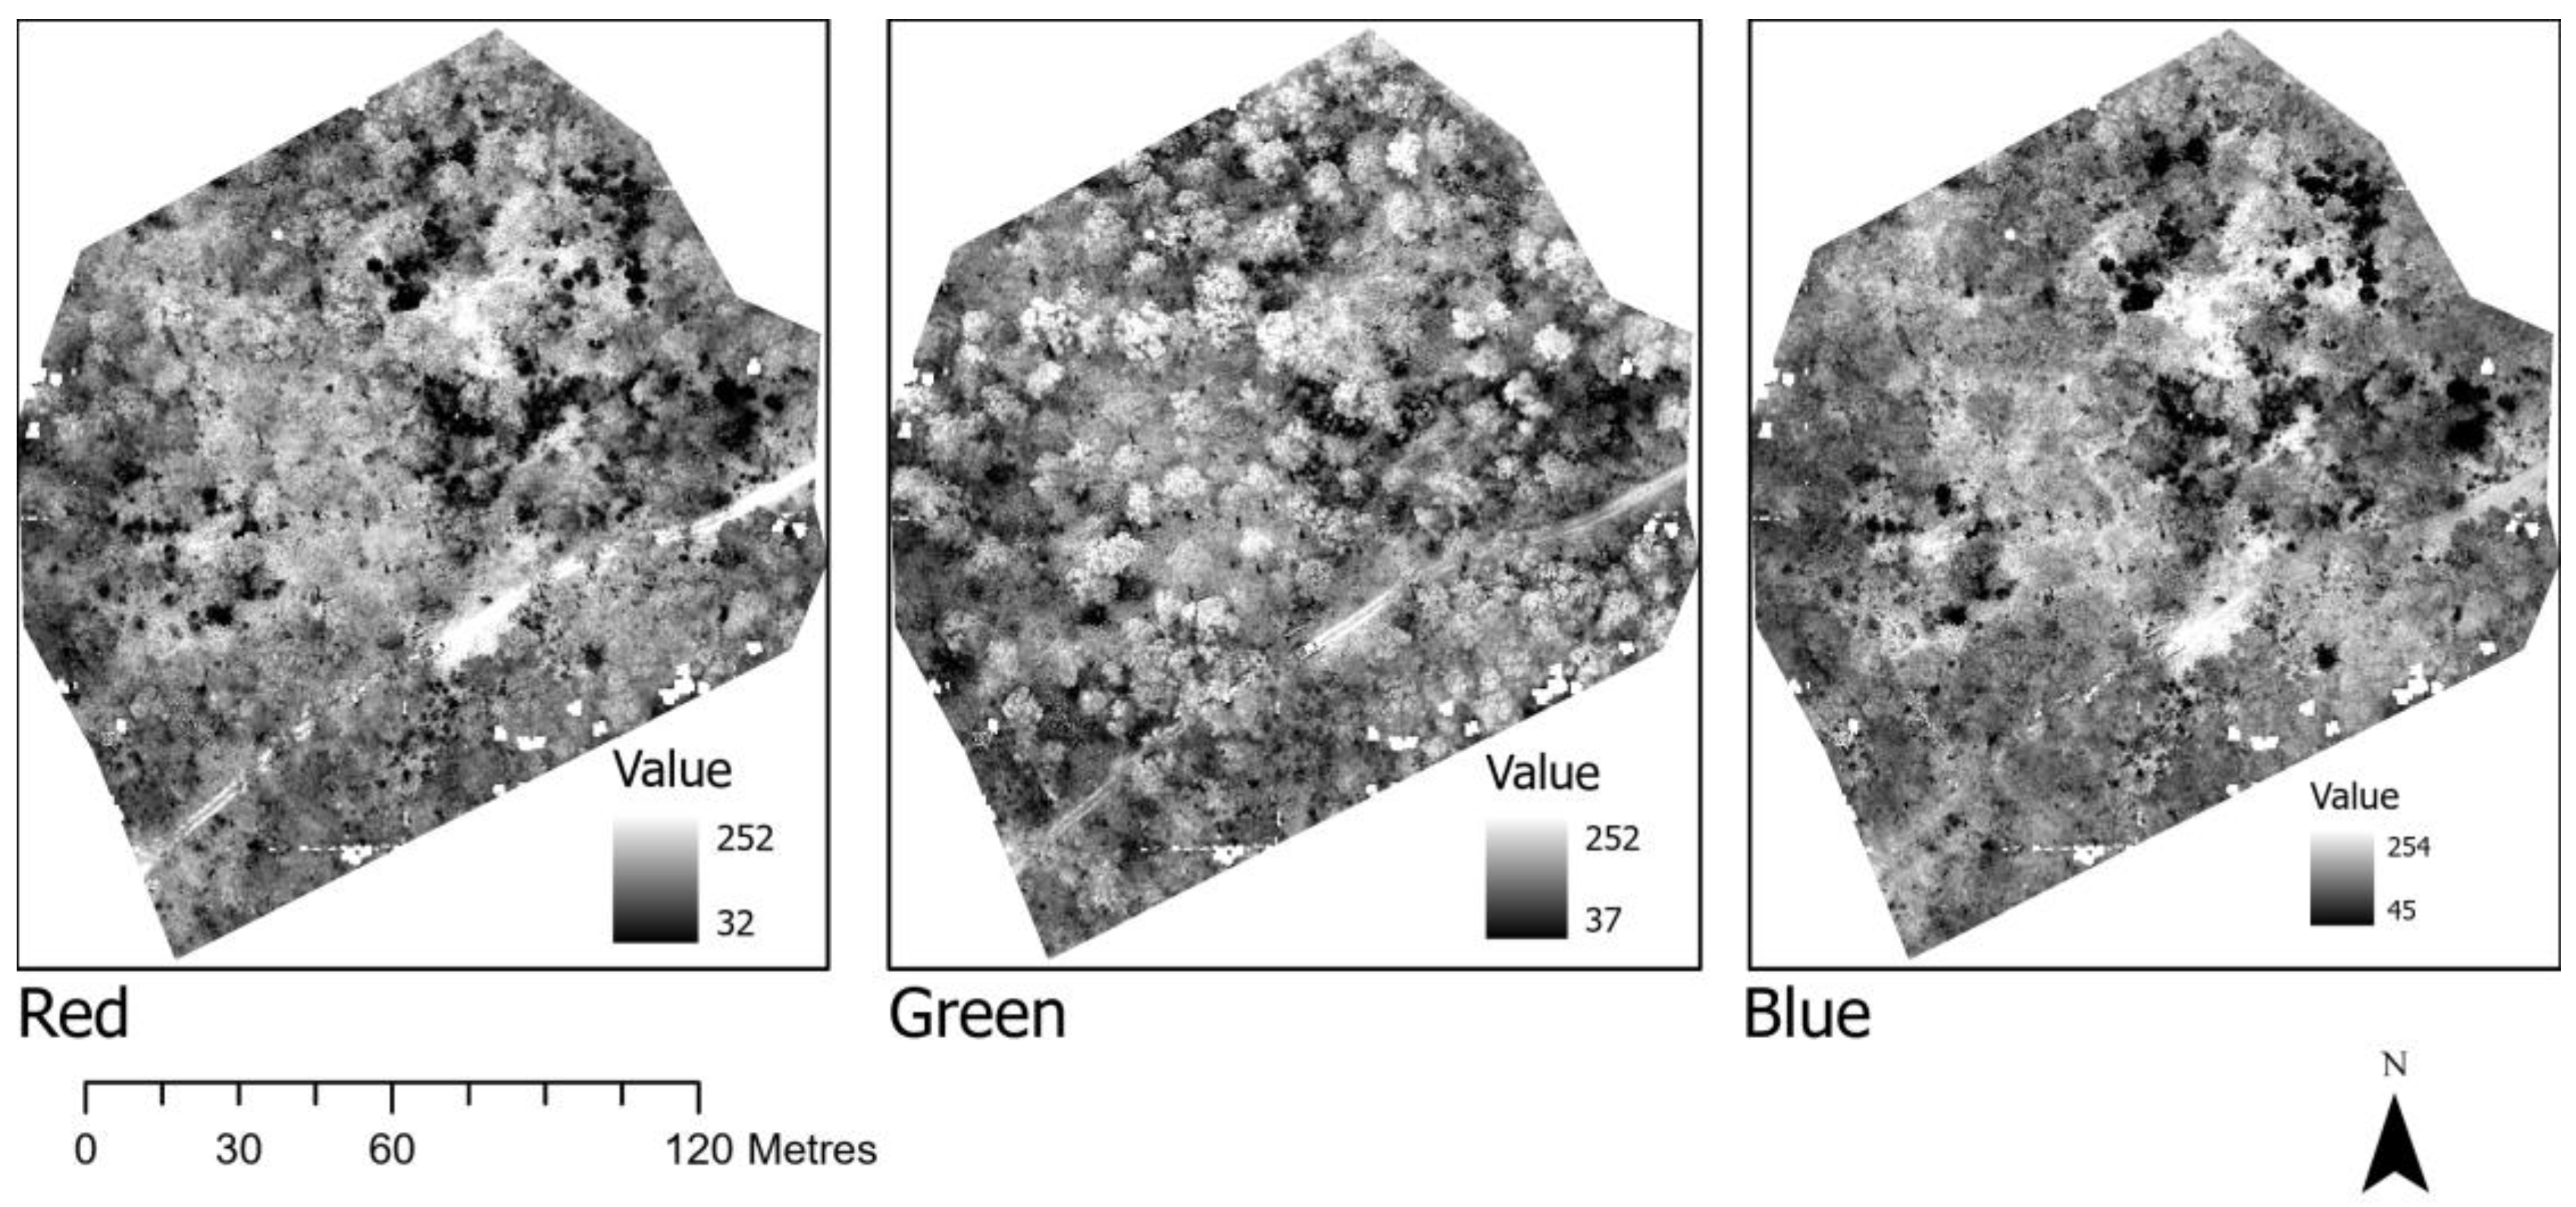
3.2. Image Analysis of Drone Images
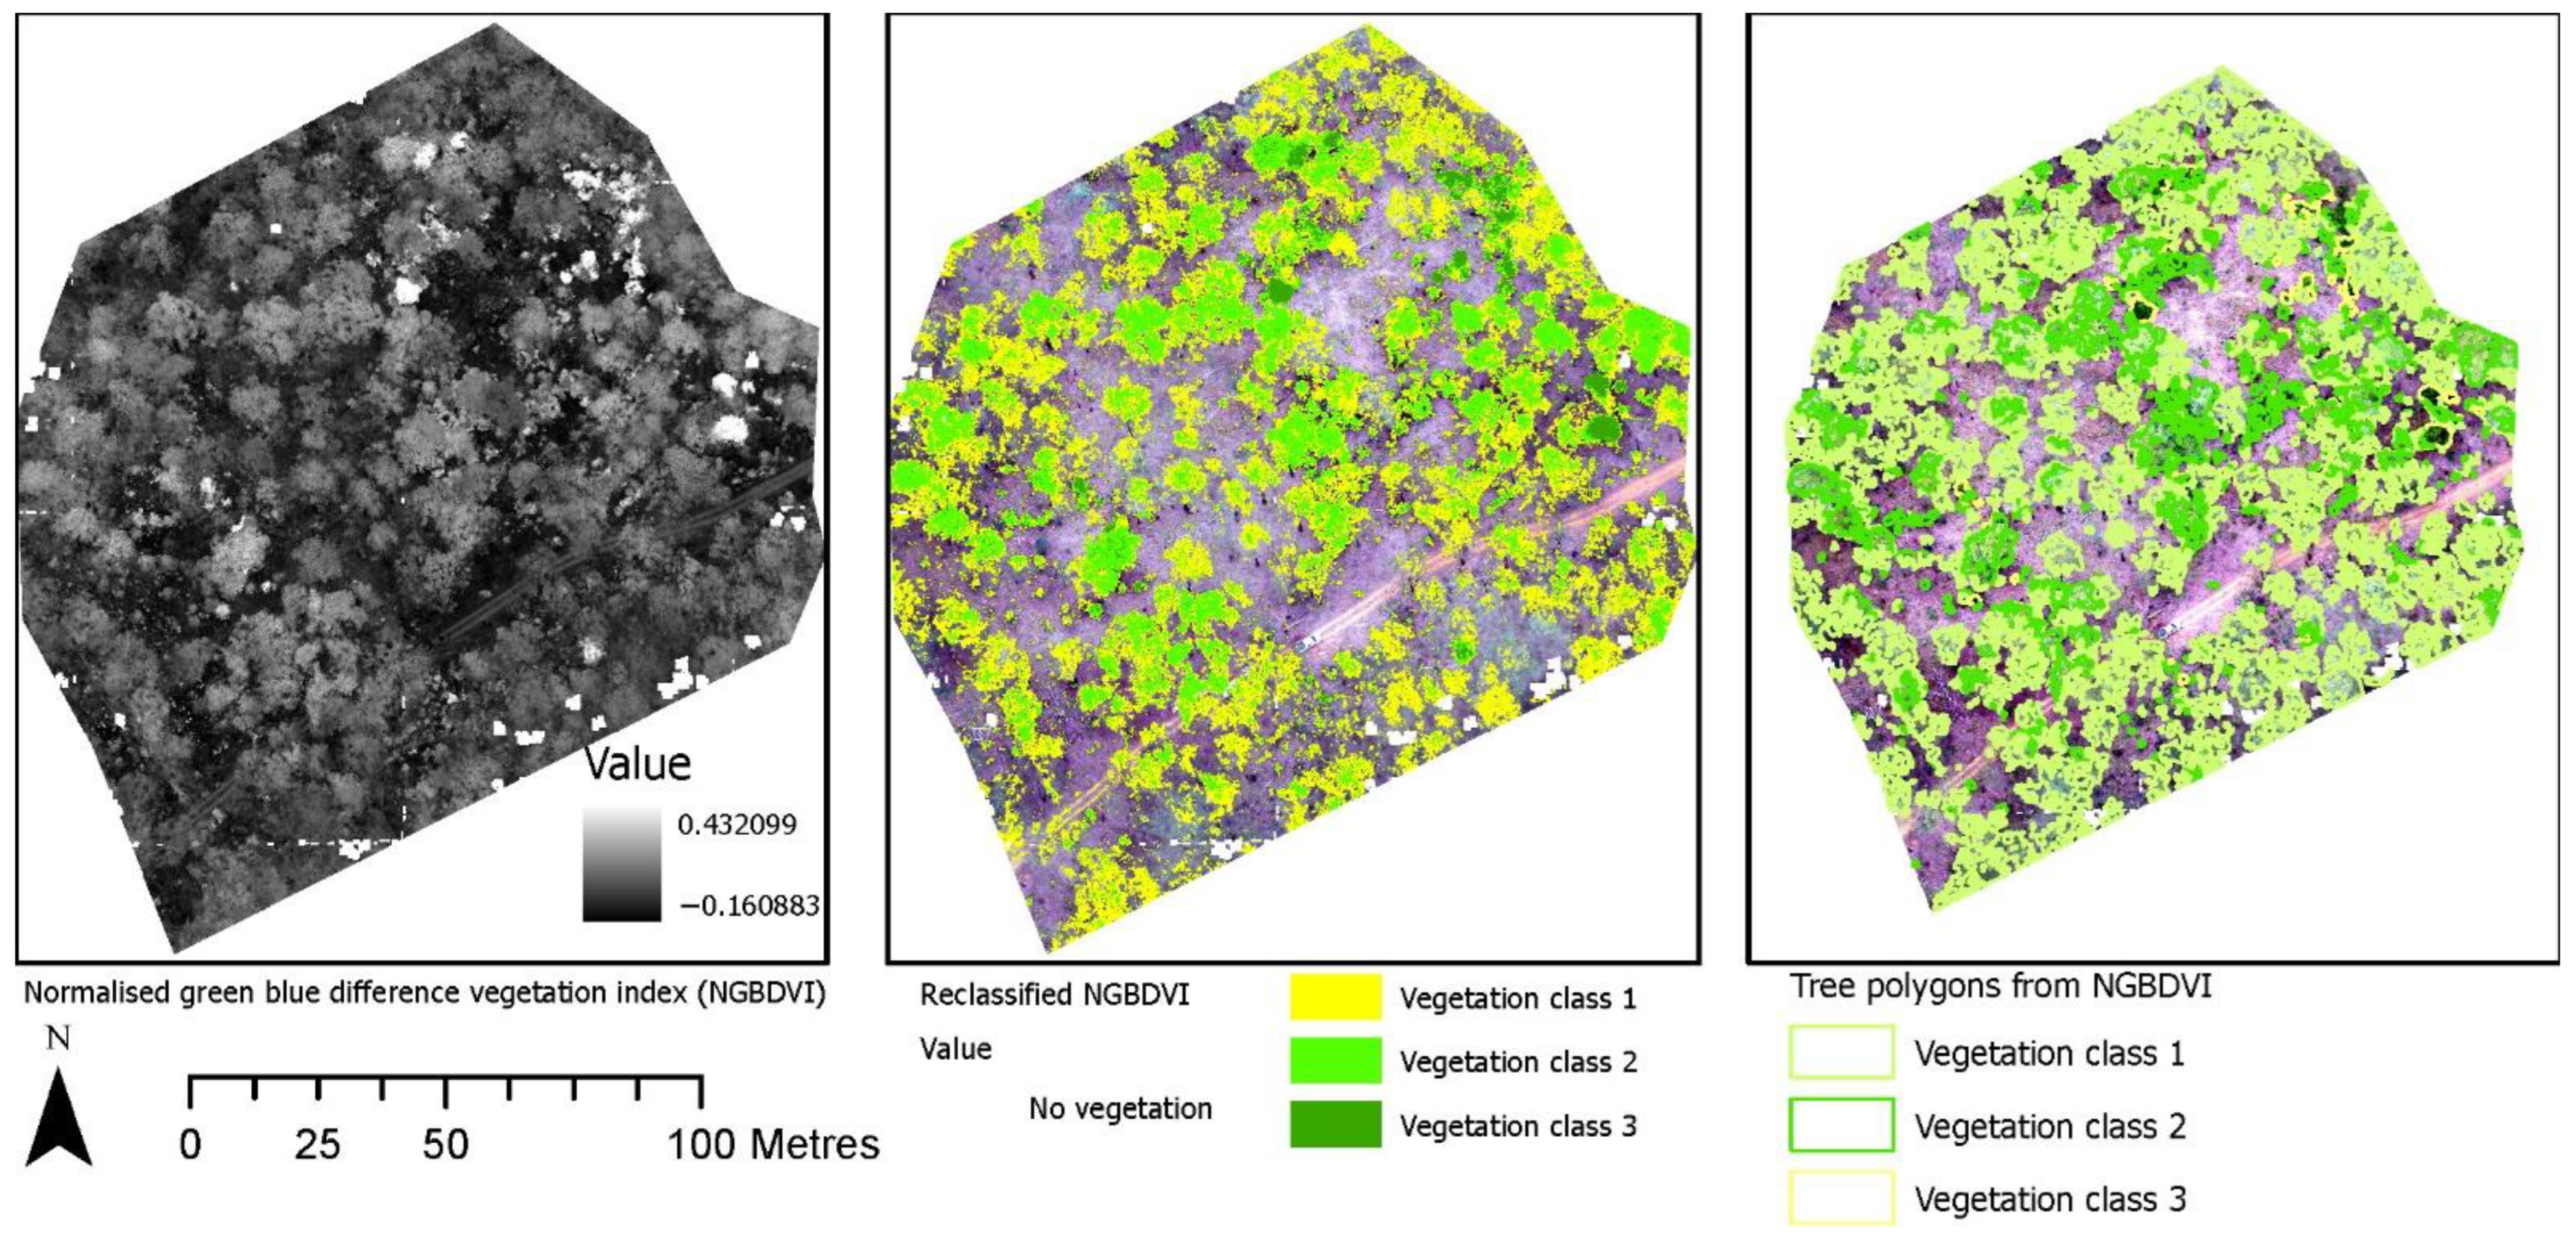
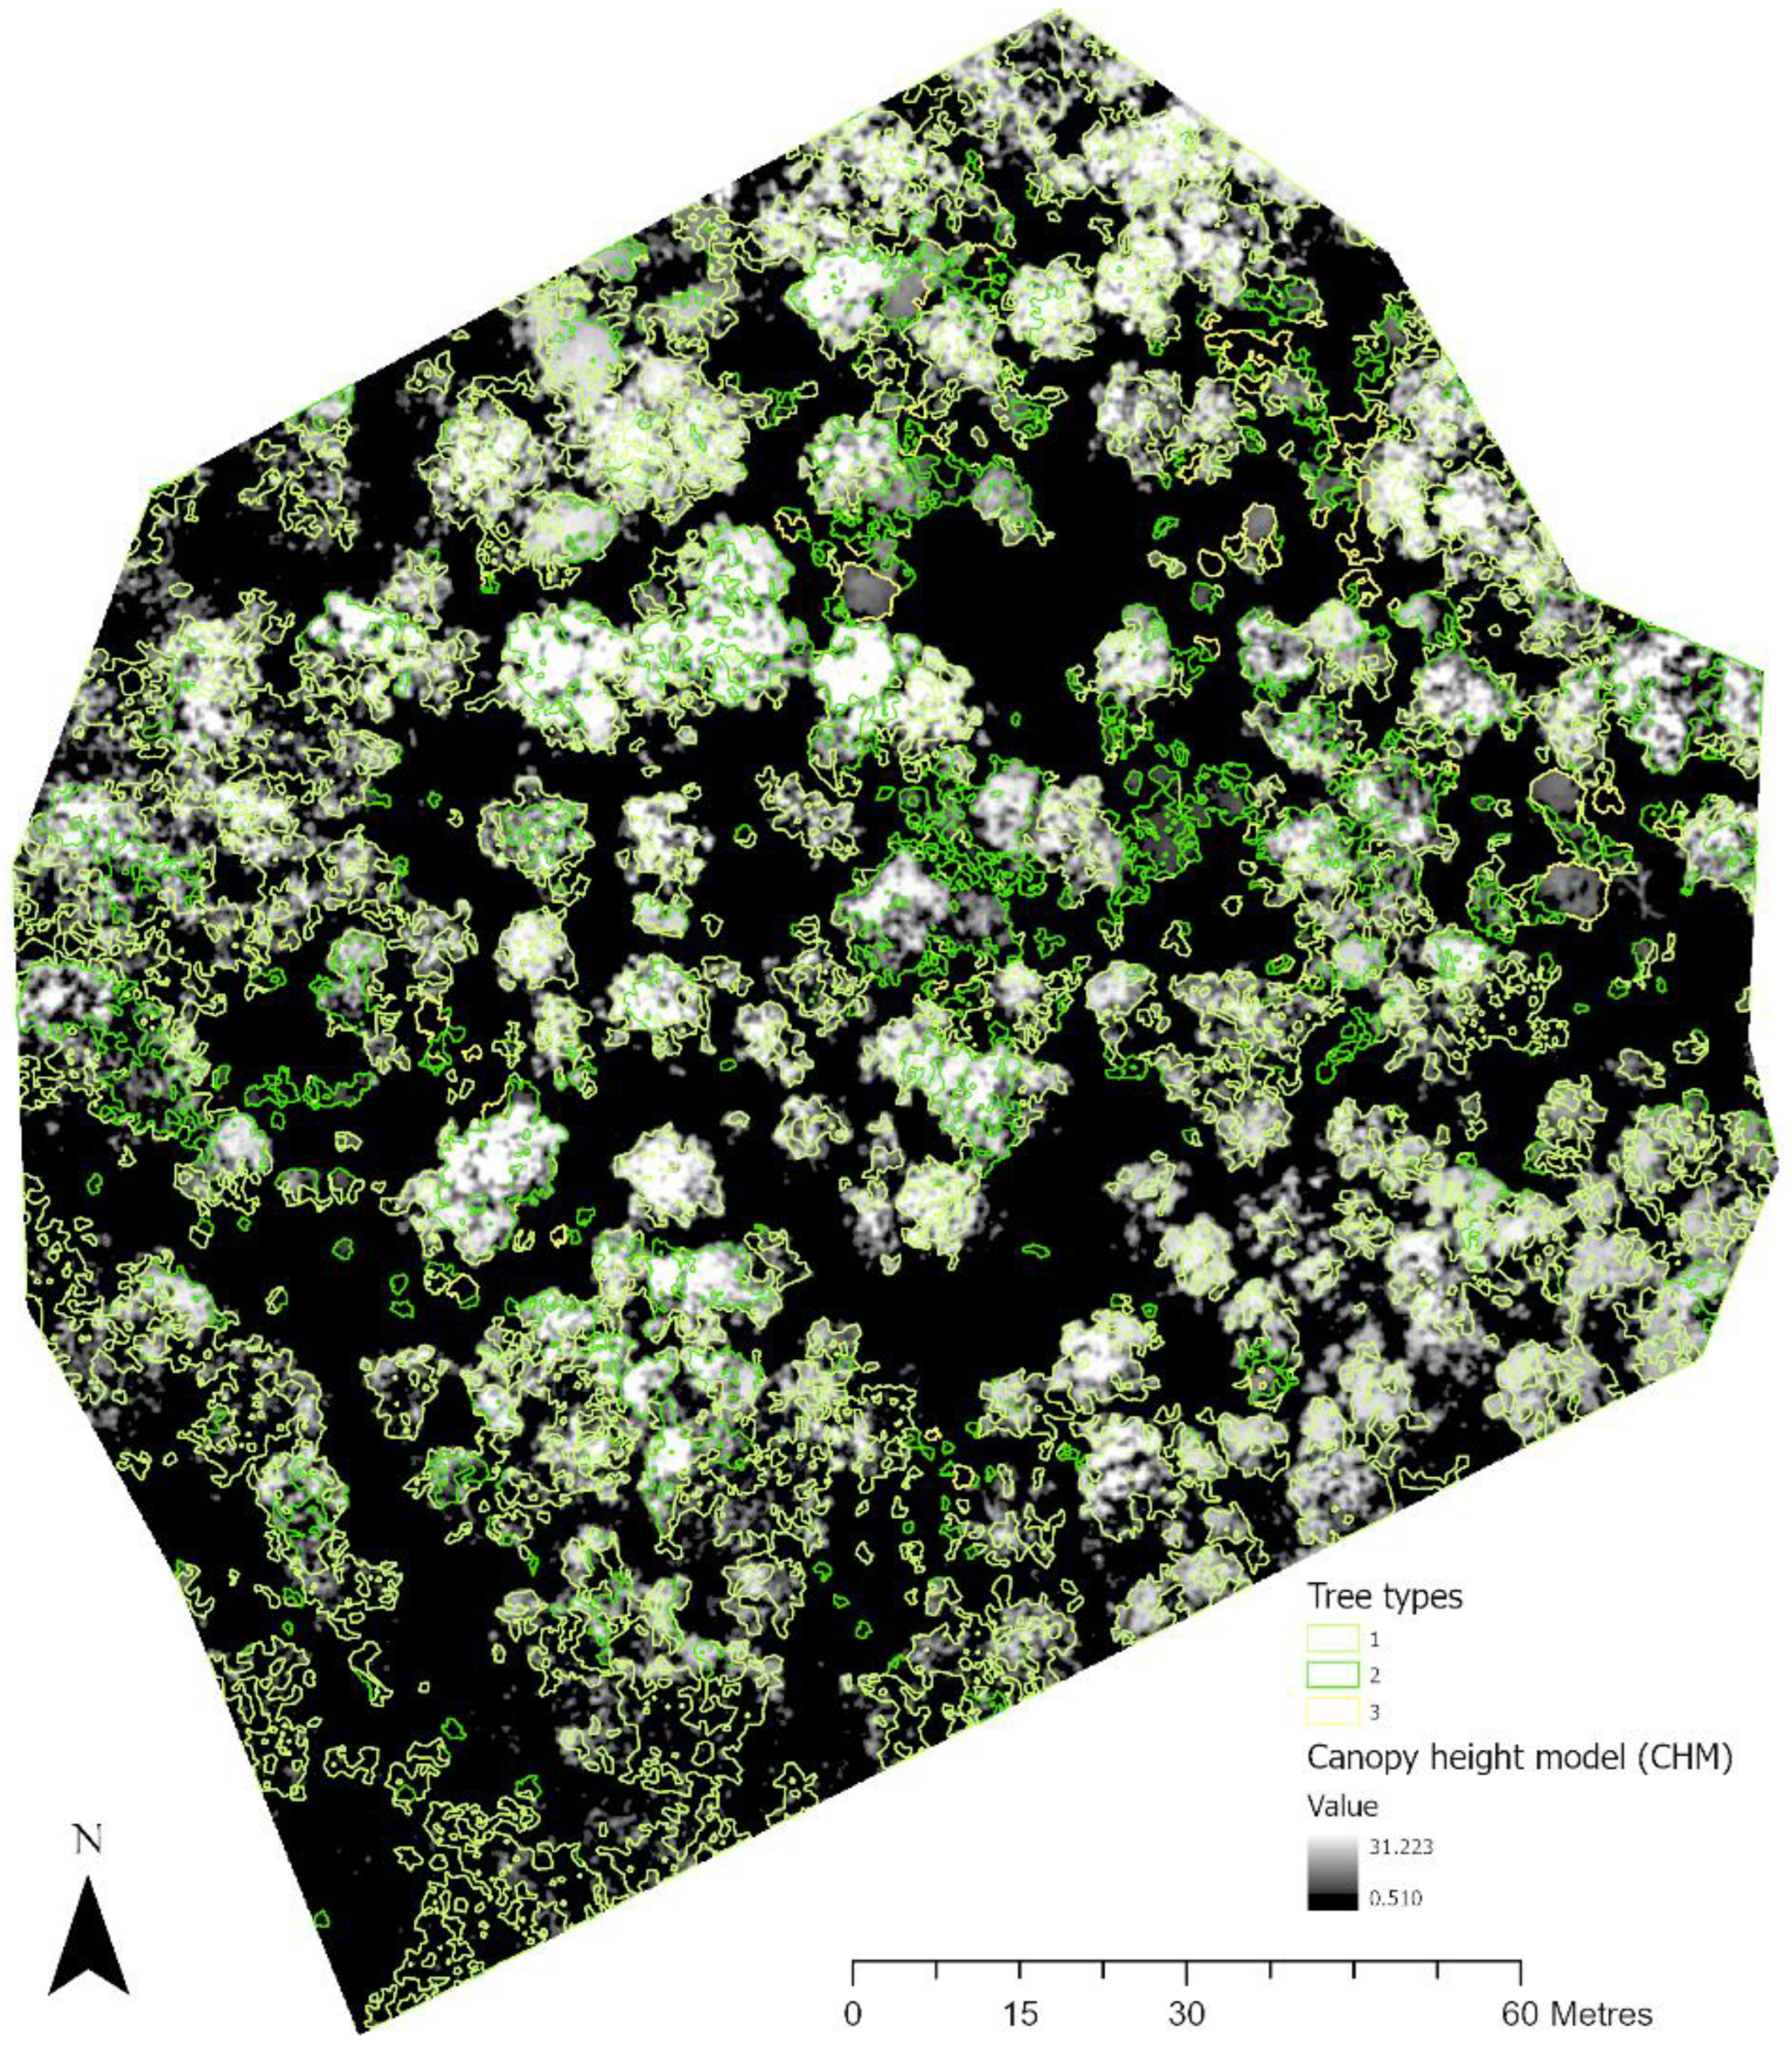
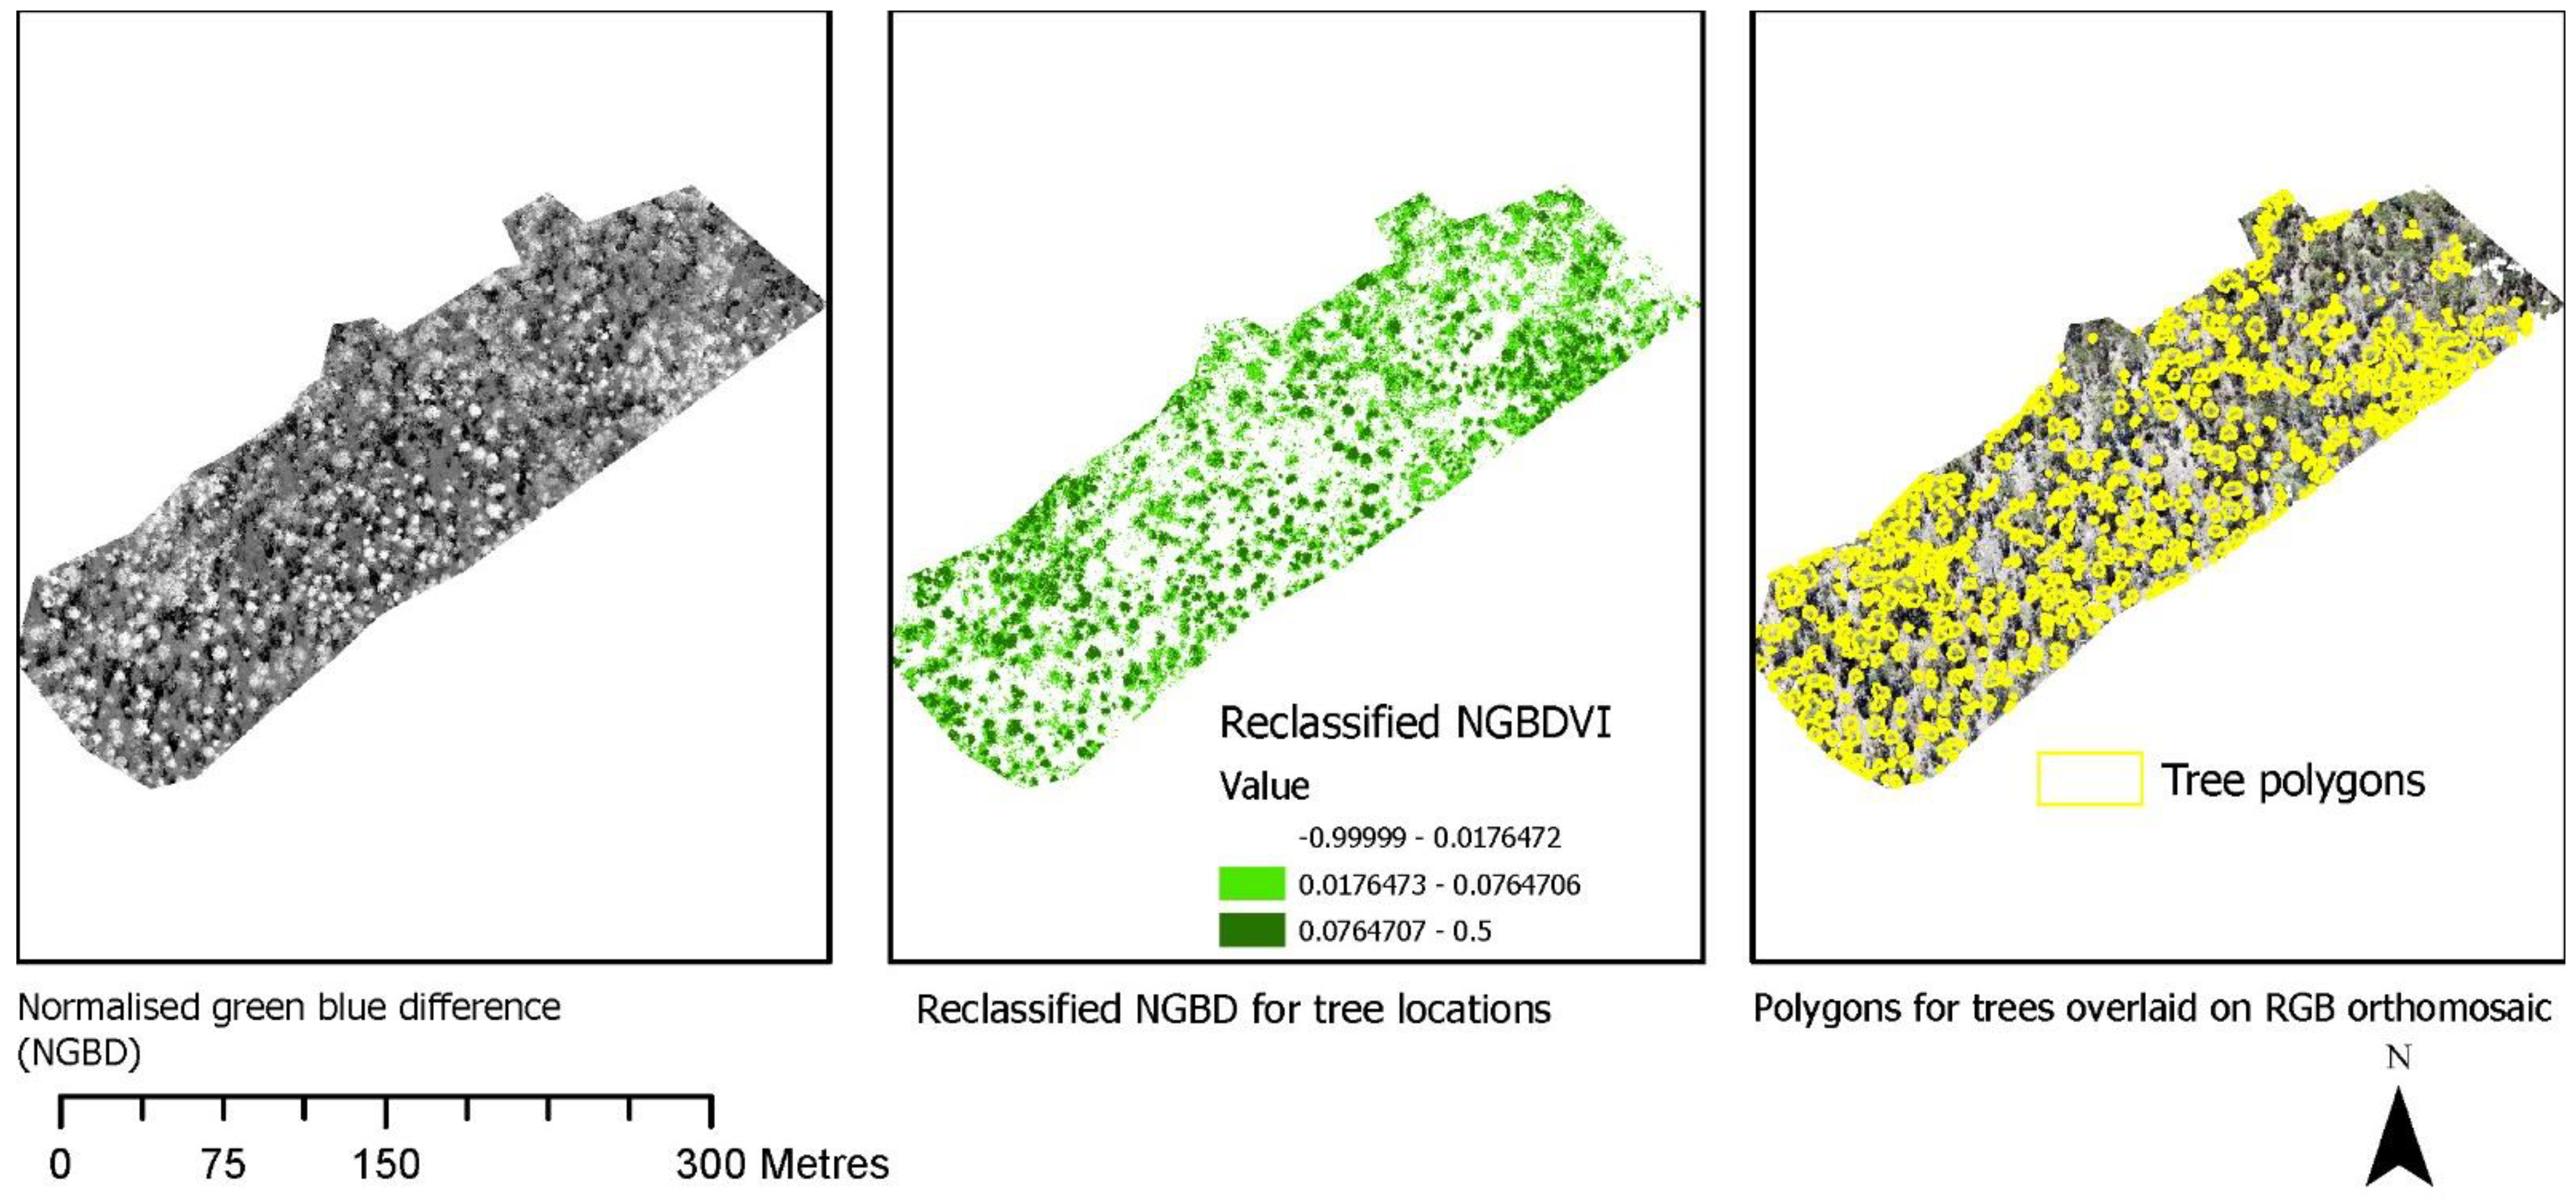
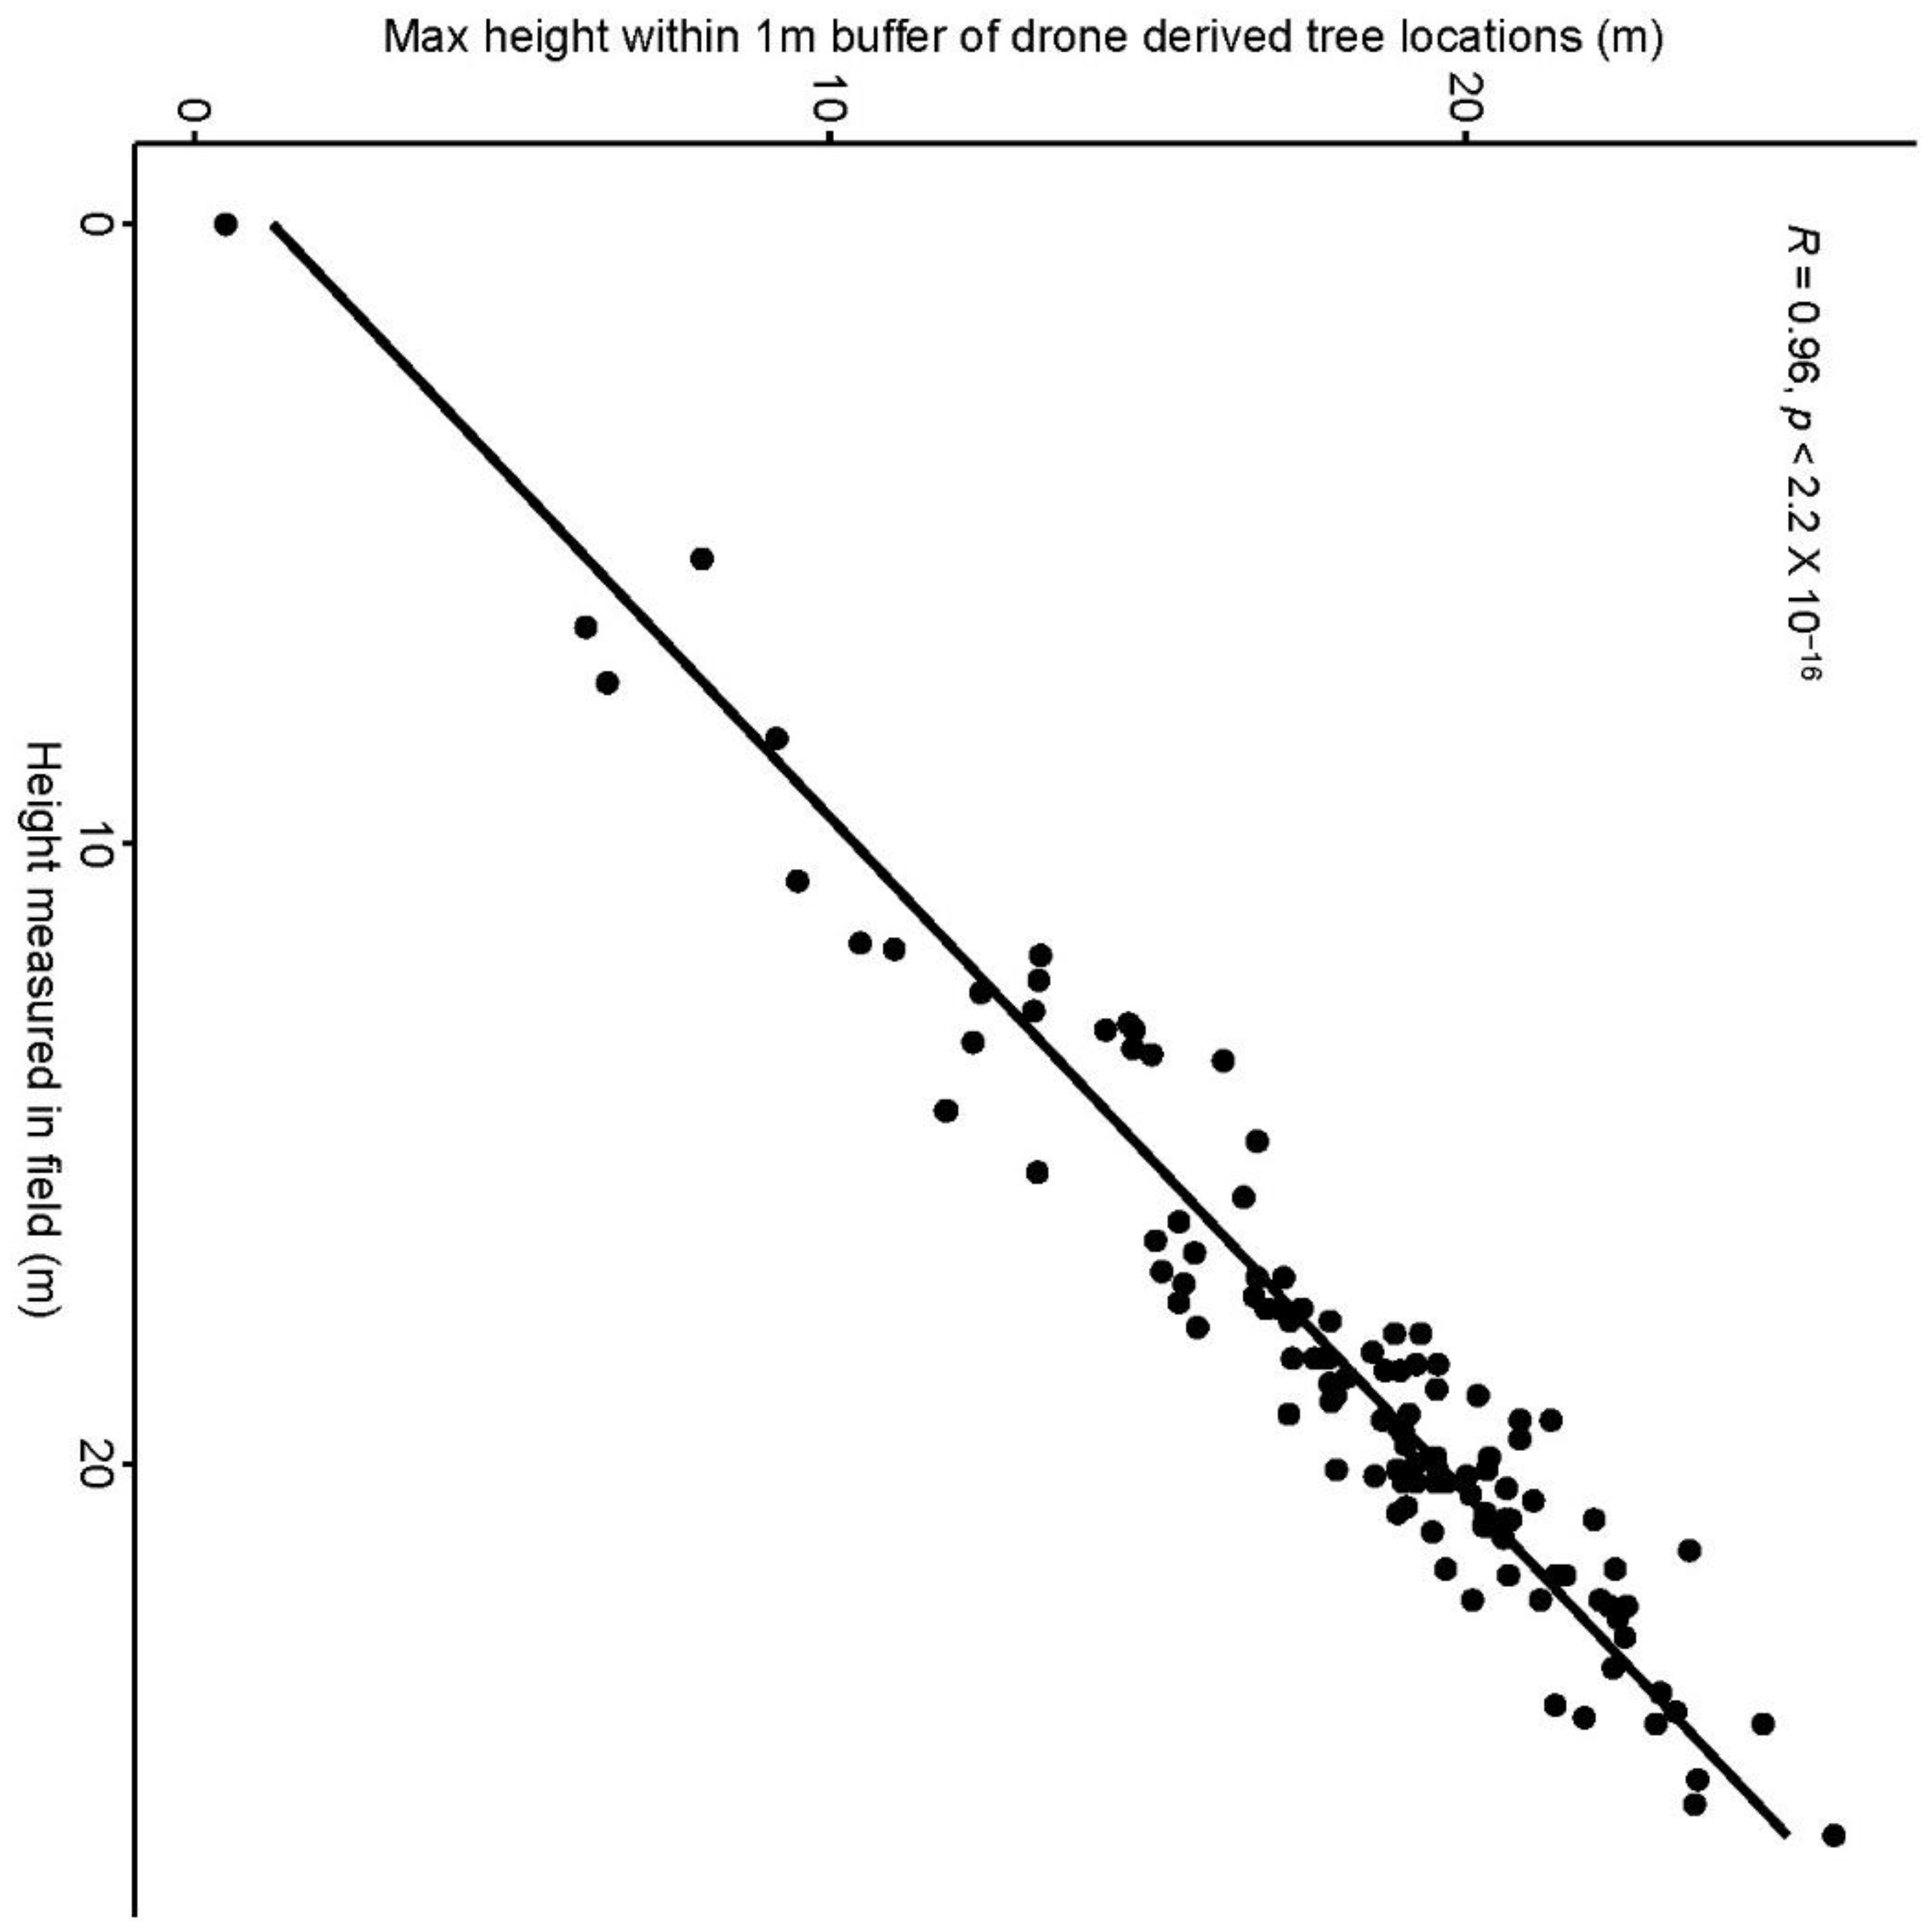
4. Results and Discussion
5. Conclusions
Author Contributions
Funding
Institutional Review Board Statement
Informed Consent Statement
Data Availability Statement
Conflicts of Interest
References
- Lewis, T.; Menzies, T.; Brawner, J.T.; Venn, T.; Francis, B.; Ryan, S.; Schulke, B.; Cameron, N.; Kelly, A. Improving Productivity of the Private Native Forest Resource in Southern Queensland and Northern New South Wales. Available online: https://www.fwpa.com.au/resources/reports/resources.html (accessed on 11 April 2022).
- Dash, J.P.; Watt, M.S.; Bhandari, S.; Watt, P. Characterising forest structure using combinations of airborne laser scanning data, RapidEye satellite imagery and environmental variables. Forestry 2015, 89, 159–169. [Google Scholar] [CrossRef] [Green Version]
- White, J.C.; Coops, N.C.; Wulder, M.A.; Vastaranta, M.; Hilker, T.; Tompalski, P. Remote sensing technologies for enhancing forest inventories: A review. Can. J. Remote Sens. 2016, 42, 619–641. [Google Scholar] [CrossRef] [Green Version]
- Wulder, M.A.; Coops, N.C.; Hudak, A.T.; Morsdorf, F.; Nelson, R.; Newnham, G.; Vastaranta, M. Status and prospects for LiDAR remote sensing of forested ecosystems. Can. J. Remote Sens. 2013, 39, S1–S5. [Google Scholar] [CrossRef] [Green Version]
- Groot, A.; Cortini, F.; Wulder, M.A. Crown-fibre attribute relationships for enhanced forest inventory: Progress and prospects. For. Chron. 2015, 91, 266–279. [Google Scholar] [CrossRef] [Green Version]
- Stone, C.; Osborn, J. Deployment and Integration of Cost-Effective High Resolution Remotely Sensed Data for the Australian Forest Industry. Melb. For. Wood Prod. Aust. 2017. Available online: https://www.fwpa.com.au/resources/resources/1461-deployment-and-integration-of-cost-effective-high-spatial-resolution-remotely-sensed-data-for-the-australian-forestry-industry.html (accessed on 28 September 2022).
- Yu, X.; Hyyppä, J.; Karjalainen, M.; Nurminen, K.; Karila, K.; Vastaranta, M.; Kankare, V.; Kaartinen, H.; Holopainen, M.; Honkavaara, E.; et al. Comparison of laser and stereo optical, SAR and InSAR point clouds from air-and space-borne sources in the retrieval of forest inventory attributes. Remote Sens. 2015, 7, 15933–15954. [Google Scholar] [CrossRef] [Green Version]
- Stone, C.; Webster, M.; Osborn, J.; Iqbal, I. Alternatives to LiDAR-derived canopy height models for softwood plantations: A review and example using photogrammetry. Aust. For. 2016, 79, 271–282. [Google Scholar] [CrossRef]
- Olive, K.; Lewis, T.; Ghaffariyan, M.R.; Srivastava, S.K. Comparing canopy height estimates from satellite-based photogrammetry, airborne laser scanning and field measurements across Australian production and conservation eucalypt forests. J. For. Res. 2020, 25, 108–112. [Google Scholar] [CrossRef]
- Iglhaut, J.; Cabo, C.; Puliti, S.; Piermattei, L.; O’Connor, J.; Rosette, J. Structure from Motion Photogrammetry in Forestry: A Review. Curr. For. Rep. 2019, 5, 155–168. [Google Scholar] [CrossRef] [Green Version]
- Goodbody, T.R.H.; Coops, N.C.; White, J.C. Digital aerial photogrammetry for updating area-based forest inventories: A review of opportunities, challenges, and future directions. Curr. For. Rep. 2019, 5, 55–75. [Google Scholar] [CrossRef] [Green Version]
- Alejandro, P.; Ruiz Fernández, L.Á.; Gómez, C.; Pascual, C.; Álvarez Taboada, M.F.; Tanase, M.; Valbuena, R.; Montes Pita, F.; Hermosilla, T. Remote Sensing for the Spanish Forests in the 21st Century: A Review of Advances, Needs, and Opportunities. For. Syst. 2019, 28, 1–33. Available online: https://usc.primo.exlibrisgroup.com/permalink/61USC_INST/3ct1hk/cdi_dialnet_primary_oai_dialnet_unirioja_es_ART0001340628 (accessed on 1 October 2022).
- Lim, K.S.; Treitz, P.M. Estimation of above ground forest biomass from airborne discrete return laser scanner data using canopy-based quantile estimators. Scand. J. For. Res. 2004, 19, 558–570. [Google Scholar] [CrossRef]
- Kumar, S.S.; Tom, L.; Linda, B.; Stuart, P. Spatial databases and techniques to assist with prescribed fire management in the south-east Queensland bioregion. Int. J. Wildland Fire 2021, 30, 90–111. [Google Scholar]
- Roberts, S.D.; Dean, T.J.; Evans, D.L.; McCombs, J.W.; Harrington, R.L.; Glass, P.A. Estimating individual tree leaf area in loblolly pine plantations using LiDAR-derived measurements of height and crown dimensions. For. Ecol. Manag. 2005, 213, 54–70. [Google Scholar] [CrossRef]
- Popescu, S.C.; Zhao, K. A voxel-based lidar method for estimating crown base height for deciduous and pine trees. Remote Sens. Environ. 2008, 112, 767–781. [Google Scholar] [CrossRef]
- Næsset, E. Practical large-scale forest stand inventory using a small-footprint airborne scanning laser. Scand. J. For. Res. 2004, 19, 164–179. [Google Scholar] [CrossRef]
- Andersen, H.-E.; Reutebuch, S.E.; McGaughey, R.J. A rigorous assessment of tree height measurements obtained using airborne lidar and conventional field methods. Can. J. Remote Sens. 2006, 32, 355–366. [Google Scholar] [CrossRef]
- Lu, D.; Chen, Q.; Wang, G.; Liu, L.; Li, G.; Moran, E. A survey of remote sensing-based aboveground biomass estimation methods in forest ecosystems. Int. J. Digit. Earth 2016, 9, 63–105. [Google Scholar] [CrossRef]
- Pearse, G.D.; Dash, J.P.; Persson, H.J.; Watt, M.S. Comparison of high-density LiDAR and satellite photogrammetry for forest inventory. ISPRS J. Photogramm. Remote Sens. 2018, 142, 257–267. [Google Scholar] [CrossRef]
- Krause, S.; Sanders, T.G.M.; Mund, J.-P.; Greve, K. UAV-Based Photogrammetric Tree Height Measurement for Intensive Forest Monitoring. Remote Sens. 2019, 11, 758. [Google Scholar] [CrossRef] [Green Version]
- Padró, J.C.; Cardozo, J.; Montero, P.; Ruiz-Carulla, R.; Alcañiz, J.M.; Serra, D.; Carabassa, V. Drone-based identification of erosive processes in open-pit mining restored areas. Land 2022, 11, 212. [Google Scholar] [CrossRef]
- Reckling, W.; Mitasova, H.; Wegmann, K.; Kauffman, G.; Reid, R. Efficient Drone-Based Rare Plant Monitoring Using a Species Distribution Model and AI-Based Object Detection. Drones 2021, 5, 110. [Google Scholar] [CrossRef]
- Thomazella, R.; Castanho, J.E.; Dotto, F.R.; Júnior, O.R.; Rosa, G.H.; Marana, A.N.; Papa, J.P. Environmental monitoring using drone images and convolutional neural networks. In Proceedings of the IGARSS 2018-2018 IEEE International Geoscience and Remote Sensing Symposium, Valencia, Spain, 22–27 July 2018; pp. 8941–8944. [Google Scholar]
- Tóth, V.Z.; Grósz, J.; Ladányi, M.; Jung, A. A new lake algae detection method supported by a drone-based multispectral camera. Lakes Reserv. Res. Manag. 2021, 26, e12377. [Google Scholar] [CrossRef]
- Duan, Z.; Li, Y.; Wang, X.; Wang, J.; Brydegaard, M.; Zhao, G.; Svanberg, S. Drone-based fluorescence lidar systems for vegetation and marine environment monitoring. In EPJ Web of Conferences; EDP Sciences: Ulys, France, 2020; Volume 237, p. 07013. [Google Scholar]
- Ventura, D.; Bruno, M.; Lasinio, G.J.; Belluscio, A.; Ardizzone, G. A low-cost drone-based application for identifying and mapping of coastal fish nursery grounds. Estuar. Coast. Shelf Sci. 2016, 171, 85–98. [Google Scholar] [CrossRef]


| Domain Area | Year | Environmental Application | Techniques Applied | Reference |
|---|---|---|---|---|
| Land monitoring and identification | 2022 | Identification of water erosion in mining restored areas | The generation of a digital elevation model (DEM) from drone images and photogrammetric processing | Padro et al., 2022 [22] |
| 2021 | Monitoring of rare plant species | Neural network object detector (YOLO) and darknet neural network framework | Reckling et al., 2021 [23] | |
| 2018 | Monitoring of natural/protected reserves from illegal activities | CNN (VGG16, VGG19) and transfer learning to classify four terrain classes: water, deforesting, forest and buildings | Thomazella et al., 2018 [24] | |
| Aquatic/marine monitoring and identification | 2021 | Detection and quantification of algal in water ecosystems | Image analysis of drone-based multispectral imagery | Toth et al., 2021 [25] |
| 2020 | Drone-based fluorosensor for marine environment monitoring | Analysis of hyperspectral lidar data and fluorescence spectral recordings for vegetation profiling | Duan et al., 2020 [26] | |
| 2016 | Mapping of coastal fish nursery grounds and marine habitats | Image segmentation tools (ArcGIS, MultiSpec, eCognition Developer) to classify marine terrain classes: coarse sand, fine sand, leaves, matte, shallow rock, deep rock | Ventura et al., 2016 [27] |
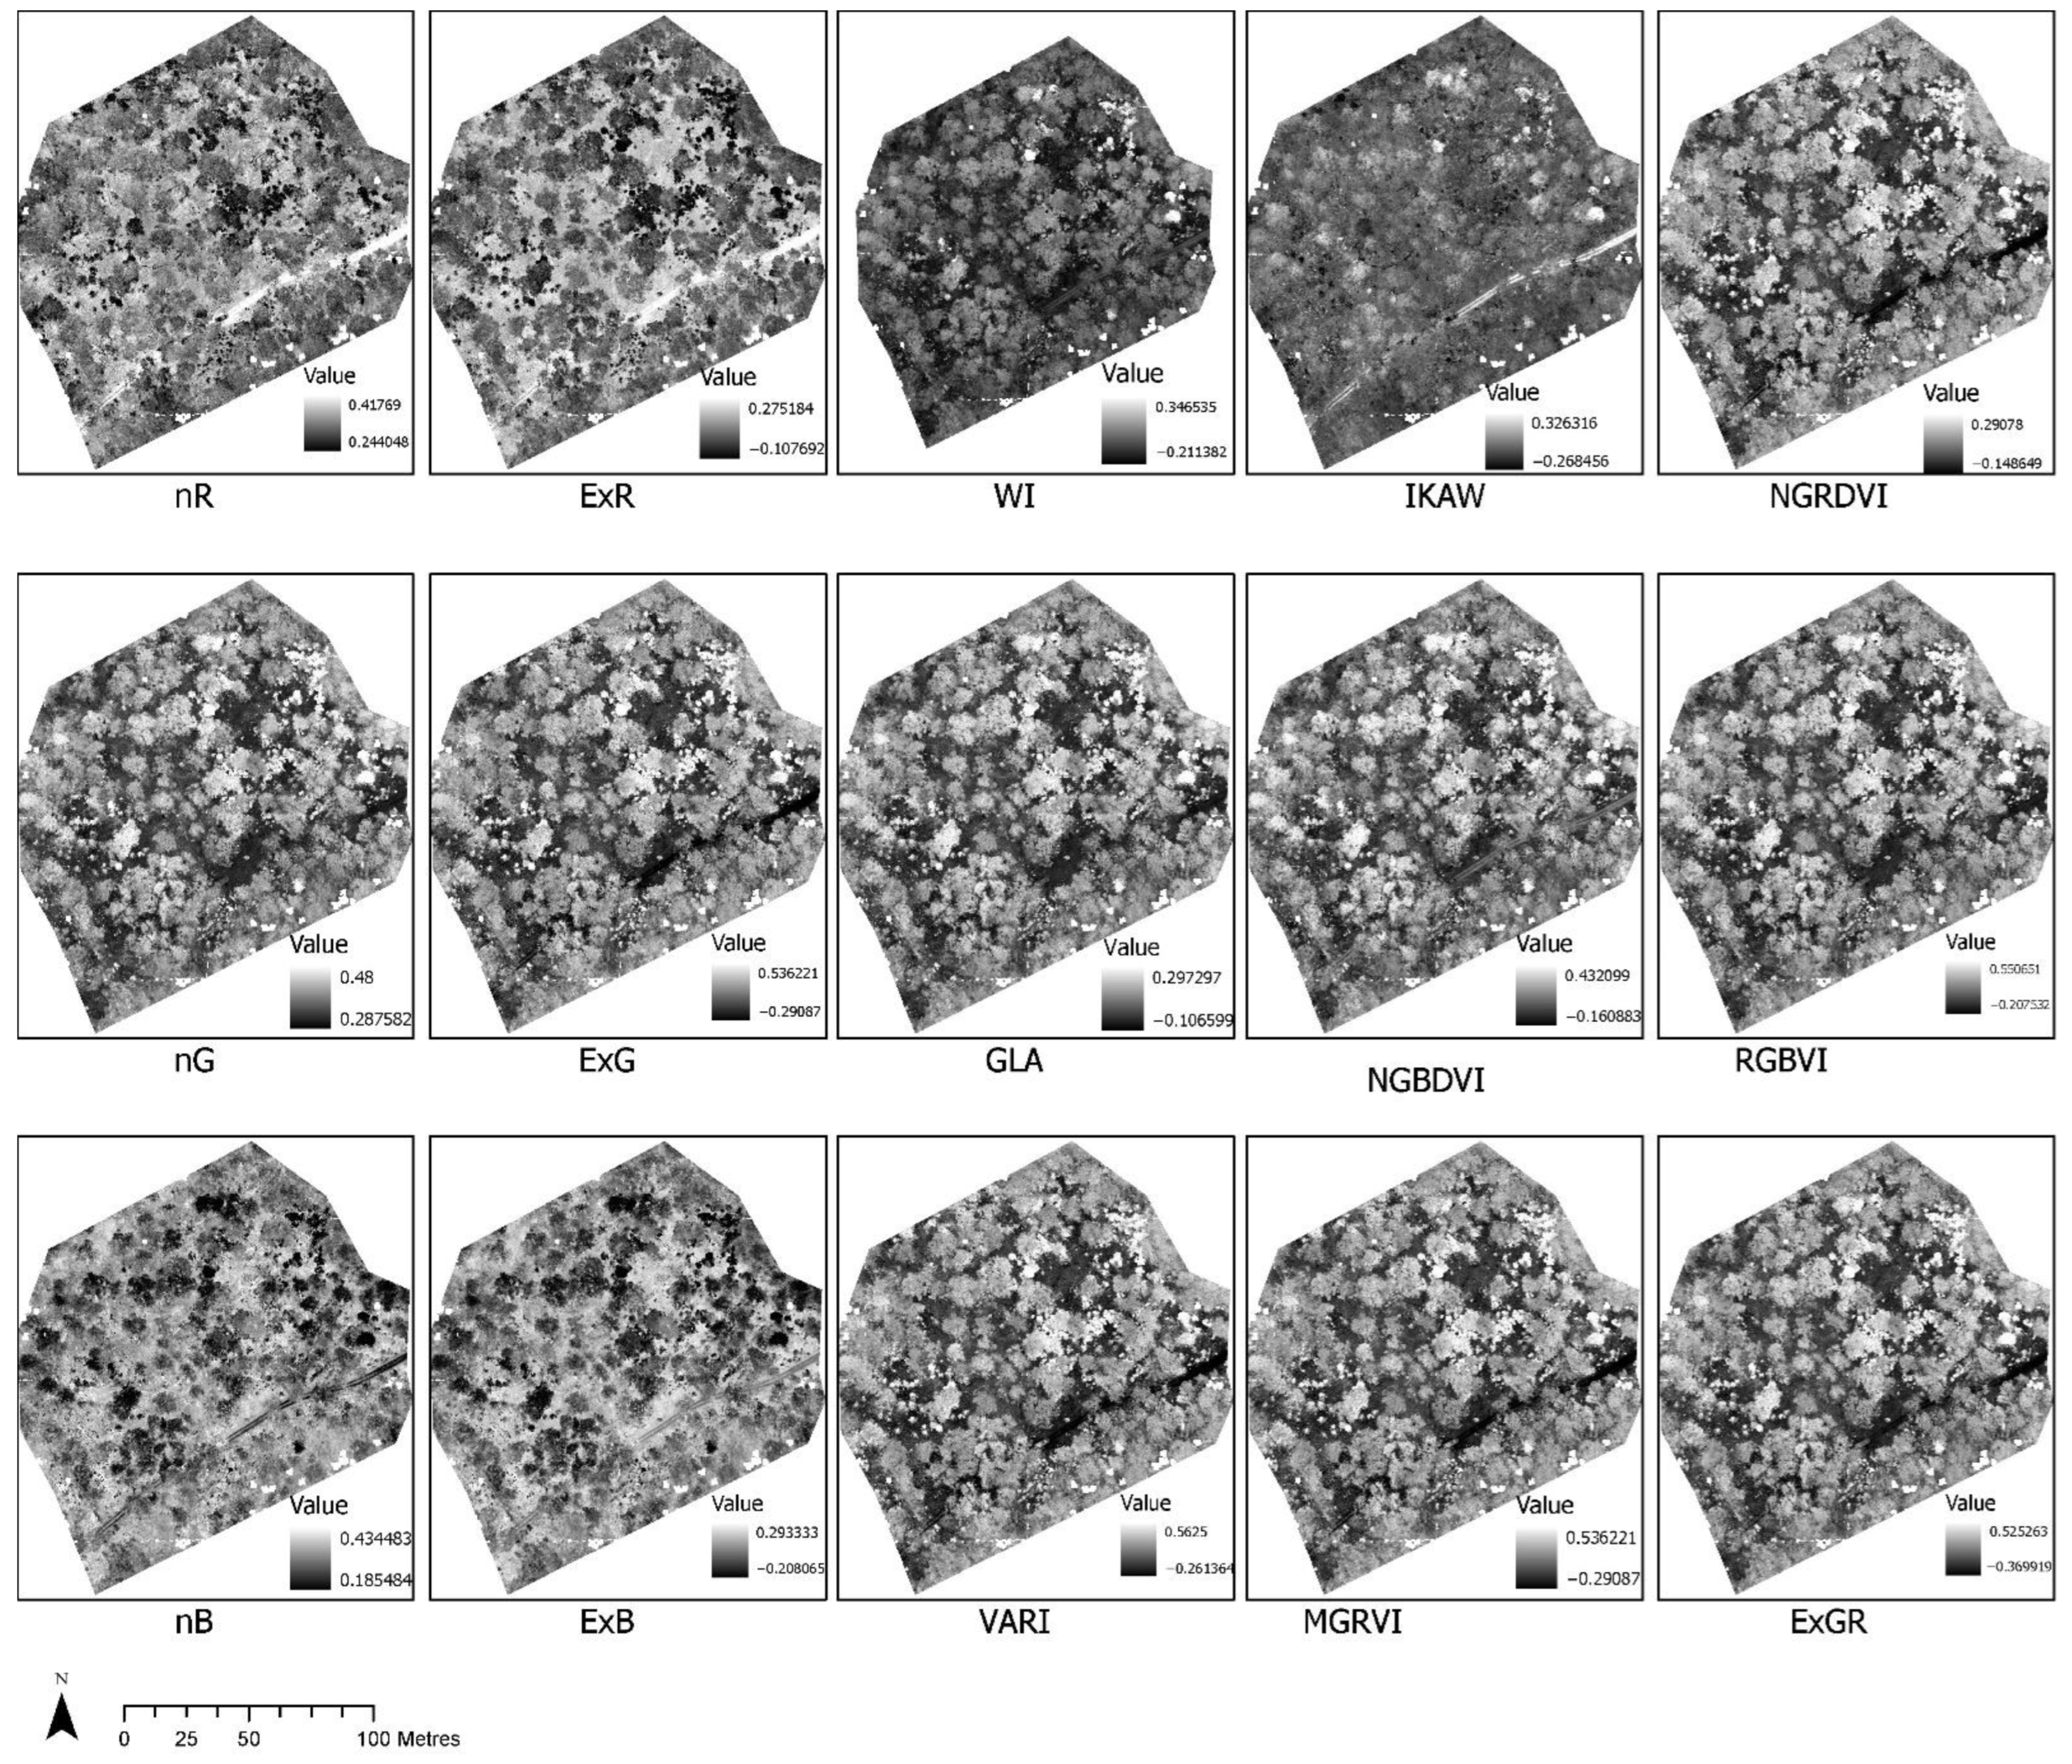
| Indices | Formula | |
|---|---|---|
| 1 | Visible Atmospherically Resistant Index (VARI) (Gitelson et al. 2002) | (g − r)/(g + r − b) |
| 2 | Excess Green Vegetation Index (ExG) (Woebbecke et al. 1995) | 2g − r − b |
| 3 | Excess Red Vegetation Index (ExR) (Meyer et al. 2008) | 1.4r − g |
| 4 | Excess Blue Vegetation Index (ExB) (Mao et al. 2003) | 1.4b − g |
| 5 | Excess Green minus Excess Red Vegetation Index (ExGR) (Neto 2004) | ExG − ExR |
| 6 | Normalized Green-Red Difference Index (NGRDI) (Tucker 1979) | (g − r)/(g + r) |
| 7 | Normalized Green-Red Difference Index (NGBDI) (Tucker 1979) | (g − b)/(g + b) |
| 8 | Modified Green Red Vegetation Index (MGRVI) (Tucker 1979) | (g2 − r2)/(g2 + r2) |
| 9 | Woebbecke Index (WI) (Woebbecke et al. 1995) | (g − b)/(r − g) |
| 10 | Kawashima Index (IKAW) (Kawashima and Nakatani 1998) | (r − b)/(r + b) |
| 11 | Green Leaf Algorithm (GLA) (Louhaichi et al. 2001) | (2g − r − b)/(2g + r + b) |
| 12 | Red Green Blue Vegetation Index (RGBVI) (Bendig et al. 2015) | (g2 − b × r)/(g2 + b × r) |
Publisher’s Note: MDPI stays neutral with regard to jurisdictional claims in published maps and institutional affiliations. |
© 2022 by the authors. Licensee MDPI, Basel, Switzerland. This article is an open access article distributed under the terms and conditions of the Creative Commons Attribution (CC BY) license (https://creativecommons.org/licenses/by/4.0/).
Share and Cite
Srivastava, S.K.; Seng, K.P.; Ang, L.M.; Pachas, A.‘N.A.; Lewis, T. Drone-Based Environmental Monitoring and Image Processing Approaches for Resource Estimates of Private Native Forest. Sensors 2022, 22, 7872. https://doi.org/10.3390/s22207872
Srivastava SK, Seng KP, Ang LM, Pachas A‘NA, Lewis T. Drone-Based Environmental Monitoring and Image Processing Approaches for Resource Estimates of Private Native Forest. Sensors. 2022; 22(20):7872. https://doi.org/10.3390/s22207872
Chicago/Turabian StyleSrivastava, Sanjeev Kumar, Kah Phooi Seng, Li Minn Ang, Anibal ‘Nahuel’ A. Pachas, and Tom Lewis. 2022. "Drone-Based Environmental Monitoring and Image Processing Approaches for Resource Estimates of Private Native Forest" Sensors 22, no. 20: 7872. https://doi.org/10.3390/s22207872