
A Prediction Model of Defecation Based on BP Neural Network and Bowel Sound Signal Features

Abstract
:1. Introduction
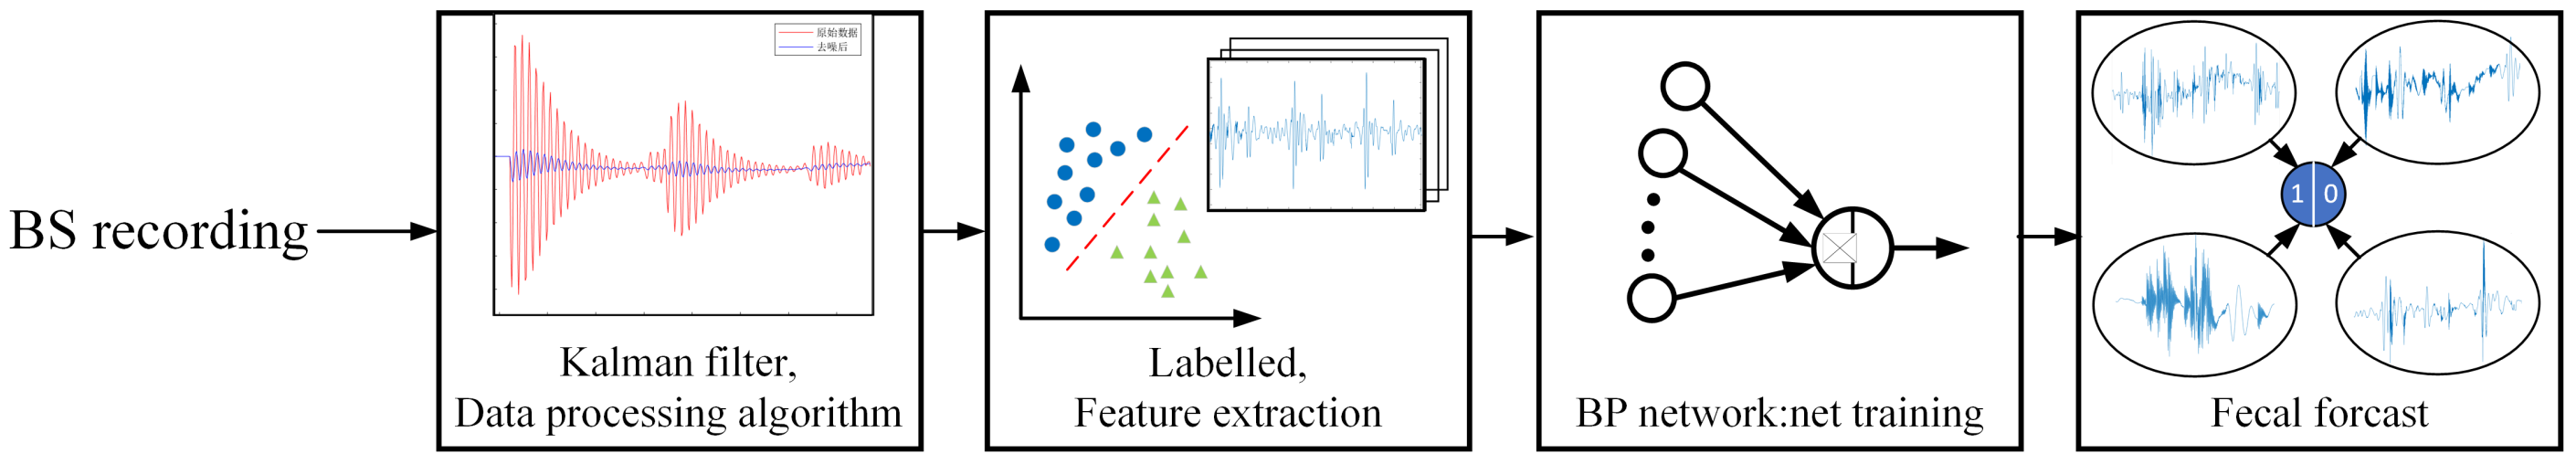
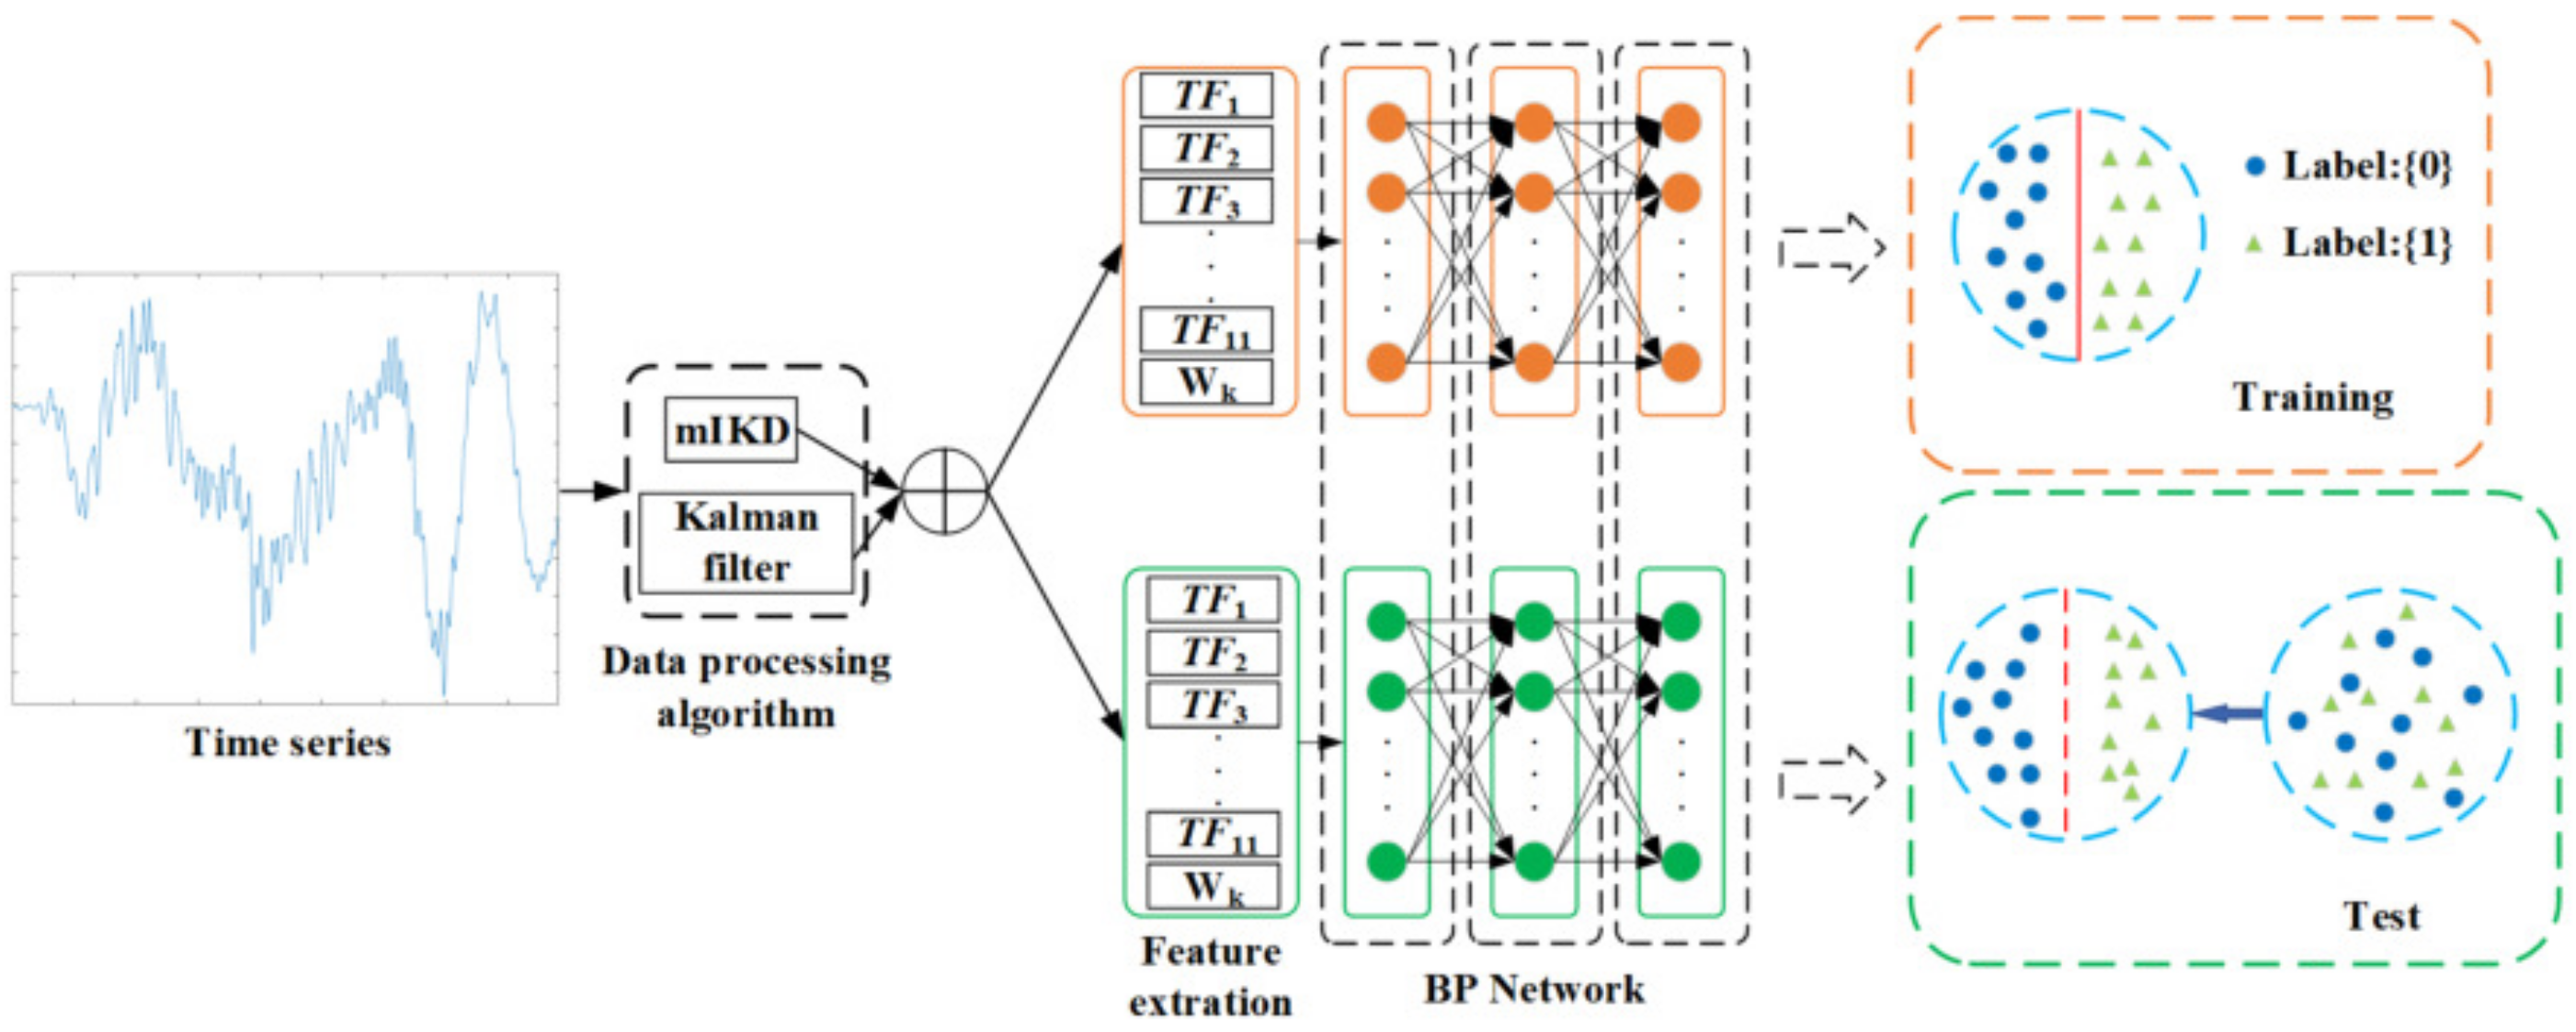
- This paper proposes a prediction model of defecation based on the bowel sounds signal features and BP neural netwok;This paper proposes a prediction model of defecation based on the bowel sounds signal features and BP neural network. Compared with the traditional machine learning methods, the biggest contribution of this paper is the combination of BP neural network with a bowel sound signal processing method, including iterative kurtosis and Kalman filter. In addition, other contributions in this paper include calculating the time domain, frequency domain, and time–frequency-domain features of the measured bowel sound signals and designing a neural network classification model based on the bowel sound signal features.
- This paper designs a non-invasive collection system based on bowel sound signals for real-time collection;We collected bowel sound data from patients in Beijing Bo’ai Hospital affiliated with the China Rehabilitation Research Center to ensure the validity of data.
- a.
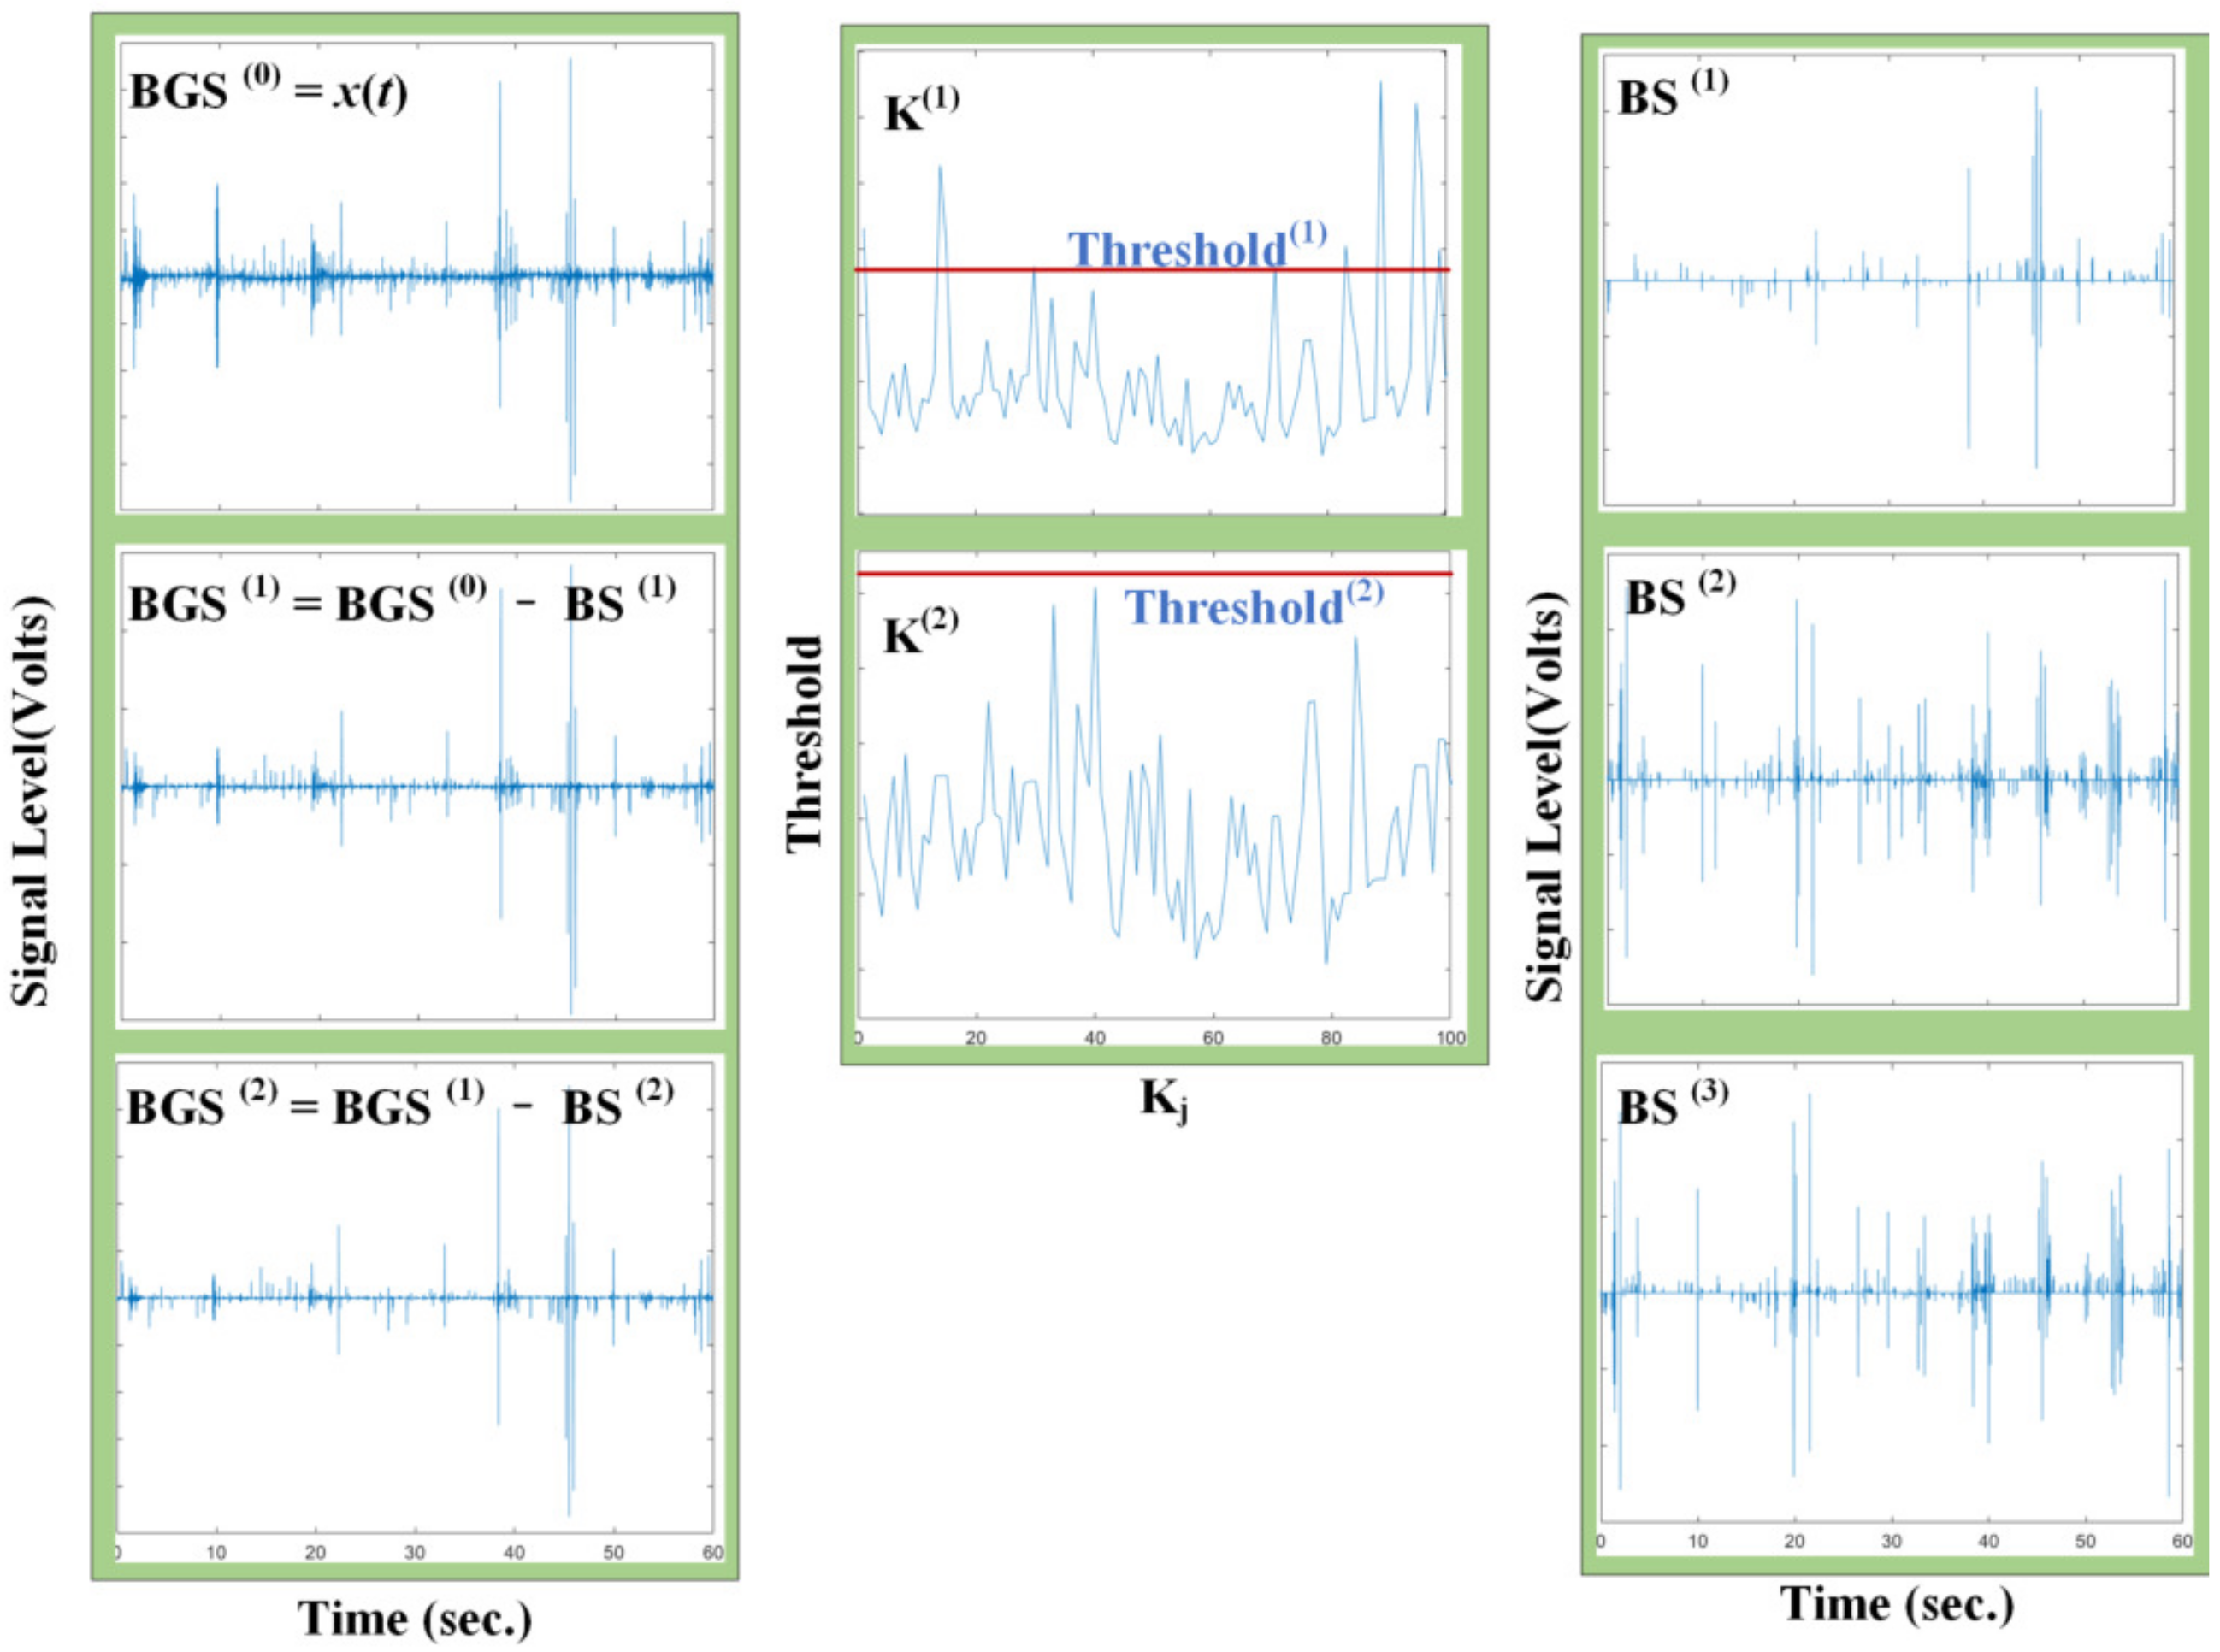
- Bowel sound signal processing method based on iterative kurtosis detector algorithm and Kalman filter;The Kalman filter method is added to the traditional detector algorithm based on the iteration kurtosis of bowel sound signals, which is used to extract signals from strong EMG noise and environmental interference, distinguishing the bowel sound signal and the noise signal and improving the denoising performance of bowel sound signals.
- b.
- Feature extraction of bowel sound signals in the time domain, frequency domain, and time–frequency domain,Including time-domain feature extraction, frequency domain feature extraction, and time–frequency domain feature extraction. By compressing time series, dimension reduction is realized to improve the efficiency of data mining. Secondly, feature extraction of time series has the function of denoising, while retaining the main features of time series, which can better reflect the changes of time series and improve the quality of data mining.
- c.
- Prediction model of defecation based on bowel sound features.Combined with the BP neural network, a defecation prediction model was designed based on the features of bowel sound signal in the time domain, frequency domain, and time–frequency domain. The rest of this paper is arranged as follows: The second section introduces the non-invasive collection system based on bowel sound signal. The third section introduces the detector algorithm based on iterative kurtosis and the bowel sound signal processing method of the Kalman filter, which are used to extract the bowel sound signal, so as to improve the denoising performance of BS. The fourth section introduces the feature extraction method based on transformation and calculates the time-domain features, frequency–domain features and time–frequency–domain features of the measured bowel sound signal, which are used to reduce the dimension of the bowel sound signal and retain the features of the original signal. The fifth section introduces the structure and propagation process of the neural network and proposes a defecation prediction algorithm based on BS features. The sixth section introduces the analysis of experimental results and verifies the feasibility of the neural network.
2. Overview of the Bowel Sound Collection System
2.1. Bowel Sound Collection System
2.2. Bowel Sound Signal Data Collection
3. Signal Processing Method Based on Bowel Sound Signal
3.1. Bowel Sound Signal Processing Method Based on Iterative Kurtosis Detector Algorithm and Kalman Filter
3.1.1. Detector Algorithm Based on Iterative Kurtosis
3.1.2. Kalman Filter
3.2. Feature Extraction in the Time Domain, Frequency Domain, and Time–Frequency Domain
3.2.1. Feature Extraction Based on Time Domain
3.2.2. Feature Extraction Based on Frequency Domain
3.2.3. Feature Extraction of Time Series Based on Multilayer Haar Wavelet Transform
4. Prediction Model of Defecation Based on BP Neural Network
4.1. Prediction Model
4.2. Evaluating Models
5. Experiment Based on Bowel Sounds
5.1. Bowel Sound Signal Collection Experiment Reappearance
5.2. Signal Processing Results
5.2.1. Kalman Filter Denoising
5.2.2. mIKD Processing
5.3. Accuracy Verification of BP Neural Network
5.4. Performance Evaluation of BP Neural Network
6. Discussion
7. Conclusions
Author Contributions
Funding
Institutional Review Board Statement
Informed Consent Statement
Data Availability Statement
Conflicts of Interest
References
- Halland, M.; Talley, N.J. Fecal incontinence: Mechanisms and management. Curr. Opin. Gastroenterol. 2012, 28, 57–62. [Google Scholar] [CrossRef]
- Smith, E.M.; Shah, A.A. Screening for Geriatric Syndromes. Clin. Geriatr. Med. 2017, S0749069017300757. [Google Scholar] [CrossRef]
- Prather, C.M. Physiologic variables that predict the outcome of treatment for fecal incontinence. Gastroenterology 2004, 126, S135–S140. [Google Scholar] [CrossRef]
- Rudd, T.N. Human problems in geriatrics, with special reference to fecal incontinence. J. Am. Geriatr. Soc. 1959, 7, 565–569. [Google Scholar] [CrossRef]
- Tariq; Syed, H. Geriatric fecal incontinence. Clin. Geriatr. Med. 2004, 20, 571–587. [Google Scholar] [CrossRef]
- Yagüe, T.M. Fecal and anal incontinence. Rev. Esp. Enfermedades Dig. 2006, 98, 659–665. [Google Scholar]
- Camilleri, M.; Bharucha, A.E.; Lorenzo, C.D.; Hasler, W.L.; Prather, C.M.; Rao, S.S.; Wald, A. American Neurogastroenterology and Motility Society consensus statement on intraluminal measurement of gastrointestinal and colonic motility in clinical practice. Neurogastroenterol. Motil. Off. J. Eur. Gastrointest. Motil. Soc. 2010, 20, 1269–1282. [Google Scholar] [CrossRef]
- Liem, O.; Van Den Berg, M.M.; Mousa, H.M.; Youssef, N.N.; Langseder, A.L.; Benninga, M.A.; Lorenzo, C.D. Distention of the colon is associated with initiation of propagated contractions in children. Neurogastroenterol. Motil. 2010, 22, 19–23. [Google Scholar] [CrossRef]
- Mantoo, S.; Meurette, G.; Podevin, J.; Lehur, P.A. The magnetic anal sphincter: A new device in the management of severe fecal incontinence. Expert Rev. Med. Devices 2012, 9, 483–490. [Google Scholar] [CrossRef]
- Jiang, E.; Zan, P.; Zhang, S.; Liu, J.; Zhu, X.; Wang, X. Mechanical Model of a Novel Executive Mechanism for Artificial Anal Sphincter System. In International Computer Science Conference; Springer: Berlin/Heidelberg, Germany, 2012. [Google Scholar]
- Jelovsek, J.E. Prediction Models for Postpartum Urinary and Fecal Incontinence in Primiparous Women: Erratum. Female Pelvic Med. Reconstr. Surg. 2015, 21, 110–118. [Google Scholar] [CrossRef]
- Arnbjörnsson, E.; Bengmark, S. Auscultation of Bowel Sounds in Patients with Suspected Acute Appendicitis—An Aid in the Diagnosis? Eur. Surg. Res. 1983, 15, 24–27. [Google Scholar] [CrossRef]
- Yoshino, H.; Abe, Y.; Yoshino, T.; Ohsato, K. Clinical application of spectral analysis of bowel sounds in intestinal obstruction. Dis. Colon Rectum 1990, 33, 753–757. [Google Scholar] [CrossRef]
- Dalle, D.; Devroede, G.; Thibault, R.; Perrault, J. Computer analysis of bowel sounds. Comput. Biol. Med. 1975, 4, 247–256. [Google Scholar] [CrossRef]
- Kim, K.S.; Seo, J.H.; Song, C.G. Non-invasive algorithm for bowel motility estimation using a back-propagation neural network model of bowel sounds. Biomed. Eng. Online 2011, 10, 69. [Google Scholar] [CrossRef]
- Fernández, F.; Isasi, P. Evolutionary Design of Nearest Prototype Classifiers. J. Heuristics 2004, 10, 431–454. [Google Scholar] [CrossRef]
- AL-Ghamdi, A.S.A.; Ragab, M.; Sabir, M.F.S.; Elhassanein, A.; Gouda, A.A. Optimized Artificial Neural Network Techniques to Improve Cybersecurity of Higher Education Institution. Comput. Mater. Contin. 2022, 72, 3385–3399. [Google Scholar] [CrossRef]
- García-Pedrajas, N.; Fyfe, C. Construction of classifier ensembles by means of artificial immune systems. J. Heuristics 2008, 14, 285–310. [Google Scholar] [CrossRef]
- DuBose, J.J.; Lissauer, M.; Maung, A.A.; Piper, G.L.; O’Callaghan, T.A.; Luo-Owen, X.; Inaba, K.; Okoye, O.; Shestopalov, A.; Fielder, W.D.; et al. Pneumatosis Intestinalis Predictive Evaluation Study (PIPES): A multicenter epidemiologic study of the Eastern Association for the Surgery of Trauma. J. Trauma Acute Care Surg. 2013, 75, 15–23. [Google Scholar] [CrossRef]
- Dimoulas, C.; Kalliris, G.; Papanikolaou, G.; Kalampakas, A. Long-term signal detection, segmentation and summarization using wavelets and fractal dimension: A bioacoustics application in gastrointestinal-motility monitoring. Comput. Biol. Med. 2007, 37, 438–462. [Google Scholar] [CrossRef]
- Dimoulas, C.; Kalliris, G.; Papanikolaou, G.; Petridis, V.; Kalampakas, A. Bowel-sound pattern analysis using wavelets and neural networks with application to long-term, unsupervised, gastrointestinal motility monitoring. Expert Syst. Appl. 2008, 34, 26–41. [Google Scholar] [CrossRef]
- Hadjileontiadis, L.J. Wavelet-based enhancement of lung and bowel sounds using fractal dimension thresholding-part I: Methodology. IEEE Trans. Biomed. Eng. 2005, 52, 1143–1148. [Google Scholar] [CrossRef]
- Hadjileontiadis, L.J.; Liatsos, C.N.; Mavrogiannis, C.C.; Rokkas, T.A.; Panas, S.M. Enhancement of Bowel Sounds by Wavelet-Based Filtering. IEEE Trans. Biomed. Eng. 2000, 47, 876–886. [Google Scholar] [CrossRef]
- Hadjileontiadis, L.J.; Rekanos, I.T. Detection of explosive lung and bowel sounds by means of fractal dimension. Signal Process. Lett. IEEE 2003, 10, 311–314. [Google Scholar] [CrossRef]
- Ranta, R.; Louis-Dorr, V.; Heinrich, C.; Wolf, D.; Guillemin, F. Digestive Activity Evaluation by Multichannel Abdominal Sounds Analysis. IEEE Trans. Biomed. Eng. 2010, 57, 1507–1519. [Google Scholar] [CrossRef]
- Rekanos, I.; Hadjileontiadis, L. An iterative kurtosis-based technique for the detection of nonstationary bioacoustic signals. Signal Process. 2006, 86, 3787–3795. [Google Scholar] [CrossRef]
- Sandler, R.H.; Mansy, H.A.; Kimura, R.A.; Uhing, M.R.; Arango, V. 107 computerized analysis of bowel sounds in normal and small bowel obstructed rats. J. Pediatr. Gastroenterol. Nutr. 1996, 23, 369. [Google Scholar] [CrossRef]
- Radnitz, C.L.; Blanchard, E.B. A 1- and 2-year follow-up study of bowel sound biofeedback as a treatment for irritable bowel syndrome. Biofeedback Self-Regul. 1989, 14, 333–338. [Google Scholar] [CrossRef]
- Garner, C.G.; Ehrenreich, H. Non-invasive topographic analysis of intestinal activity in man on the basis of acustic phenomena. Res. Exp. Med. 1989, 189, 129–140. [Google Scholar] [CrossRef]
- Furness, J.B.; Callaghan, B.P.; Rivera, L.R.; Cho, H.J. The Enteric Nervous System and Gastrointestinal Innervation: Integrated Local and Central Control. Oxyg. Transp. Tissue XXXIII 2014, 817, 39–71. [Google Scholar]
- Kim, K.S.; Seo, J.H.; Sang, H.R.; Min, H.K.; Song, C.G. Estimation algorithm of the bowel motility based on regression analysis of the jitter and shimmer of bowel sounds. Comput. Methods Programs Biomed. 2011, 104, 426–434. [Google Scholar] [CrossRef]
- Dong, X.; Zhiwen, Y.U.; Cao, W.; Shi, Y.; Qianli, M.A. A survey on ensemble learning. Front. Comput. Sci. 2019, 14, 241–258. [Google Scholar] [CrossRef]


| Layers | Parameters | ||||
|---|---|---|---|---|---|
| 0 | |||||
| 1 | |||||
| 2 | |||||
| … | … | ||||
| j | … | ||||
| … | … | ||||
| … | |||||
| Predicted: 1 | Predicted: 0 | |
|---|---|---|
| Actual: 1 | TP | FP |
| Actual: 0 | FN | TN |
| Cases | Average Accuracy |
|---|---|
| 95.65% | |
| 88.46% | |
| 92.73% | |
| 86.15% | |
| 86.05% | |
| 87.93% | |
| 88.71% |
| Round | 1 | 2 | 3 | 4 | 5 |
|---|---|---|---|---|---|
| Accuracy | 85.71% | 91.43% | 88.57% | 88.57% | 87.14% |
| Round | 6 | 7 | 8 | 9 | 10 |
| Accuracy | 90.00% | 87.14% | 90.00% | 90.00% | 94.29% |
| Round | 11 | 12 | 13 | 14 | 15 |
| Accuracy | 90.00% | 90.00% | 87.14% | 87.14% | 88.57% |
| Round | 16 | 17 | 18 | 19 | 20 |
| Accuracy | 87.14% | 85.71 | 85.71% | 88.57% | 91.43% |
| Model | Accuracy | Sensitivity | Specificity |
|---|---|---|---|
| BP neural network | 0.914286 | 0.921053 | 0.90625 |
| C45 | 0.728571 | 0.631579 | 0.84375 |
| NB | 0.728571 | 0.631579 | 0.84375 |
| Logistic | 0.846154 | 0.848485 | 0.84375 |
| Different Classifiers | The Prediction Accuracy with Different Features (%) | Average Accuracy (%) | |||
|---|---|---|---|---|---|
| Time Domain Features | Frequency Domain Features | Time-Frequency Domain Features | Multi-Domain Features | ||
| BP nerual network | 72.62% | 73.39% | 84.54% | 88.71% | 79.80% |
| C4.5 | 69.00% | 66.14% | 75.00% | 78.07% | 72.05% |
| NB | 69.07% | 56.86% | 68.43% | 73.28% | 66.91% |
| Logistic | 62.71% | 61.14% | 67.21% | 82.50% | 68.39% |
| Average accuracy (%) | 68.35% | 64.38% | 73.80% | 80.64% | — |
| Different Classifiers | The Prediction Accuracy with Different Features Combinations (%) | Average Accuracy (%) | |||
|---|---|---|---|---|---|
| Time and Frequency Domain Features | Frequency and Time–Frequency Domain Features | Time and Time–Frequency Domain Features | Multidomain Features | ||
| BP nerual network | 80.77% | 88.15% | 87.85% | 88.71% | 86.37% |
| C4.5 | 68.14% | 74.50% | 77.07% | 78.07% | 74.44% |
| NB | 68.43% | 69.00% | 75.07% | 73.28% | 71.45% |
| Logistic | 67.36% | 82.36% | 79.57% | 82.50% | 77.95% |
| Average accuracy (%) | 71.18% | 78.50% | 78.89% | 80.64% | — |
Publisher’s Note: MDPI stays neutral with regard to jurisdictional claims in published maps and institutional affiliations. |
© 2022 by the authors. Licensee MDPI, Basel, Switzerland. This article is an open access article distributed under the terms and conditions of the Creative Commons Attribution (CC BY) license (https://creativecommons.org/licenses/by/4.0/).
Share and Cite
Zhang, T.; Huang, Z.; Zou, Y.; Zhao, J.; Ke, Y. A Prediction Model of Defecation Based on BP Neural Network and Bowel Sound Signal Features. Sensors 2022, 22, 7084. https://doi.org/10.3390/s22187084
Zhang T, Huang Z, Zou Y, Zhao J, Ke Y. A Prediction Model of Defecation Based on BP Neural Network and Bowel Sound Signal Features. Sensors. 2022; 22(18):7084. https://doi.org/10.3390/s22187084
Chicago/Turabian StyleZhang, Tie, Zequan Huang, Yanbiao Zou, Jun Zhao, and Yuwei Ke. 2022. "A Prediction Model of Defecation Based on BP Neural Network and Bowel Sound Signal Features" Sensors 22, no. 18: 7084. https://doi.org/10.3390/s22187084