
Critical Analysis of the Current Medical Image-Based Processing Techniques for Automatic Disease Evaluation: Systematic Literature Review

Abstract
:1. Introduction
2. Research Methodology
2.1. Research Questions
2.2. Research Strategy
2.3. Criteria for Article Selection
- Articles using the most up-to-date techniques for analyzing medical images.
- Articles that were written in the English language.
- Articles published in the last five years (2017–2021).
- Studies that were presented at a peer-reviewed conferences or journals.
- Following the definition of the inclusion criteria, the following exclusion criteria were determined:
- Duplicate references from the various electronic archives that were searched.
- Articles with a page count of less than four.
- Articles that fail to respond to any of the research questions.
- Articles that were written in a language other than English
- Articles that did not address the study’s goals.
2.4. Research Results
3. Results of Systematic Review
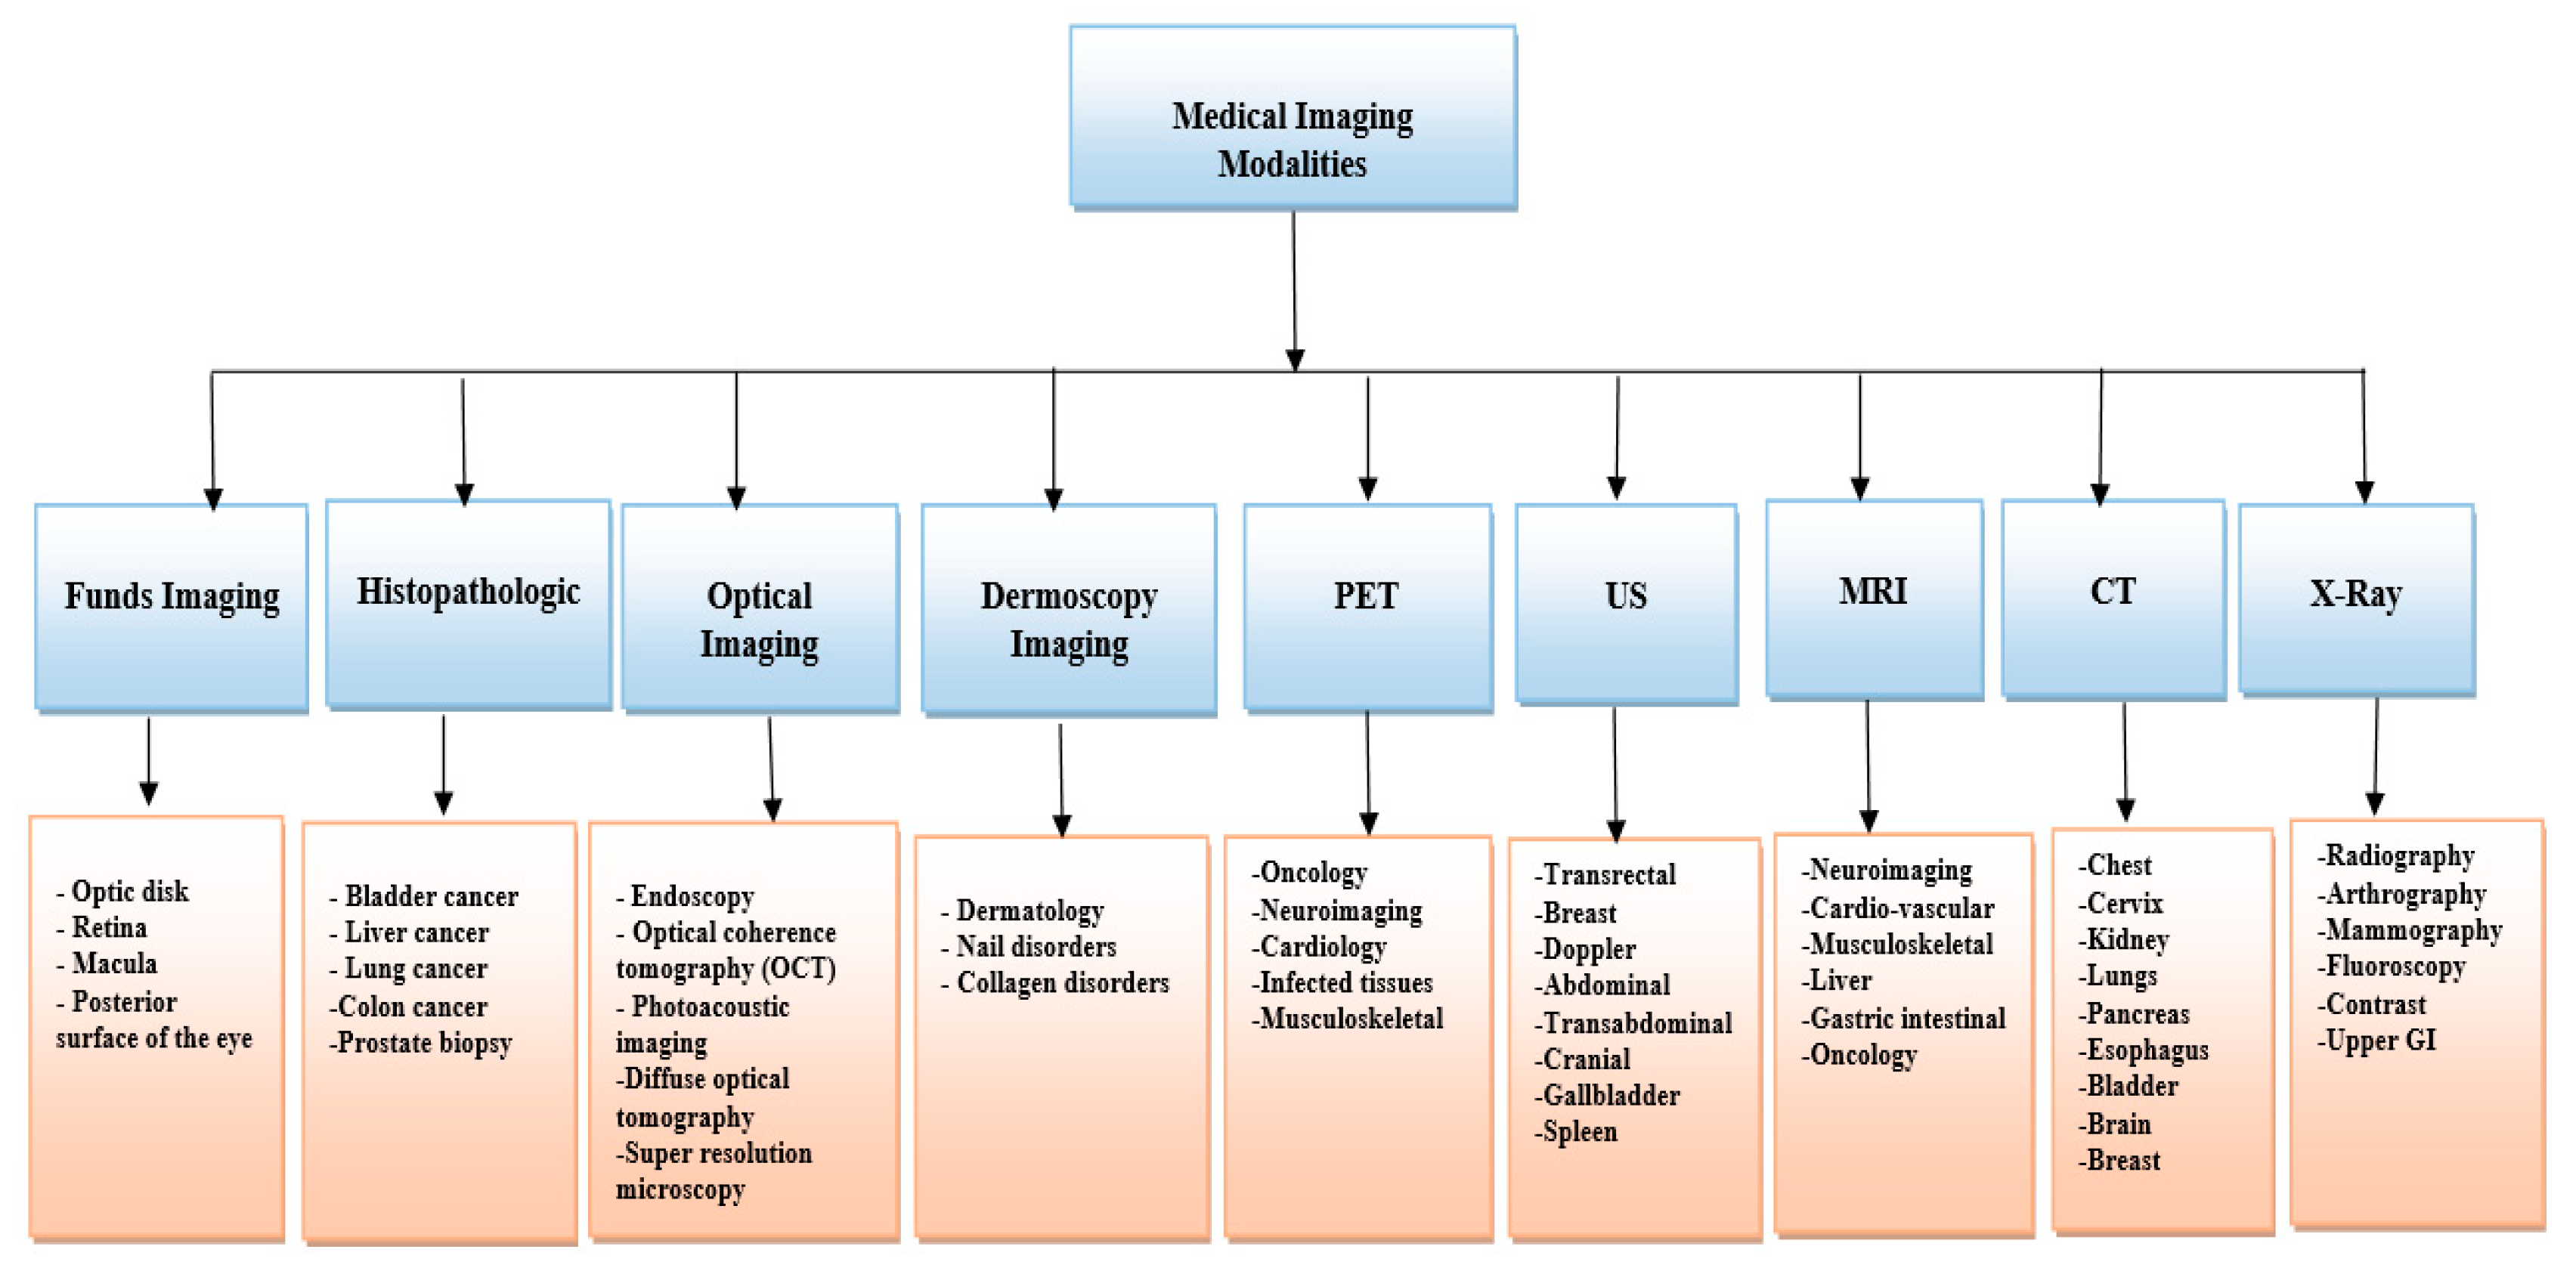
3.1. Medical Imaging Modalities
3.2. Medical Image Analysis
3.2.1. Medical Image Preprocessing
3.2.2. Segmentation Techniques
3.2.3. Feature Extraction Techniques
3.2.4. Classification Techniques
3.2.5. Metric Evaluation
4. Machine Learning Techniques
5. Deep Learning
6. Diseases Diagnosis System
7. Discussion and Future Directions
7.1. Answer to Research Questions
7.2. Future Directions
8. Conclusions
Author Contributions
Funding
Institutional Review Board Statement
Informed Consent Statement
Data Availability Statement
Conflicts of Interest
Abbreviations
References
- Ansari, Z.; Mateenuddin, Q.; Abdullah, A. Performance research on medical data classification using traditional and soft computing techniques. Int. J. Recent Technol. Eng. (IJRTE) 2019, 8, 990–995. [Google Scholar]
- Kermany, D.S.; Goldbaum, M.; Cai, W.; Valentim, C.C.S.; Liang, H.; Baxter, S.L.; McKeown, A.; Yang, G.; Wu, X.; Yan, F.; et al. Identifying Medical Diagnoses and Treatable Diseases by Image-Based Deep Learning. Cell 2018, 172, 1122–1131.e9. [Google Scholar] [CrossRef] [PubMed]
- Sudheer Kumar, E.; Shoba Bindu, C. Medical image analysis using deep learning: A systematic literature review. In Proceedings of the International Conference on Emerging Technologies in Computer Engineering, Jaipur, India, 4–5 February 2019; pp. 81–97. [Google Scholar]
- Murtaza, G.; Shuib, L.; Abdul Wahab, A.W.; Mujtaba, G.; Nweke, H.F.; Al-garadi, M.A.; Zulfiqar, F.; Raza, G.; Azmi, N.A. Deep learning-based breast cancer classification through medical imaging modalities: State of the art and research challenges. Artif. Intell. Rev. 2020, 53, 1655–1720. [Google Scholar] [CrossRef]
- Myszczynska, M.A.; Ojamies, P.N.; Lacoste, A.; Neil, D.; Saffari, A.; Mead, R.; Hautbergue, G.M.; Holbrook, J.D.; Ferraiuolo, L. Applications of machine learning to diagnosis and treatment of neurodegenerative diseases. Nat. Rev. Neurol. 2020, 16, 440–456. [Google Scholar] [CrossRef]
- Ker, J.; Bai, Y.; Lee, H.Y.; Rao, J.; Wang, L. Automated brain histology classification using machine learning. J. Clin. Neurosci. 2019, 66, 239–245. [Google Scholar] [CrossRef]
- Amrane, M.; Oukid, S.; Gagaoua, I.; Ensari, T. Breast cancer classification using machine learning. In Proceedings of the 2018 Electric Electronics, Computer Science, Biomedical Engineerings’ Meeting (EBBT), Istanbul, Turkey, 18–19 April 2018; pp. 1–4. [Google Scholar]
- Vijayvargiya, A.; Kumar, R.; Dey, N.; Tavares, J.M.R. Comparative analysis of machine learning techniques for the classification of knee abnormality. In Proceedings of the 2020 IEEE 5th International Conference on Computing Communication and Automation (ICCCA), Greater Noida, India, 30–31 October 2020; pp. 1–6. [Google Scholar]
- Barstugan, M.; Ozkaya, U.; Ozturk, S. Coronavirus (COVID-19) classification using ct images by machine learning methods. arXiv 2020, arXiv:2003.09424. [Google Scholar]
- Kwekha-Rashid, A.S.; Abduljabbar, H.N.; Alhayani, B. Coronavirus disease (COVID-19) cases analysis using machine-learning applications. Appl. Nanosci. 2021, 11, 1–13. [Google Scholar] [CrossRef]
- Pahar, M.; Klopper, M.; Warren, R.; Niesler, T. COVID-19 cough classification using machine learning and global smartphone recordings. Comput. Biol. Med. 2021, 135, 104572. [Google Scholar] [CrossRef]
- Abdulkareem, N.M.; Abdulazeez, A.M.; Zeebaree, D.Q.; Hasan, D.A. COVID-19 world vaccination progress using machine learning classification algorithms. Qubahan Acad. J. 2021, 1, 100–105. [Google Scholar] [CrossRef]
- Ballı, S. Data analysis of Covid-19 pandemic and short-term cumulative case forecasting using machine learning time series methods. Chaos Solitons Fractals 2021, 142, 110512. [Google Scholar] [CrossRef]
- Sivaranjani, S.; Ananya, S.; Aravinth, J.; Karthika, R. Diabetes prediction using machine learning algorithms with feature selection and dimensionality reduction. In Proceedings of the 2021 7th International Conference on Advanced Computing and Communication Systems (ICACCS), Coimbatore, India, 19–20 March 2021; pp. 141–146. [Google Scholar]
- Jindal, H.; Agrawal, S.; Khera, R.; Jain, R.; Nagrath, P. Heart disease prediction using machine learning algorithms. In Proceedings of the IOP conference series: Materials science and engineering, Gorakhpur, India, 14–15 February 2020; p. 012072. [Google Scholar]
- Fernandez Escamez, C.S.; Martin Giral, E.; Perucho Martinez, S.; Toledano Fernandez, N. High interpretable machine learning classifier for early glaucoma diagnosis. Int. J. Ophthalmol. 2021, 14, 393–398. [Google Scholar] [CrossRef] [PubMed]
- Mijwil, M.M. Implementation of Machine Learning Techniques for the Classification of Lung X-Ray Images Used to Detect COVID-19 in Humans. Iraqi J. Sci. 2021, 62, 2099–2109. [Google Scholar] [CrossRef]
- Devi, R.L.; Kalaivani, V. Machine learning and IoT-based cardiac arrhythmia diagnosis using statistical and dynamic features of ECG. J. Supercomput. 2020, 76, 6533–6544. [Google Scholar] [CrossRef]
- Khanday, A.M.U.D.; Rabani, S.T.; Khan, Q.R.; Rouf, N.; Mohi Ud Din, M. Machine learning based approaches for detecting COVID-19 using clinical text data. Int. J. Inf. Technol. 2020, 12, 731–739. [Google Scholar] [CrossRef] [PubMed]
- Erickson, B.J.; Korfiatis, P.; Akkus, Z.; Kline, T.L. Machine learning for medical imaging. Radiographics 2017, 37, 505. [Google Scholar] [CrossRef]
- Palimkar, P.; Shaw, R.N.; Ghosh, A. Machine learning technique to prognosis diabetes disease: Random forest classifier approach. In Advanced Computing and Intelligent Technologies; Springer: Berlin/Heidelberg, Germany, 2022; pp. 219–244. [Google Scholar]
- Zoabi, Y.; Deri-Rozov, S.; Shomron, N. Machine learning-based prediction of COVID-19 diagnosis based on symptoms. Npj Digit. Med. 2021, 4, 3. [Google Scholar] [CrossRef]
- Raihan, M.M.S.; Shams, A.B.; Preo, R.B. Multi-class electrogastrogram (EGG) signal classification using machine learning algorithms. In Proceedings of the 2020 23rd International conference on computer and information technology (ICCIT), DHAKA, Bangladesh, 19–21 December 2020; pp. 1–6. [Google Scholar]
- Arumugam, K.; Naved, M.; Shinde, P.P.; Leiva-Chauca, O.; Huaman-Osorio, A.; Gonzales-Yanac, T. Multiple disease prediction using Machine learning algorithms. Mater. Today Proc. 2021, in press. [CrossRef]
- Saygılı, A. A new approach for computer-aided detection of coronavirus (COVID-19) from CT and X-ray images using machine learning methods. Appl. Soft Comput. 2021, 105, 107323. [Google Scholar] [CrossRef]
- Ahmad, A.; Garhwal, S.; Ray, S.K.; Kumar, G.; Malebary, S.J.; Barukab, O.M. The number of confirmed cases of covid-19 by using machine learning: Methods and challenges. Arch. Comput. Methods Eng. 2021, 28, 2645–2653. [Google Scholar] [CrossRef]
- Wroge, T.J.; Özkanca, Y.; Demiroglu, C.; Si, D.; Atkins, D.C.; Ghomi, R.H. Parkinson’s Disease Diagnosis Using Machine Learning and Voice. In Proceedings of the 2018 IEEE Signal Processing in Medicine and Biology Symposium (SPMB), Philadelphia, PA, USA, 1 December 2018; pp. 1–7. [Google Scholar]
- Sun, W.; Zhang, P.; Wang, Z.; Li, D. Prediction of cardiovascular diseases based on machine learning. ASP Trans. Internet Things 2021, 1, 30–35. [Google Scholar] [CrossRef]
- Chittora, P.; Chaurasia, S.; Chakrabarti, P.; Kumawat, G.; Chakrabarti, T.; Leonowicz, Z.; Jasiński, M.; Jasiński, Ł.; Gono, R.; Jasińska, E. Prediction of chronic kidney disease-a machine learning perspective. IEEE Access 2021, 9, 17312–17334. [Google Scholar] [CrossRef]
- Wu, C.-C.; Yeh, W.-C.; Hsu, W.-D.; Islam, M.M.; Nguyen, P.A.A.; Poly, T.N.; Wang, Y.-C.; Yang, H.-C.; Li, Y.-C.J. Prediction of fatty liver disease using machine learning algorithms. Comput. Methods Programs Biomed. 2019, 170, 23–29. [Google Scholar] [CrossRef] [PubMed]
- Subramani, P.; BD, P. Prediction of muscular paralysis disease based on hybrid feature extraction with machine learning technique for COVID-19 and post-COVID-19 patients. Pers. Ubiquitous Comput. 2021, 25, 1–14. [Google Scholar] [CrossRef] [PubMed]
- Jena, L.; Patra, B.; Nayak, S.; Mishra, S.; Tripathy, S. Risk prediction of kidney disease using machine learning strategies. In Intelligent and Cloud Computing; Springer: Berlin/Heidelberg, Germany, 2021; pp. 485–494. [Google Scholar]
- Ardakani, A.A.; Kanafi, A.R.; Acharya, U.R.; Khadem, N.; Mohammadi, A. Application of deep learning technique to manage COVID-19 in routine clinical practice using CT images: Results of 10 convolutional neural networks. Comput. Biol. Med. 2020, 121, 103795. [Google Scholar] [CrossRef] [PubMed]
- Han, S.S.; Kim, M.S.; Lim, W.; Park, G.H.; Park, I.; Chang, S.E. Classification of the Clinical Images for Benign and Malignant Cutaneous Tumors Using a Deep Learning Algorithm. J. Investig. Dermatol. 2018, 138, 1529–1538. [Google Scholar] [CrossRef]
- Kavitha, M.; Jayasankar, T.; Venkatesh, P.M.; Mani, G.; Bharatiraja, C.; Twala, B. COVID-19 disease diagnosis using smart deep learning techniques. J. Appl. Sci. Eng. 2021, 24, 271–277. [Google Scholar]
- Klang, E.; Barash, Y.; Margalit, R.Y.; Soffer, S.; Shimon, O.; Albshesh, A.; Ben-Horin, S.; Amitai, M.M.; Eliakim, R.; Kopylov, U. Deep learning algorithms for automated detection of Crohn’s disease ulcers by video capsule endoscopy. Gastrointest. Endosc. 2020, 91, 606–613.e602. [Google Scholar] [CrossRef]
- Oh, S.L.; Hagiwara, Y.; Raghavendra, U.; Yuvaraj, R.; Arunkumar, N.; Murugappan, M.; Acharya, U.R. A deep learning approach for Parkinson’s disease diagnosis from EEG signals. Neural Comput. Appl. 2020, 32, 10927–10933. [Google Scholar] [CrossRef]
- Bychkov, D.; Linder, N.; Turkki, R.; Nordling, S.; Kovanen, P.E.; Verrill, C.; Walliander, M.; Lundin, M.; Haglund, C.; Lundin, J. Deep learning based tissue analysis predicts outcome in colorectal cancer. Sci. Rep. 2018, 8, 3395. [Google Scholar] [CrossRef]
- Vorontsov, E.; Cerny, M.; Régnier, P.; Di Jorio, L.; Pal, C.J.; Lapointe, R.; Vandenbroucke-Menu, F.; Turcotte, S.; Kadoury, S.; Tang, A. Deep Learning for Automated Segmentation of Liver Lesions at CT in Patients with Colorectal Cancer Liver Metastases. Radiol. Artif. Intell. 2019, 1, 180014. [Google Scholar] [CrossRef]
- Morris, S.A.; Lopez, K.N. Deep learning for detecting congenital heart disease in the fetus. Nat. Med. 2021, 27, 764–765. [Google Scholar] [CrossRef] [PubMed]
- Cong, L.; Feng, W.; Yao, Z.; Zhou, X.; Xiao, W. Deep Learning Model as a New Trend in Computer-aided Diagnosis of Tumor Pathology for Lung Cancer. J. Cancer 2020, 11, 3615–3622. [Google Scholar] [CrossRef] [PubMed]
- Noreen, N.; Palaniappan, S.; Qayyum, A.; Ahmad, I.; Imran, M.; Shoaib, M. A Deep Learning Model Based on Concatenation Approach for the Diagnosis of Brain Tumor. IEEE Access 2020, 8, 55135–55144. [Google Scholar] [CrossRef]
- Liu, Y.; Jain, A.; Eng, C.; Way, D.H.; Lee, K.; Bui, P.; Kanada, K.; de Oliveira Marinho, G.; Gallegos, J.; Gabriele, S.; et al. A deep learning system for differential diagnosis of skin diseases. Nat. Med. 2020, 26, 900–908. [Google Scholar] [CrossRef]
- Xu, X.; Jiang, X.; Ma, C.; Du, P.; Li, X.; Lv, S.; Yu, L.; Ni, Q.; Chen, Y.; Su, J.; et al. A Deep Learning System to Screen Novel Coronavirus Disease 2019 Pneumonia. Engineering 2020, 6, 1122–1129. [Google Scholar] [CrossRef]
- Sun, C.; Xu, A.; Liu, D.; Xiong, Z.; Zhao, F.; Ding, W. Deep Learning-Based Classification of Liver Cancer Histopathology Images Using Only Global Labels. IEEE J. Biomed. Health Inform. 2020, 24, 1643–1651. [Google Scholar] [CrossRef]
- Ayan, E.; Ünver, H.M. Diagnosis of Pneumonia from Chest X-Ray Images Using Deep Learning. In Proceedings of the 2019 Scientific Meeting on Electrical-Electronics & Biomedical Engineering and Computer Science (EBBT), Istanbul, Turkey, 24–26 April 2019; pp. 1–5. [Google Scholar]
- Goceri, E. Diagnosis of skin diseases in the era of deep learning and mobile technology. Comput. Biol. Med. 2021, 134, 104458. [Google Scholar] [CrossRef]
- Doppalapudi, S.; Qiu, R.G.; Badr, Y. Lung cancer survival period prediction and understanding: Deep learning approaches. Int. J. Med. Inform. 2021, 148, 104371. [Google Scholar] [CrossRef]
- Jojoa Acosta, M.F.; Caballero Tovar, L.Y.; Garcia-Zapirain, M.B.; Percybrooks, W.S. Melanoma diagnosis using deep learning techniques on dermatoscopic images. BMC Med. Imaging 2021, 21, 6. [Google Scholar] [CrossRef]
- Saratxaga, C.L.; Moya, I.; Picón, A.; Acosta, M.; Moreno-Fernandez-de-Leceta, A.; Garrote, E.; Bereciartua-Perez, A. MRI Deep Learning-Based Solution for Alzheimer’s Disease Prediction. J. Pers. Med. 2021, 11, 902. [Google Scholar] [CrossRef]
- Placido, D.; Yuan, B.; Hjaltelin, J.X.; Haue, A.D.; Chmura, P.J.; Yuan, C.; Kim, J.; Umeton, R.; Antell, G.; Chowdhury, A. Pancreatic cancer risk predicted from disease trajectories using deep learning. bioRxiv 2022. [Google Scholar] [CrossRef]
- He, X.; Yang, X.; Zhang, S.; Zhao, J.; Zhang, Y.; Xing, E.; Xie, P. Sample-efficient deep learning for COVID-19 diagnosis based on CT scans. medRxiv 2020. [Google Scholar] [CrossRef]
- Hosny, K.M.; Kassem, M.A.; Foaud, M.M. Skin Cancer Classification using Deep Learning and Transfer Learning. In Proceedings of the 2018 9th Cairo International Biomedical Engineering Conference (CIBEC), Cairo, Egypt, 20–22 December 2018; pp. 90–93. [Google Scholar]
- Mohammed, M.; Mwambi, H.; Mboya, I.B.; Elbashir, M.K.; Omolo, B. A stacking ensemble deep learning approach to cancer type classification based on TCGA data. Sci. Rep. 2021, 11, 15626. [Google Scholar] [CrossRef] [PubMed]
- Avanzato, R.; Beritelli, F. Automatic ECG Diagnosis Using Convolutional Neural Network. Electronics 2020, 9, 951. [Google Scholar] [CrossRef]
- Alanazi, S.A.; Kamruzzaman, M.M.; Islam Sarker, M.N.; Alruwaili, M.; Alhwaiti, Y.; Alshammari, N.; Siddiqi, M.H. Boosting Breast Cancer Detection Using Convolutional Neural Network. J. Healthc. Eng. 2021, 2021, 5528622. [Google Scholar] [CrossRef]
- Saranya, N.; Karthika Renuka, D.; Kanthan, J.N. Brain Tumor Classification Using Convolution Neural Network. J. Phys. Conf. Ser. 2021, 1916, 012206. [Google Scholar] [CrossRef]
- Badža, M.M.; Barjaktarović, M.Č. Classification of Brain Tumors from MRI Images Using a Convolutional Neural Network. Appl. Sci. 2020, 10, 1999. [Google Scholar] [CrossRef]
- Li, L.; Chen, Y.; Shen, Z.; Zhang, X.; Sang, J.; Ding, Y.; Yang, X.; Li, J.; Chen, M.; Jin, C.; et al. Convolutional neural network for the diagnosis of early gastric cancer based on magnifying narrow band imaging. Gastric Cancer 2020, 23, 126–132. [Google Scholar] [CrossRef]
- Sathiyamoorthi, V.; Ilavarasi, A.K.; Murugeswari, K.; Thouheed Ahmed, S.; Aruna Devi, B.; Kalipindi, M. A deep convolutional neural network based computer aided diagnosis system for the prediction of Alzheimer’s disease in MRI images. Measurement 2021, 171, 108838. [Google Scholar] [CrossRef]
- Sekaran, K.; Chandana, P.; Krishna, N.M.; Kadry, S. Deep learning convolutional neural network (CNN) With Gaussian mixture model for predicting pancreatic cancer. Multimed. Tools Appl. 2020, 79, 10233–10247. [Google Scholar] [CrossRef]
- Subramanian, R.R.; Achuth, D.; Kumar, P.S.; Reddy, K.N.k.; Amara, S.; Chowdary, A.S. Skin cancer classification using Convolutional neural networks. In Proceedings of the 2021 11th International Conference on Cloud Computing, Data Science & Engineering (Confluence), Noida, India, 28–29 January 2021; pp. 13–19. [Google Scholar]
- Patil, D.D.; Deore, S.G. Medical image segmentation: A review. Int. J. Comput. Sci. Mob. Comput. 2013, 2, 22–27. [Google Scholar]
- Miranda, E.; Aryuni, M.; Irwansyah, E. A Survey of Medical Image Classification Techniques. In Proceedings of the 2016 international conference on information management and technology (ICIMTech), Bandung, Indonesia, 16–18 November 2016. [Google Scholar] [CrossRef]
- Nisa, S.Q.; Ismail, A.R.; Ali, M.A.B.M.; Khan, M.S. Medical Image Analysis using Deep Learning: A Review. In Proceedings of the 2020 IEEE 7th International Conference on Engineering Technologies and Applied Sciences (ICETAS), Kuala Lumpur, Malaysia, 18–20 December 2020; pp. 1–3. [Google Scholar]
- Cheng, D.; Liu, M. Combining convolutional and recurrent neural networks for Alzheimer’s disease diagnosis using PET images. In Proceedings of the 2017 IEEE International Conference on Imaging Systems and Techniques (IST), Beijing, China, 18–20 October 2017; pp. 1–5. [Google Scholar]
- Neffati, S.; Taouali, O. An MR brain images classification technique via the Gaussian radial basis kernel and SVM. In Proceedings of the 2017 18th International Conference on Sciences and Techniques of Automatic Control and Computer Engineering (STA), Monastir, Tunisia, 21–23 December 2017; pp. 611–616. [Google Scholar]
- Varun Jain, S.G. Analysis of Brain MRI Tumor Detection and Classification using Hybrid Approach. Int. J. Comput. Sci. Commun. IJCSC 2017, 8, 42–47. [Google Scholar]
- Edwin, D.; Hariharan, S. Classification of Liver Tumor using Modified SFTAbased Multi Class Support Vector Machine. In Proceedings of the 2017 International Conference on Current Trends in Computer, Electrical, Electronics and Communication (CTCEEC), Mysore, India, 8–9 September 2017; pp. 854–859. [Google Scholar]
- Chakraborty, S.; Mali, K.; Chatterjee, S.; Anand, S.; Basu, A.; Banerjee, S.; Das, M.; Bhattacharya, A. Image based skin disease detection using hybrid neural network coupled bag-of-features. In Proceedings of the 2017 IEEE 8th Annual Ubiquitous Computing, Electronics and Mobile Communication Conference (UEMCON), New York, NY, USA, 19–21 October 2017; pp. 242–246. [Google Scholar]
- Hasija, Y.; Garg, N.; Sourav, S. Automated detection of dermatological disorders through image-processing and machine learning. In Proceedings of the 2017 International Conference on Intelligent Sustainable Systems (ICISS), Palladam, India, 7–8 December 2017; pp. 1047–1051. [Google Scholar]
- Lodha, P.; Talele, A.; Degaonkar, K. Diagnosis of Alzheimer’s Disease Using Machine Learning. In Proceedings of the 2018 Fourth International Conference on Computing Communication Control and Automation (ICCUBEA), Pune, India, 16–18 August 2018; pp. 1–4. [Google Scholar]
- Keerthana, T.; Xavier, S.B. An Intelligent System for Early Assessment and Classification of Brain Tumor. In Proceedings of the 2018 Second International Conference on Inventive Communication and Computational Technologies (ICICCT), Coimbatore, India, 20–21 April 2018; pp. 1265–1268. [Google Scholar]
- Thamke, L.A.; Vaidya, M.V. Classification of Lung Diseases Using a Combination of Texture, Shape and Pixel Value by K-NN Classifier. In Proceedings of the 2018 2nd International Conference on I-SMAC (IoT in Social, Mobile, Analytics and Cloud) (I-SMAC)I-SMAC (IoT in Social, Mobile, Analytics and Cloud) (I-SMAC), Palladam, India, 30–31 August 2018; pp. 235–240. [Google Scholar]
- Sarwar, A.; Ali, M.; Manhas, J.; Sharma, V. Diagnosis of diabetes type-II using hybrid machine learning based ensemble model. Int. J. Inf. Technol. 2020, 12, 419–428. [Google Scholar] [CrossRef]
- Pallavi, B.; Keshvamurthy. A Hybrid Diagnosis System for Malignant Melanoma Detection in Dermoscopic Images. In Proceedings of the 2019 4th International Conference on Recent Trends on Electronics, Information, Communication & Technology (RTEICT), Bangalore, India, 17–18 May 2019; pp. 1471–1476. [Google Scholar]
- Neeraj Kumar, V.S. A Hybrid Classification and Prediction Methodology for the Diagonosis of Osteoporosis. Int. J. Innov. Technol. Explor. Eng. 2019, 8, 4648–4653. [Google Scholar] [CrossRef]
- Rabi, B.; Attallah, O.; Zaghlool, M.S.; Sharkas, M.A. Automatic Classification of Gastrointestinal Diseases Based on Machine Learning Techniques. In Proceedings of the 2019 29th International Conference on Computer Theory and Applications (ICCTA), Alexandria, Egypt, 29–31 October 2019; pp. 85–89. [Google Scholar]
- Sakshi Sharma, M.S.; Baljeet, N. CDCT: CT Scan Images based on Mechanism for Lung Cancer Detection. Int. J. Recent Technol. Eng. IJRTE 2019, 8, 931–935. [Google Scholar]
- Yadav, S.S.; Jadhav, S.M. Deep convolutional neural network based medical image classification for disease diagnosis. J. Big Data 2019, 6, 113. [Google Scholar] [CrossRef]
- Sannasi Chakravarthy, S.R.; Rajaguru, H. Lung Cancer Detection using Probabilistic Neural Network with modified Crow-Search Algorithm. Asian Pac. J. Cancer Prev. 2019, 20, 2159–2166. [Google Scholar] [CrossRef]
- Aamir Yousuf Bhat, A.S. Normal And Abnormal Detection For Knee Osteoarthritis Using Machine Learning Techniques. Int. J. Recent Technol. Eng. 2019, 8, 6026–6033. [Google Scholar] [CrossRef]
- Aledhari, M.; Joji, S.; Hefeida, M.; Saeed, F. Optimized CNN-based diagnosis system to detect the pneumonia from chest radiographs. In Proceedings of the 2019 IEEE International Conference on Bioinformatics and Biomedicine (BIBM), San Diego, CA, USA, 18–21 November 2019; pp. 2405–2412. [Google Scholar]
- Szymkowski, M.; Saeed, E.; Omieljanowicz, M.; Omieljanowicz, A.; Saeed, K.; Mariak, Z. A Novelty Approach to Retina Diagnosing Using Biometric Techniques With SVM and Clustering Algorithms. IEEE Access 2020, 8, 125849–125862. [Google Scholar] [CrossRef]
- Awasthi, S.; Kapoor, E.; Srivastava, A.P.; Sanyal, G. A New Alzheimer’s Disease Classification Technique from Brain MRI images. In Proceedings of the 2020 International Conference on Computation, Automation and Knowledge Management (ICCAKM), Dubai, United Arab Emirates, 9–10 January 2020; pp. 515–520. [Google Scholar]
- Suresha, H.S.; Parthasarathy, S.S. Alzheimer Disease Detection Based on Deep Neural Network with Rectified Adam Optimization Technique using MRI Analysis. In Proceedings of the 2020 Third International Conference on Advances in Electronics, Computers and Communications (ICAECC), Bengaluru, India, 11–12 December 2020; pp. 1–6. [Google Scholar]
- Chowdhary, C.L.; Mittal, M.; Pattanaik, P.A.; Marszalek, Z. An Efficient Segmentation and Classification System in Medical Images Using Intuitionist Possibilistic Fuzzy C-Mean Clustering and Fuzzy SVM Algorithm. Sensors 2020, 20, 3903. [Google Scholar] [CrossRef]
- Gholami, F. Improved fuzzy clustering with swarm intelligence for medical image analysis. In Proceedings of the 2020 6th Iranian Conference on Signal Processing and Intelligent Systems (ICSPIS), Mashhad, Iran, 23–24 December 2020; pp. 1–5. [Google Scholar]
- Kaur, J.; Singh, M.; Singla, S.K. Study of Fusion of medical images and classification comparison using different kernels of SVM and K-NN classifiers. In Proceedings of the 2020 First IEEE International Conference on Measurement, Instrumentation, Control and Automation (ICMICA), Kurukshetra, India, 24–26 June 2020; pp. 1–6. [Google Scholar]
- Erkal, B.; Başak, S.; Çiloğlu, A.; Şener, D.D. Multiclass Classification of Brain Cancer with Machine Learning Algorithms. In Proceedings of the 2020 Medical Technologies Congress (TIPTEKNO), Antalya, Turkey, 19–20 November 2020; pp. 1–4. [Google Scholar]
- Kumar, G.U.S.; Kanth, T.V.R.; Raju, S.V.; Malyala, S. Advanced Analysis of Cardiac Image Processing Using Hybrid Approach. In Proceedings of the 2021 International Conference on Advances in Electrical, Computing, Communication and Sustainable Technologies (ICAECT), Bhilai, India, 19–20 February 2021; pp. 1–6. [Google Scholar]
- Gharaibeh, N.; Al-hazaimeh, O.M.; Abu-Ein, A.; Nahar, K.M. A hybrid svm naïve-bayes classifier for bright lesions recognition in eye fundus images. Int. J. Electr. Eng. Inf. 2021, 13, 530–545. [Google Scholar] [CrossRef]
- Zubair, L.; Irtaza, S.A.; Nida, N.; Haq, N.U. Alzheimer and Mild Cognitive disease Recognition Using Automated Deep Learning Techniques. In Proceedings of the 2021 International Bhurban Conference on Applied Sciences and Technologies (IBCAST), Islamabad, Pakistan, 12–16 January 2021; pp. 310–315. [Google Scholar]
- Masud, M.; Sikder, N.; Nahid, A.-A.; Bairagi, A.K.; AlZain, M.A. A Machine Learning Approach to Diagnosing Lung and Colon Cancer Using a Deep Learning-Based Classification Framework. Sensors 2021, 21, 748. [Google Scholar] [CrossRef] [PubMed]
- Assam, M.; Kanwal, H.; Farooq, U.; Shah, S.K.; Mehmood, A.; Choi, G.S. An Efficient Classification of MRI Brain Images. IEEE Access 2021, 9, 33313–33322. [Google Scholar] [CrossRef]
- Hashan, A.M.; Agbozo, E.; Al-Saeedi, A.A.K.; Saha, S.; Haidari, A.; Rabi, M.N.F. Brain Tumor Detection in MRI Images Using Image Processing Techniques. In Proceedings of the 2021 4th International Symposium on Agents, Multi-Agent Systems and Robotics (ISAMSR), Batu Pahat, Malaysia, 6–8 September 2021; IEE; pp. 24–28. [Google Scholar]
- Cai, X.; Li, X.; Razmjooy, N.; Ghadimi, N. Breast Cancer Diagnosis by Convolutional Neural Network and Advanced Thermal Exchange Optimization Algorithm. Comput. Math. Methods Med. 2021, 2021, 5595180. [Google Scholar] [CrossRef] [PubMed]
- Kumar, M.S.; Rao, K.V.; Kumar, G.A. MRI Image Based Classification Model for Lung Tumor Detection Using Convolutional Neural Networks. Traitement Du Signal 2021, 38, 1837–1842. [Google Scholar] [CrossRef]
- Riajuliislam, M.; Rahim, K.Z.; Mahmud, A. Prediction of Thyroid Disease(Hypothyroid) in Early Stage Using Feature Selection and Classification Techniques. In Proceedings of the 2021 International Conference on Information and Communication Technology for Sustainable Development (ICICT4SD), Dhaka, Bangladesh, 27–28 February 2021; pp. 60–64. [Google Scholar]
- Patankar, A.M.; Thorat, S.S. Diagnosis of Ophthalmic Diseases in Fundus Image Using various Machine Learning Techniques. In Proceedings of the 2021 6th International Conference on Communication and Electronics Systems (ICCES), Coimbatre, India, 8–10 July 2021; pp. 1114–1118. [Google Scholar]
- Parashar, D.R.; Agarwal, D.K. SVM based Supervised Machine Learning Framework for Glaucoma Classification using Retinal Fundus Images. In Proceedings of the 2021 10th IEEE International Conference on Communication Systems and Network Technologies (CSNT), Bhopal, India, 18–19 June 2021; pp. 660–663. [Google Scholar]
- Alshammari, M.; Mezher, M. A Modified Convolutional Neural Networks For MRI-based Images For Detection and Stage Classification Of Alzheimer Disease. In Proceedings of the 2021 National Computing Colleges Conference (NCCC), Taif, Saudi Arabia, 27–28 March 2021; pp. 1–7. [Google Scholar]
- Al-Smadi, M.; Hammad, M.; Baker, Q.B.; Sa’ad, A. A transfer learning with deep neural network approach for diabetic retinopathy classification. Int. J. Electr. Comput. Eng. 2021, 11, 3492. [Google Scholar] [CrossRef]
- Mohagheghi, S.; Alizadeh, M.; Safavi, S.M.; Foruzan, A.H.; Chen, Y.-W. Integration of CNN, CBMIR, and visualization techniques for diagnosis and quantification of covid-19 disease. IEEE J. Biomed. Health Inform. 2021, 25, 1873–1880. [Google Scholar] [CrossRef]
- Singh, S.; Ho-Shon, K.; Karimi, S.; Hamey, L. Modality classification and concept detection in medical images using deep transfer learning. In Proceedings of the 2018 International conference on image and vision computing New Zealand (IVCNZ), Auckland, New Zealand, 19–21 November 2018; pp. 1–9. [Google Scholar]
- Perumal, S.; Thambusamy, V. Preprocessing by contrast enhancement techniques for medical images. Int. J. Pure Appl. Math. 2018, 118, 3681–3688. [Google Scholar]
- Kulwa, F.; Li, C.; Zhao, X.; Cai, B.; Xu, N.; Qi, S.; Chen, S.; Teng, Y. A State-of-the-Art Survey for Microorganism Image Segmentation Methods and Future Potential. IEEE Access 2019, 7, 100243–100269. [Google Scholar] [CrossRef]
- Kumar, K.K.; Chaduvula, K.; Markapudi, B. A Detailed Survey On Feature Extraction Techniques In Image Processing For Medical Image Analysis. Clin. Med. 2020, 7, 2020. [Google Scholar]
- Lai, Z.; Deng, H. Medical Image Classification Based on Deep Features Extracted by Deep Model and Statistic Feature Fusion with Multilayer Perceptron. Comput. Intell. Neurosci. 2018, 2018, 2061516. [Google Scholar] [CrossRef] [PubMed]
- Elaziz, M.A.; Hosny, K.M.; Salah, A.; Darwish, M.M.; Lu, S.; Sahlol, A.T. New machine learning method for image-based diagnosis of COVID-19. PLoS ONE 2020, 15, e0235187. [Google Scholar] [CrossRef] [PubMed]
- Khan, W.; Zaki, N.; Ali, L. Intelligent Pneumonia Identification From Chest X-Rays: A Systematic Literature Review. IEEE Access 2021, 9, 51747–51771. [Google Scholar] [CrossRef]
- Alloghani, M.; Al-Jumeily, D.; Mustafina, J.; Hussain, A.; Aljaaf, A.J. A Systematic Review on Supervised and unsupervised Machine learning Algorithms for Data Science. In Supervised and Unsupervised Learning for Data Science; Berry, M., Mohamed, A., Yap, B., Eds.; Springer: Cham, Switzerland, 2019; pp. 3–21. [Google Scholar] [CrossRef]
- Houssein, E.H.; Emam, M.M.; Ali, A.A.; Suganthan, P.N. Deep and machine learning techniques for medical imaging-based breast cancer: A comprehensive review. Expert Syst. Appl. 2021, 167, 114161. [Google Scholar] [CrossRef]
- Yap, M.H.; Pons, G.; Marti, J.; Ganau, S.; Sentis, M.; Zwiggelaar, R.; Davison, A.K.; Marti, R. Automated breast ultrasound lesions detection using convolutional neural networks. IEEE J. Biomed. Health Inform. 2017, 22, 1218–1226. [Google Scholar] [CrossRef]
- Krizhevsky, A.; Sutskever, I.; Hinton, G.E. ImageNet classification with deep convolutional neural networks. Commun. ACM 2017, 60, 84–90. [Google Scholar] [CrossRef]
- Petrellis, N. A Review of Image Processing Techniques Common in Human and Plant Disease Diagnosis. Symmetry 2018, 10, 270. [Google Scholar] [CrossRef]
- D’hooge, J.; Fraser, A.G. Learning About Machine Learning to Create a Self-Driving Echocardiographic Laboratory: Technical Considerations. Circulation 2018, 138, 1636–1638. [Google Scholar] [CrossRef]
- Buettner, R.; Bilo, M.; Bay, N.; Zubac, T. A Systematic Literature Review of Medical Image Analysis Using Deep Learning. In Proceedings of the 2020 IEEE Symposium on Industrial Electronics & Applications (ISIEA), TBD, Malaysia, 17–18 July 2020; pp. 1–4. [Google Scholar]


| Studies (Author (Year) [Ref]) | Imaging Modality | Type of Disease | Medical Database |
|---|---|---|---|
| Danni Cheng et al. (2017) [66] | PET | Alzheimer’s disease | Alzheimer’s Disease Neuroimaging Initiative (ADNI) database (https://adni.loni.usc.edu/) (accessed on 18 June 2022). The dataset contained 339 brain images (93 AD, 146 MCI, 100 NC subjects). |
| Syrine Neffati et al. (2017) [67] | MRI | Brain disease | Harvard Medical School website, Open Access Series of Imaging Studies (OASIS) website. The dataset contained normal brains and seven types of pathological brains with a total of 226 images (38 normal brains and 188 pathological brains). |
| Varun Jain et al. (2017) [68] | MRI | Brain tumor | SICAS Medical Image Repository dataset contained 25 MRI brain images (20 benign, 5 malignant). |
| Anjukrishna et al. (2017) [69] | CT | Liver cancer tumor | Travancore scan center, Thiruvananthapuram (www.liveratlas.org) (accessed on 19 June 2022). The dataset contained 80 abdominal CT images, 20 of a normal liver and the rest images of various liver diseases. |
| Shouvik Chakraborty et al. (2017) [70] | Dermoscopy skin imaging | Skin cancers | International Skin Imaging Collaboration (ISIC) dataset contained images of two classes (skin angioma and basel cell carcinoma). |
| Soumya Sourav et al. (2017) [71] | Dermoscopy skin imaging | Dermatological diseases | Dermatology Online Atlas (www.dermis.net), http://homepages.inf.ed.ac.uk/rbf/DERMOFIT/ (accessed on 19 June 2022). The dataset contained 3000 images of four types (psoriasis, herpes, eczema, and melanoma). |
| Priyanka Lodha et al. (2018) [72] | MRI PET | Alzheimer’s disease | ADNI database (http://adni.loni.usc.edu) (accessed on 18 June 2022). The ADNI study was applied to people between the age of 55 and 90. |
| Keerthana T K et al. (2018) [73] | MRI | Brain tumor | Brain MRI medical image dataset which contained normal, benign, and malignant images. |
| Latika A. Thamke et al. (2018) [74] | CT | Lung diseases | CT scan image dataset collected from patients (age ranges from 35 to 75). The datasets contained 400 images (100 normal, 100 pleural effusion, 100 bronchitis, and 100 emphysema). |
| Abid Sarwar et al. (2018) [75] | Medical data (non-image) | Diabetes type-II | The authors prepared a rich database that included two classes (diabetic and non-diabetic) of 400 people from a large geographical area (age ranges from 5 to 75). |
| Pallavi. B et al. (2019) [76] | Dermoscopy imaging | Malignant melanoma skin cancer disease | The authors gathered specimen images of the sickly greeneries, then trained and stored them in the database. This database contained normal and abnormal images. |
| Neeraj Kumar et al. (2019) [77] | CT | Bone disease (osteoporosis) | The NCBI dataset associated with osteoporosis. The authenticated medical center Medpix NLM website. The database contained two classes with features (plane, modality, age, fracture, gender, weight, and history). |
| Rabi et al. (2019) [78] | Endoscopic images | Gastrointestinal (GI) diseases | The KVASIR dataset consisted of 4000 images containing 8 classes of GI diseases. Some of the supplied image classes feature a green image depicting the location and form of the endoscope within the intestine. |
| Sakshi Sharma et al. (2019) [79] | CT | Lung cancer disease | Database gathered from the IMBA web page contained normal and abnormal CT images of cancers for both males and females. |
| Smir S. Yadav et al. (2019) [80] | X-ray | Pneumonia disease | The dataset was based on previous literature. The dataset contained 5856 images (normal, bacteria, and viruses). |
| Sannasi Chakravarthy et al. (2019) [81] | CT | Lung cancer disease | Lung Image Database Consortium (LIDC). The dataset was composed of diagnostic and cancer screening thoracic CAT examinations with marked-up interpretations. |
| Aamir Bhat et al. (2019) [82] | X-ray | Osteoarthritis disease | The datasets were gathered from numerous hospitals. The dataset contained 126 knee joint X-ray images. |
| Mohammed Aledhari et al. (2019) [83] | X-ray chest radiographs | Pneumonia disease | National Institute of Health (NIH) dataset contained 1431 labeled X-ray images (normal and pneumonia). |
| Maciej Szymkowski et a l. (2020) [84] | Retina color images | Retina disease diagnosis | Medical University of Bialystok (MUB) Clinic Hospital, publicly available DRIVE STARE, Kaggle. The database contained 500 images (250 healthy samples and 250 pathological samples). |
| Shashank Awasthi et al. (2020) [85] | MRI | Alzheimer’s disease | The publicly available OASIS dataset contained MRI images of normal and AD patients. |
| Halebeedu Suresha et al. (2020) [86] | MRI | Alzheimer’s disease | The National Institute of Mental Health and Neurosciences (NIMHANS) dataset contained 800 images for 99 people (60 normal and 39 AD with age ranges from 55 to 87 years). The ADNI dataset contained 819 subjects (229 normal, 192 AD, and 398 MCI). |
| Chiranji Lal Chowdhary et al. (2020) [87] | Breast X-ray (mammogram) | Breast cancer disease | Mammography Image Analysis Society (MIAS) dataset contained 320 mammogram images (51 malignant, 63 benign, and 206 normal). |
| Fateme Gholami et al. (2020) [88] | MRI | Brain tumors | MRI image dataset gathered by the authors. The number of samples considered for evaluation in this article was 30 gray images. |
| Jaspreet Kaur et al. (2020) [89] | CT PET | Detecting cancer | PET Center, Postgraduate Institute of Medical Education and Research (PGIMER), Chandigarh, India. The dataset contained 200 medical images. |
| Begüm Erkal et al. (2020) [90] | Medical data (non-image) | Brain cancer | Broad Institute (http://portals.broadinstitute.org/cgi-bin/cancer/datasets) (accessed on 20 June 2022). The dataset contained 42 samples (7129 features and 5 classes). |
| G U Santosh Kumar et al. (2021) [91] | MRI | Cardiovascular diseases, cardiac attack | The dataset of patients from the York university contained the cardiac MRI DICOM images of patients suffering from various cardiovascular diseases. |
| Nasr Gharaibeh et al. (2021) [92] | Retinal fundus images | Diabetic retinopathy (DR) | The Image-Ret database included two sub-databases (i.e., DIARETDB0 and DIARETDB1). |
| Laiba Zubair et al. (2021) [93] | MRI | Alzheimer’s disease | The ADNI dataset contained 145 MRI images (39 AD, 45 CN, and 68 MCI). |
| Mehedi Masud et al. (2021) [94] | Histopathological image | Lung cancer and colon cancer | The LC25000 dataset contained 25,000 color images of five types of lung and colon tissues (colon adenocarcinoma, benign colonic tissue, lung adenocarcinoma, benign lung tissue, and lung squamous cell carcinoma). |
| Muhammad Assam et al. (2021) [95] | MRI | MRI brain images classification | Harvard medical school database contained 70 images (25 normal and 45 abnormal, which comprised three different kinds of diseases: brain tumor, acute stroke, and Alzheimer disease). |
| Antor Hashan et al. (2021) [96] | MRI | Brain tumor | MRI images of the brain were collected from various hospitals and compiled in a Kaggle dataset that contained 400 images (230 brain tumors and 170 normal) |
| Xiuzhen Cai et al. (2021) [97] | Breast X-ray (mammogram) | Breast cancer | The MIAS mammogram database (http://peipa.esex.ac.uk/info/mias.html) (accessed on 21 June 2022). The dataset contained 322 mammography images that were taken from the UK National Breast Screening Program. |
| Makineni Kumar et al. (2021) [98] | MRI | Lung cancer disease | MRI lung cancer image dataset, which contained normal and tumor images. |
| Md Riajuliislam et al. (2021) [99] | Medical data (non-image) | Thyroid disease (hypothyroid) | The dataset from the registered diagnostic center Dhaka, Bangladesh, contained 519 data with 9 attributes. |
| Aasawari M. Patankar et al.(2021) [100] | Fundus images | Ophthalmic diseases | The dataset was gathered by the authors and contained various ophthalmic diseases such as macular degeneration, retinopathy, myopia, cataract, and other abnormalities. |
| Deepak R. Parashar et al. (2021) [101] | Retinal fundus images | Glaucoma classification | RIM-ONE dataset contained 455 fundus photographs. Drishti-GS1 dataset contained 101 retinal images. RIM-ONE released 1 dataset which contained 40 images. |
| Majdah Alshammari et al. (2021) [102] | MRI | Alzheimer’s disease | Alzheimer’s dataset (available: https://www.kaggle.com/tourist55/alzheimers) (accessed on 22 June 2022) contained 4 classes of diseases (896 mild demented, 64 moderate demented, 2240 very mild demented, and 3200 non-demented). |
| Mohammed Al-Smadi et al. (2021) [103] | Fundus images | Diabetic retinopathy | Kaggle dataset (available: https://www.kaggle.com/c/aptos2019-blindness-detection) (accessed on 22 June 2022) contained 3562 images and was obtained from various clinics in India and represents real-world data. |
| Saeed Mohagheghi et al. (2021) [104] | X-ray CT | COVID-19 disease | Kaggle dataset contained 1400 healthy and pneumonia images. J. Cohen’s COVID-19 dataset contained 210 COVID-19, normal, and pneumonia images. |
| Sonit Singh et al. (2021) [105] | CT, MRI, X-ray, PET, US, Microscopy images | Classifying medical image modalities | The authors downloaded 10,000 medical images for each modality from Open-i Biomedical Image Search Engine, National Institute of Health, and U.S. National Laboratory of Medicine. |
| Studies (Author (Year) [Ref]) | Type of Features | Method Used |
|---|---|---|
| Syrine Neffati et al. (2017) [67] | Texture features | DWT transforms to extract features. The kernel PCA (KPCA) technique for feature reduction. |
| Varun Jain et al. (2017) [68] | Texture features | DWT transform for feature extraction. PCA technique for diminishing the number of features. |
| AnjKrishna M et al. (2017) [69] | Texture features | SFTA and modified SFTA algorithms to extract features. |
| Shouvik Chakraborty et al. (2017) [70] | Several key points such as features from which it creates a descriptor for that point | SIFT to detect key (interest) points and feature extraction. Bag-of-features concept to decrease the number of key points. |
| Priyanka Lodha, et al. (2018) [72] | Cognitive and biological features | The full volume of the brain is extracted from MRI images and other cognitive and biological features. |
| Keerthana T K et al. (2018) [73] | Texture features | GLCM for features extraction. |
| Latika A. Thamke et al. (2018) [74] | Texture and shape features Pixel coefficient value | GLCM for features extraction. Moment Invariant (MI). WHT transforms to calculate the pixel value of the image. |
| Pallavi. B et al. (2019) [76] | Combination of texture and color features | Nine features are mean, standard deviation, entropy, RMS, variance, smoothness, kurtosis, skewness, and inverse difference momentum. |
| Bahaa Rabi et al. (2019) [78] | Texture and shape features | DWT transforms for feature extraction. HOG transforms for feature extraction. PCA and SVD methods for feature reduction. |
| Sannasi Chakravarthy et al. (2019) [81] | Texture features | GLCM for feature extraction. CCSA for feature selection manually. |
| Aamir Bhat et al. (2019) [82] | Texture features | HOG and DWT transform for feature extraction. |
| Maciej Szymkowsk et al. (2020) [84] | Biometric features | Extract the characteristic points (so-called minutiae) on retina images and count the number of minutiae on the resulting image. |
| Shashank Awasthi et al. (2020) [85] | Combination of fractal and statistical features | The features such as mean of zero crossing, mean of IMF, standard deviation, etc. PCA for feature reduction. |
| Halebeedu Suresha et al. (2020) [86] | Texture features | HOG transforms for feature extraction. |
| Chiranji Lal Chowdhary et al. (2020) [87] | Vital features for segmentation Texture features for classification | The vital features are texture, shape, margin, and intensity. The gray-level histogram computations compute the texture features. |
| Jaspreet Kaur et al. (2020) [89] | Texture features | GLCM technique for feature extraction. |
| Nasr Gharaibeh et al. (2021) [92] | Texture and shape features | Haralick and shape-based features. US-PSO-RR algorithm for feature reduction. |
| Mehedi Masud et al. (2021) [94] | Texture features | 2D Fourier Features (2D-FFT) and 2D Wavelet Features (2D-DWT). |
| Muhammad Assam et al. (2021) [95] | Color features | DWT transforms for feature extraction. Color Moments (CMs) to reduce the number of features. |
| Xiuzhen Cai et al. (2021) [97] | Texture features | Combination of GLCM and DWT. |
| Makineni Kumar et al. (2021) [98] | Shape features | Diameter, Perimeter, Entropy, Intensity, and Eccentricity. |
| Md Riajuliislam et al. (2021) [99] | Data of patients | Age, sex, ID, etc. PCA for feature selection. |
| Aasawari M. Patankar et al. (2021) [100] | Texture, color, and edges features | Wavelet transform, DCT approach, and color information. |
| Deepak R. Parashar et al. (2021) [101] | Texture features | Texture-based Zernike moment, chip histogram, and Haralick descriptors. |
| Sonit Singh el at. (2021) [105] | Statistical and texture features | Local binary pattern (LBP) and GLCM. |
| Studies [Ref] | Performance Metrics | No. of Studies |
|---|---|---|
| [68,69,71,73,75,76,77,84,85,89,95,100,102,103,105] | Accuracy | 15 |
| [67,79,81,88,92,93,97,101] | Accuracy, Specificity, Sensitivity | 8 |
| [70,82,86,94] | Accuracy, Precision, Recall, F1 score | 4 |
| [72,74,98,104] | Accuracy, Specificity, Sensitivity, Precision, Recall, F1 score | 4 |
| [90,96] | Accuracy, F1 score | 2 |
| [66] | Accuracy, Specificity, Sensitivity, AUC | 1 |
| [80] | Accuracy, Specificity, Recall | 1 |
| [78] | Accuracy, Specificity, Precision, Recall, F1 score | 1 |
| [87] | Accuracy, Sensitivity | 1 |
| [83] | Accuracy, Specificity | 1 |
| [99] | Accuracy, Specificity, Sensitivity, F1 score | 1 |
| Studies (Author (Year) [Ref]) | Techniques | Task | Accuracy Results |
|---|---|---|---|
| Anju krishna M et al. (2017) [69] | Naïve Bayes and SVM | Classify liver tumor: Normal, Cirrhosis, HCC, and Hemangioma | 78% 92.5% |
| Priyanka Lodha, et al. (2018) [72] | SVM, Gradient boosting, NN, K-NN, and RF | Alzheimer’s disease | 97.56% 97.25% 98.36% 95% 97.86% |
| Keerthana T K et al. (2018) [73] | SVM | Diagnosis and classification of brain tumor disease | The system provided better accuracy with the genetic algorithm GA-SVM. |
| Latika A. Thamke et al. (2018) [74] | K-NN, Multiclass-SVM, and DT | Classify lung disease kinds: Normal, Bronchitis, Pleural, Emphysema, and Effusion | The K-NN classifier gave better outcomes (97.5%) than other classifiers. |
| Abid Sarwar et al. (2018) [75] | ANN, SVM, K-NN, Naïve Bayes, and Ensemble | Diabetes type-II | The results showed that the ensemble technique provided a superior accuracy of 98.60%. |
| Pallavi. B et al. (2019) [76] | Multi-level SVM | Classify skin disease | A combination of texture and color features outcomes in the highest classification accuracy using multi SVM. |
| Neeraj Kumar et al. (2019) [77] | SVM and NN | Bone disease prediction of osteoporosis | Both classifiers gave efficient outcomes. |
| Bahaa Rabi et al. (2019) [78] | SVM, K-NN, LD, and DT | Classify eight GI classes | The highest accuracy of classification was 99.8%, using the decision tree. |
| Sannasi Chakravarthy et al. (2019) [81] | PNN | Lung cancer at the early stage | 90% |
| Aamir Bhat et al. (2019) [82] | SVM and ANN | Knee osteoarthritis in early stage | 85.33% 73.82% |
| Maciej Szymkowski et al. (2020) [84] | SVM (linear), SVM (3rd-degree polynomial), K-NN, and K-Means | The healthy and unhealthy | 95.25% 96.45% 73.96% 80.42% |
| Shashank Awasthi et al. (2020) [85] | Logistic regression, Naïve Bayes, and SVM | Alzheimer’s disease classification in MRI image | 81% 79.88% 92.34% |
| Chiranji Lal Chowdhary et al. (2020) [87] | DT, RSDA, SVM, and FSVM | Detecting breast cancer | 82.5% 96.1% 88.13% 98.85% |
| Jaspreet Kaur et al. (2020) [89] | SVM and K-NN | Detecting cancer (cancerous and non-cancerous) | The accuracy of SVM varied from 95.5–98%. Accuracy of t h e K- NN classifier varied from 69.5–95.5%. |
| Begüm Erkal et al. (2020) [90] | Random Forest, K-NN, Bayes, LMT, DT, and Multilayer Perceptron. | Detecting brain cancer | The experimental outcomes suggest that the Multilayer Perceptron approach outperforms other machine learning methods in accuracy. |
| Md Riajuliislam et al. (2021) [99] | SVM, DT, RF, Naïve Bayes, and Logistic egression | Hypothyroid at the early stage | 99.35% 99.35% 99.35% 94.23% 99.35% |
| Deepak R. Parashar et al. (2021) [101] | Multi-stage classifier (SVM) | Glaucoma classification | 91% |
| Studies (Author (Year) [Ref]) | Architecture | Task | Results |
|---|---|---|---|
| Danni Cheng et al. (2017) [66] | CNN + RNN | Classify AD vs. NC Classify MCI vs. NC | 91.19% (Accuracy), 91.40% (Sensitivity), 91.00% (Specificity), and 95.28% (AUC). 78.86% (Accuracy), 78.08% (Sensitivity), 80.00% (Specificity), and 83.90% (AUC). |
| Smir S. Yadav et al. (2019) [80] | VGG16 InceptionV3 Capsule Net | Classify pneumonia vs. normal | 0.923 (Accuracy), 0.926 (Specificity), and 0.923 (Recall) 0.824 (Accuracy), 0.846 (Specificity), and 0.824 (Recall) |
| Mohammed Aledhari et al. (2019) [83] | VGG16 ResNet-50 Inception v3 (fine-tuned VGG16) | Pneumonia vs. normal | 68% (Accuracy) 58% (Accuracy) 53% (Accuracy) 75% (Accuracy) |
| Maciej Szymkowski et al. (2020) [84] | ResNet50 | Retina diagnosis | 86% (Accuracy) |
| Halebeedu Subbaraya et al. (2020) [86] | CNN + Adam Optimizer | Classify brain tumors | 90% (Accuracy) and 0.89 (F1 score) |
| Laiba Zubair et al. (2021) [93] | CNN+ Bayesian optimization | AD vs. CN vs. MCI | 99.3% (Accuracy) |
| Mehedi Masud et al. (2021) [94] | CNN | Five types of lungs and colon cancers | 96.33% (Accuracy), 96.39% (Precision), 96.37% (Recall), 96.38% (F-Measure) |
| Xiuzhen Cai et al. (2021) [97] | CNN + Thermal Exchange Optimizer | Breast cancer diagnosis | 93.79 (Accuracy), 96.89 (Sensitivity), and 67.7 (Specificity). |
| Makineni Kumar et al. (2021) [98] | LTD-CNN | Lung tumor detection | 96% (Accuracy), 96% (Sensitivity), 93% (Specificity), and 94% (Precision). |
| Majdah Alshammari et al. (2021) [102] | CNN + ML+ Adam Optimizer | AD vs. mild demented vs. moderate demented vs. very mild demented, vs. non-demented | 98% accuracy for testing and 97% in training. |
| Mohammed Al-Smadi et al. (2021) [103] | ResNet, Inception V3 Inception V4 DenseNet Xception EfficientNet | Diabetic retinopathy diagnosis | 77.6% (QWK) 82% (QWK) 79.6% (QWK) 81.8% (QWK) 80.9% (QWK) 80% (QWK) |
| Saeed Mohagheghi et al. (2021) [104] | CNN with CBMIR | COVID-19 disease diagnosis | 97% (Accuracy), 99% (Sensitivity), 99% (Specificity 97% (Precision), 99% (Recall), and 98% (F-Measure). |
| Sonit Singh el at. (2021) [105] | VGG-16 VGG-19 ResNet-50 Inception-v3 Xception MobileNet Inception-ResNet v2 | Classifying medical image modalities | 62% (Accuracy) 98.18% (Accuracy) 90% (Accuracy) 99% (Accuracy) 98.36% (Accuracy) 98.73% (Accuracy) 98.18% (Accuracy) |
Publisher’s Note: MDPI stays neutral with regard to jurisdictional claims in published maps and institutional affiliations. |
© 2022 by the authors. Licensee MDPI, Basel, Switzerland. This article is an open access article distributed under the terms and conditions of the Creative Commons Attribution (CC BY) license (https://creativecommons.org/licenses/by/4.0/).
Share and Cite
Rashed, B.M.; Popescu, N. Critical Analysis of the Current Medical Image-Based Processing Techniques for Automatic Disease Evaluation: Systematic Literature Review. Sensors 2022, 22, 7065. https://doi.org/10.3390/s22187065
Rashed BM, Popescu N. Critical Analysis of the Current Medical Image-Based Processing Techniques for Automatic Disease Evaluation: Systematic Literature Review. Sensors. 2022; 22(18):7065. https://doi.org/10.3390/s22187065
Chicago/Turabian StyleRashed, Baidaa Mutasher, and Nirvana Popescu. 2022. "Critical Analysis of the Current Medical Image-Based Processing Techniques for Automatic Disease Evaluation: Systematic Literature Review" Sensors 22, no. 18: 7065. https://doi.org/10.3390/s22187065