1. Introduction
The measurement of hot gas characteristic parameters in complex environments—e.g., those involving high flow rates, vibration, or combustion—has posed a long-standing challenge to the study of aero-engines and industrial furnaces [
1]. In recent decades, there has been positive exploration concerning the non-contact assessment of combustion fields using spectral imaging technologies, including emission, absorption, Raman spectrum, and LIF/PLIF (laser induced fluorescence/planar laser induced fluorescence). Of all these methods, TDLAS (tunable diode laser absorption spectroscopy) has emerged an effective yet inexpensive technique providing a rapid response [
2].
TDLAS technology has undergone significant development attributable to the progress in semiconductor lasers. As a consequence, this technique is now widely used for the non-contact measurement of temperature, velocity, or species concentrations for environmental engineering, petroleum engineering, and hazardous chemicals detection. Additionally, when incorporating DFBs (distributed feedback lasers) and VCSELs (vertical cavity surface emitting lasers), a TDLAS system becomes more portable and easier to establish [
3,
4].
Early research regarding the application of TDLAS to the analysis of combustion was reported by Hanson and Allen et al. [
1,
5,
6,
7]. Characteristic parameters of hot gases in combustion flow fields involving high temperatures and pressures were assessed by TDLAS based on the absorption spectra of O
2 and H
2O. This method was then extended to the monitoring of waste gases such as NO
2 and NH
3 for the process control of industrial combustion systems. With the development of tunable diode laser sources, the useable wavelength range associated with this method was broadened to approximately 700–3300 nm, allowing the analysis of H
2O, CO, CO
2, CH
4, and other gases [
8,
9]. The data obtained from TDLAS have provided new perspectives concerning the monitoring of combustion processes [
10].
An effective component for flame measurement by TDLAS now well recognized is H
2O [
11,
12,
13]. The most important reason is that H
2O is commonly one of the primary combustion products and can reflect the progress of combustion based on the local thermodynamic equilibrium hypothesis. Although the measurement by gas molecular absorption spectra with TDLAS seems to be a proven technology, there are still significant deficiencies related to this technique. Specifically:
(1) Generally, a typical TDLAS analysis provides only the average value of a selected parameter along the optical path.
(2) Since it is challenging to generate a constant flow field with a given temperature, pressure, and velocity, the calibration of a TDLAS system is relatively difficult.
(3) H2O-based TDLAS measurement can also be disturbed by the presence of ambient water vapor, leading to underestimations of temperature and overestimations of component concentrations.
(4) The Doppler effect can interfere with TDLAS velocity measurements in high-speed flow fields.
The aim of the study is to develop a portable TDLAS system for combustion analysis and to provide an associated means of calibrating this system. In this paper, a TDLAS system was designed and applied to the assessments of gas flow and CH4/air co-flow flame including temperature and velocity measurements. A static flow field vessel and a shock tube were employed to generate a steady flow field along with specific constant temperature or velocity for precise calibration. The measurement results obtained from this system were verified. Finally, experimental investigation of the CH4/air flame was conducted to test the effectiveness of the new TDLAS system in combustion diagnosis.
2. Experimental Methodology
2.1. Absorption Fundamentals
The principle of TDLAS measurement is on the basis of the Beer–Lambert law, depicting the relationship of incident light, transmitted light, molecule temperature, and concentration [
14] as
where
and
are the transmitted light intensity and incident light intensity, respectively, which are corresponding to the output frequency of laser,
.
is the absorptivity of absorbing species
i# and
is the path length. Moreover for
,
, and
are the partial pressure and absorption line shape function of species
i#, such as Gaussian, Lorentzian, or Voigt line profile (
is the center frequency of the absorption spectrum) [
15]. In addition,
, as a function of temperature, is the molecular absorption line strength of species
i#. Consequently, integrated absorbance of independent transition line can be obtained as
Based on the theory of molecular spectroscopy [
16], the absorption line strength at temperature
T can be expressed as
where
is a reference temperature.
,
,
and
are four constant numbers, including the dielectric constant, Planck’s constant, speed of light and Boltzmann’s constant, respectively.
is the energy of the lower transition state, and
is the molecular internal partition function at temperature
T, which could be obtained from the HITRAN database [
17,
18]. These relationships enable the non-invasive experimental analysis of hot gases.
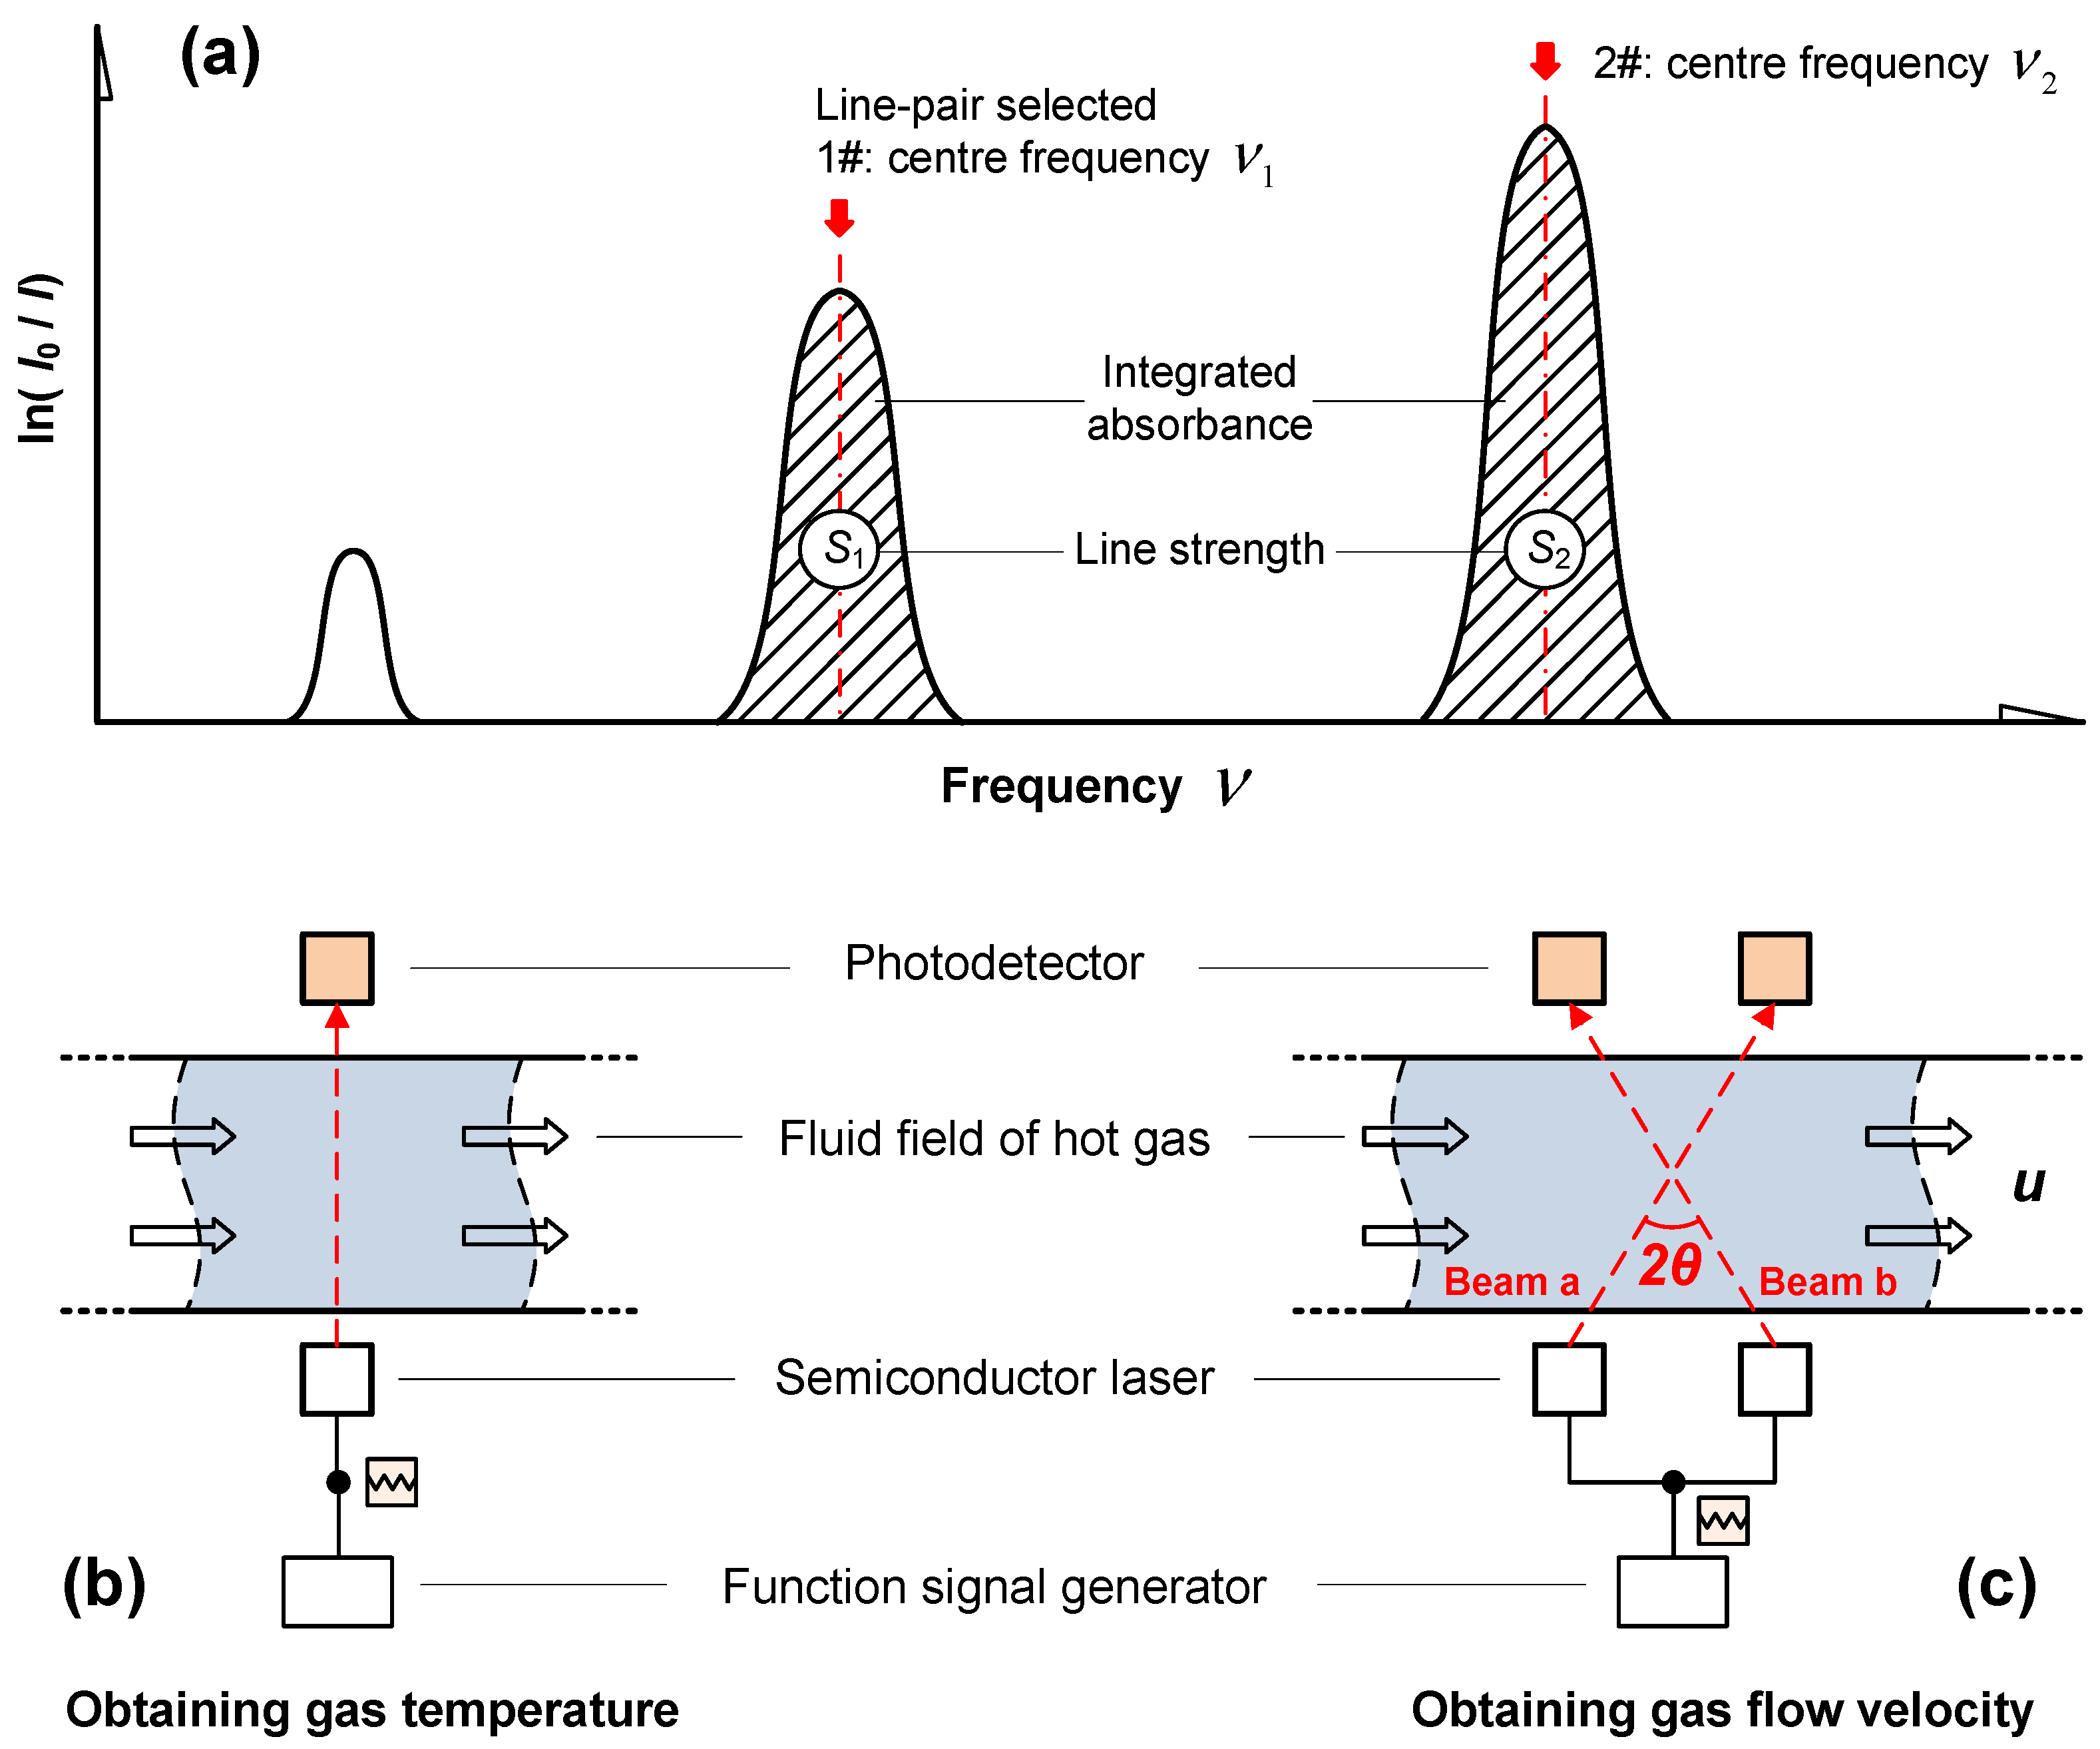
2.2. Measuring Principle of Gas Temperature and Velocity
The absorption line shape, bandwidth and intensity of absorption spectral features can be obtained using a TDLAS system together with wavelength-scanning. Furthermore, the gas temperature can be calculated from the ratio,
R (the integrated absorbances of two transition [
7]), as
where subscripts 1 and 2 denote the two absorption transitions selected as shown in
Figure 1a.
is the energy separation of the absorbing states. Based on the use of a near-IR laser (
Figure 1b), the gas temperature can then be obtained from the relationship [
19]
On the other hand, the gas flow velocity can be calculated according to Doppler-shift as shown in
Figure 1c [
20]. Assuming that a monochromatic laser beam with a frequency
(the same as the center frequency of the absorption spectrum) is used here, the Doppler-shifted center frequencies for laser beams a and b would change into
Considering that
, the flow velocity relationship can be simplified to
2.3. The Experimental TDLAS System
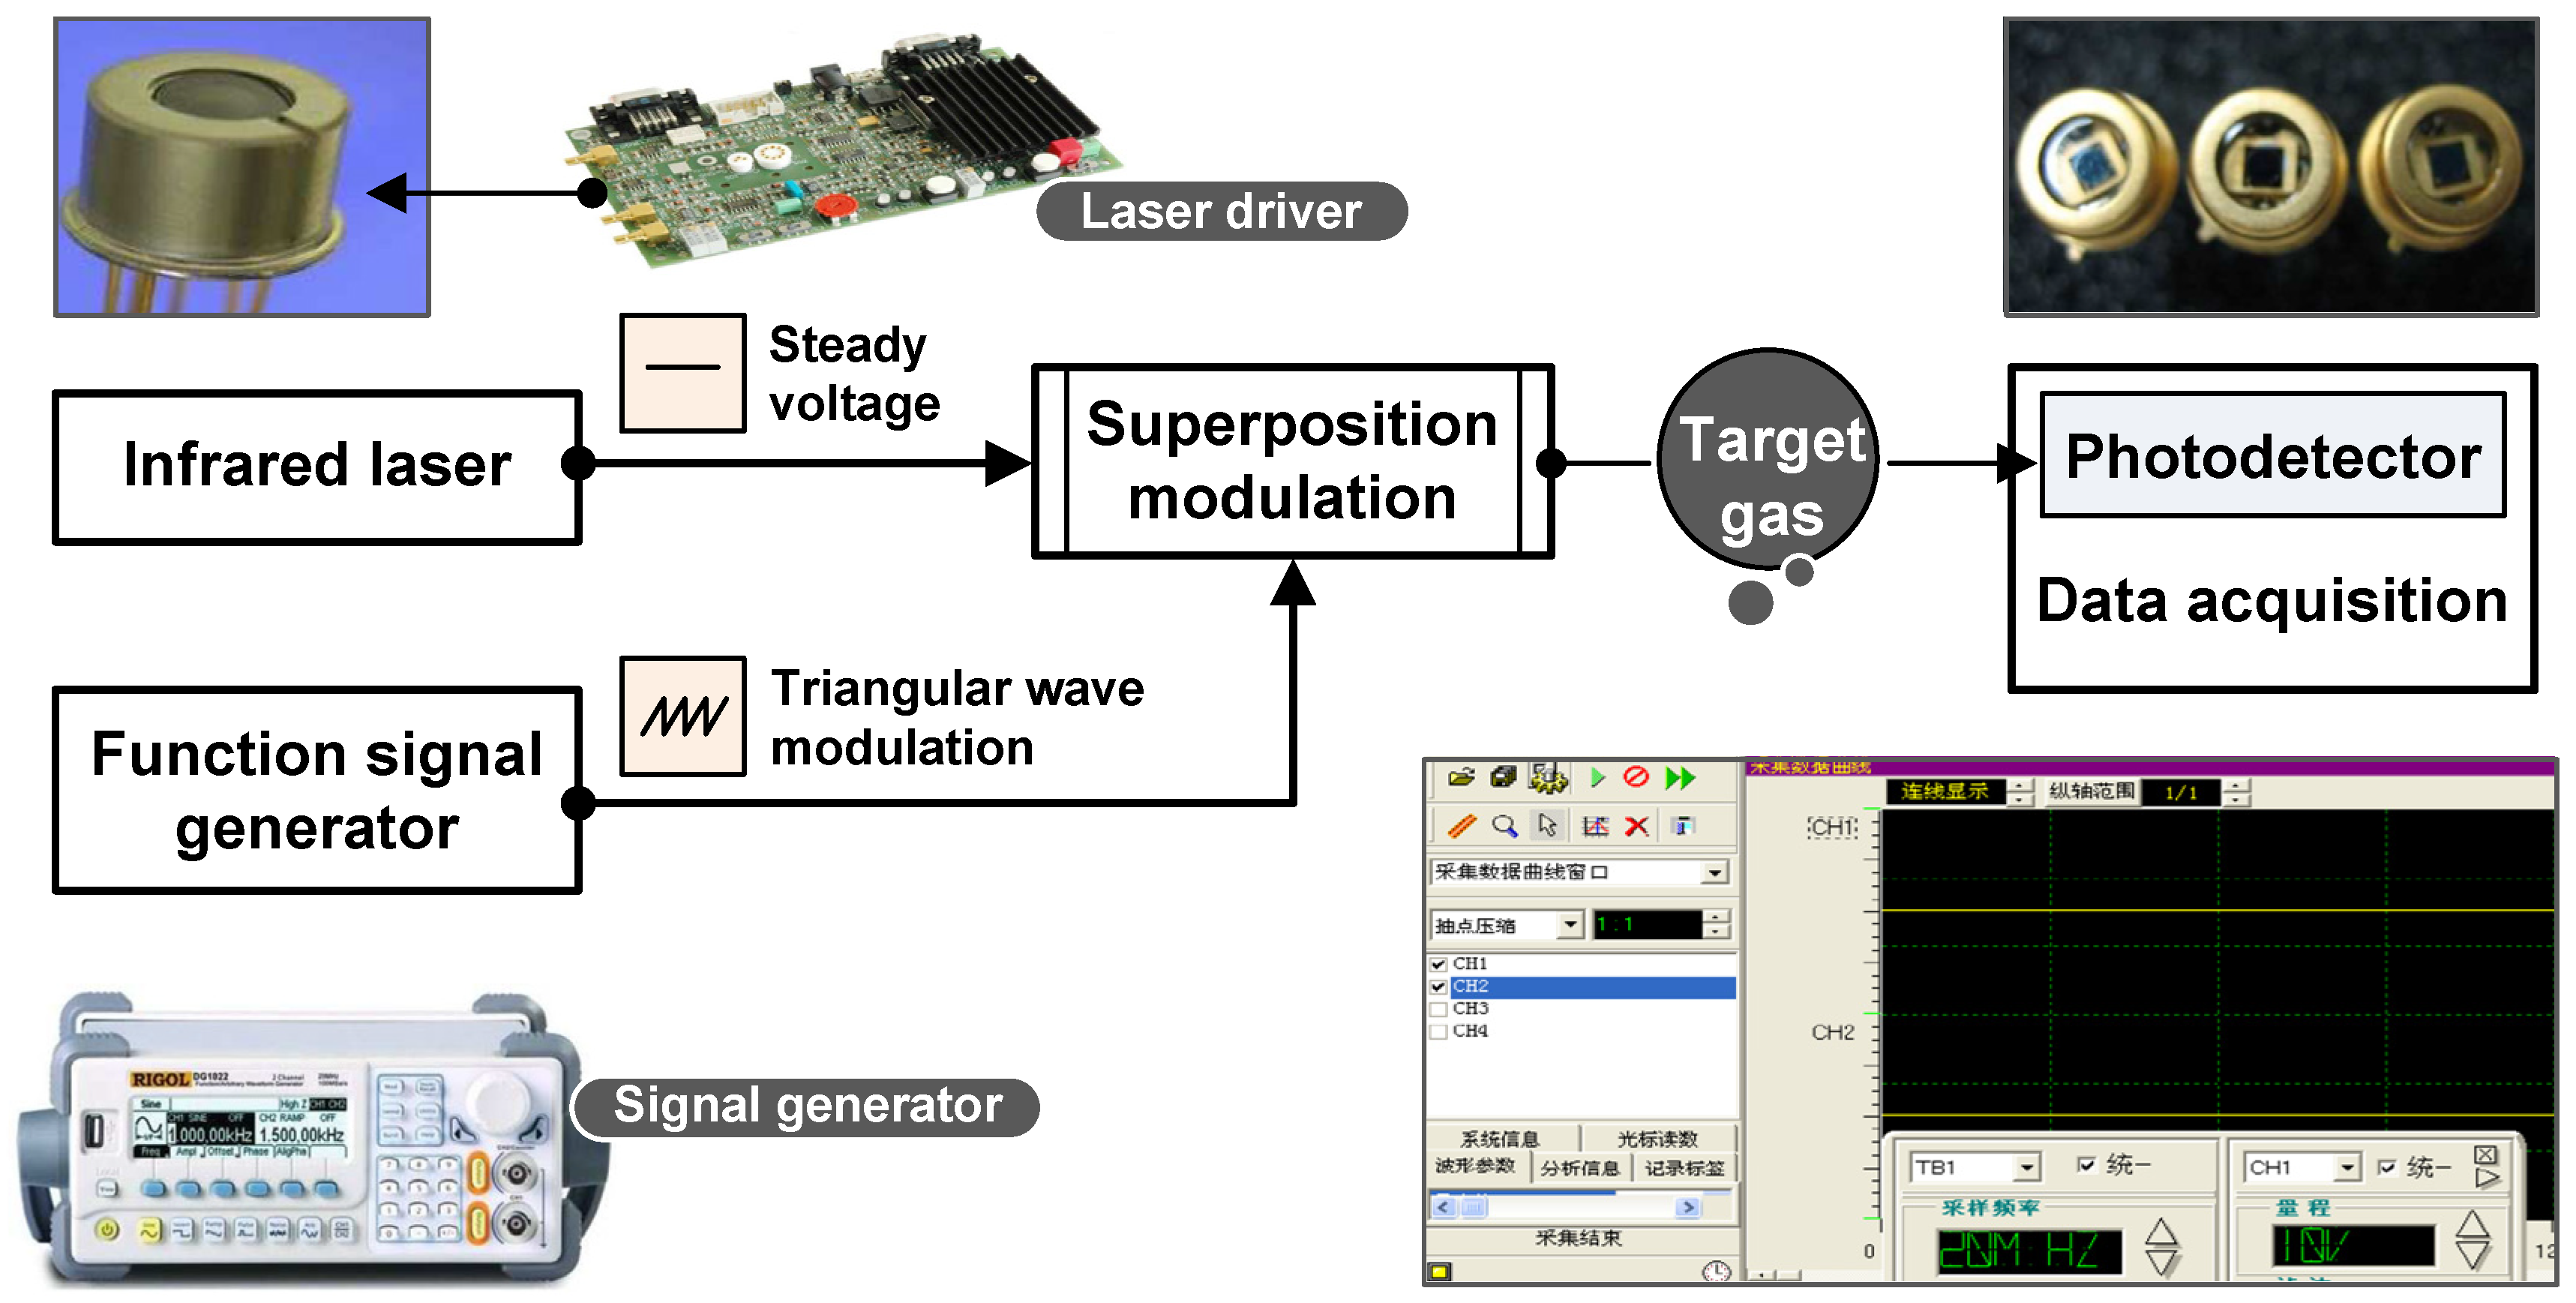
The TDLAS system designed in this work mainly comprised an infrared laser, modulation unit, optical path, photodetectors, and high-speed data acquisition and processing module, as shown in
Figure 2. An OEM VCSEL driver (VITC002 from Thorlabs, Newton, NJ, USA) with a temperature controller was applied for laser modulation. The functional parameters of the laser (VCSEL from Vertilas, München, Germany) and function signal generator (DG-1022 from Rigol, Beijing, China) are listed in
Table 1.
Because of the advantages provided by analyzing water vapor, H2O-based TDLAS measurement assessments were used in this study but with more accurate experimental validation and a specially designed optical path intended for the monitoring of combustion processes. Water will produce intense absorbance bands in the near-IR region 1400, 1800, and 2700 [
16,
21]; and to avoid any interference by other species (such as C-H radical), 1392 nm was selected as the center wavelength for water vapor detection. Photodetectors (PN-2000 from Lightsensing Technologies, Beijing, China) with a response range of 900–1650 nm were used to determine the transmitted light intensity. Data were obtained using a data acquisition card (PCI-20612 from TDEC, Sichuan, China) with four channels, operating at 32 bits and a maximum rate of 50 MSa/s.
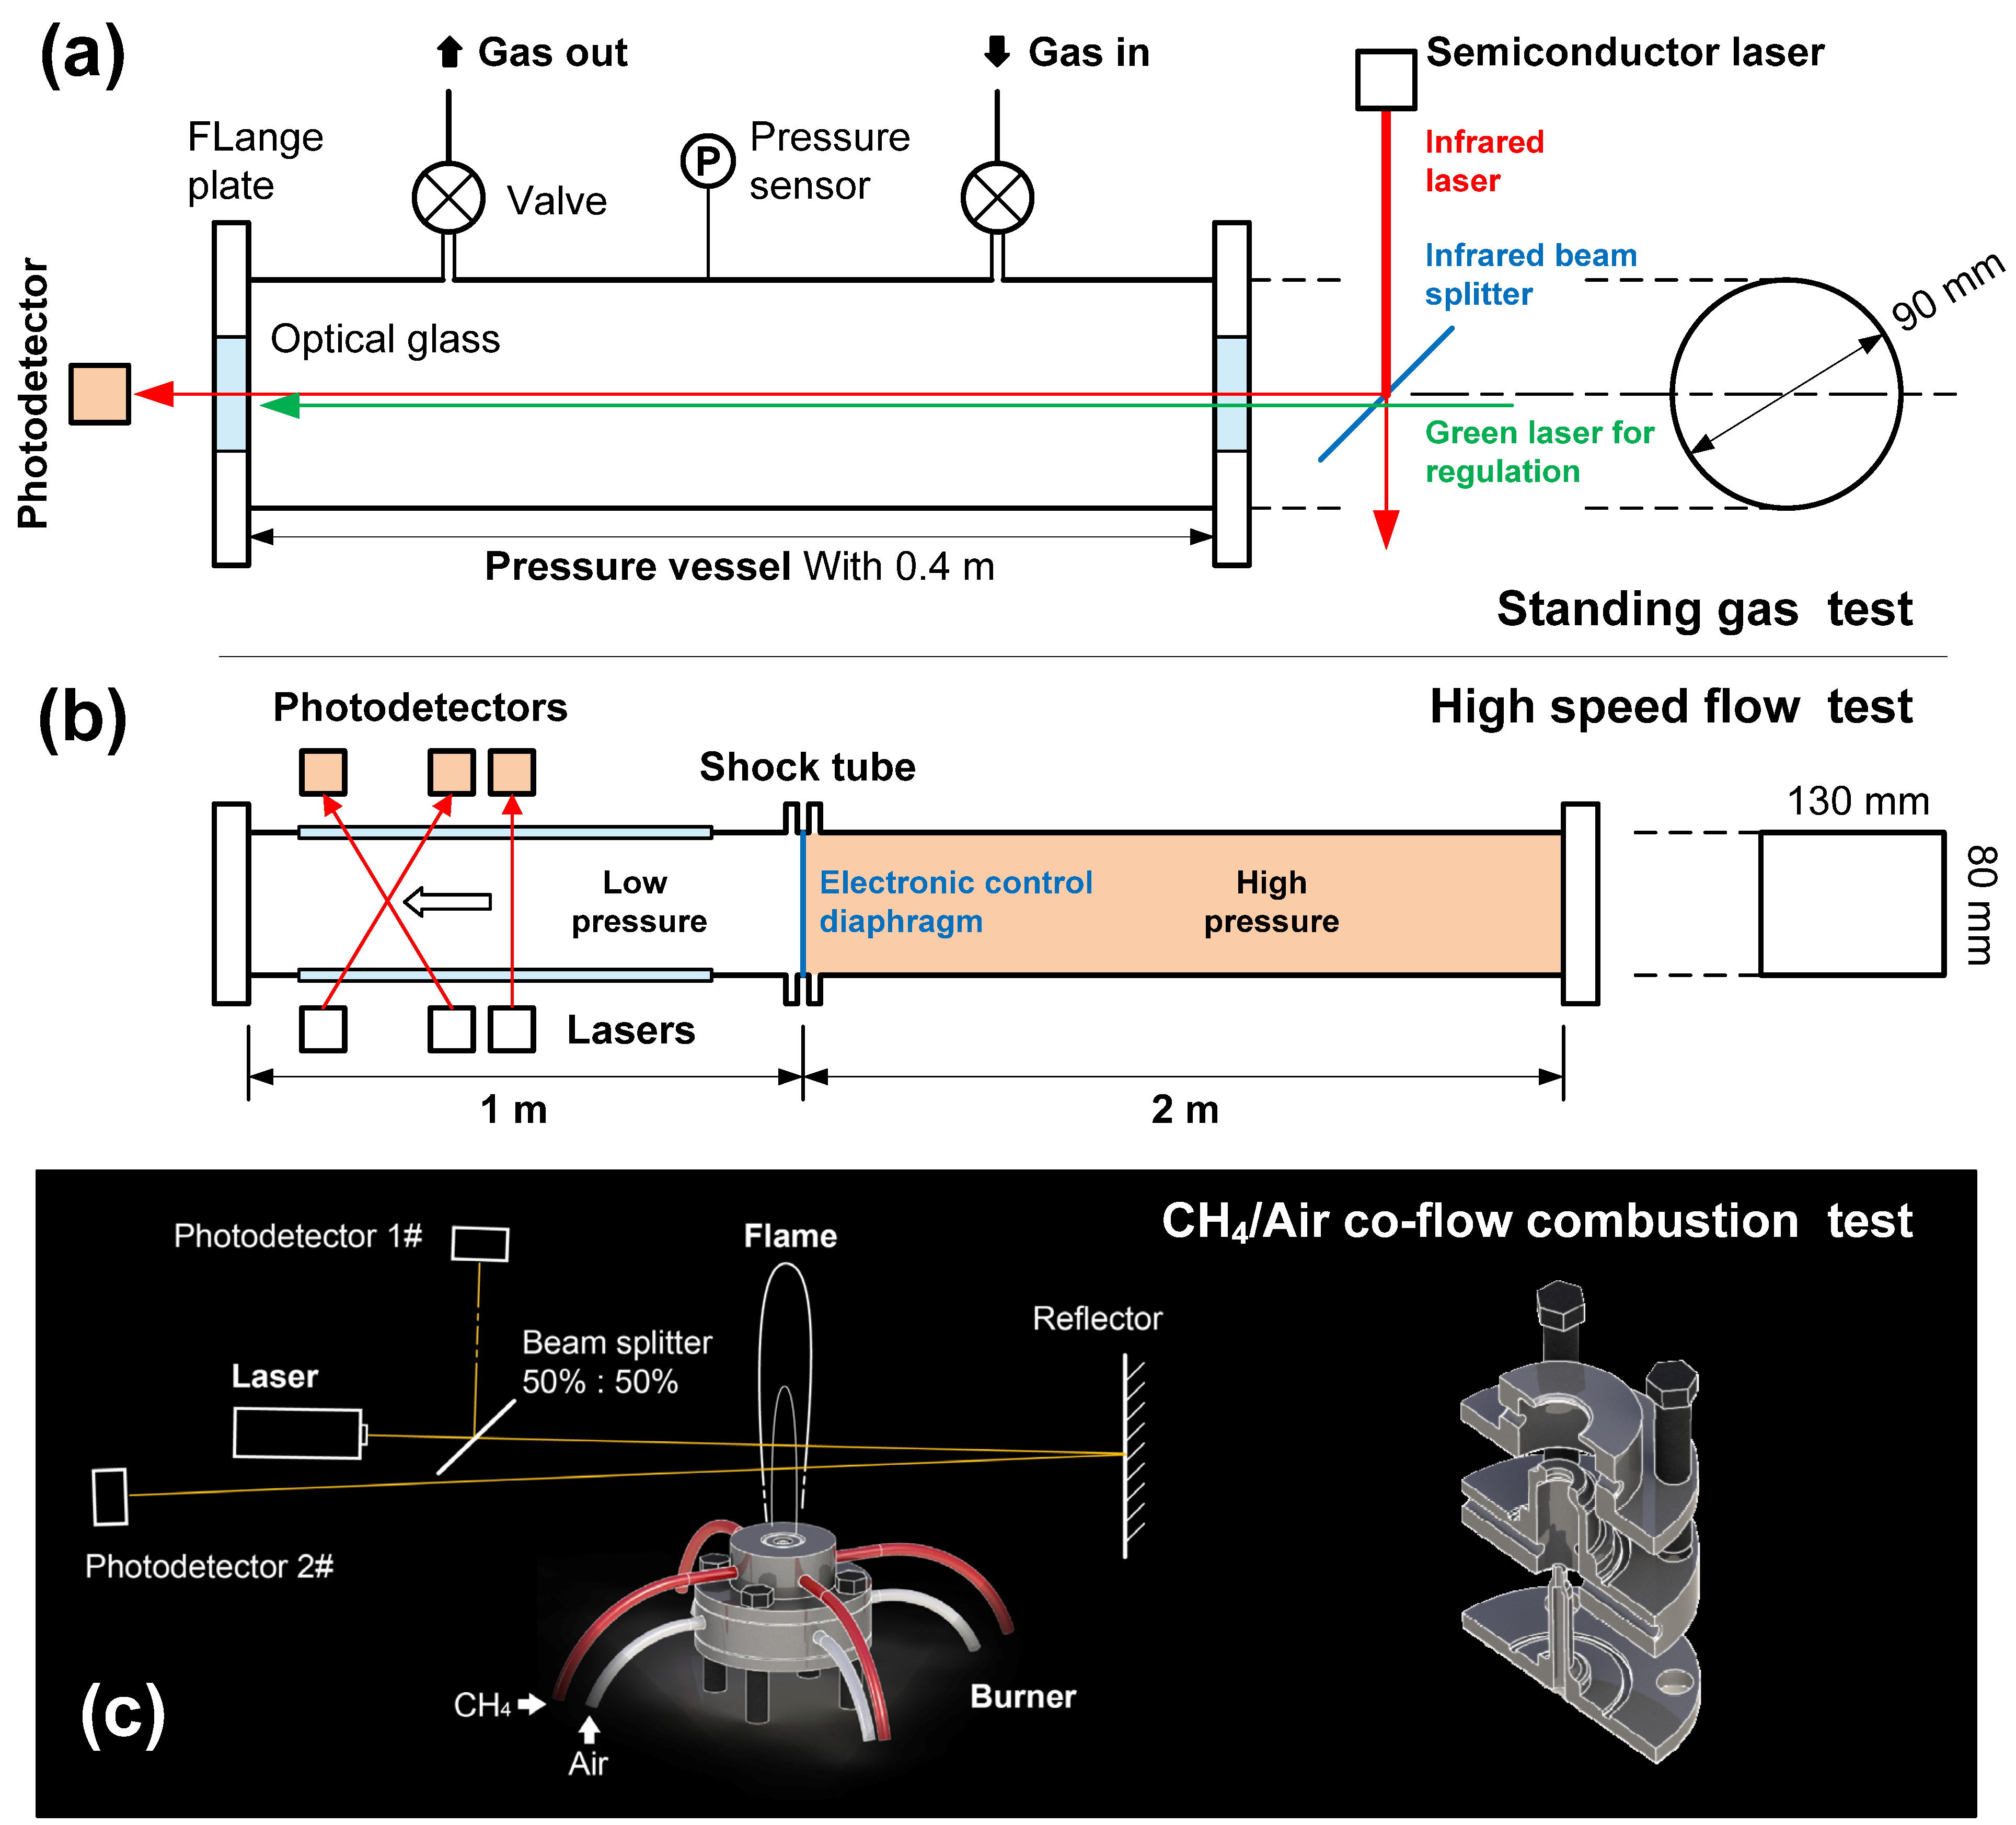
2.4. Experimental Design for Validation
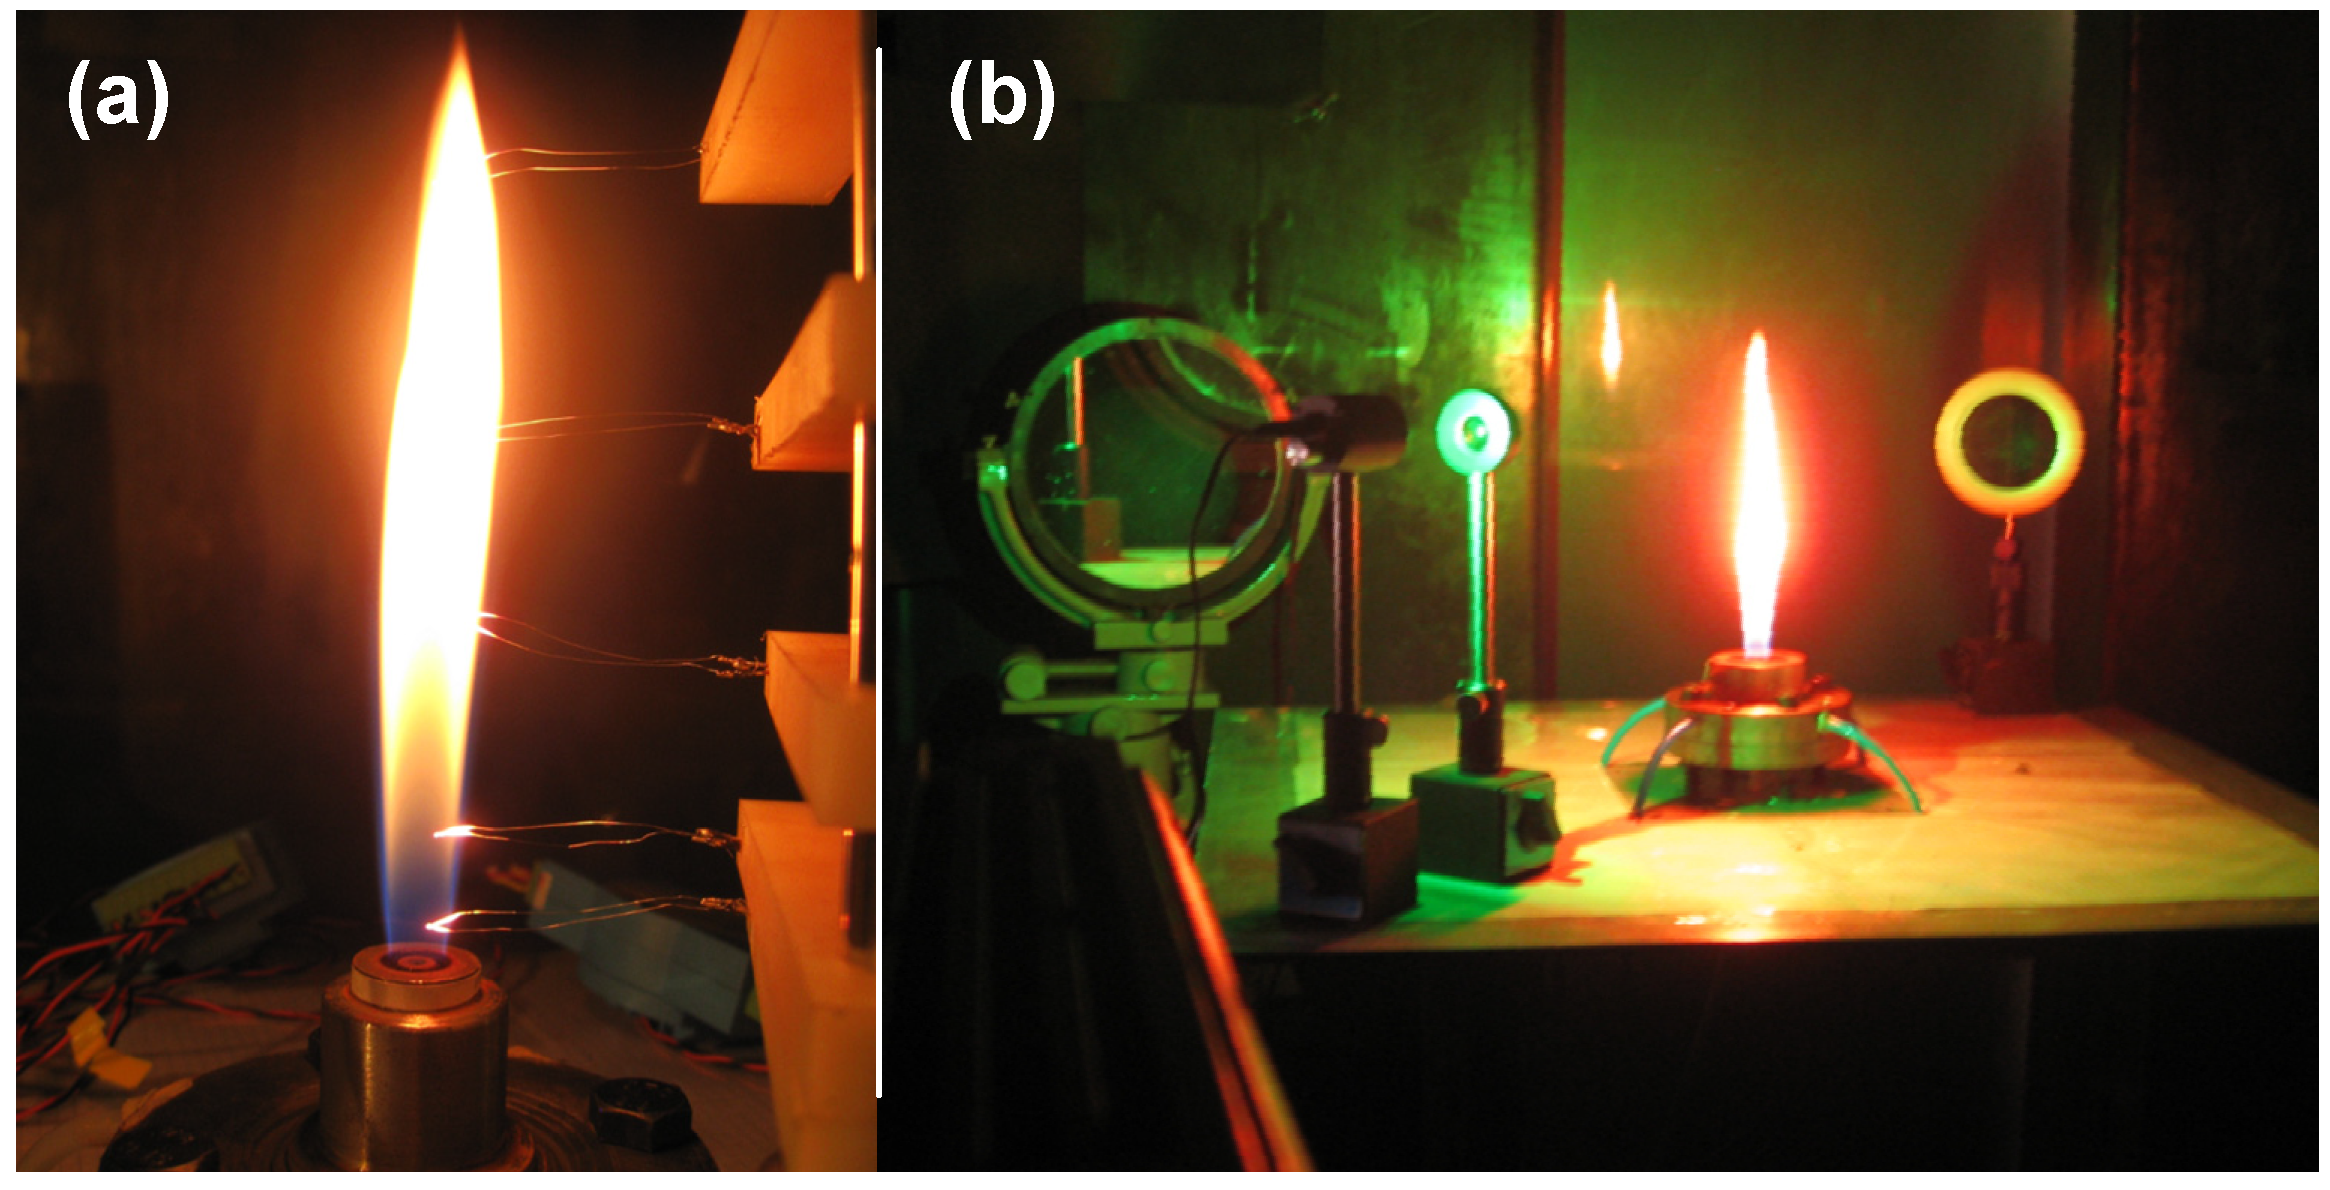
The functioning of the TDLAS system was calibrated or examined in three ways, as shown in
Figure 3, using a pressure vessel, a shock tube, and a co-flow combustion platform.
(1) Firstly, normal pressure and temperature were applied to the pressure vessel (
Figure 3a) with standing air to calibrate the basic performance of the system. This vessel was made of stainless steel with optical glasses on both sides. The optical path in this device had a maximum length of 0.4 m and a 532 nm green laser was employed to adjust the path.
(2) Secondly, the shock tube was intended to provide determinable high-temperature and high-speed water vapor flow to permit the precision and response rate of the measurement system to be ascertained. As shown in
Figure 3b, the shock tube was comprised a high-pressure section, a low-pressure section, a gas circuit, and an electronically controlled diaphragm. Prior to each test, the low-pressure section was charged with air to a preset pressure. Following this, the high-pressure section was also slowly filled with air until the diaphragm instantaneously ruptured to create a shock wave, thus producing a high-temperature/pressure, high-speed flow field.
(3) Finally, the calibrated TDLAS system was used for the CH
4/Air flame temperature and hot gas velocity measurements, as shown in
Figure 3c. A co-flow CH
4/air burner was made to generate a stable diffusion flame with preset initial conditions [
22,
23]. High precision mass flowmeters (KM7100 from Alicat, Tucson, AZ, USA) were used to dispense the combustible gases. To avoid the disturbance by H
2O absorption in the non-flame zone (i.e., a background signal resulting from atmospheric H
2O), a beam splitter (50%:50%) was used to subtract the background interference. As noted, the flame width (absorption length about 2–3 cm) was relatively short, thus a reflector was added to obtain a stronger absorption signal.
The experimental conditions are summarized in
Table 2. All the tests were repeated 20 times to ensure reproducible results.
3. Results and Analysis
3.1. Room Temperature Measurement by TDLAS
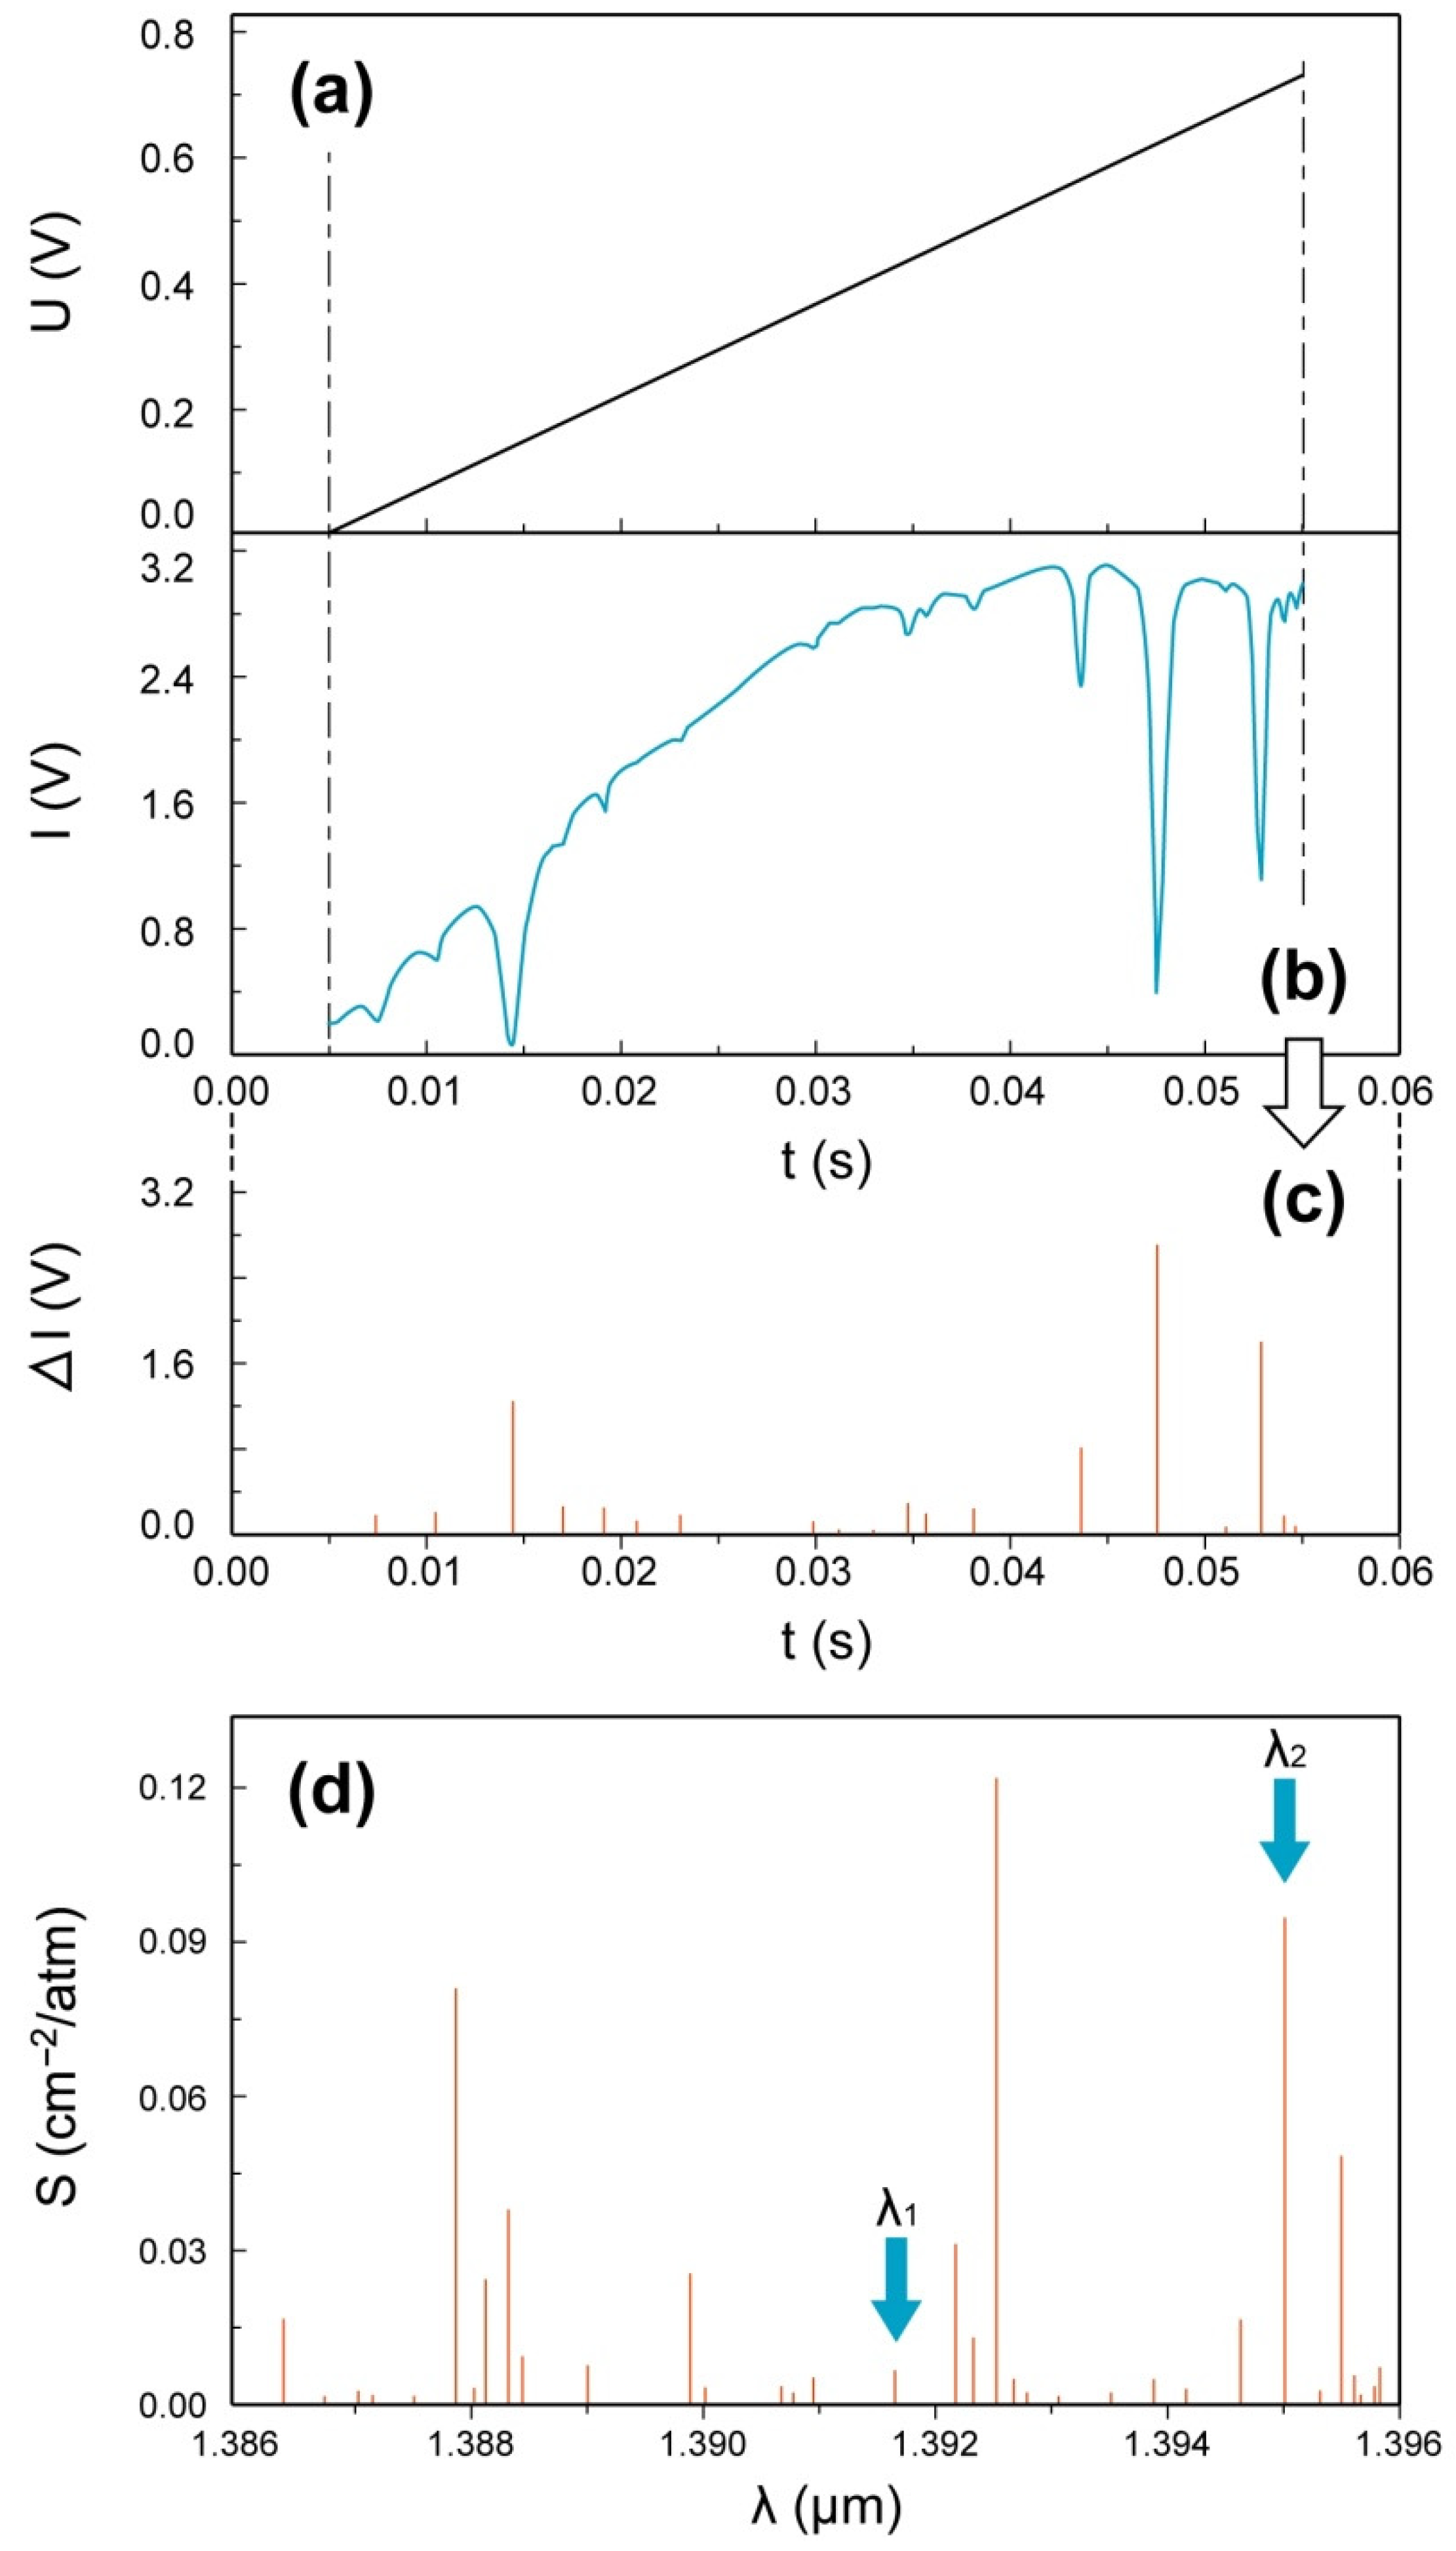
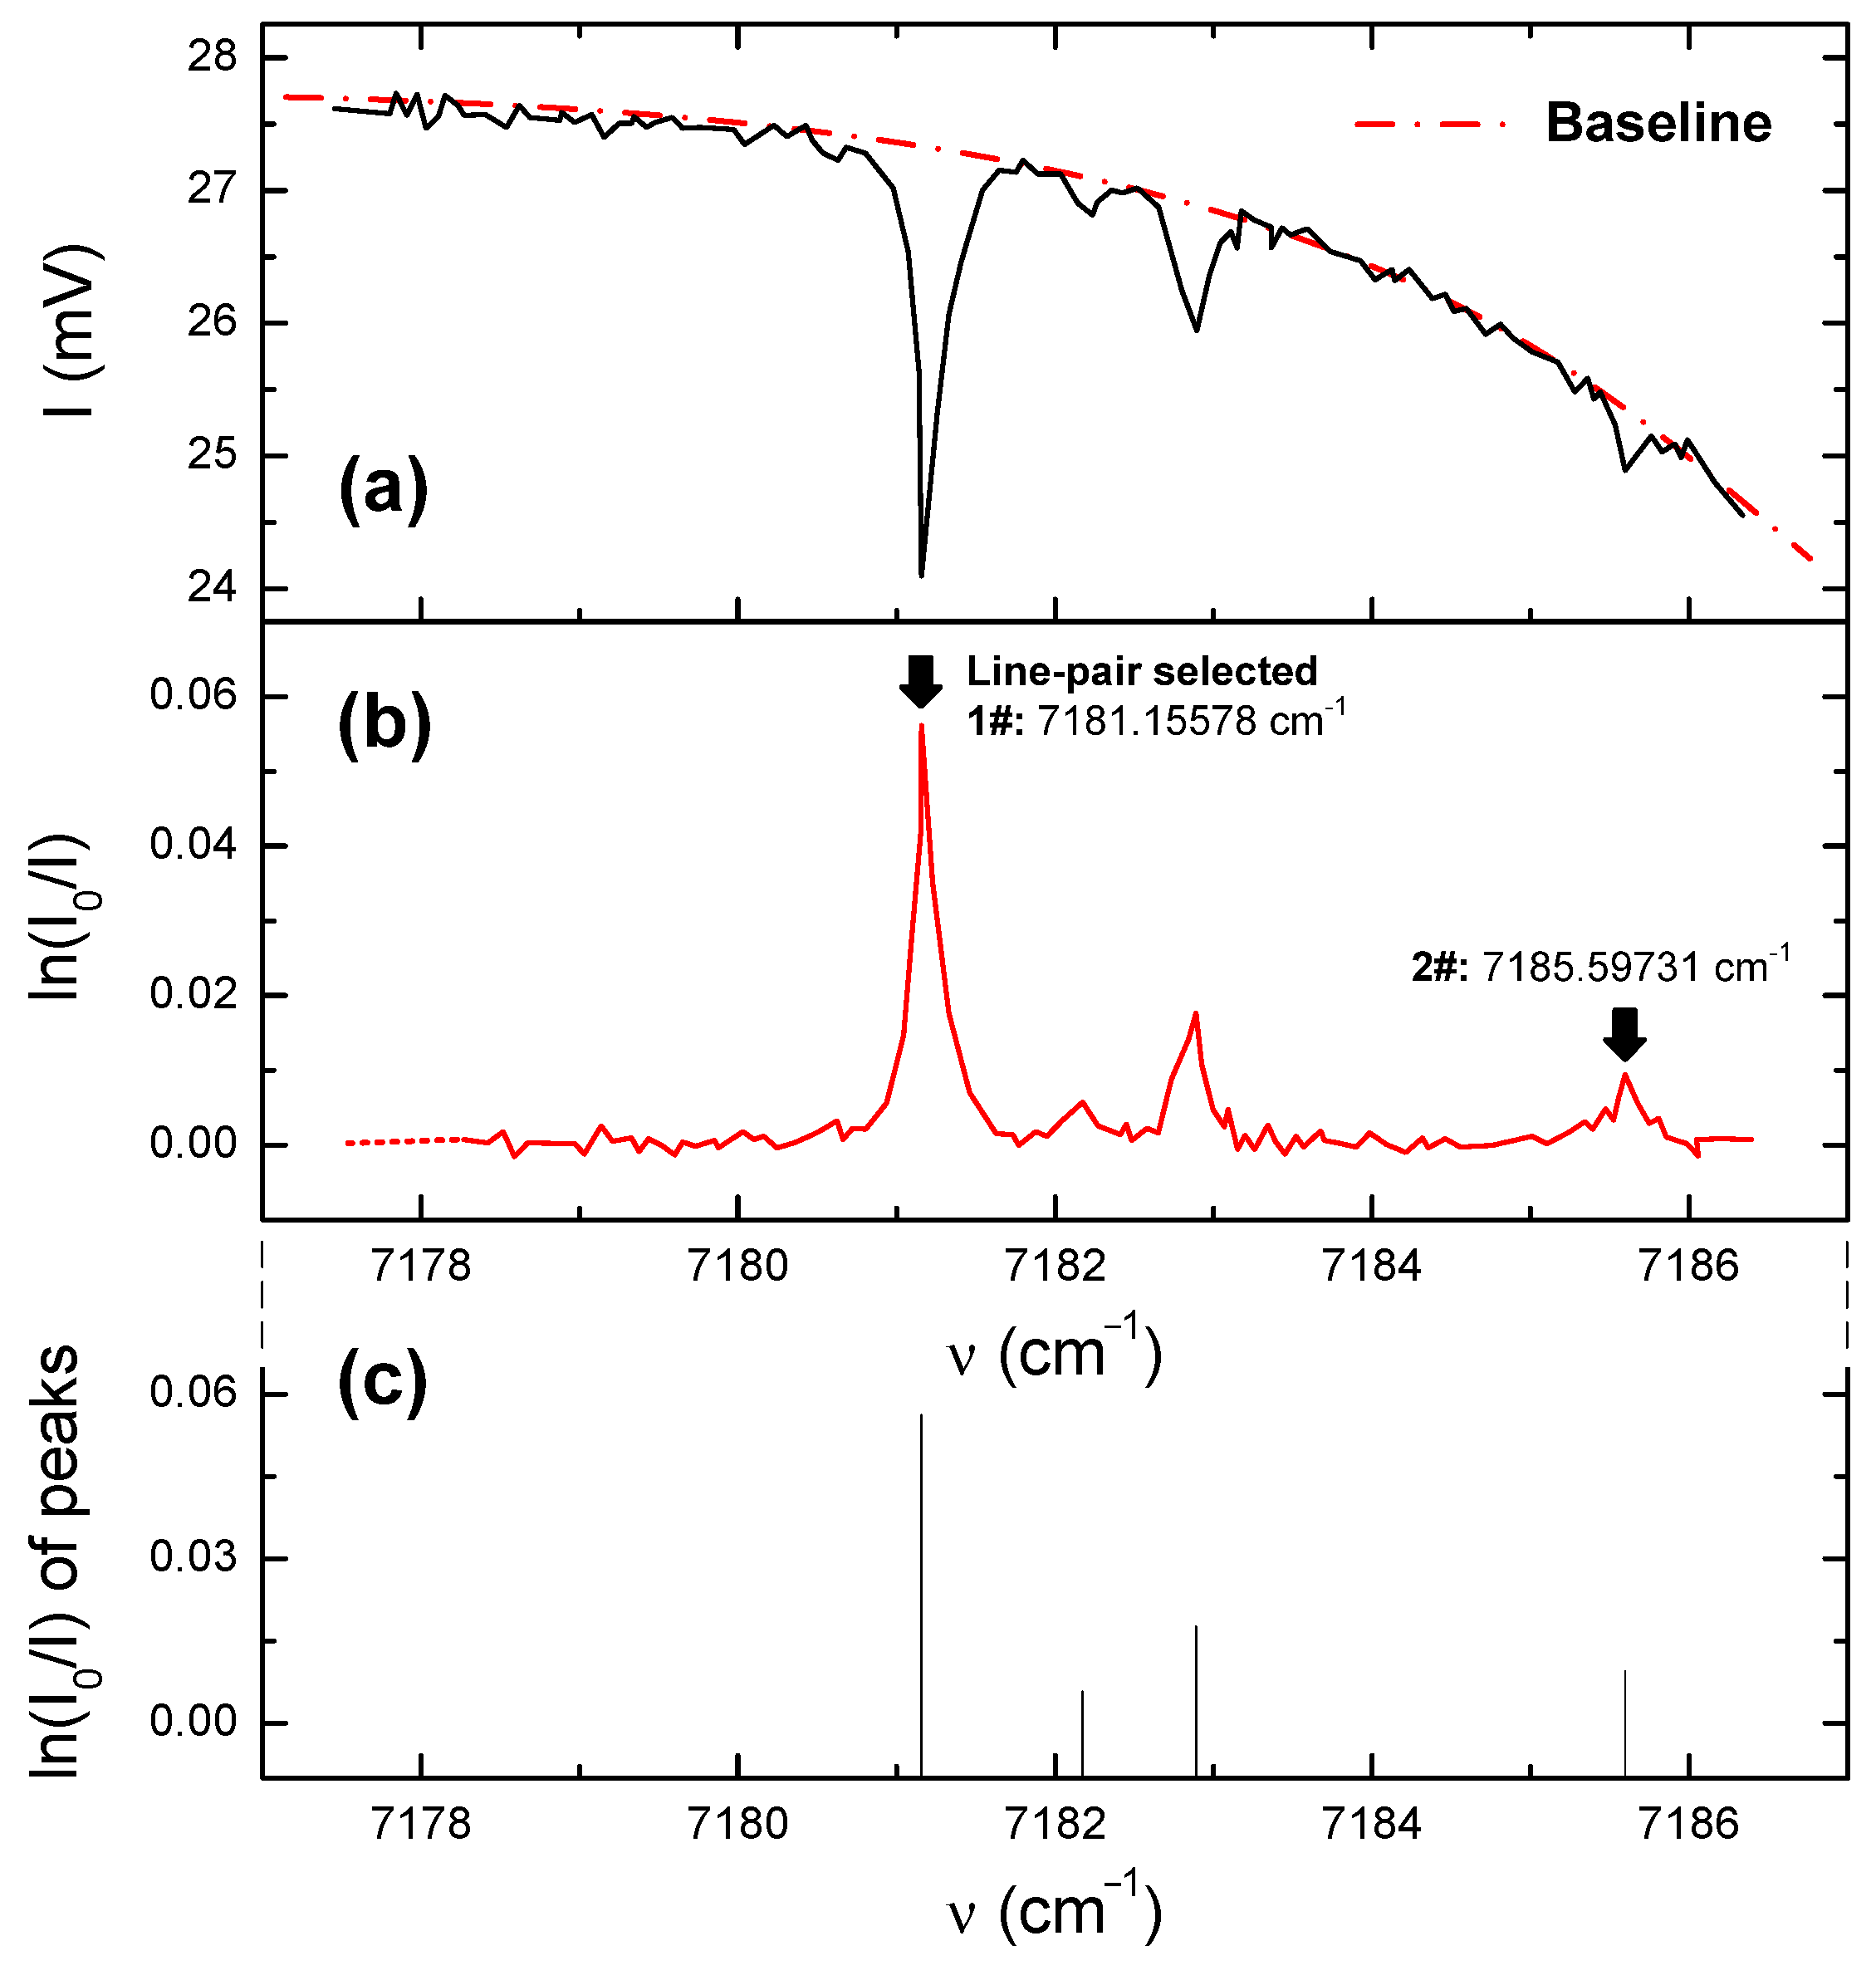
Absorption spectra of the contents of the pressure vessel (see
Figure 3a) could be obtained on the basis of comparisons between the laser output and absorption line strength using the HITRAN [
17] data, as shown in
Figure 4 with an example at initial pressure of 1 atm.
Figure 4a shows the voltage
U variation of function signal generator output used for driving laser during a half cycle, and
Figure 4b presents the transmitted light intensity after absorption. Furthermore, clear positions and strengths of absorption peaks could be found in
Figure 4c. The line strength of water vapor vs. wavelength is plotted in
Figure 4d with independent absorption line.
To calculate the vapor temperature, the time-domain of transmitted light intensity (
I vs.
t) should be transformed to frequency-domain (that is,
I vs.
or
I vs.
) at first. Based on the approximately linear relationship between
and
U, two reference wavelength-time points were selected: (
,
) and (
,
). Then we obtained
This simplified linear fitting was considered a reasonable approximation over short time spans. Note that vs. t would not be a continuous function, due to the discreteness of . Furthermore, the wavelengths that were selected for these calculations ( and ) should be a certain distance apart to reduce the error caused by uncertainties in determining the positions of the absorption peaks. Hence, = 1391.67275 nm and = 1395.00424 nm were selected in the present work for the purpose of wavelength calibration.
Consequently, as
, the correlation between
I and
could be obtained by combining Equation (10) with the data in
Figure 4, as shown in
Figure 5a. The baseline in
Figure 5a was fitted by using the polynomial
and employing data within the non-absorption region. The curve of
vs.
, as the key relation for temperature calculation deduced in Equations (4) and (5), could be further illustrated in
Figure 5b,c.
It is necessary to take into account that the line-pair selection had to meet certain conditions, meaning that there was no interference by other spectral lines and these lines were positioned near the central wavelength of the laser. Furthermore, the lines had to be separated by a suitable distance to avoid overlap. Therefore, we chose
= 7181.15578 cm
−1 and
= 7185.59731 cm
−1 under overall consideration. Other important parameters related to the HITRAN database [
17] are provided in
Table 3. Combining Equations (4) and (5) provide
= 302 ± 1.4 K, and this value—compared with the average experimental value of 301.14 ± 0.8 K by the thermocouples—provides a measurement error of less than 0.3%.
The pressure effects on measurement accuracy were investigated subsequently. The results showed that, with the enlarged initial test pressure, pressure broadening occurred generally and became dominant due to the increasing frequency of molecular collisions. In addition, spectral interference resulting from line overlap became evident at pressures exceeding 0.8 MPa. It should be noted that the measurement errors related to temperature and concentration could be larger than 10% at pressures above 1 MPa.
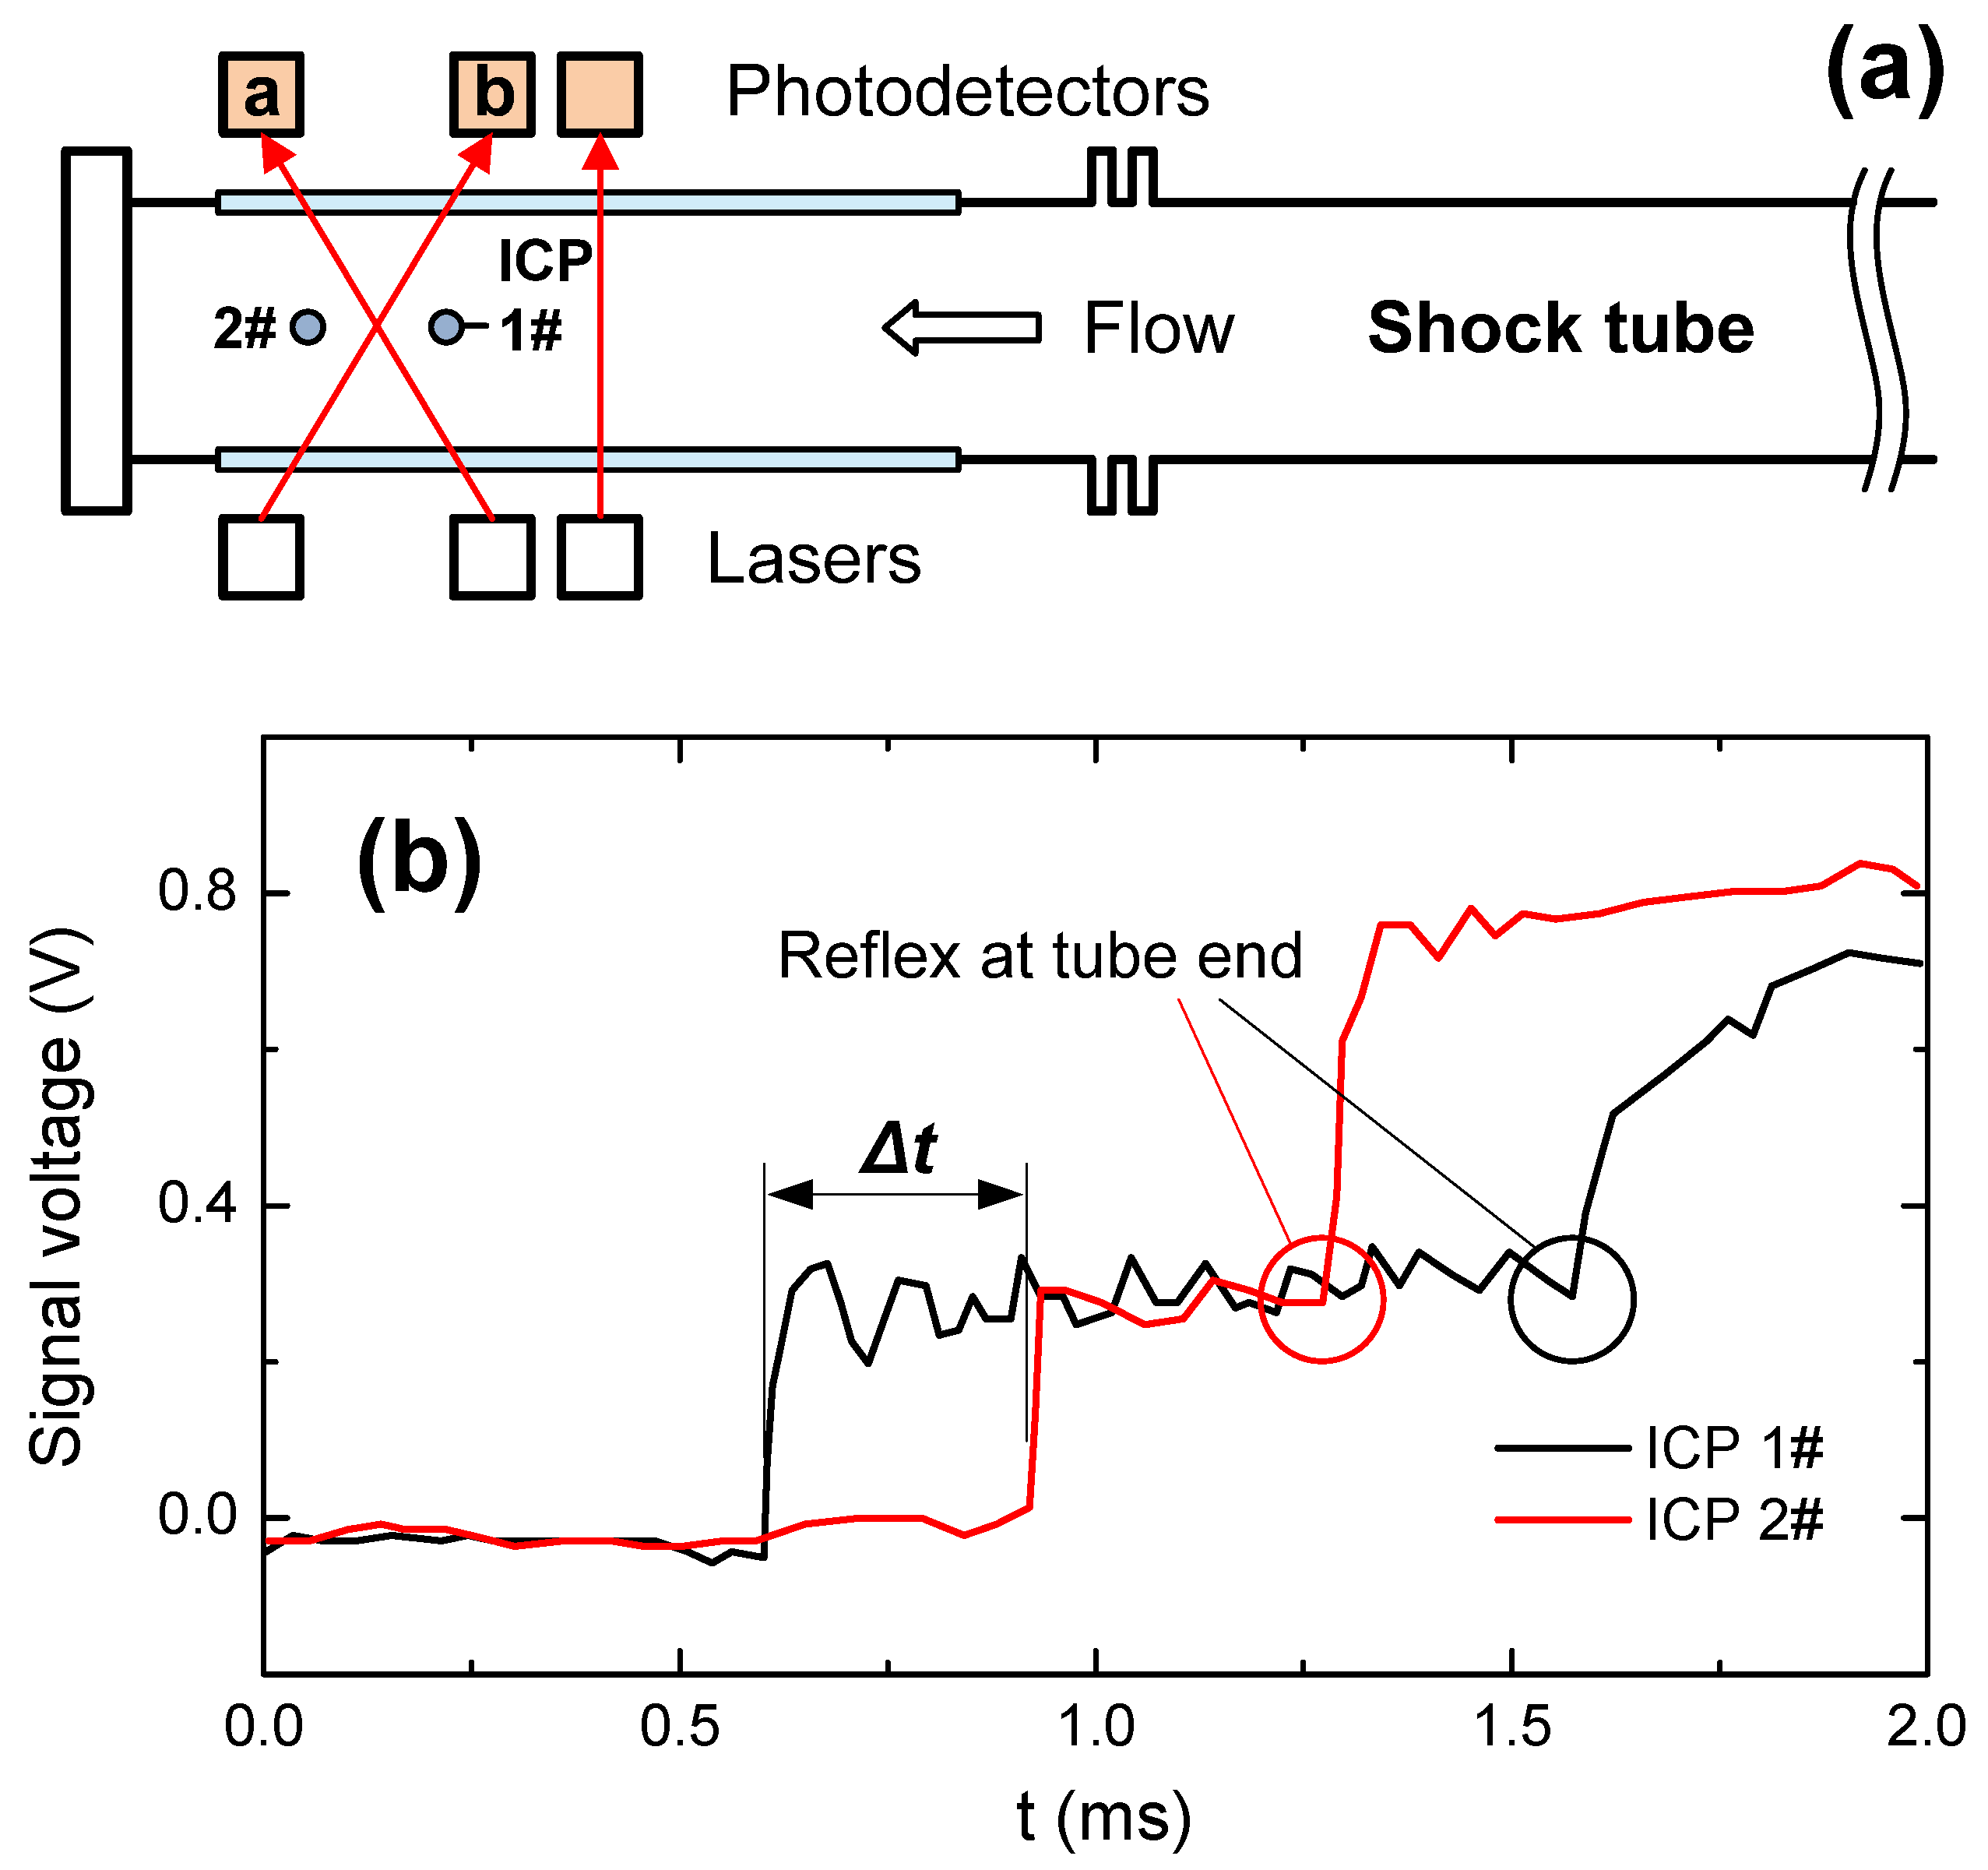
3.2. Velocity of High Speed Air Flow in Shock Tube
As shown in
Figure 3b, a uniform and controllable air flow field could be generated in the shock tube. The velocity values measured by the TDLAS system were compared with those by both ICP (integrated circuits piezoelectric) shock wave pressure sensors (102B15 from Dibeiqi Electronic Technology, China) and theoretical calculations. Two ICP sensors with a distance of 120 mm were mounted along the tube as shown in
Figure 6a, and typical results were plotted in
Figure 6b. The shock wave velocity was determined from these data as
Based on assuming isentropic flow, the flow velocity could be simplified as
where
M is the Mach number of the shock wave determined by
in Equation (11) and sound velocity,
is the adiabatic exponent, and
Rgas is the universal gas constant.
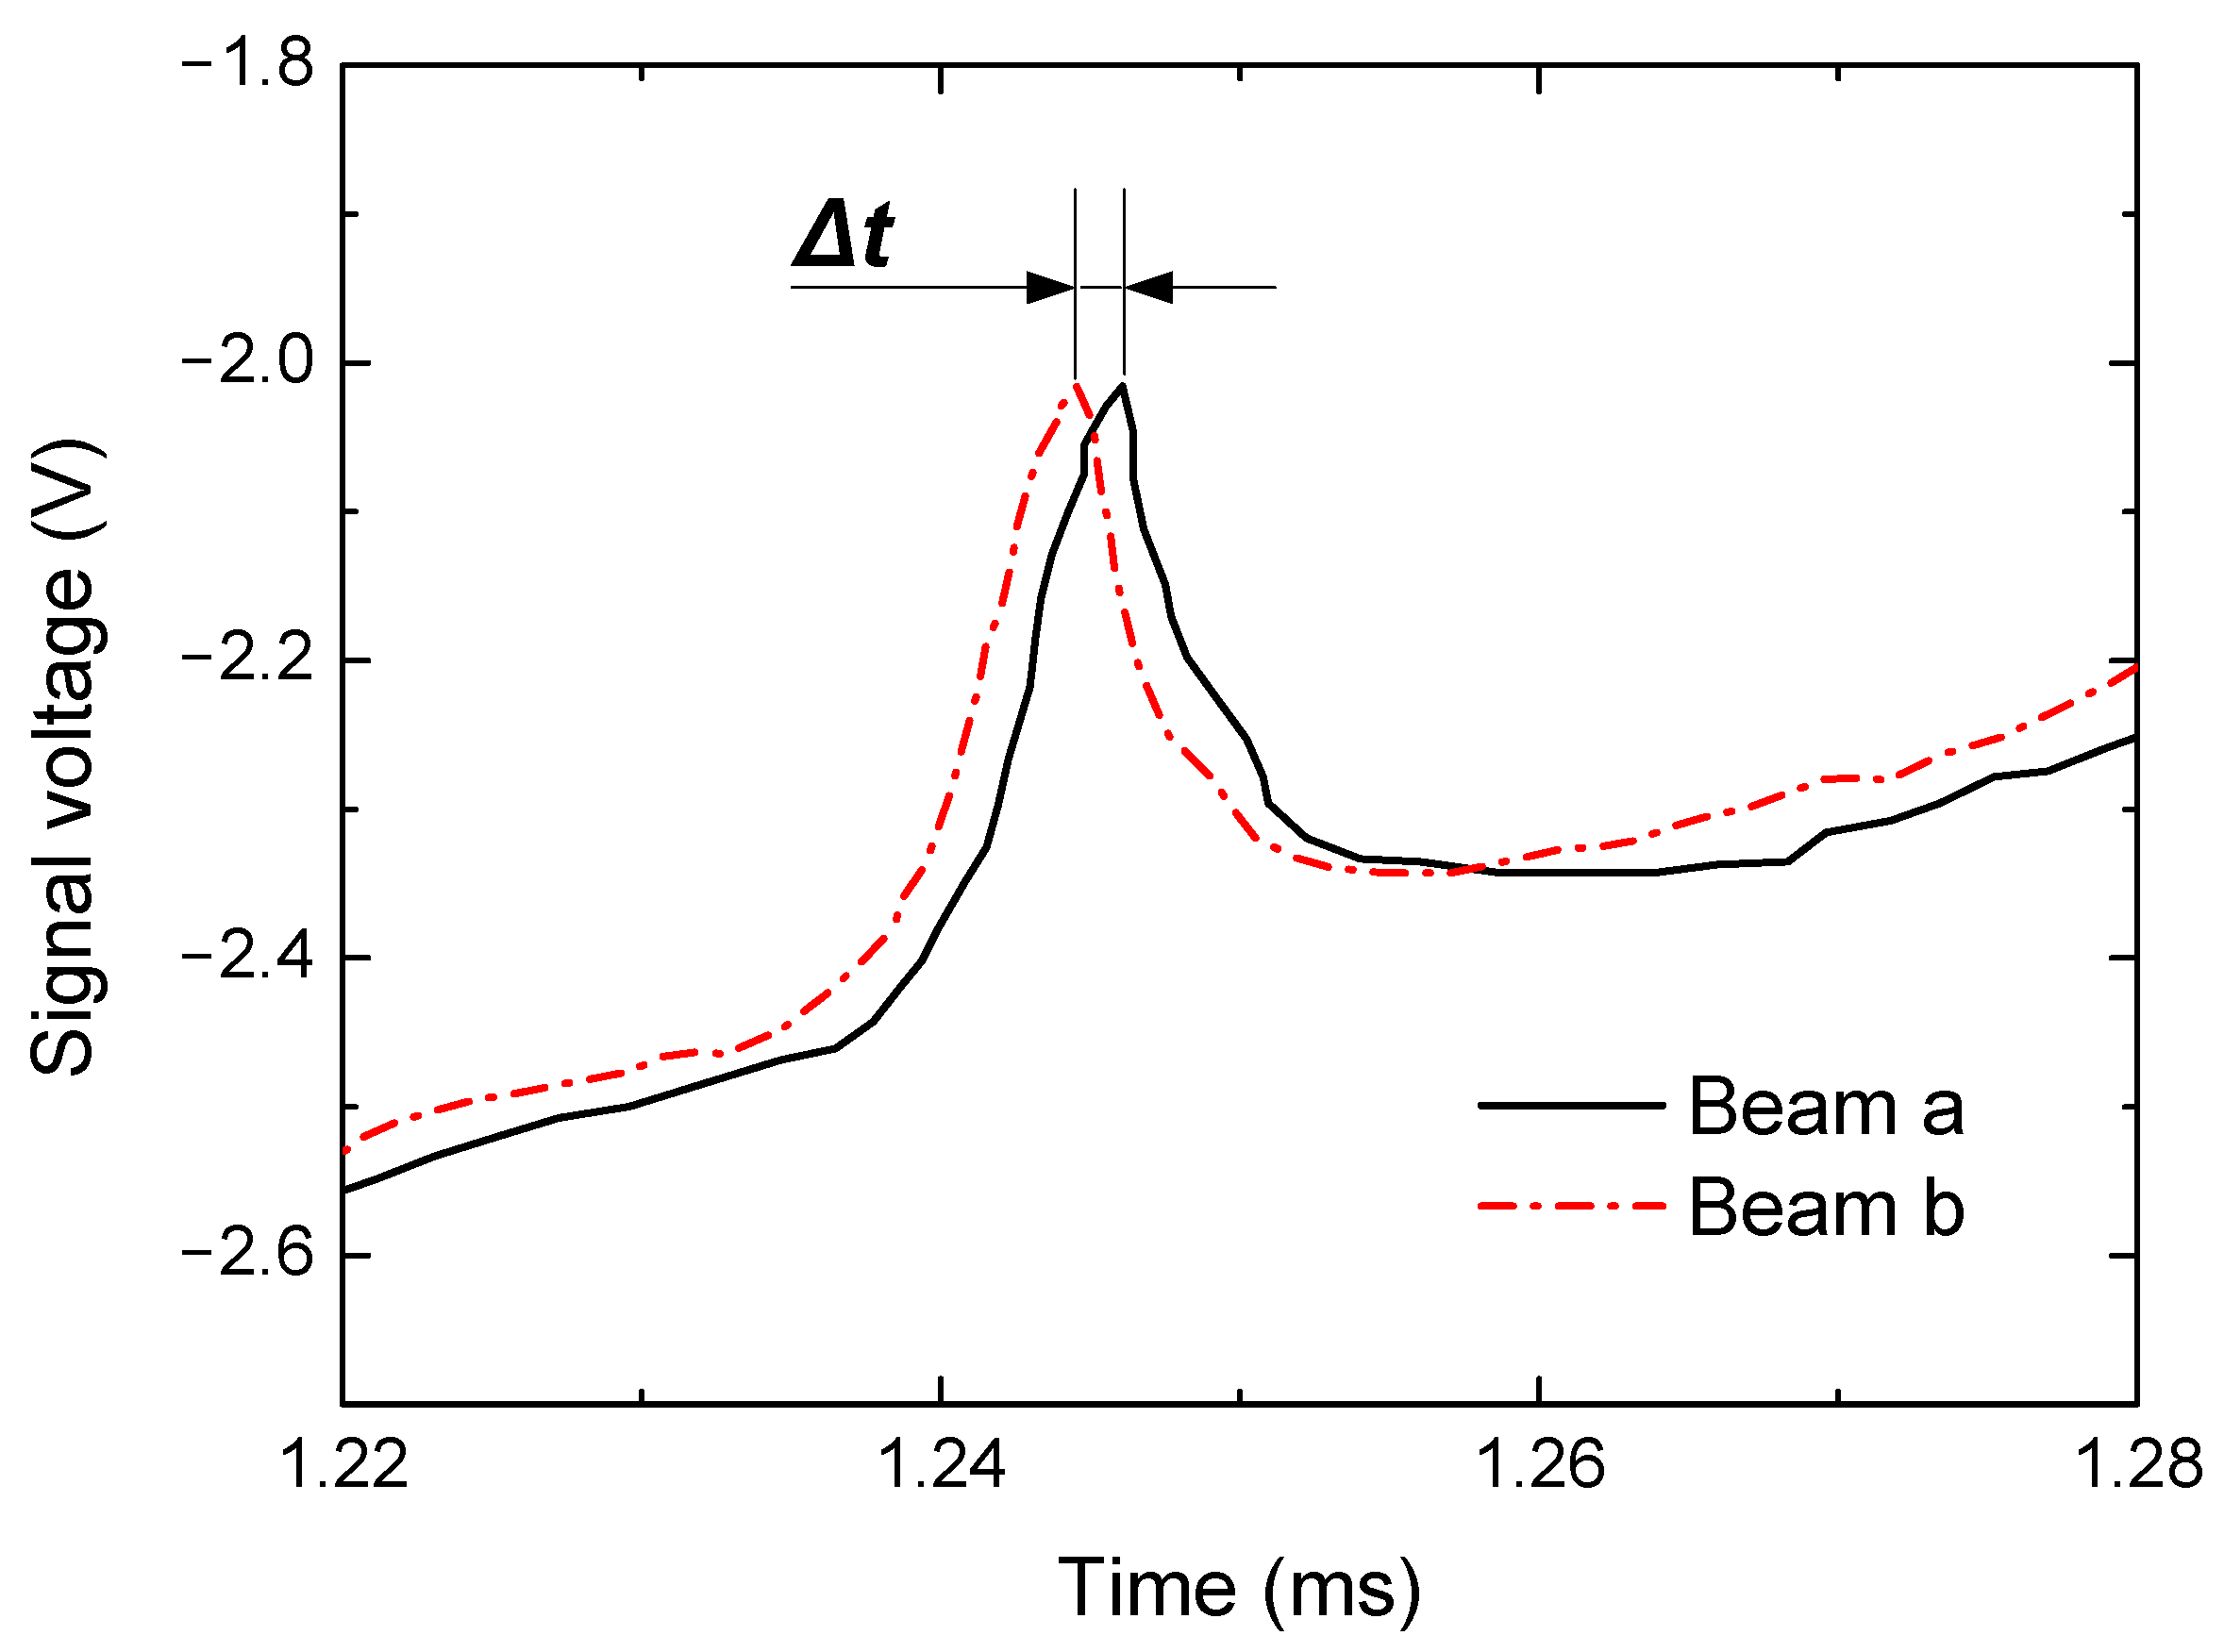
The signals obtained from laser beams a and b during the TDLAS analyses are shown in
Figure 7. To avoid miscalibaration, the synchronization of the initial absorption peaks of the two lasers under static air condition were performed. According to the correlation of
t with
(or
vs.
) in Equation (10), the frequency shift resulting from the Doppler effect could be
and combining this relationship with Equation (9) allowed the flow velocity to be determined from the TDLAS results.
In theory, the flow velocity and temperature could also be predicted by shock wave propagation equations numerically [
24]. It is helpful to summarize the characteristics of the three measurement methods:
- (1)
The ICP sensors can capture the shock wave movement and time interval, which are the key parameters to calculate flow velocity with shock wave theory.
- (2)
As noted above, the velocity by TDLAS measurement is actually that of H2O molecule.
- (3)
Numerical prediction is based on both the Mach number (obtained according to the pressure ratio between the high-pressure and low-pressure sections) and the shock wave propagation equations.
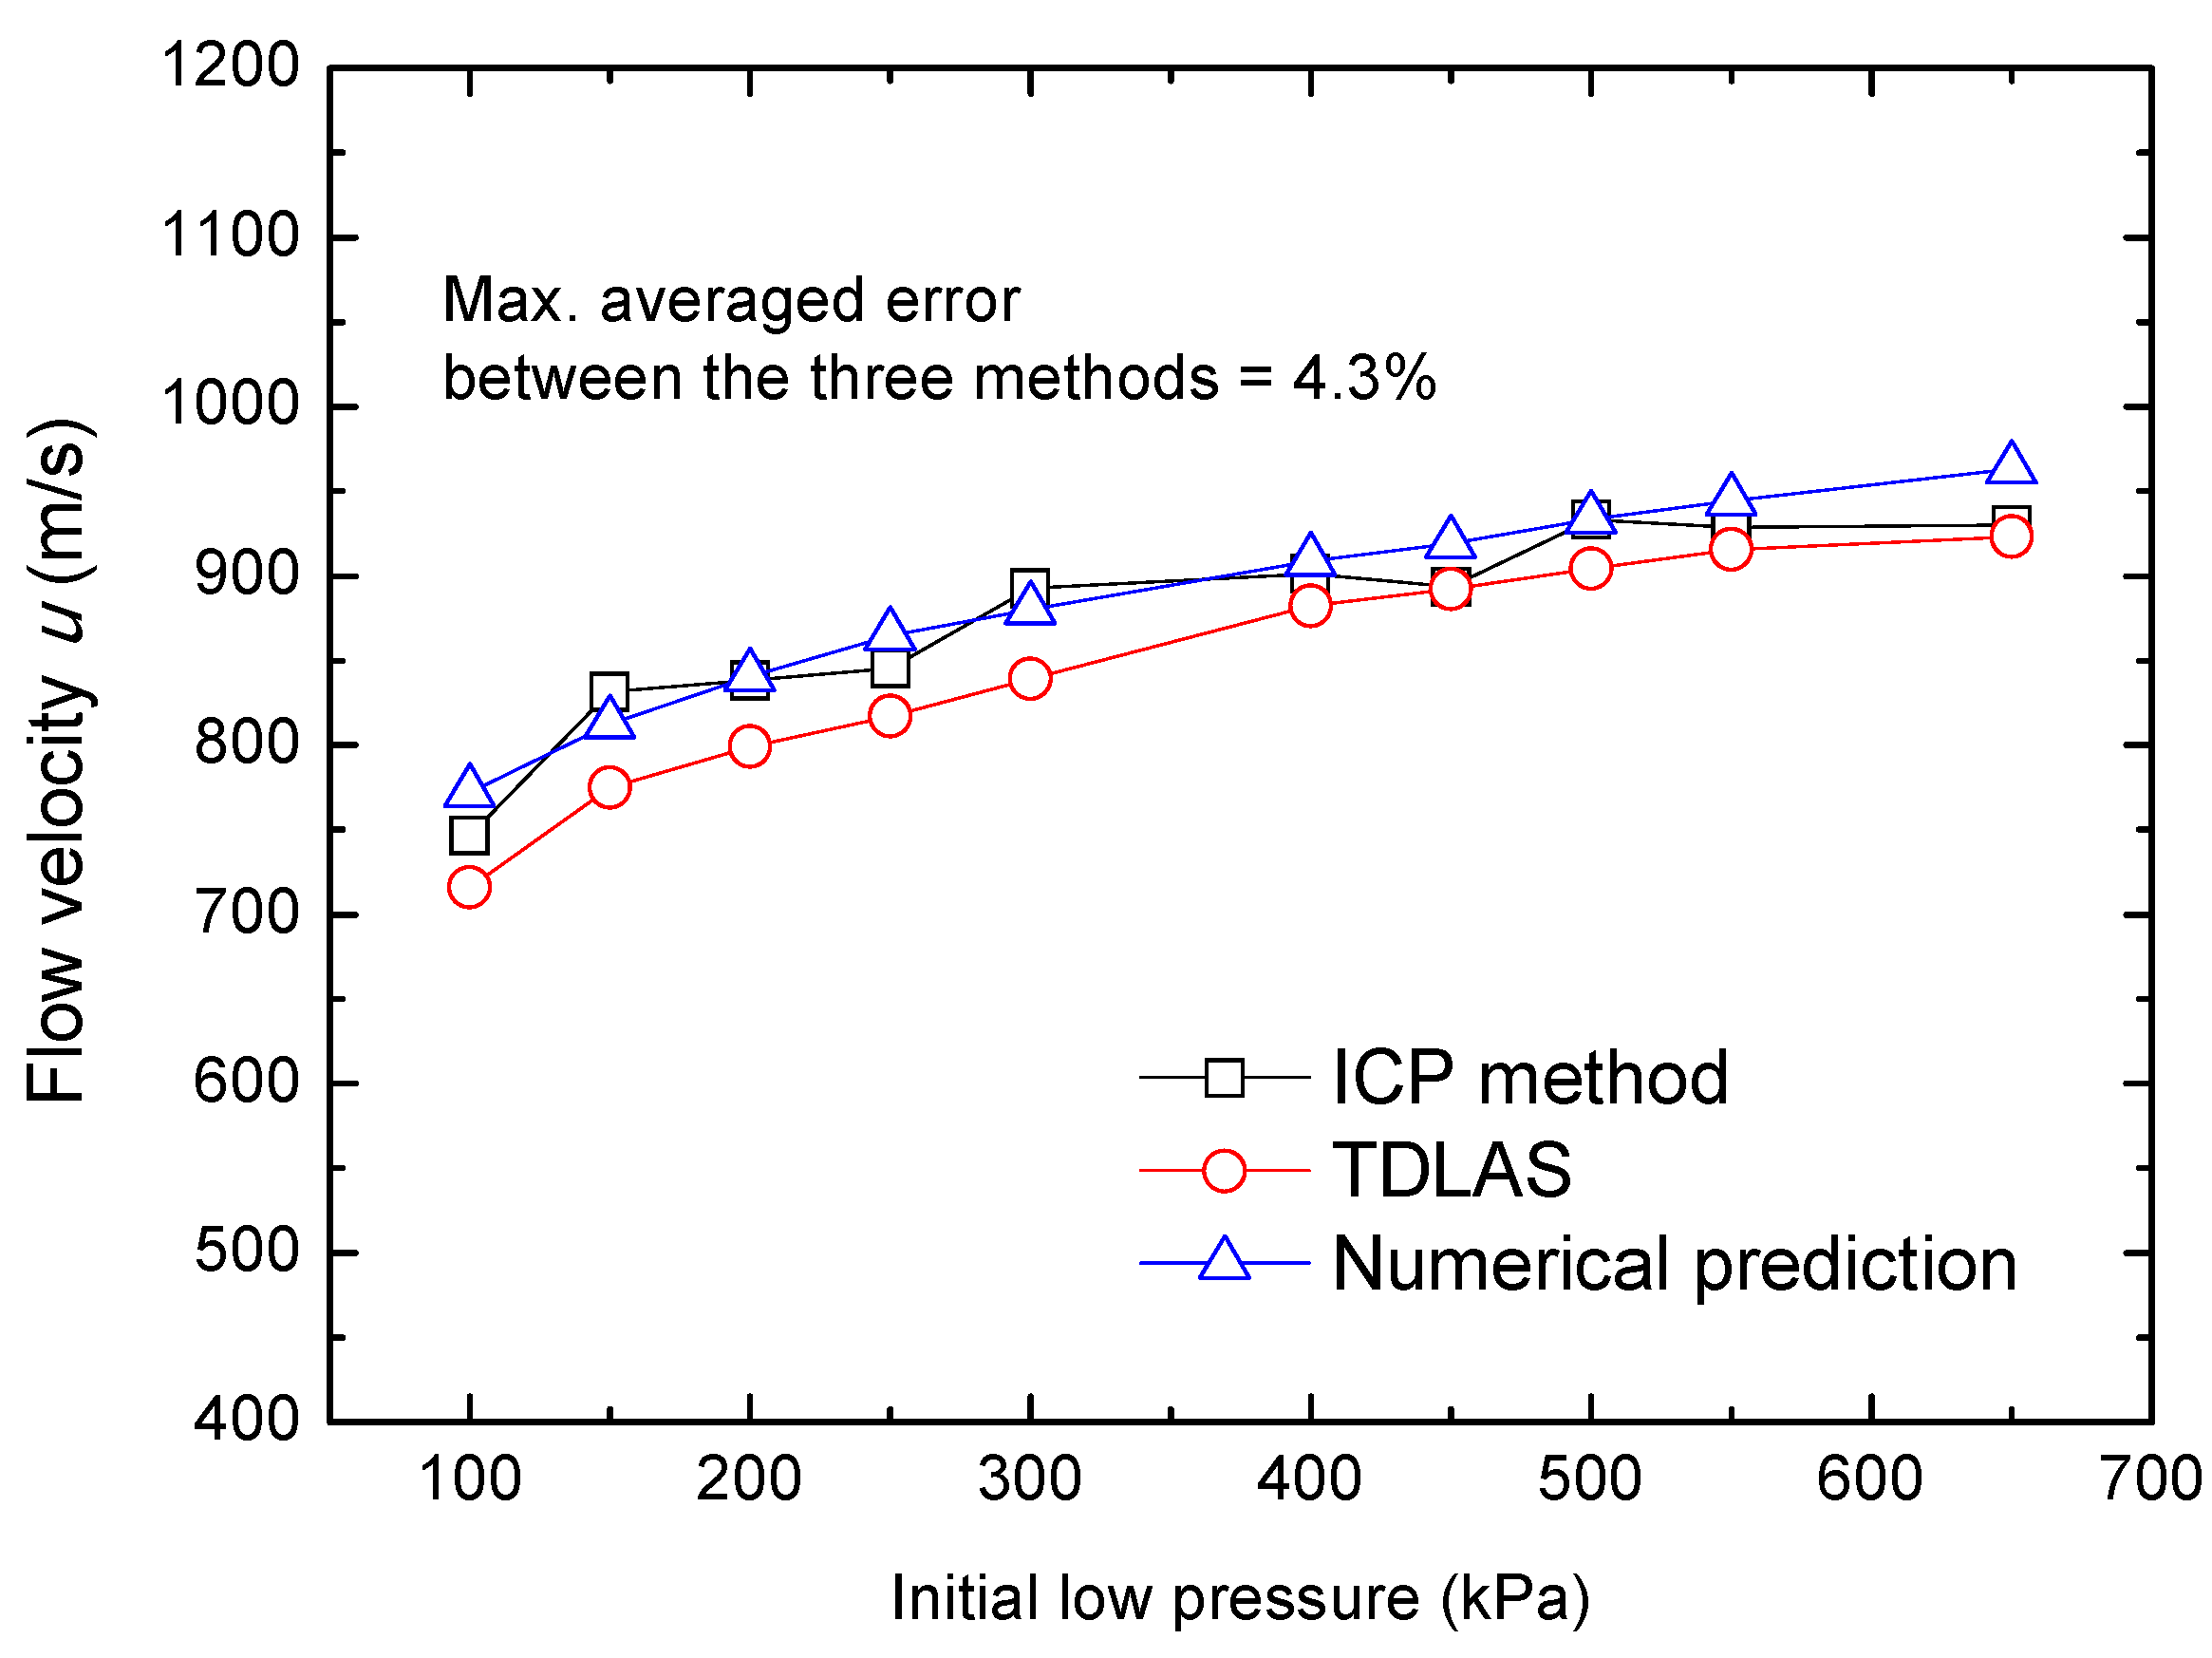
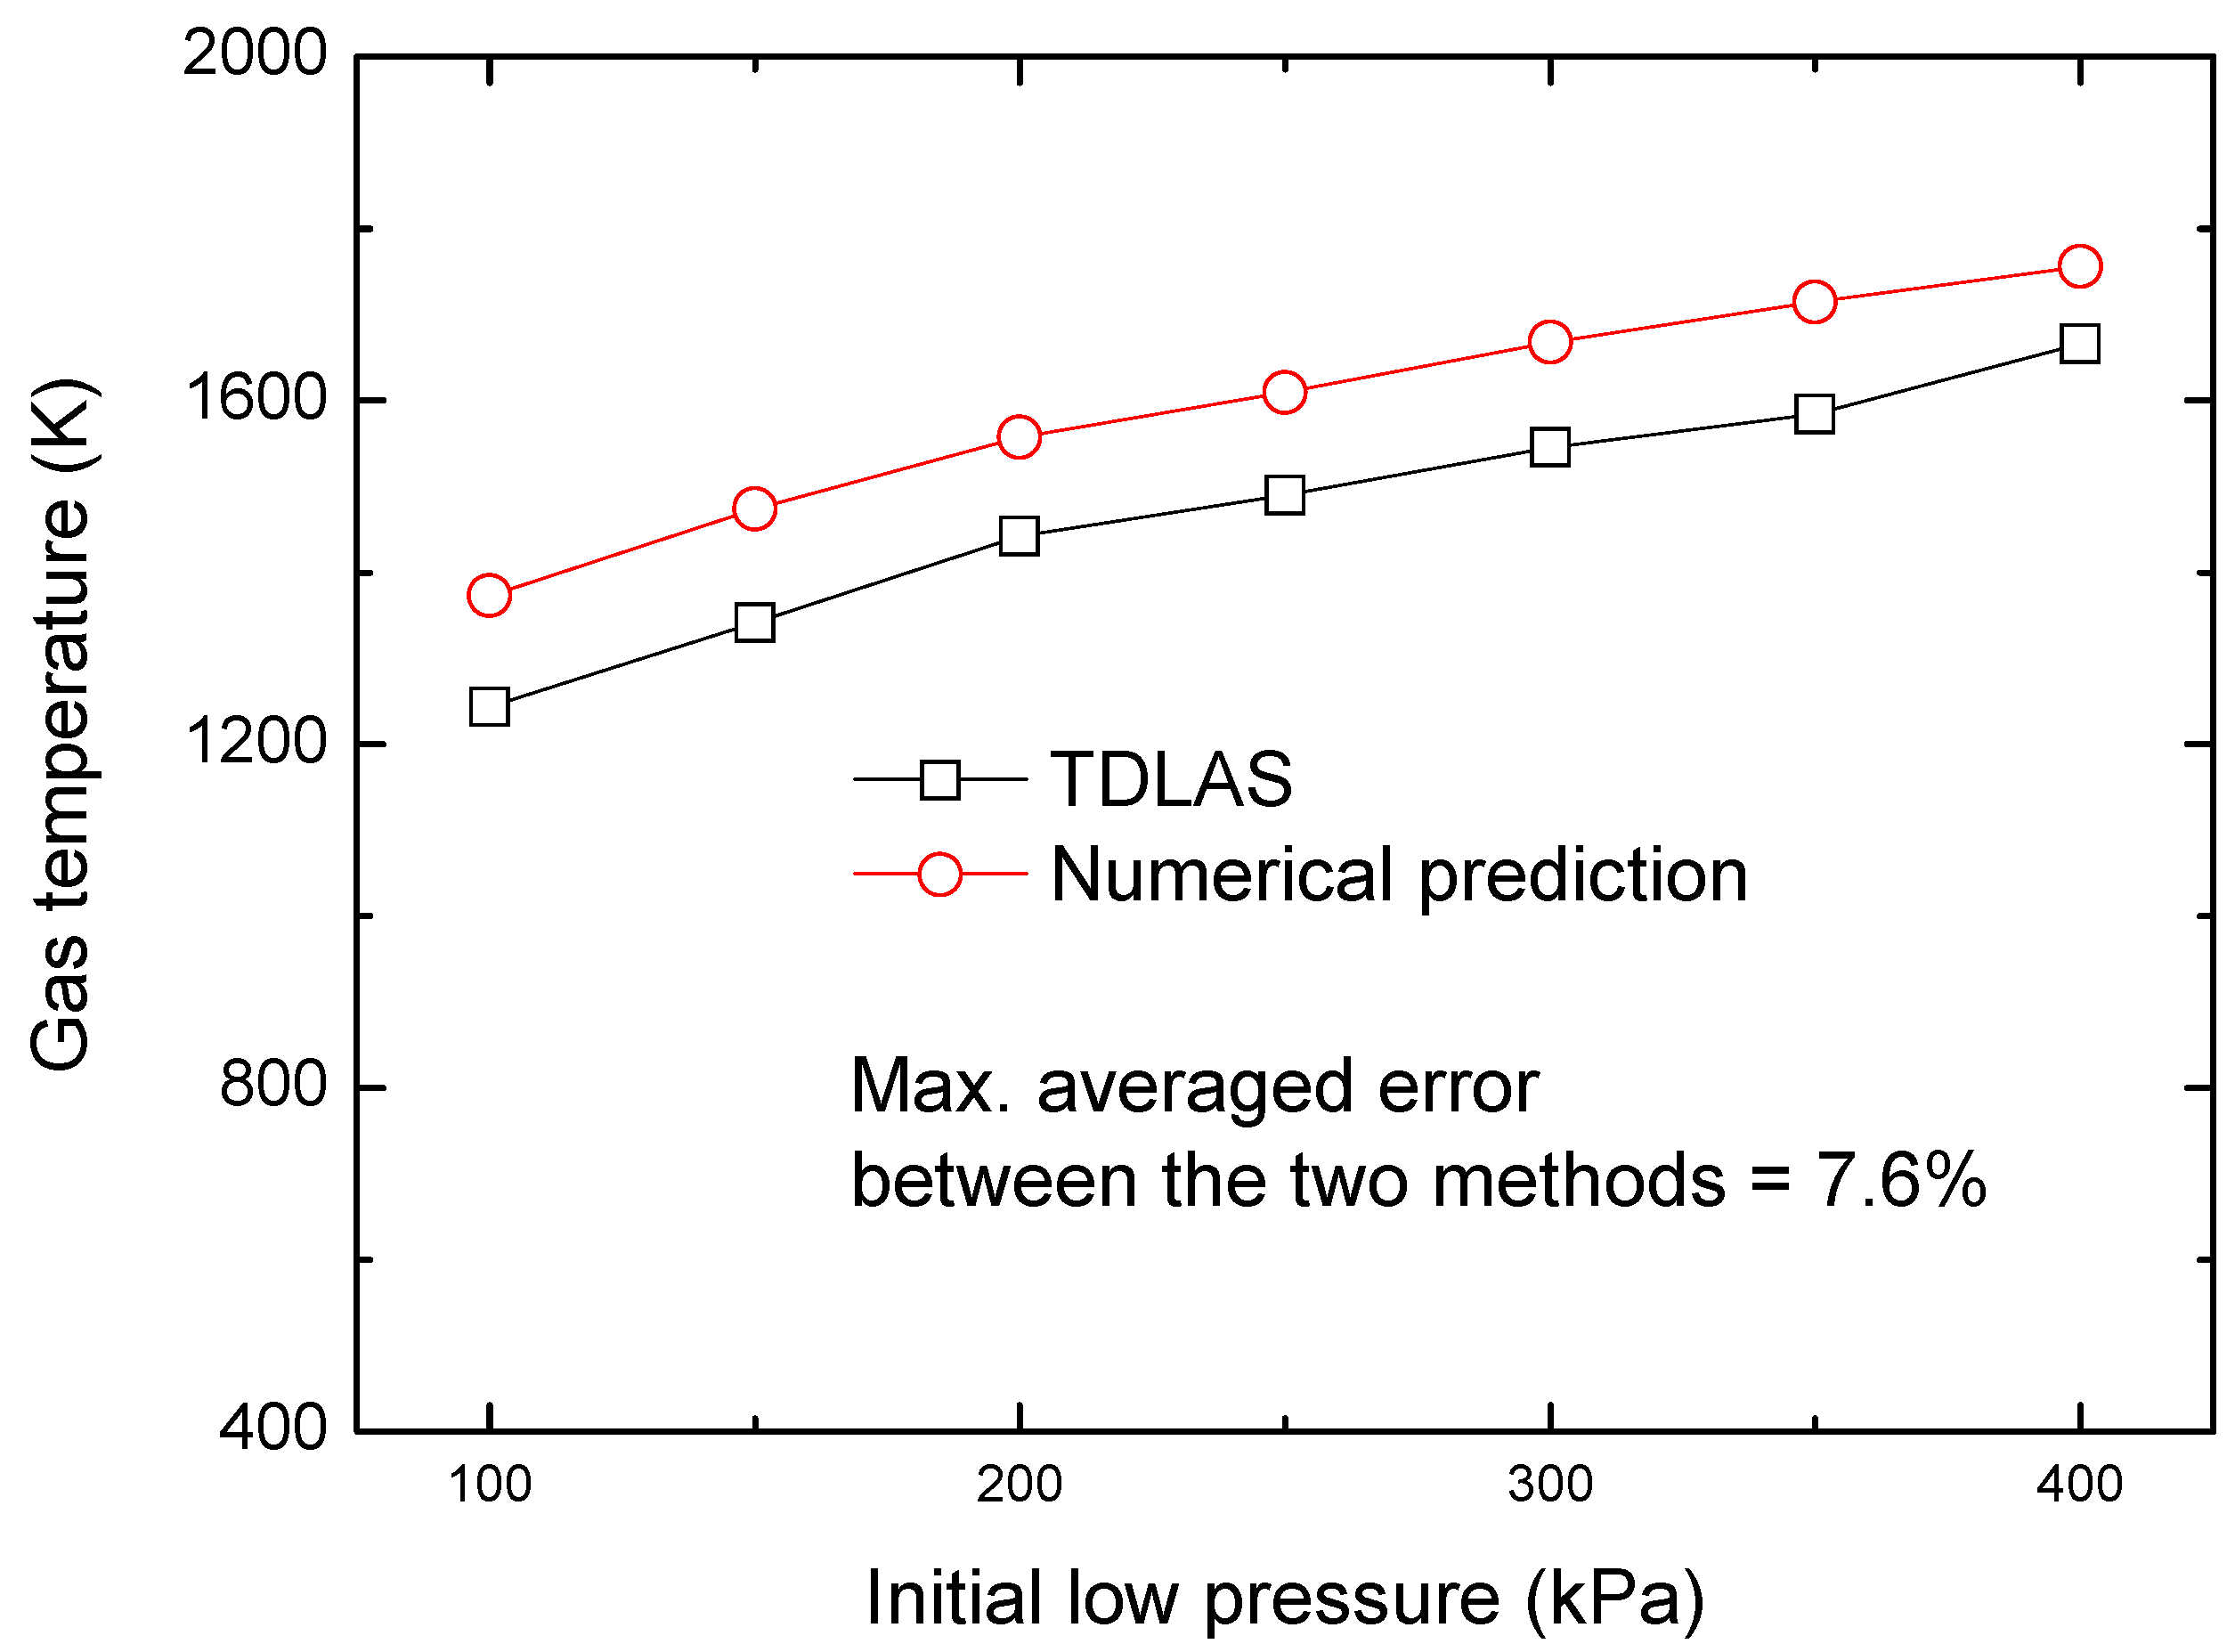
To validate these methods, tests were conducted applying an initial pressure in the range of 100–650 kPa for the low-pressure section, and a comparison of the results is provided in
Figure 8.
It is found that the results obtained from the ICP sensors and the numerical predictions were similar, presumably because both methods are on the basis of Mach number calculations and shock wave theory. However, the manner in which the Mach number is obtained is very different between the two. In the case of the ICP sensors method, the Mach number was deduced by shock wave velocity and sound velocity of the wave front, whereas, for numerical prediction, the Mach number was calculated from the aforementioned pressure ratio and iterative solution of gas dynamics relationships. Moreover, we should note that some assumptions had been made in shock wave theoretical analysis that may have led to a slight overestimation of the flow velocity. Specifically,
(1) Air viscosity effects and the propagation of waves in more than one dimension were ignored.
(2) The attenuation of the shock wave along shock tube was not considered.
(3) Considering the velocity range of gas flow, the re-absorption effect was also ignored [
25].
In general, for high-speed gas flow velocity, the TDLAS measurements show good agreement the results obtained using the other two methods, with a maximum averaged error of 4.3%. The temperature of the reflected shock wave was also monitored, and a comparison between the TDLAS results and numerical predictions is shown in
Figure 9. It is proved that the TDLAS system we developed in the present work was able to accurately capture the variation of temperature and velocity for high-speed gas flow.
3.3. Local Temperature and Velocity of CH4/Air Flame
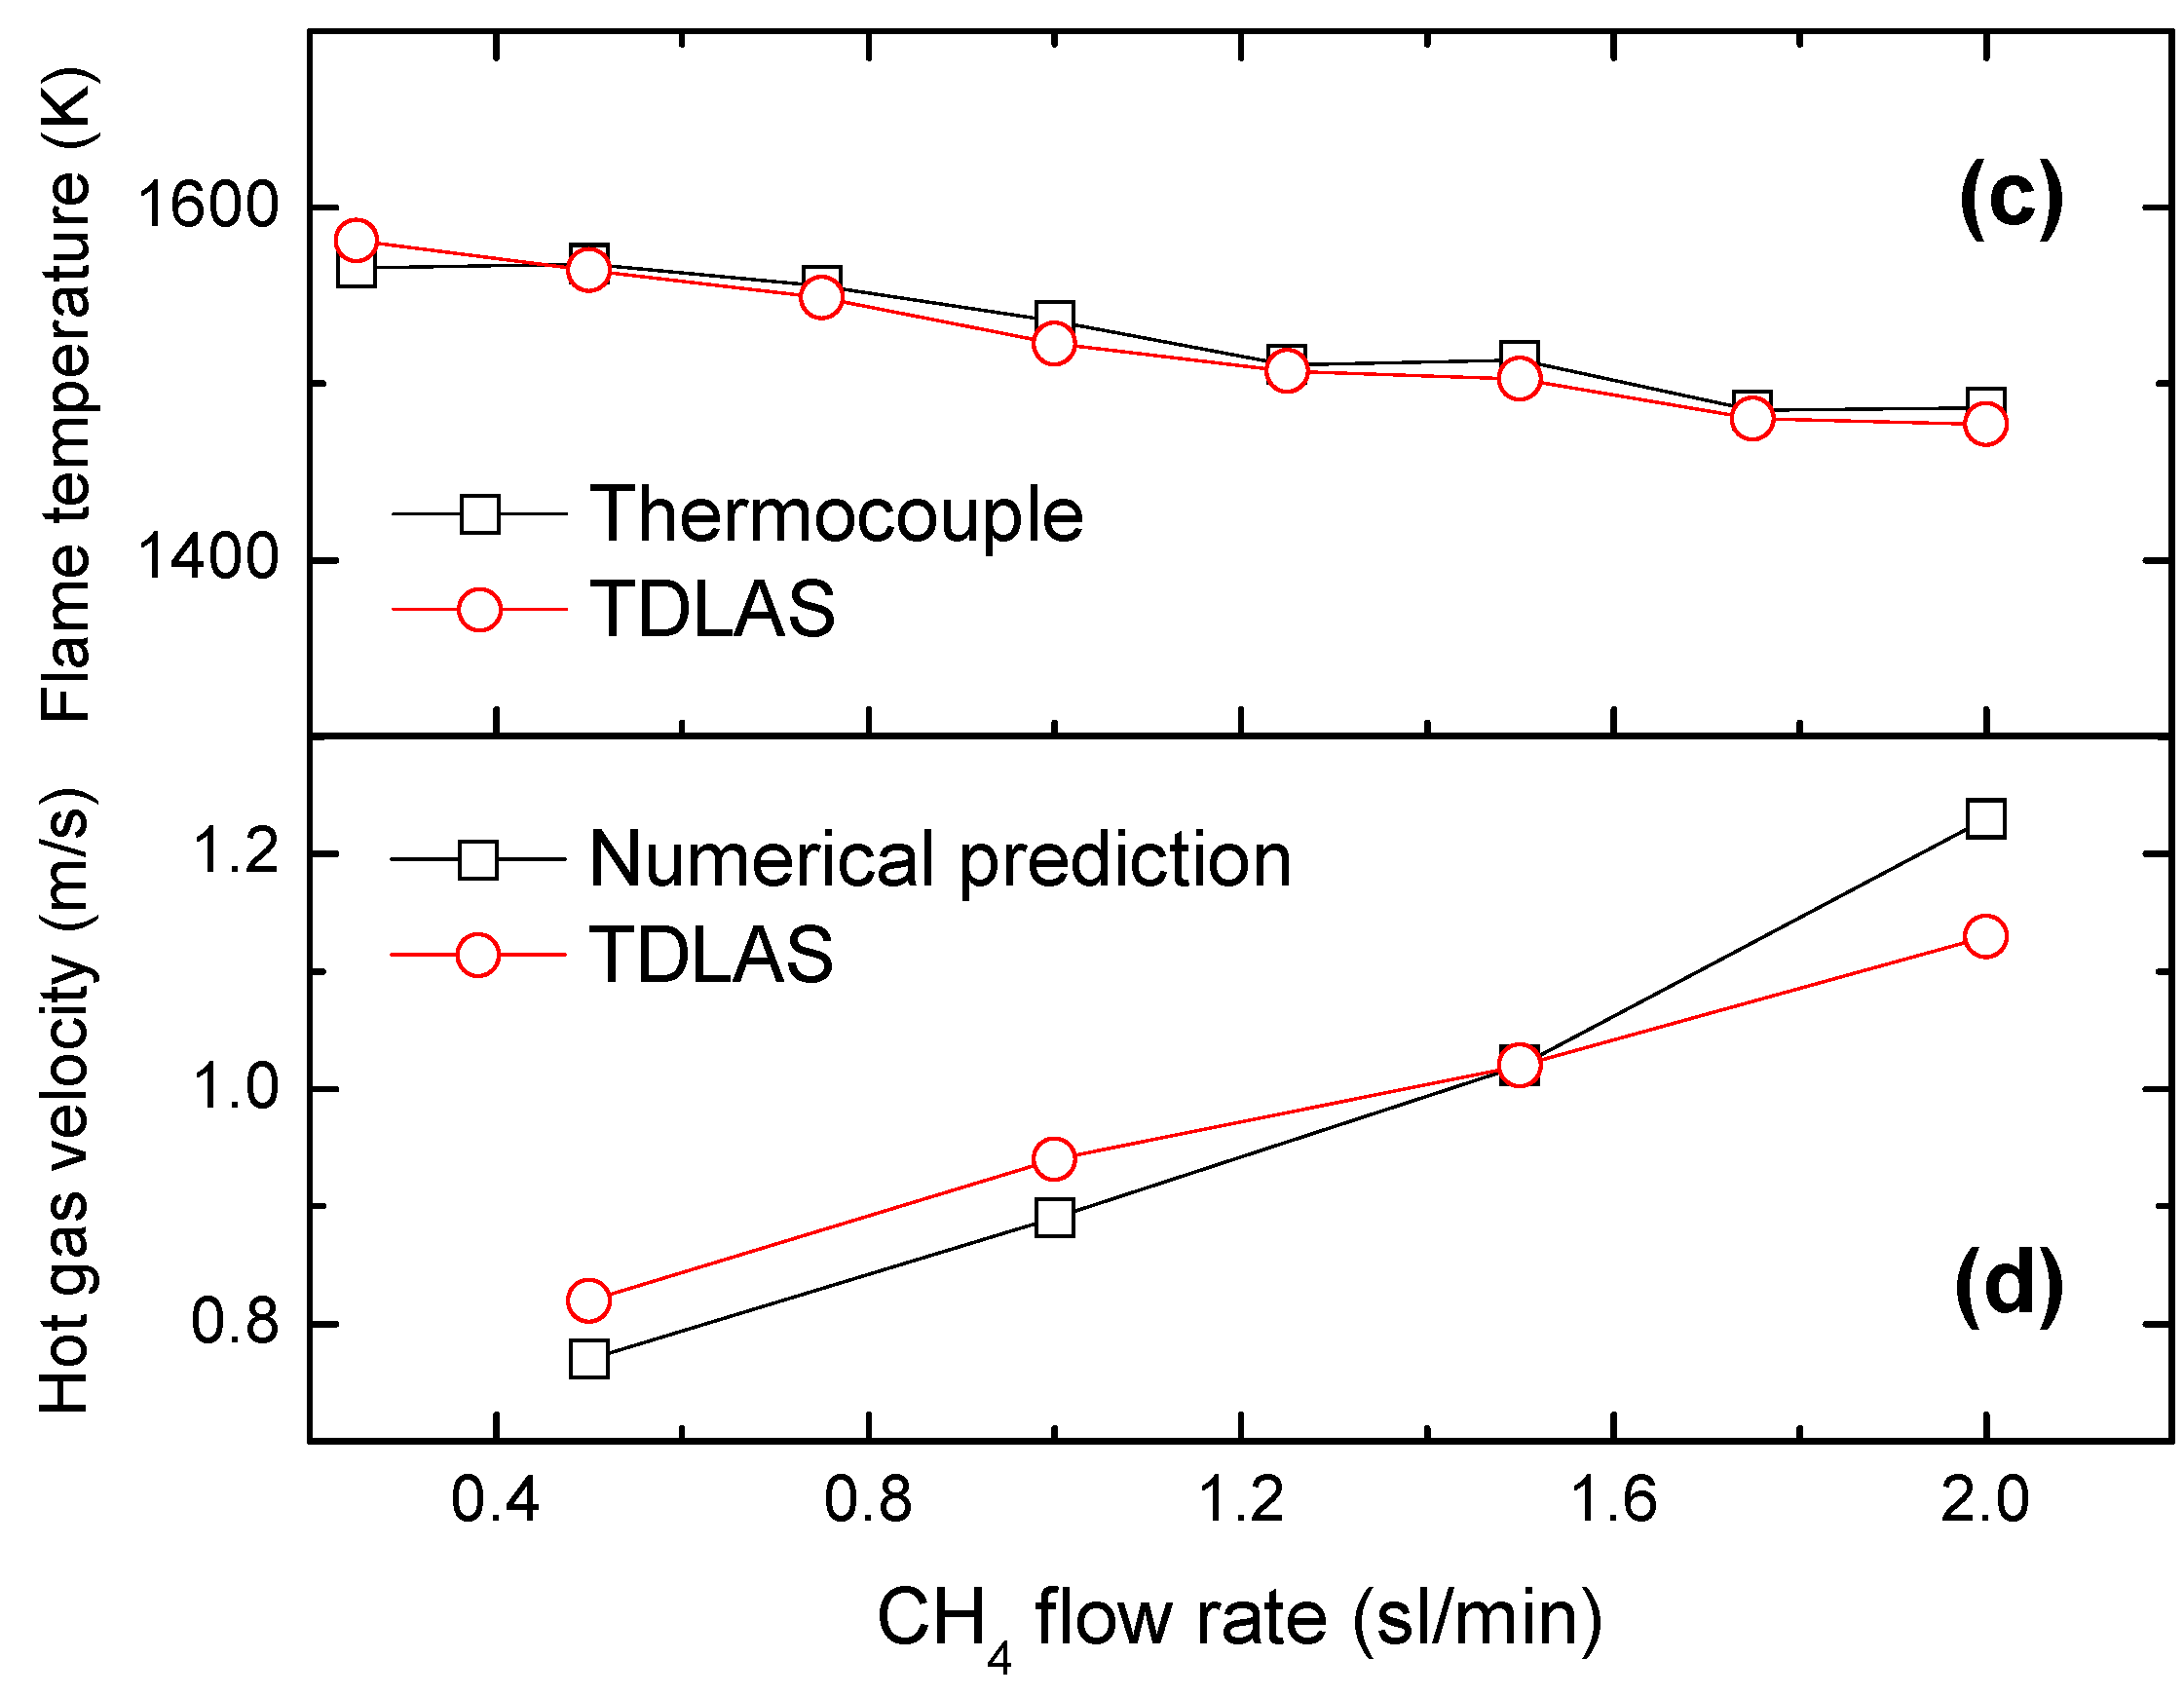
As one of the most important combustion products, the H
2O is an ideal tracer for flame measurement by the TDLAS system. Here, variations in
were evaluated using a thin Pt–Rh thermocouple wire with a diameter of 0.1 mm to estimate the approximate flame temperature range (in the vicinity of 1500 K). These data were subsequently used to validate the results by TDLAS as shown in
Figure 10a,b.
The line-pair of = 7181.15578 cm−1 and = 7185.59731 cm−1 was again used in this assessment. During the trials, the fuel mass (or volume) flow rate of CH4/air diffusion flame was controlled by mass flowmeters to obtain an air flow rate of 2 standard liters per minute (slpm) and CH4 flow rates in the range of 0.25–2 slpm under an ambient pressure of 1 atm.
Figure 10c compares the temperature results between the thermocouples and the TDLAS system. The tendencies and actual values of the two curves are very similar, meanwhile, velocities by numerical simulations and the TDLAS process are also compared in
Figure 10d with good agreement. It is interesting that although there were pulsations of the flame during testing, it can be ignored when using a driver scanning frequency above 1 kHz, meaning that approximately steady state flame information could be acquired at high scanning and sampling frequencies.
4. Conclusions
With the goal of performing combustion diagnostics and assessing the thermal characteristics of flammable gases, a portable H2O-based TDLAS system was designed. The measuring principle was revealed theoretically, and experimental calibration and validation were performed using a pressure vessel, shock tube, and CH4/air diffusion flame, respectively. The main conclusions from this work are:
(1) A method of calculating gas characteristics including temperature, velocity, and species concentration was provided using H2O absorption spectra and the HITRAN database in conjunction with TDLAS system. In addition, the line-pair selection criteria was verified. This method was demonstrated to be a viable approach to hot gas analyses.
(2) The dual optical path TDLAS system established can eliminate the background interference effectively when applied to a relatively small test target. The combined selection of an appropriate center wavelength, wavelength calibration between the time and frequency domains, and use of a specific scanning or sampling frequency allowed this system to be used for the assessment of small flames.
(3) The temperature calibration and pressure broadening effect of absorption spectra of this TDLAS system were studied using a pressure vessel. It is found that this system can provide an accurate measurement within environment pressure of 0.8 MPa.
(4) A shock tube was built to provide controllable and steady gas flows with high temperature or high speed, which turned out to be an ideal experimental setup for the parameter calibration of TDLAS at extreme conditions. The TDLAS system was confirmed to accurately monitor variations in high temperature and velocity gas flows.
(5) A small scale CH4/air diffusion flame burner was developed to validate the ability of the TDLAS system to monitor combustion characteristics. A comparison of the TDLAS results with thermocouple measurements and numerical simulations indicated that the TDLAS method provided satisfactory flame temperature and velocity values.
Future work will involve the application of TDLAS to the assessment of hydrocarbon combustion products such as CO2 and C-H radicals to explore more precise measurements.
Author Contributions
Initial conceptualization, R.T. and J.G.; Data curation, J.G., Y.Z. and Z.M.; Formal analysis, R.T., X.Z. and J.J.; Funding acquisition, R.T., X.Z., K.Y. and J.Y.; Methodology, R.T. and J.G.; Project administration, R.T.; Writing—original draft, R.T. and Y.Z.; Writing—review and editing, J.G. and X.Z. All authors have read and agreed to the published version of the manuscript.
Funding
This research was supported by the National Natural Science Foundation of China (nos. 52076084 and 52175508), Collaborative Innovation Platform of Fuzhou-Xiamen-Quanzhou Independent Innovation Demonstration Area (no. 3502ZCQXT202002), and the Fundamental Research Funds for the Central Universities (no. ZQN-1001). The authors thankfully acknowledge all these supports.
Institutional Review Board Statement
Not applicable.
Informed Consent Statement
Not applicable.
Data Availability Statement
Data is contained within the article.
Acknowledgments
We thank S.L. Xu for assistance with the experimental design.
Conflicts of Interest
The authors declare no conflict of interest.
Nomenclature
| Integrated absorbance of independent transition line |
| Speed of light (m s−1) |
| Energy of the lower transition state (J) |
| Signal of light intensity (V) |
| Path length (m) |
| Partial pressure (Pa) |
| Molecular absorption line strength (cm−2 atm−1) |
| Temperature (K) |
| Time (s) |
| Velocity (m s−1) |
| Absorptivity of absorbing species |
| Frequency of laser |
| Absorption lineshape function of species |
| Angle between two lasers |
| Wavelength |
References
- Philippe, L.C.; Hanson, R.K. Laser diode wavelength-modulation spectroscopy for simultaneous measurement of temperature, pressure, and velocity in shock-heated oxygen flows. Appl. Opt. 1993, 32, 6090–6103. [Google Scholar] [PubMed]
- Alexander, K.; Oliver, W.; Volker, E. Rapid, Time-division multiplexed, direct absorption- and wavelength modulation-spectroscopy. Sensors 2014, 14, 21497–21513. [Google Scholar]
- Lo, Y.H.; Grabbe, P.; Iqbal, M.Z.; Bhat, R.; Gimlett, J.L.; Young, J.C.; Lin, P.S.D.; Gozdz, A.S.; Koza, M.A.; Lee, T.P. Multigigabit/s 1.5 mu m lambda/4-shifted DFB OEIC transmitter and its use in transmission experiments. IEEE Photonics Technol. Lett. 1990, 2, 673–674. [Google Scholar]
- Zah, C.E.; Amersfoort, M.R.; Pathak, B.; Favire, F.; Lin, P.S.D.; Rajhel, A.; Andreadakis, N.C.; Bhat, R.; Caneau, C.; Koza, M.A. Wavelength accuracy and output power of multiwavelength DFB laser arrays with integrated star couplers and optical amplifiers. IEEE Photonics Technol. Lett. 1996, 8, 864–866. [Google Scholar]
- Nagali, V.; Hanson, R.K. Design of a diode-laser sensor to monitor water vapor in high-pressure combustion gases. Appl. Opt. 1997, 36, 9518–9527. [Google Scholar]
- Mihalcea, R.M.; Baer, D.S.; Hanson, R.K. Advanced diode laser absorption sensor for in situ combustion measurements of CO2, H2O, and gas temperature. Proc. Combust. Inst. 1998, 27, 95–101. [Google Scholar]
- Allen, M.G. Diode Laser Absorption Sensors for Gas-Dynamic and Combustion Flows. Meas. Sci. Technol. 1998, 9, 545–562. [Google Scholar]
- Chang, A.Y.; Dirosa, M.D.; Davidson, D.F.; Hanson, R.K. Rapid tuning cw laser technique for measurements of gas velocity, temperature, pressure, density, and mass flux using NO. Appl. Opt. 1991, 30, 3011–3022. [Google Scholar]
- Kranendonk, L.A.; Walewski, J.W.; Kim, T.; Sanders, S.T. Wavelength-agile sensor applied for HCCI engine measurements. Proc. Combust. Inst. 2005, 30, 1619–1627. [Google Scholar]
- Webber, M.E.; Wang, J.; Sanders, S.T.; Baer, D.S.; Hanson, R.K. In situ combustion measurements of CO, CO2, H2O and temperature using diode laser absorption sensors. Proc. Combust. Inst. 2000, 28, 407–413. [Google Scholar]
- Torek, P.V.; Hall, D.L.; Miller, T.A.; Tiffany, A.; Wooldridge, M.S. H2O absorption spectroscopy for determination of temperature and H2O mole fraction in high-temperature particle synthesis systems. Appl. Opt. 2002, 41, 2274–2284. [Google Scholar]
- Zhou, X.; Sanders, S.T.; Jeffries, J.B.; Hanson, R.K.; Jenkins, T.P. Combustion temperature and H2O concentration sensor using a single diode laser. In Proceedings of the 40th AIAA Aerospace Sciences Meeting & Exhibit, Reno, NV, USA, 14–17 January 2002; Volume 395. [Google Scholar]
- Zhou, X.; Liu, X.; Jeffries, J.B.; Hanson, R.K. Development of a sensor for temperature and water concentration in combustion gases using a single tunable diode laser. Meas. Sci. Technol. 2003, 14, 1459. [Google Scholar]
- Fuwa, K.; Valle, B.L. The physical basis of analytical atomic absorption spectrometry. The pertinence of the Beer-Lambert law. Anal. Chem. 1963, 35, 942–946. [Google Scholar]
- Gao, N.; Du, Z.H.; Qi, R.B.; Ma, Y.W.; Wang, Y. Lineshape deviation and correction in tunable diode laser absorption spectroscopy technology. J. Optoelectron. Laser 2011, 22, 893–896. [Google Scholar]
- McHale, J.L. Molecular Spectroscopy; Prentice Hall: Hoboken, NJ, USA, 1998. [Google Scholar]
- High-Resolution Transmission Molecular Absorption Database. Atomic and Molecular Physics Division, Harvard-Smithsonian Center for Astrophysics, 2012. Available online: http://cfa-www.harvard.edu/HITRAN/ (accessed on 2 May 2013).
- Rothman, L.S.; Barbe, A.; Chris, B.D.; Brown, L.R.; Camy-Peyret, C.; Carleer, M.R.; Chance, K.; Clerbaux, C.; Dana, V.; Devi, V.M.; et al. The HITRAN molecular spectroscopic database: Edition of 2000 including updates through 2001. J. Quant. Spectrosc. Radiat. Transf. 2003, 82, 5–44. [Google Scholar]
- Allen, M.G.; Kessler, W.J. Simultaneous water vapor concentration and temperature measurements using 1.31 μm diode lasers. AIAA J. 1996, 34, 483–488. [Google Scholar]
- Miller, M.F.; Kessler, W.; Allen, M.G. Diode laser-based air mass flux sensor for subsonic aeropropulsion inlets. Appl. Opt. 1996, 35, 4905–4912. [Google Scholar]
- Rieker, G.B.; Liu, X.; Li, H.; Jeffries, J.B.; Hanson, R.K. Measurements of near-IR water vapor absorption at high pressure and temperature. Appl. Phys. B 2006, 87, 169–178. [Google Scholar]
- Zeng, Y.; Fang, J.; Wang, J.W.; Li, J.; Tu, R.; Zhang, Y. Momentum-dominated methane jet flame at sub-atmospheric pressure. Procedia Eng. 2013, 63, 924–931. [Google Scholar]
- Wang, J.W.; Fang, J.; Guan, J.F.; Zeng, Y.; Zhang, Y.M. Flame volume and radiant fraction of jet diffusion methane flame at sub-atmospheric pressures. Fuel 2016, 167, 82–88. [Google Scholar]
- Anderson, J.D. Fundamentals of Aerodynamics; McGraw Hill: New York, NY, USA, 2006. [Google Scholar]
- Lundgaard, S.; Ng, S.H.; Cahill, D.; Dahlberg, J.; Allender, J.; Barber, M.; Stephens, J.; Juodkazis, S. Electrical breakdown spectroscopy of nano-/micro-thermites. Technologies 2021, 9, 34. [Google Scholar] [CrossRef]
| Publisher’s Note: MDPI stays neutral with regard to jurisdictional claims in published maps and institutional affiliations. |
© 2022 by the authors. Licensee MDPI, Basel, Switzerland. This article is an open access article distributed under the terms and conditions of the Creative Commons Attribution (CC BY) license (https://creativecommons.org/licenses/by/4.0/).


 ,
, 


