Visual Sensing System to Investigate Self-Propelled Motion and Internal Color of Multiple Aqueous Droplets

 , , and
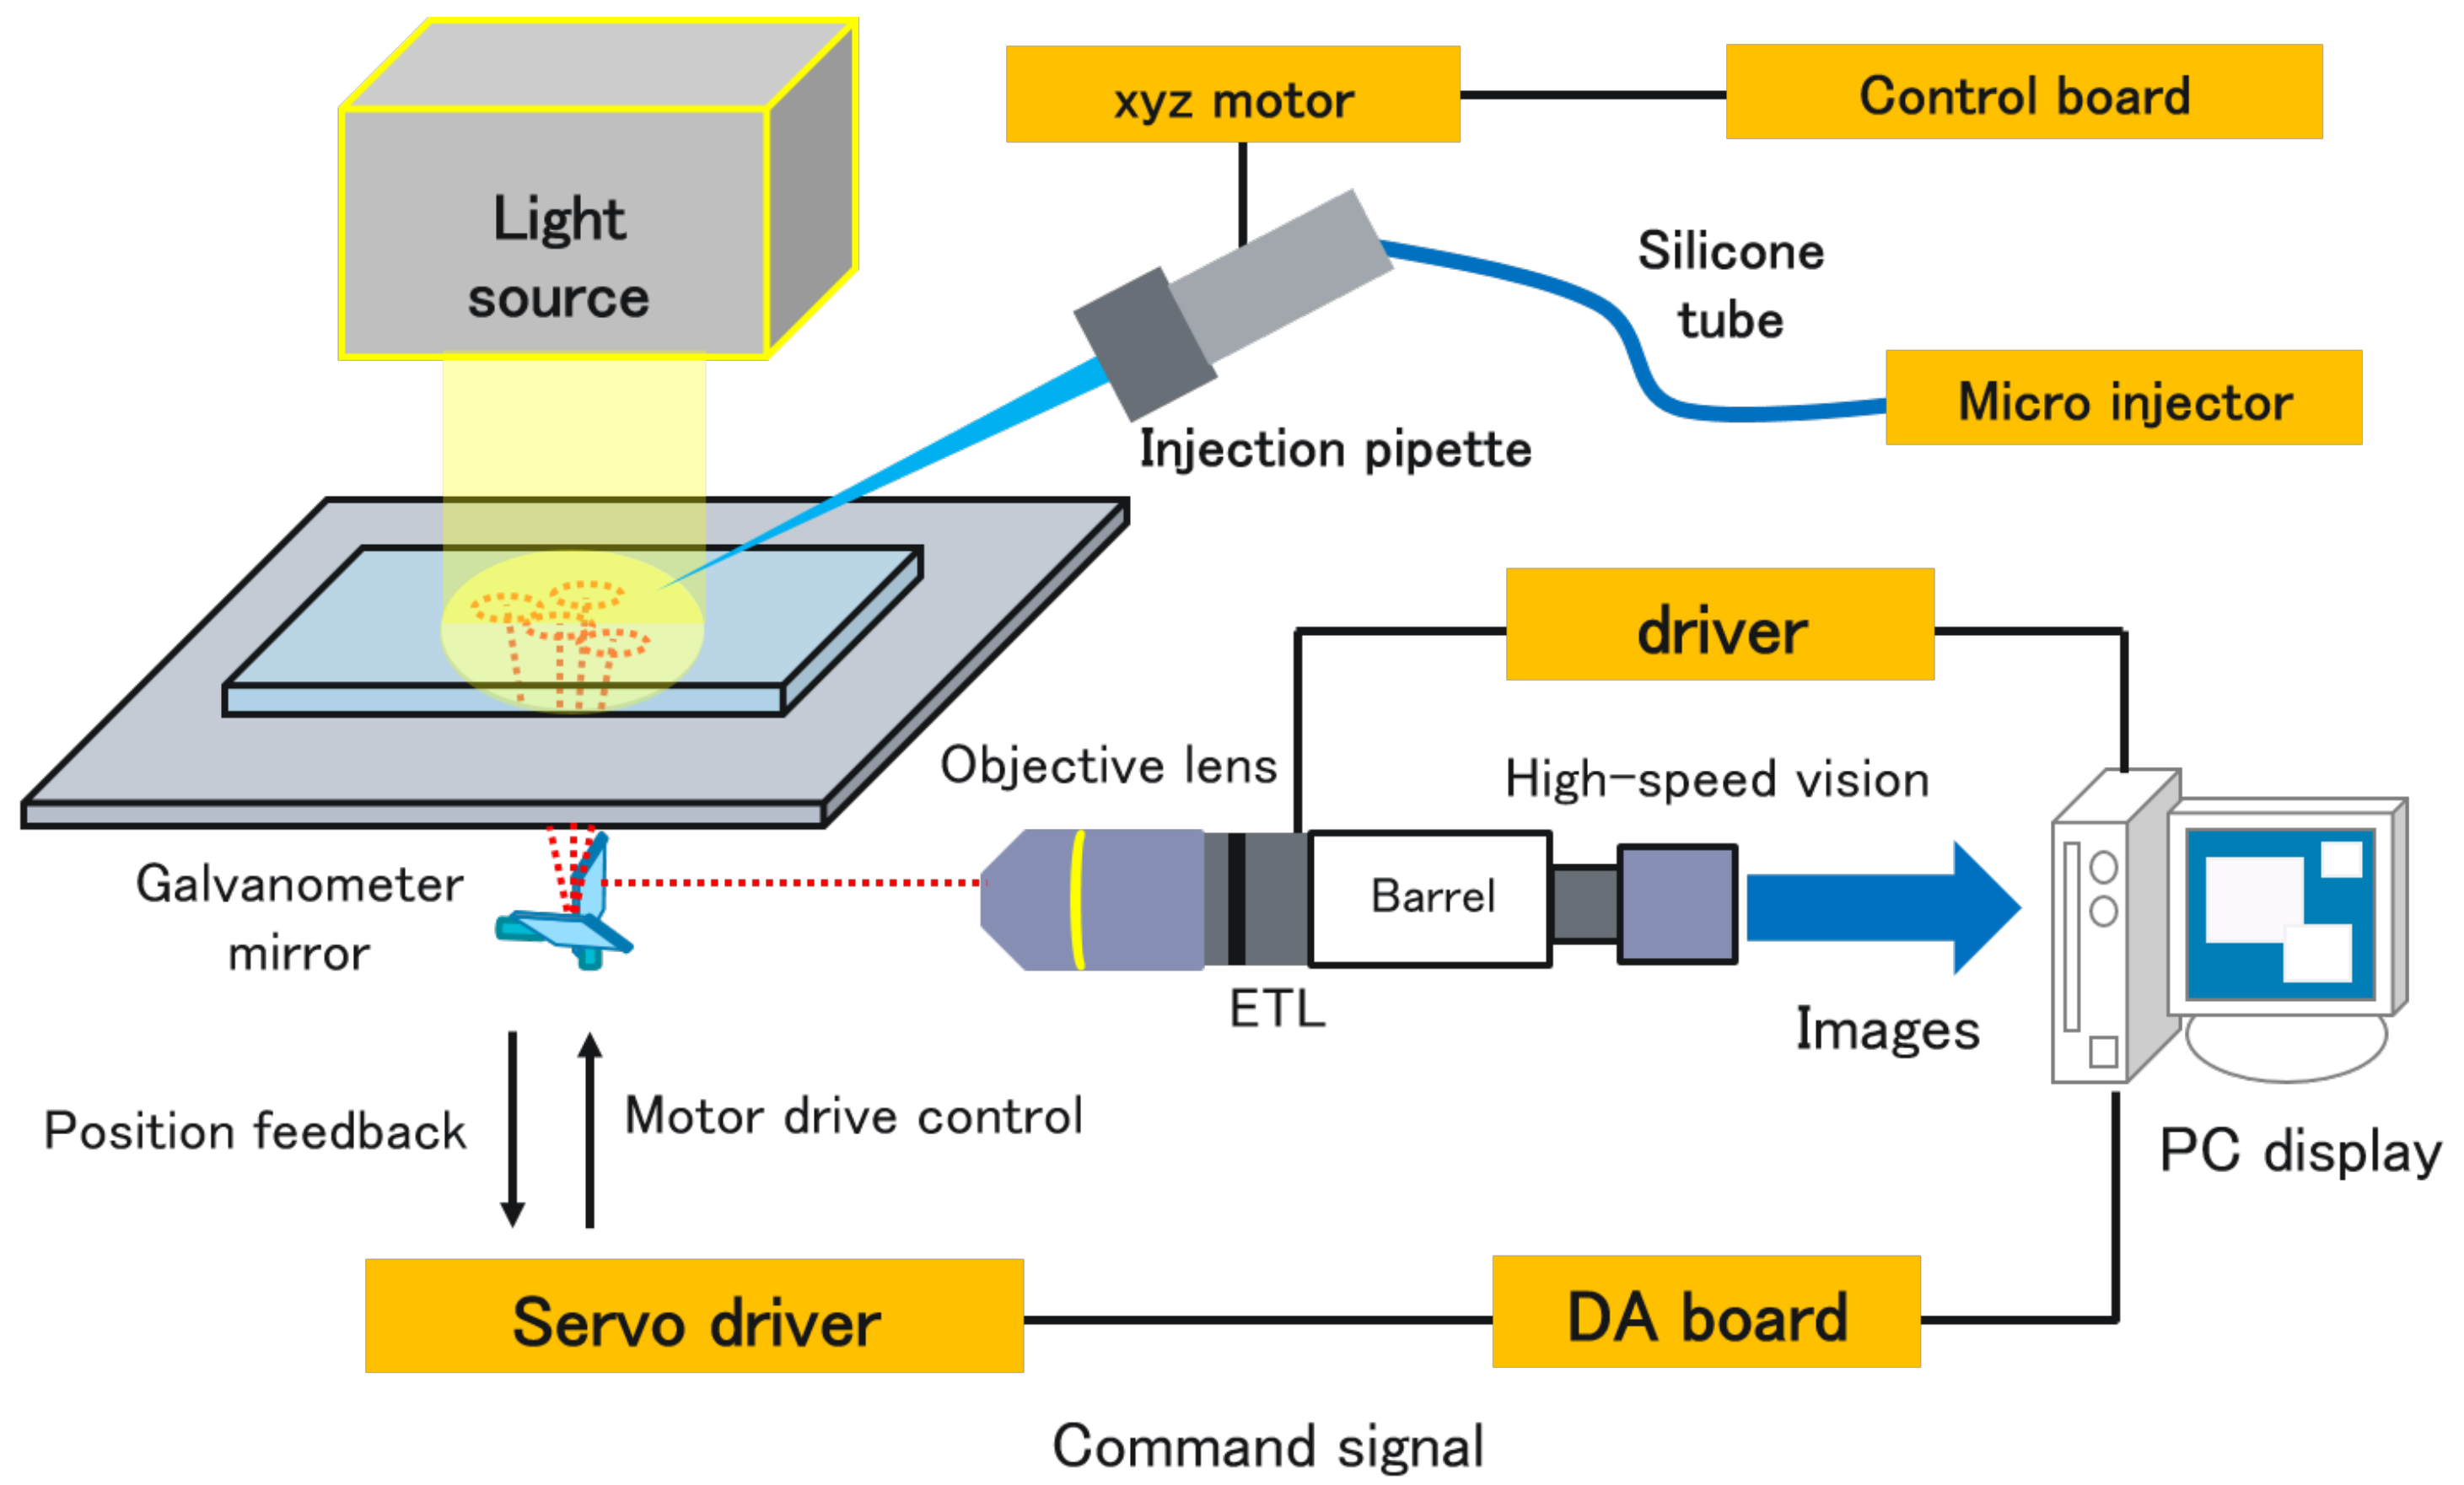
Abstract
:1. Introduction
2. Proposed System
2.1. System Configuration
2.2. Implemented Algorithm
3. Experiments
3.1. Experimental Condition
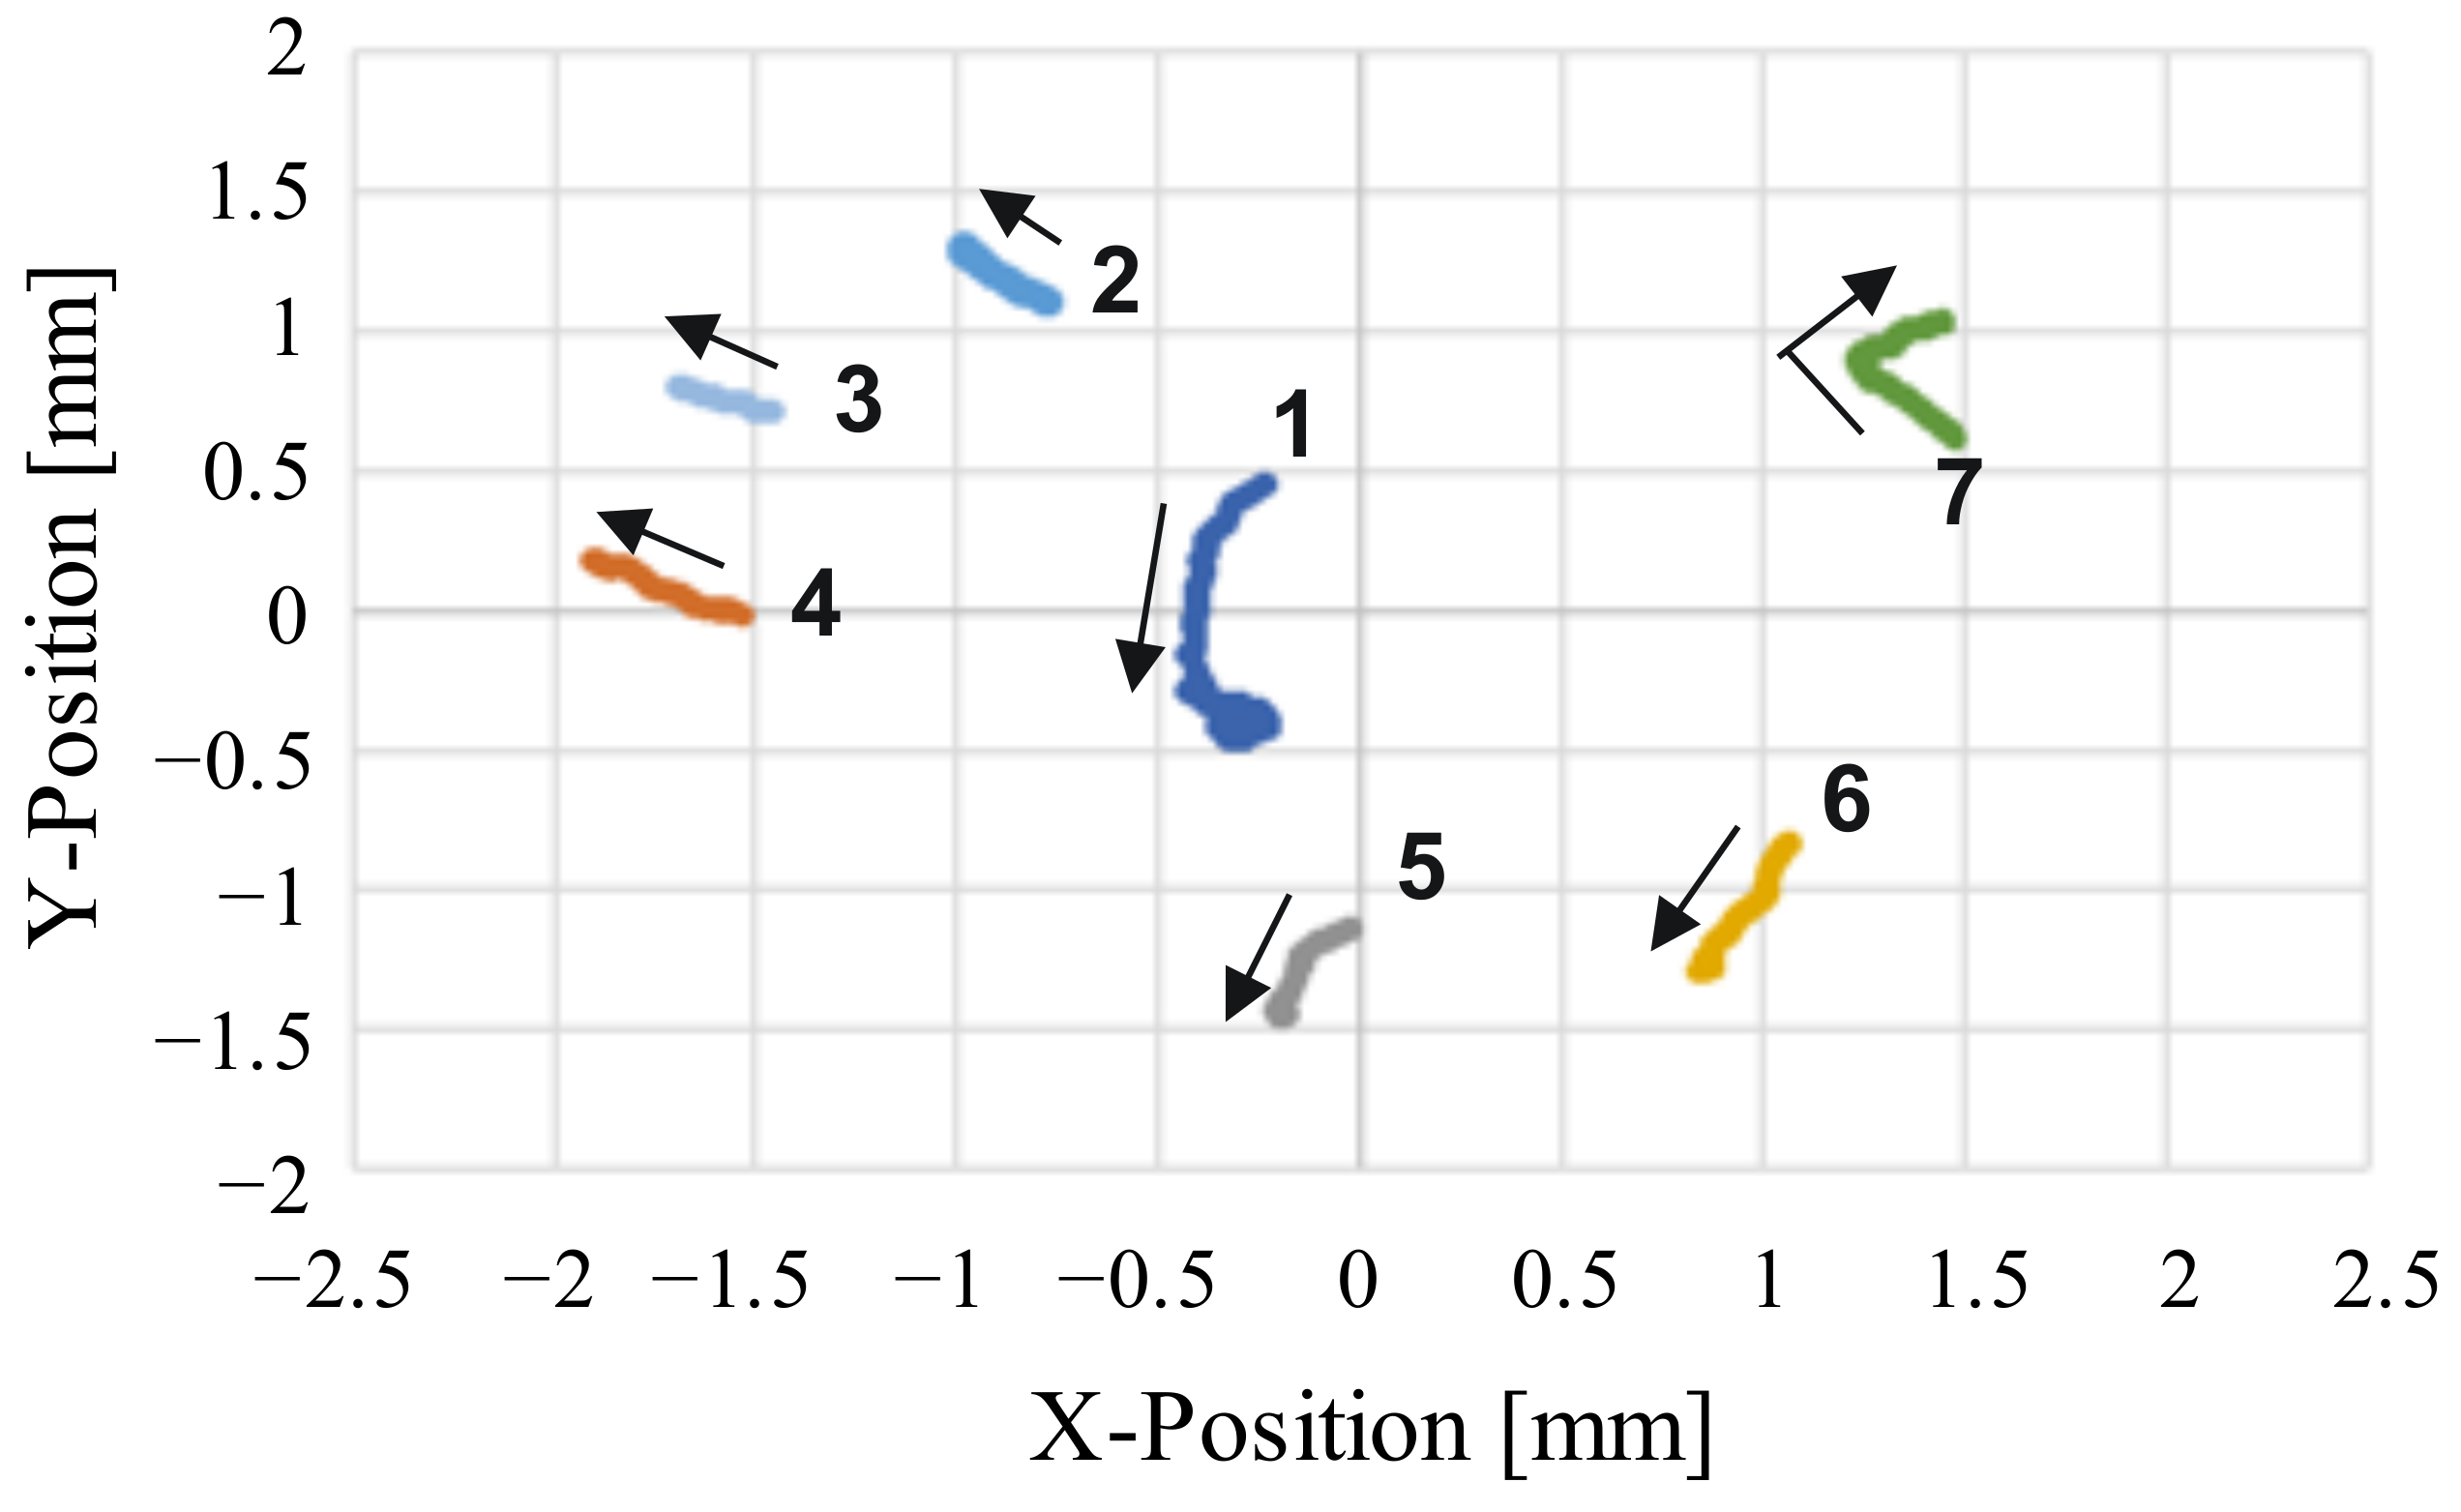
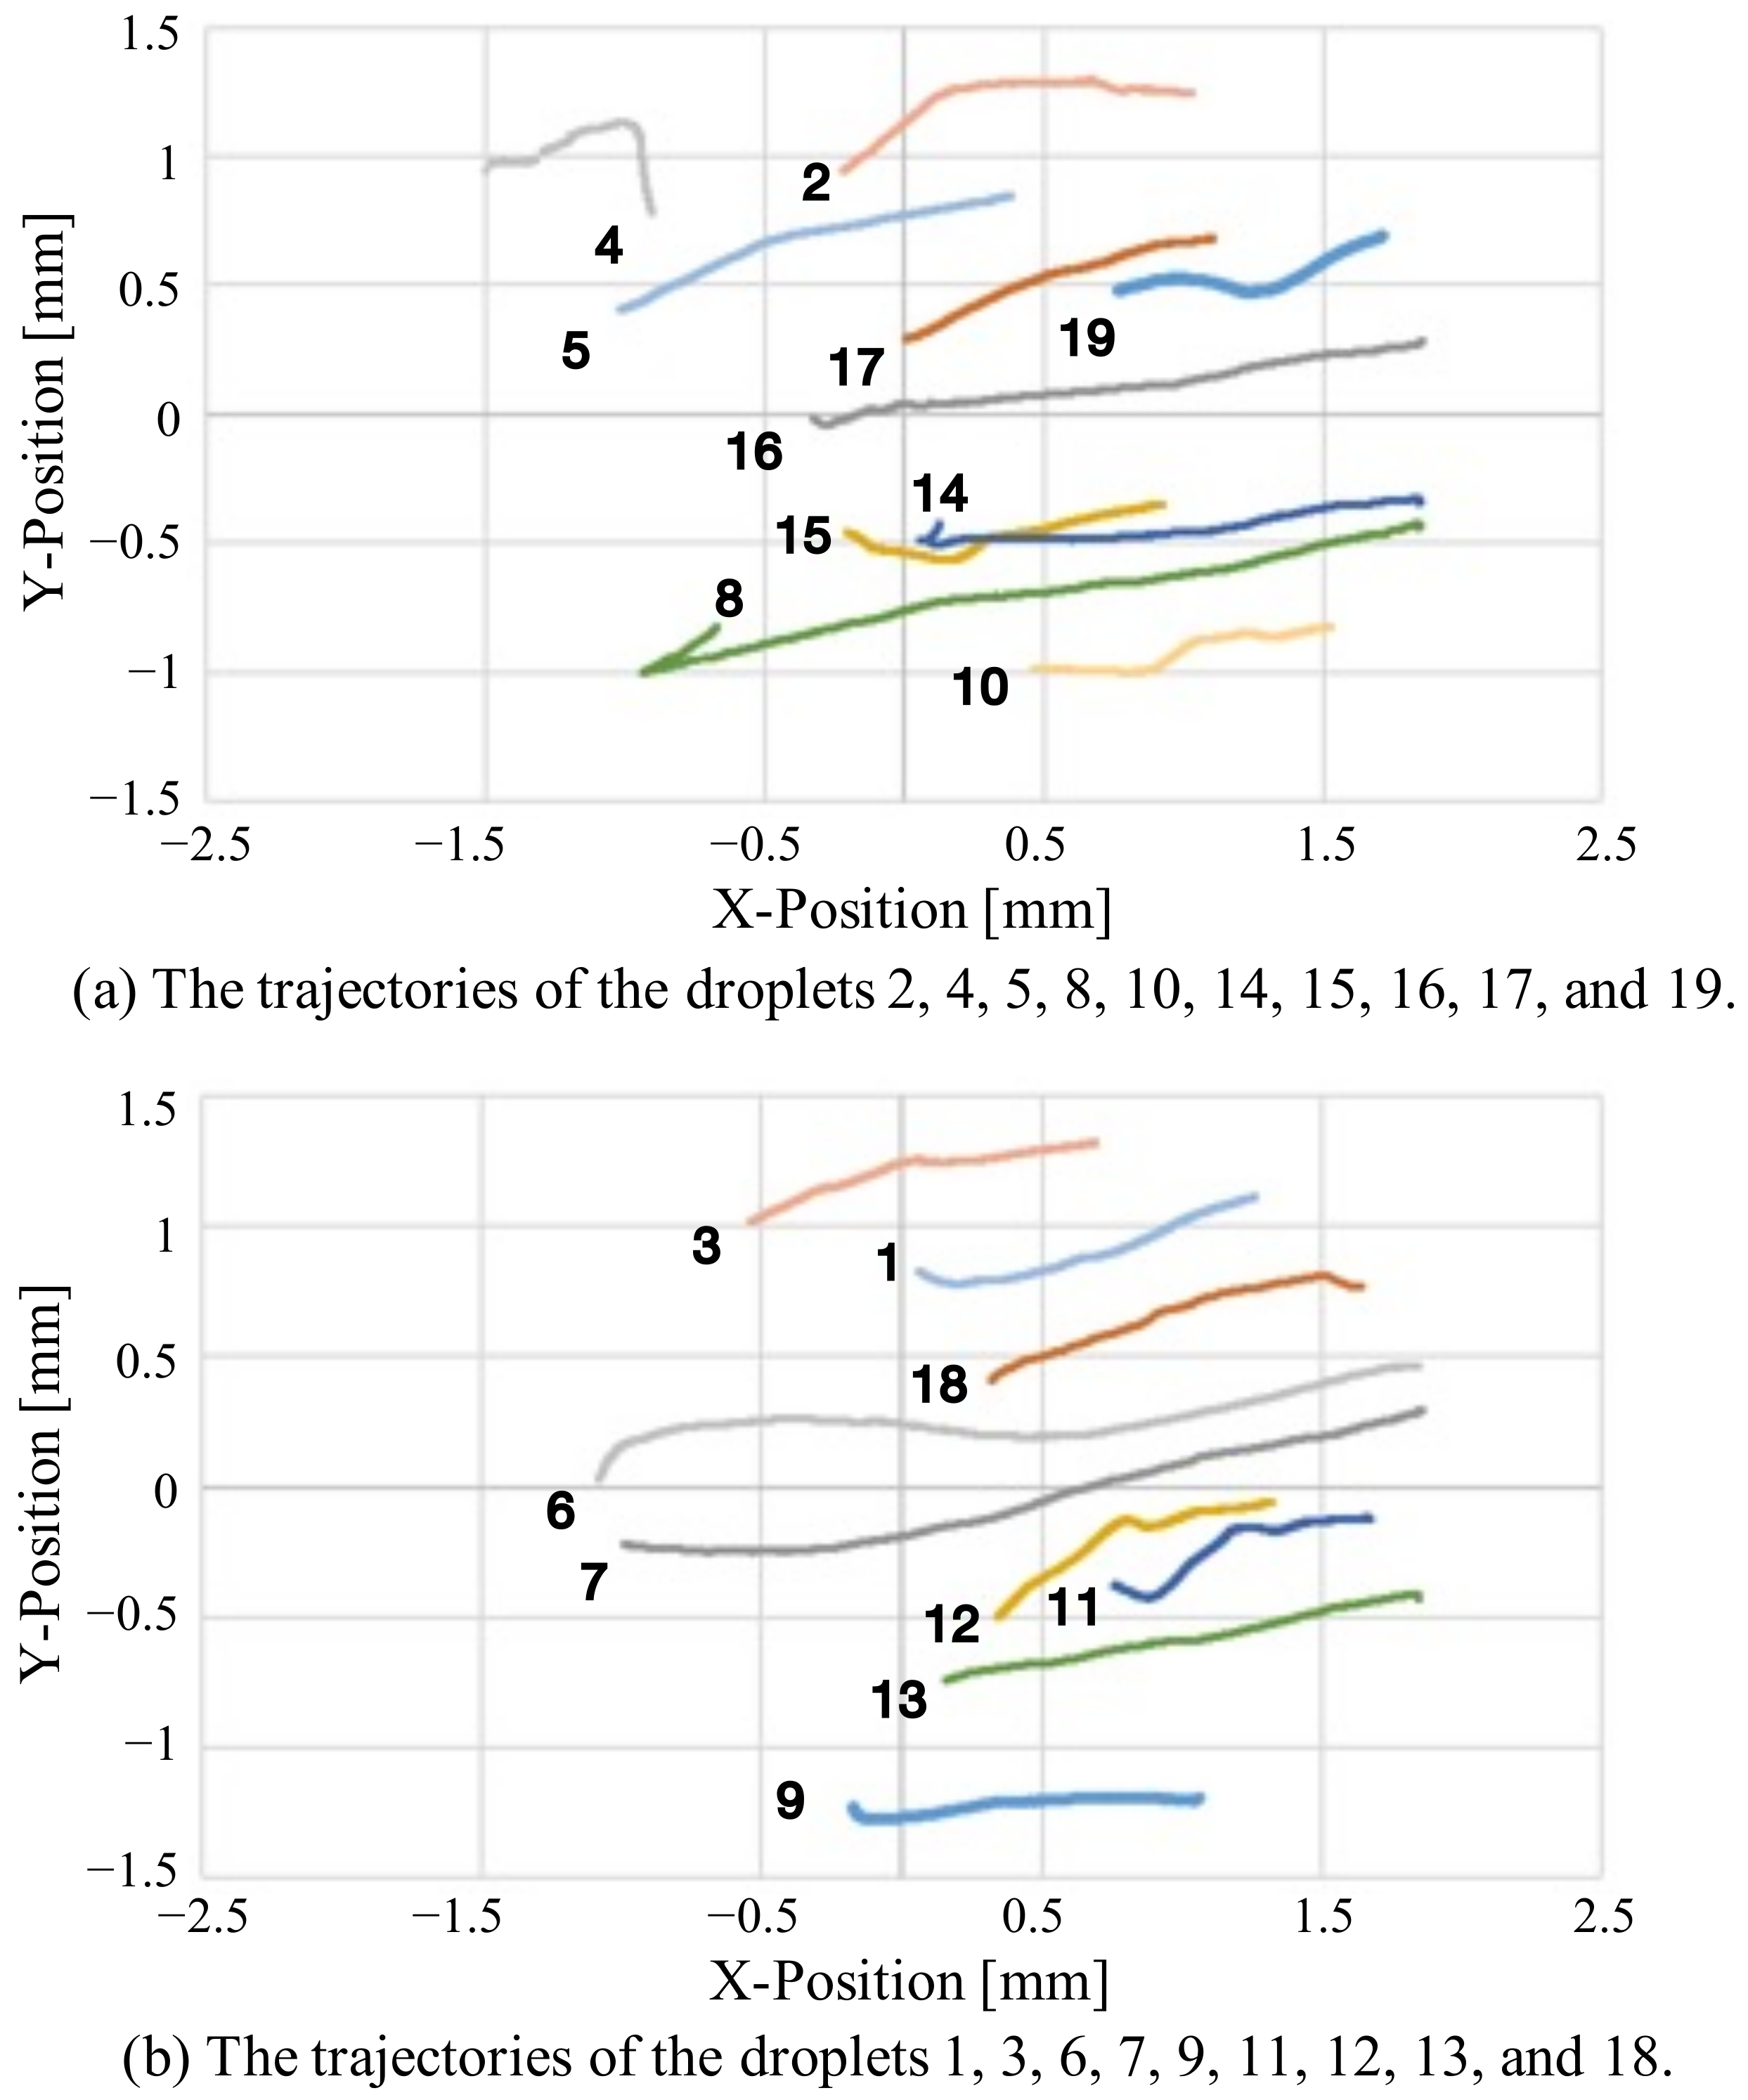
3.2. Tracking Experiment for Self-Propelled Droplets
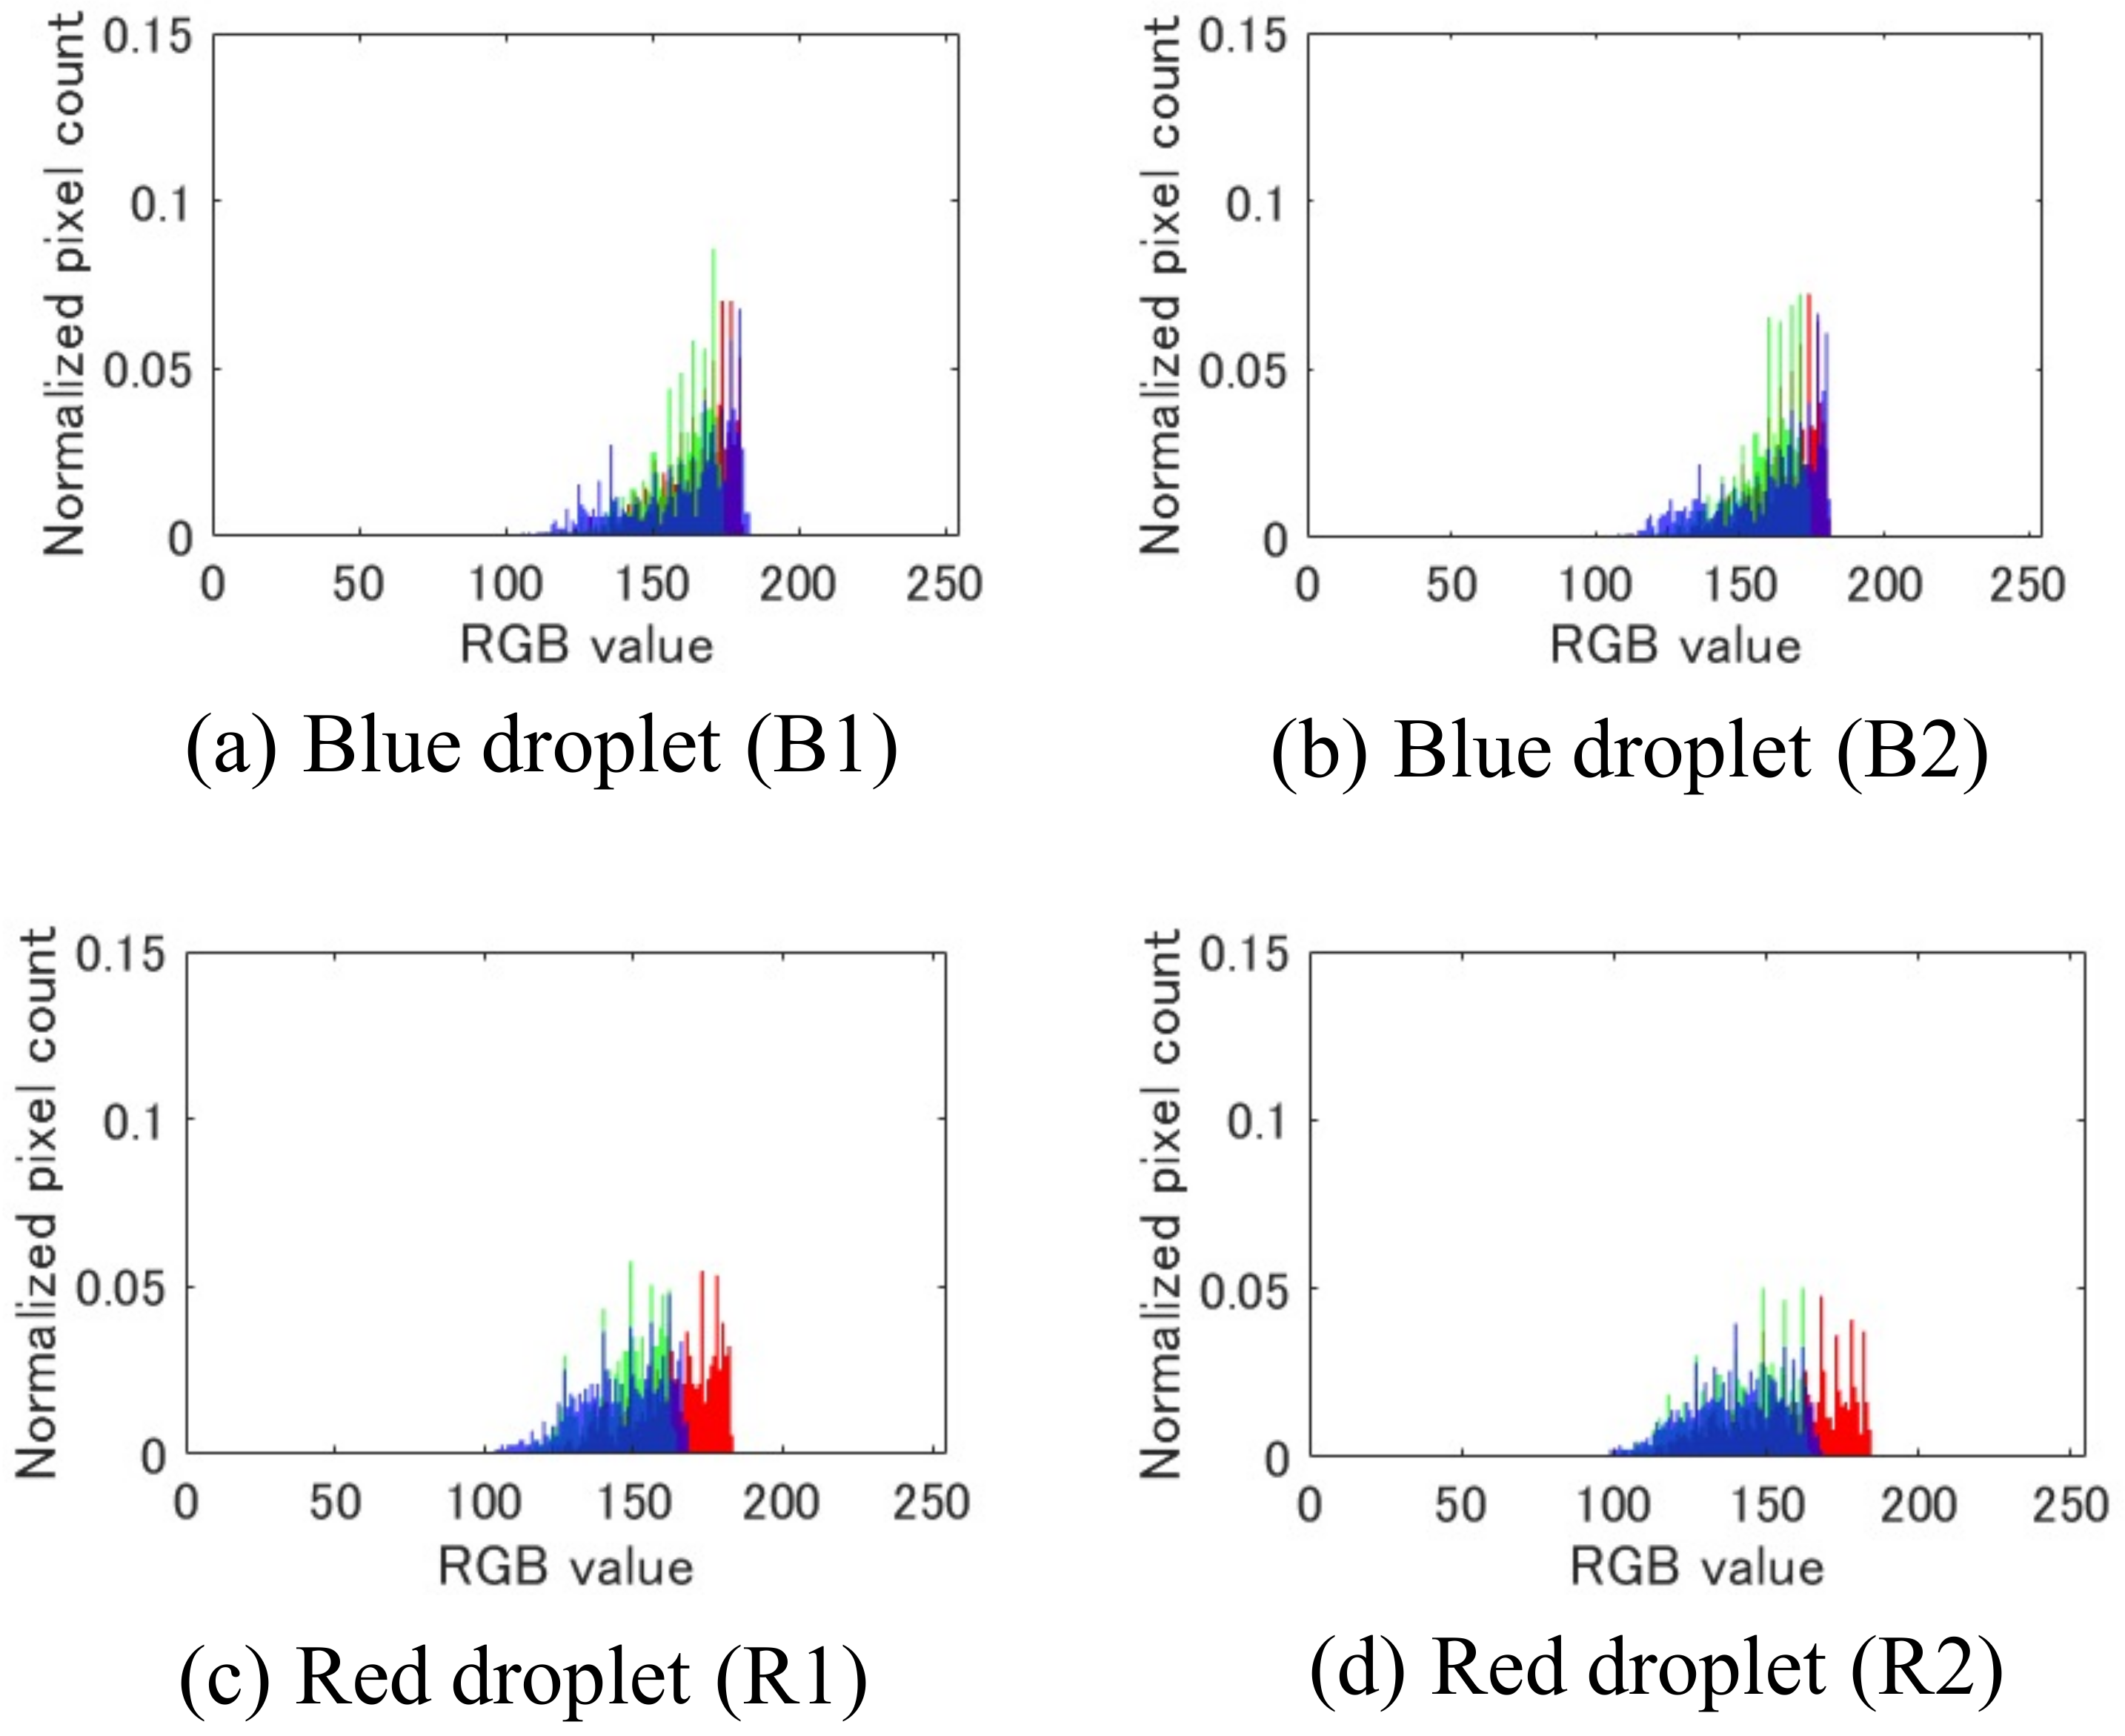
3.3. Color Identification of Self-Propelled Droplets
4. Conclusions
Author Contributions
Funding
Institutional Review Board Statement
Informed Consent Statement
Data Availability Statement
Conflicts of Interest
References
- Paxton, W.F.; Kistler, K.C.; Olmeda, C.C.; Sen, A.; St. Angelo, S.K.; Cao, Y.; Mallouk, T.E.; Lammert, P.E.; Crespi, V.H. Catalytic Nanomotors: Autonomous Movement of Striped Nanorods. J. Am. Chem. Soc. 2004, 124, 13424–13431. [Google Scholar]
- Ikezoe, Y.; Washino, G.; Uemura, T.; Kitagawa, S.; Matsui, H. Autonomous motors of a metal–organic framework powered by reorganization of self-assembled peptides at interfaces. Nat. Mater. 2012, 11, 1081–1085. [Google Scholar] [CrossRef] [PubMed] [Green Version]
- Li, J.; Yu, X.; Xu, M.; Liu, W.; Sandraz, E.; Lan, H.; Wang, J.; Cohen, S.M. Metal—Organic Frameworks as Micromotors with Tunable Engines and Brakes. Am. Chem. Soc. 2017, 139, 611–614. [Google Scholar]
- Tan, T.T.Y.; Cham, J.T.M.; Reithofer, M.R.; Hor, T.S.A.; Chin, J.M. Motorized Janus metal organic framework crystals. Chem. Commun. 2014, 50, 15175–15178. [Google Scholar]
- Wodlei, F.; Sebilleau, J.; Magnaudet, J.; Pimienta, V. Marangoni-driven flower-like patterning of an evaporating drop spreading on a liquid substrate. Nat. Commun. 2018, 9, 1–12. [Google Scholar]
- Toyota, T.; Maru, N.; Hanczyc, M.; Ikegami, T.; Sugawara, T. Self-propelled oil droplets consuming “fuel” surfactant. J. Am. Chem. Soc. 2009, 131, 5012–5013. [Google Scholar] [CrossRef] [PubMed]
- Čejková, J.; Schwarzenberger, K.; Eckert, K.; Tanaka, S. Dancing performance of organic droplets in aqueous surfactant solutions. Colloids Surf. Physicochem. Eng. Asp. 2019, 566, 141–147. [Google Scholar] [CrossRef]
- Miura, S.; Banno, T.; Tonooka, T.; Osaki, T.; Takeuchi, S.; Toyota, T. pH-induced motion control of self-propelled oil droplets using a hydrolyzable gemini cationic surfactant. Langmuir 2014, 30, 7977–7985. [Google Scholar] [PubMed]
- Lagzi, I.; Soh, S.; Wesson, P.J.; Browne, K.P.; Grzybowski, B.A. Maze solving by chemotactic droplets. J. Am. Chem. Soc. 2010, 132, 1198–1199. [Google Scholar] [CrossRef] [PubMed]
- Jin, C.; Krüger, C.; Maass, C.C. Chemotaxis and autochemotaxis of self-propelling droplet swimmers. Proc. Natl. Acad. Sci. USA 2017, 114, 5089–5094. [Google Scholar] [CrossRef] [PubMed] [Green Version]
- Ban, T.; Yamagami, T.; Nakata, H.; Okano, Y. pH-dependent motion of self-propelled droplets due to Marangoni effect at neutral pH. Langmuir 2013, 29, 2554–2561. [Google Scholar] [CrossRef] [PubMed]
- Banno, T.; Tanaka, Y.; Asakura, K.; Toyota, T. Self-propelled oil droplets and their morphological change to giant vesicles induced by a surfactant solution at low pH. Langmuir 2016, 32, 9591–9597. [Google Scholar] [CrossRef] [PubMed]
- Hanczyc, M.M.; Toyota, T.; Ikegami, T.; Packard, N.; Sugawara, T. Fatty acid chemistry at the oil-water interface: Self-propelled oil droplets. J. Am. Chem. Soc. 2007, 129, 9386–9391. [Google Scholar] [CrossRef] [PubMed]
- Suematsu, N.J.; Mori, Y.; Amemiya, T.; Nakata, S. Oscillation of speed of a self-propelled Belousov–Zhabotinsky droplet. J. Phys. Chem. Lett. 2016, 7, 3424–3428. [Google Scholar] [CrossRef] [PubMed] [Green Version]
- Suematsu, N.J.; Saikusa, K.; Nagata, T.; Izumi, S. Interfacial Dynamics in the Spontaneous Motion of an Aqueous Droplet. Langmuir 2019, 35, 1601–1607. [Google Scholar] [CrossRef] [PubMed]
- Aoyama, T.; Takeno, S.; Hano, K.; Takasu, M.; Takeuchi, M.; Hasegawa, Y. View-expansive Microscope System with Real-time High-resolution Imaging for Simplified Microinjection Experiments. In Proceedings of the IEEE International Conference on Robotics and Automation, Xi’an, China, 30 May–5 June 2021. [Google Scholar]
- Wu, K.; Otto, E.; Suzuki, K. Optimizing two-pass connected-component labeling algorithms. Pattern Anal. Appl. 2009, 12, 117–135. [Google Scholar] [CrossRef]


Publisher’s Note: MDPI stays neutral with regard to jurisdictional claims in published maps and institutional affiliations. |
© 2022 by the authors. Licensee MDPI, Basel, Switzerland. This article is an open access article distributed under the terms and conditions of the Creative Commons Attribution (CC BY) license (https://creativecommons.org/licenses/by/4.0/).
Share and Cite
Aoyama, T.; Yamada, S.; Suematsu, N.J.; Takeuchi, M.; Hasegawa, Y. Visual Sensing System to Investigate Self-Propelled Motion and Internal Color of Multiple Aqueous Droplets. Sensors 2022, 22, 6309. https://doi.org/10.3390/s22166309
Aoyama T, Yamada S, Suematsu NJ, Takeuchi M, Hasegawa Y. Visual Sensing System to Investigate Self-Propelled Motion and Internal Color of Multiple Aqueous Droplets. Sensors. 2022; 22(16):6309. https://doi.org/10.3390/s22166309
Chicago/Turabian StyleAoyama, Tadayoshi, Shoki Yamada, Nobuhiko J. Suematsu, Masaru Takeuchi, and Yasuhisa Hasegawa. 2022. "Visual Sensing System to Investigate Self-Propelled Motion and Internal Color of Multiple Aqueous Droplets" Sensors 22, no. 16: 6309. https://doi.org/10.3390/s22166309