
Tomographic Absorption Spectroscopy for H2O Transport in a Laminar Jet with Inverse Concentration Gradient

 ,
,
Abstract
:1. Introduction
2. Methods
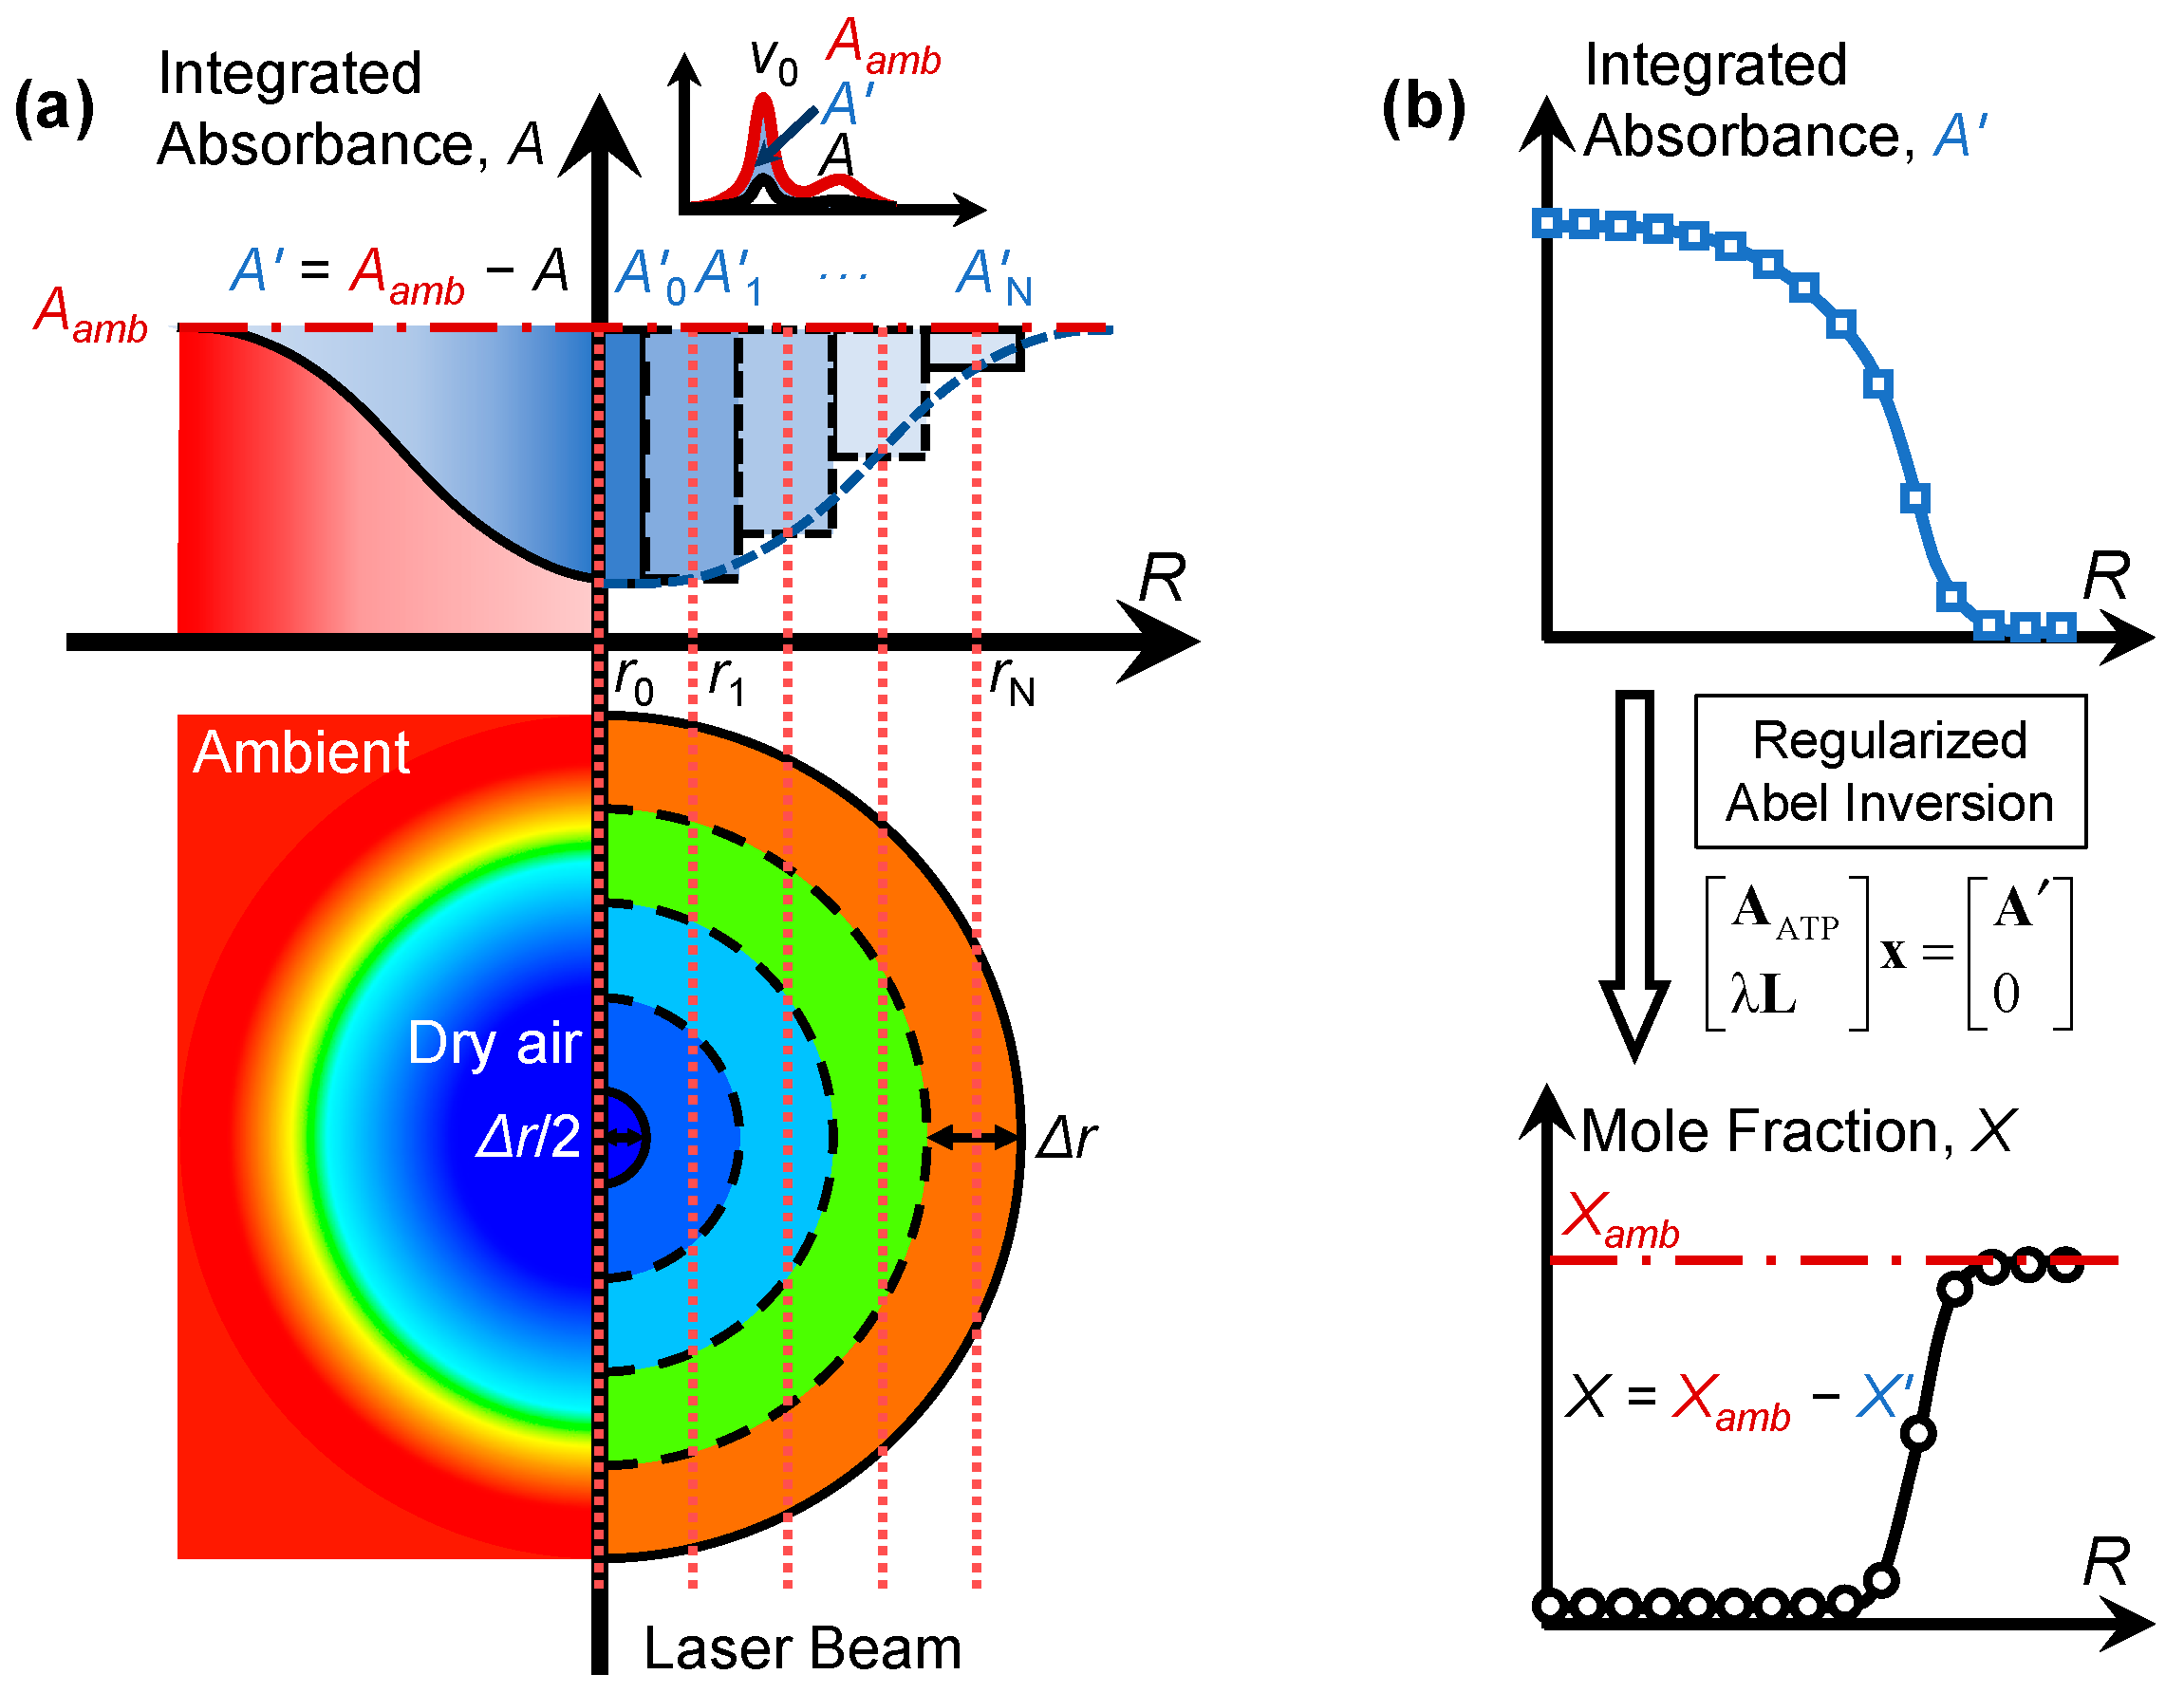
2.1. Theory
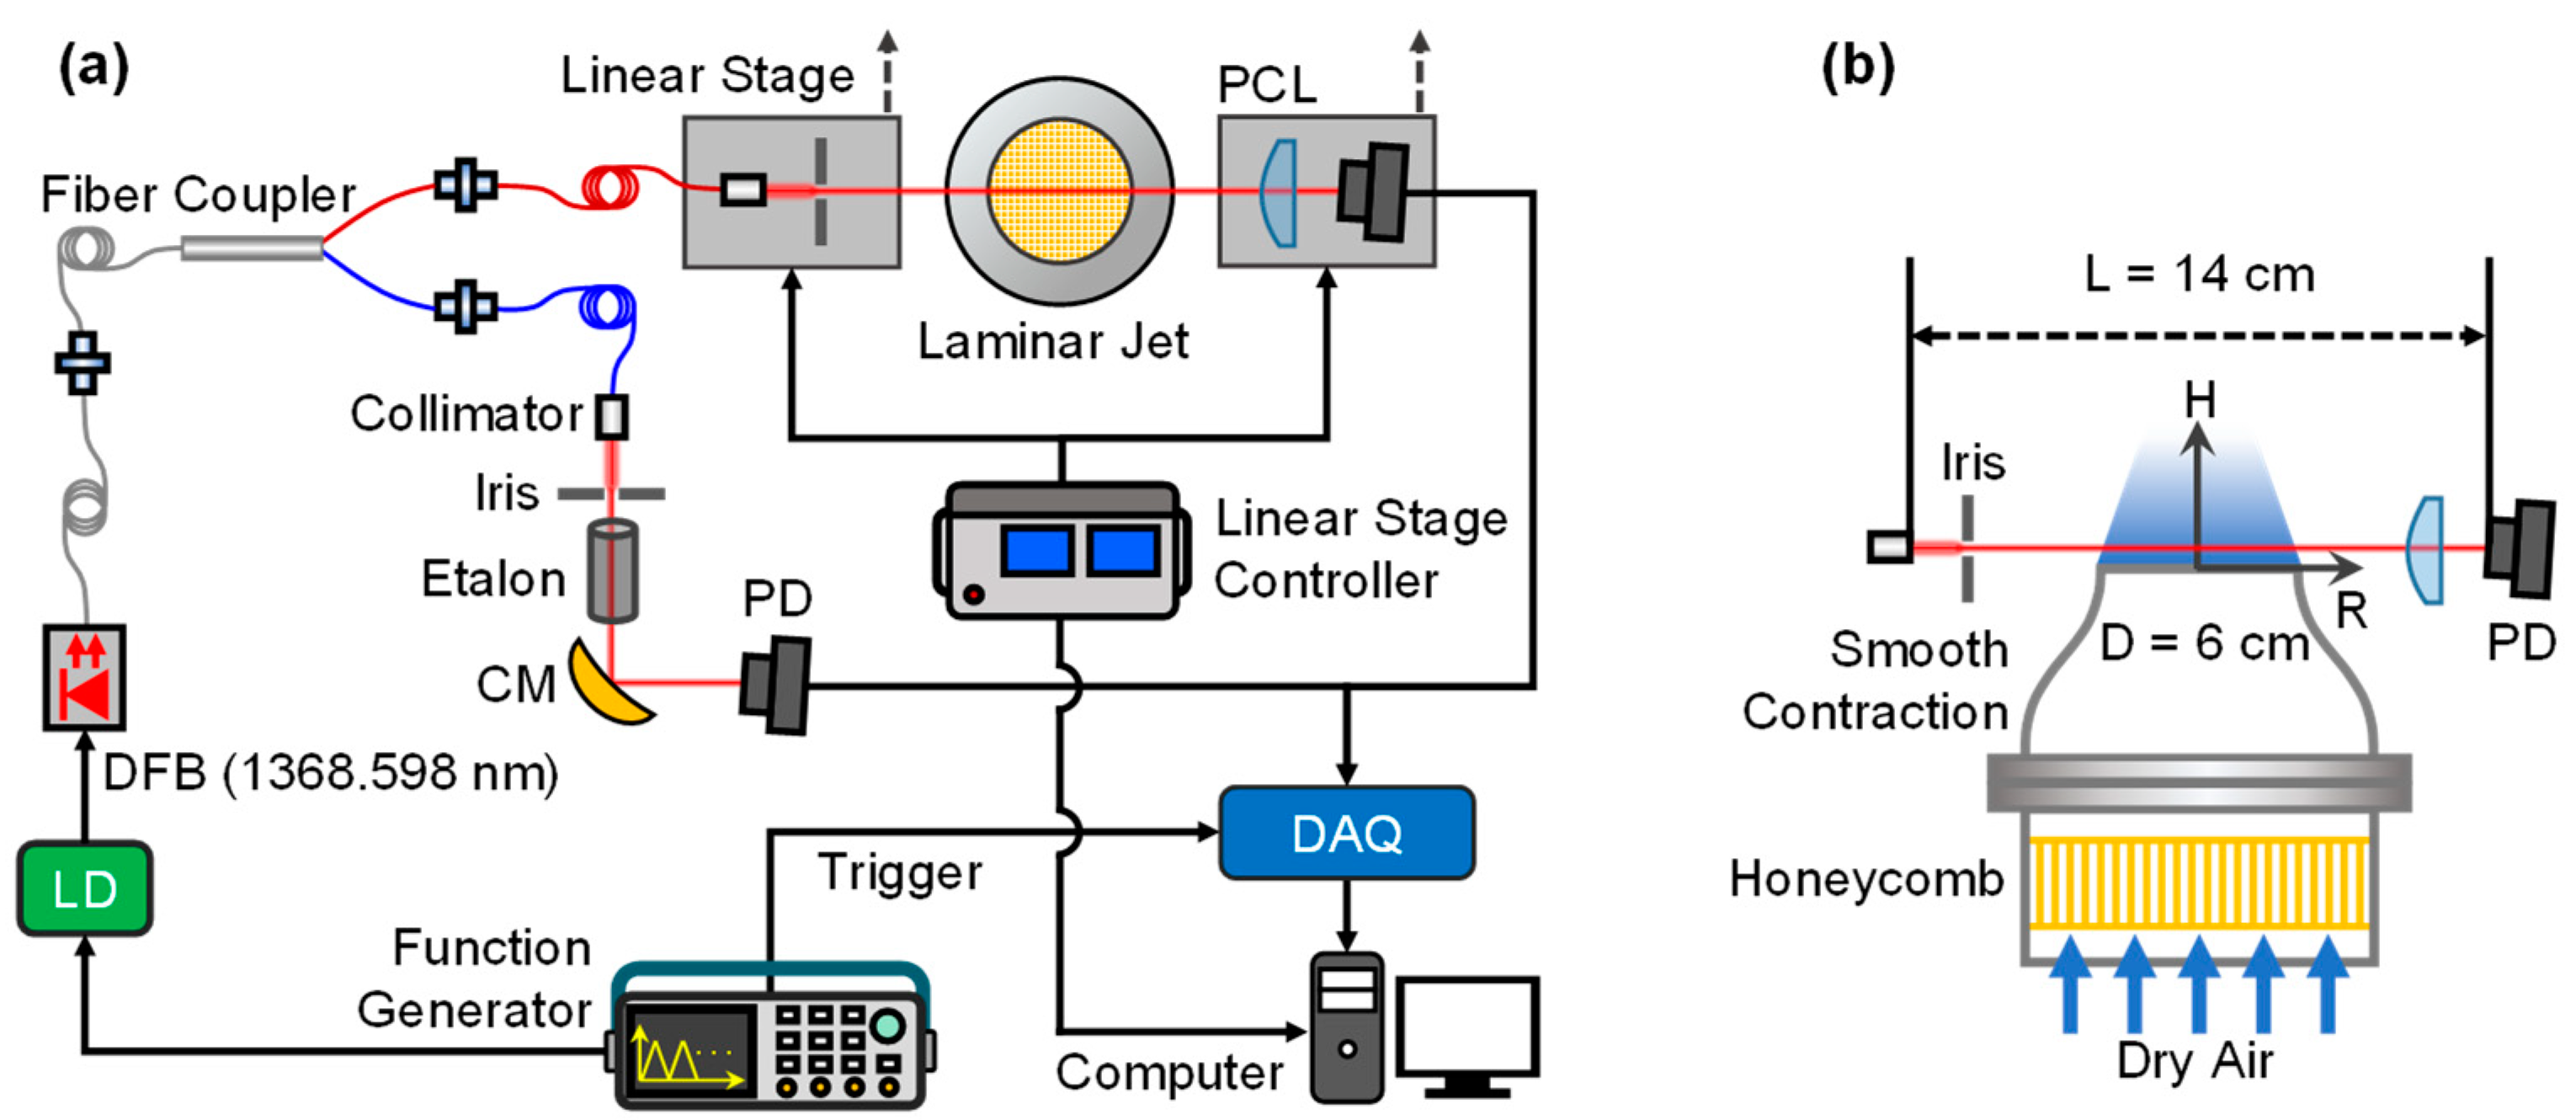
2.2. Experimental Setup
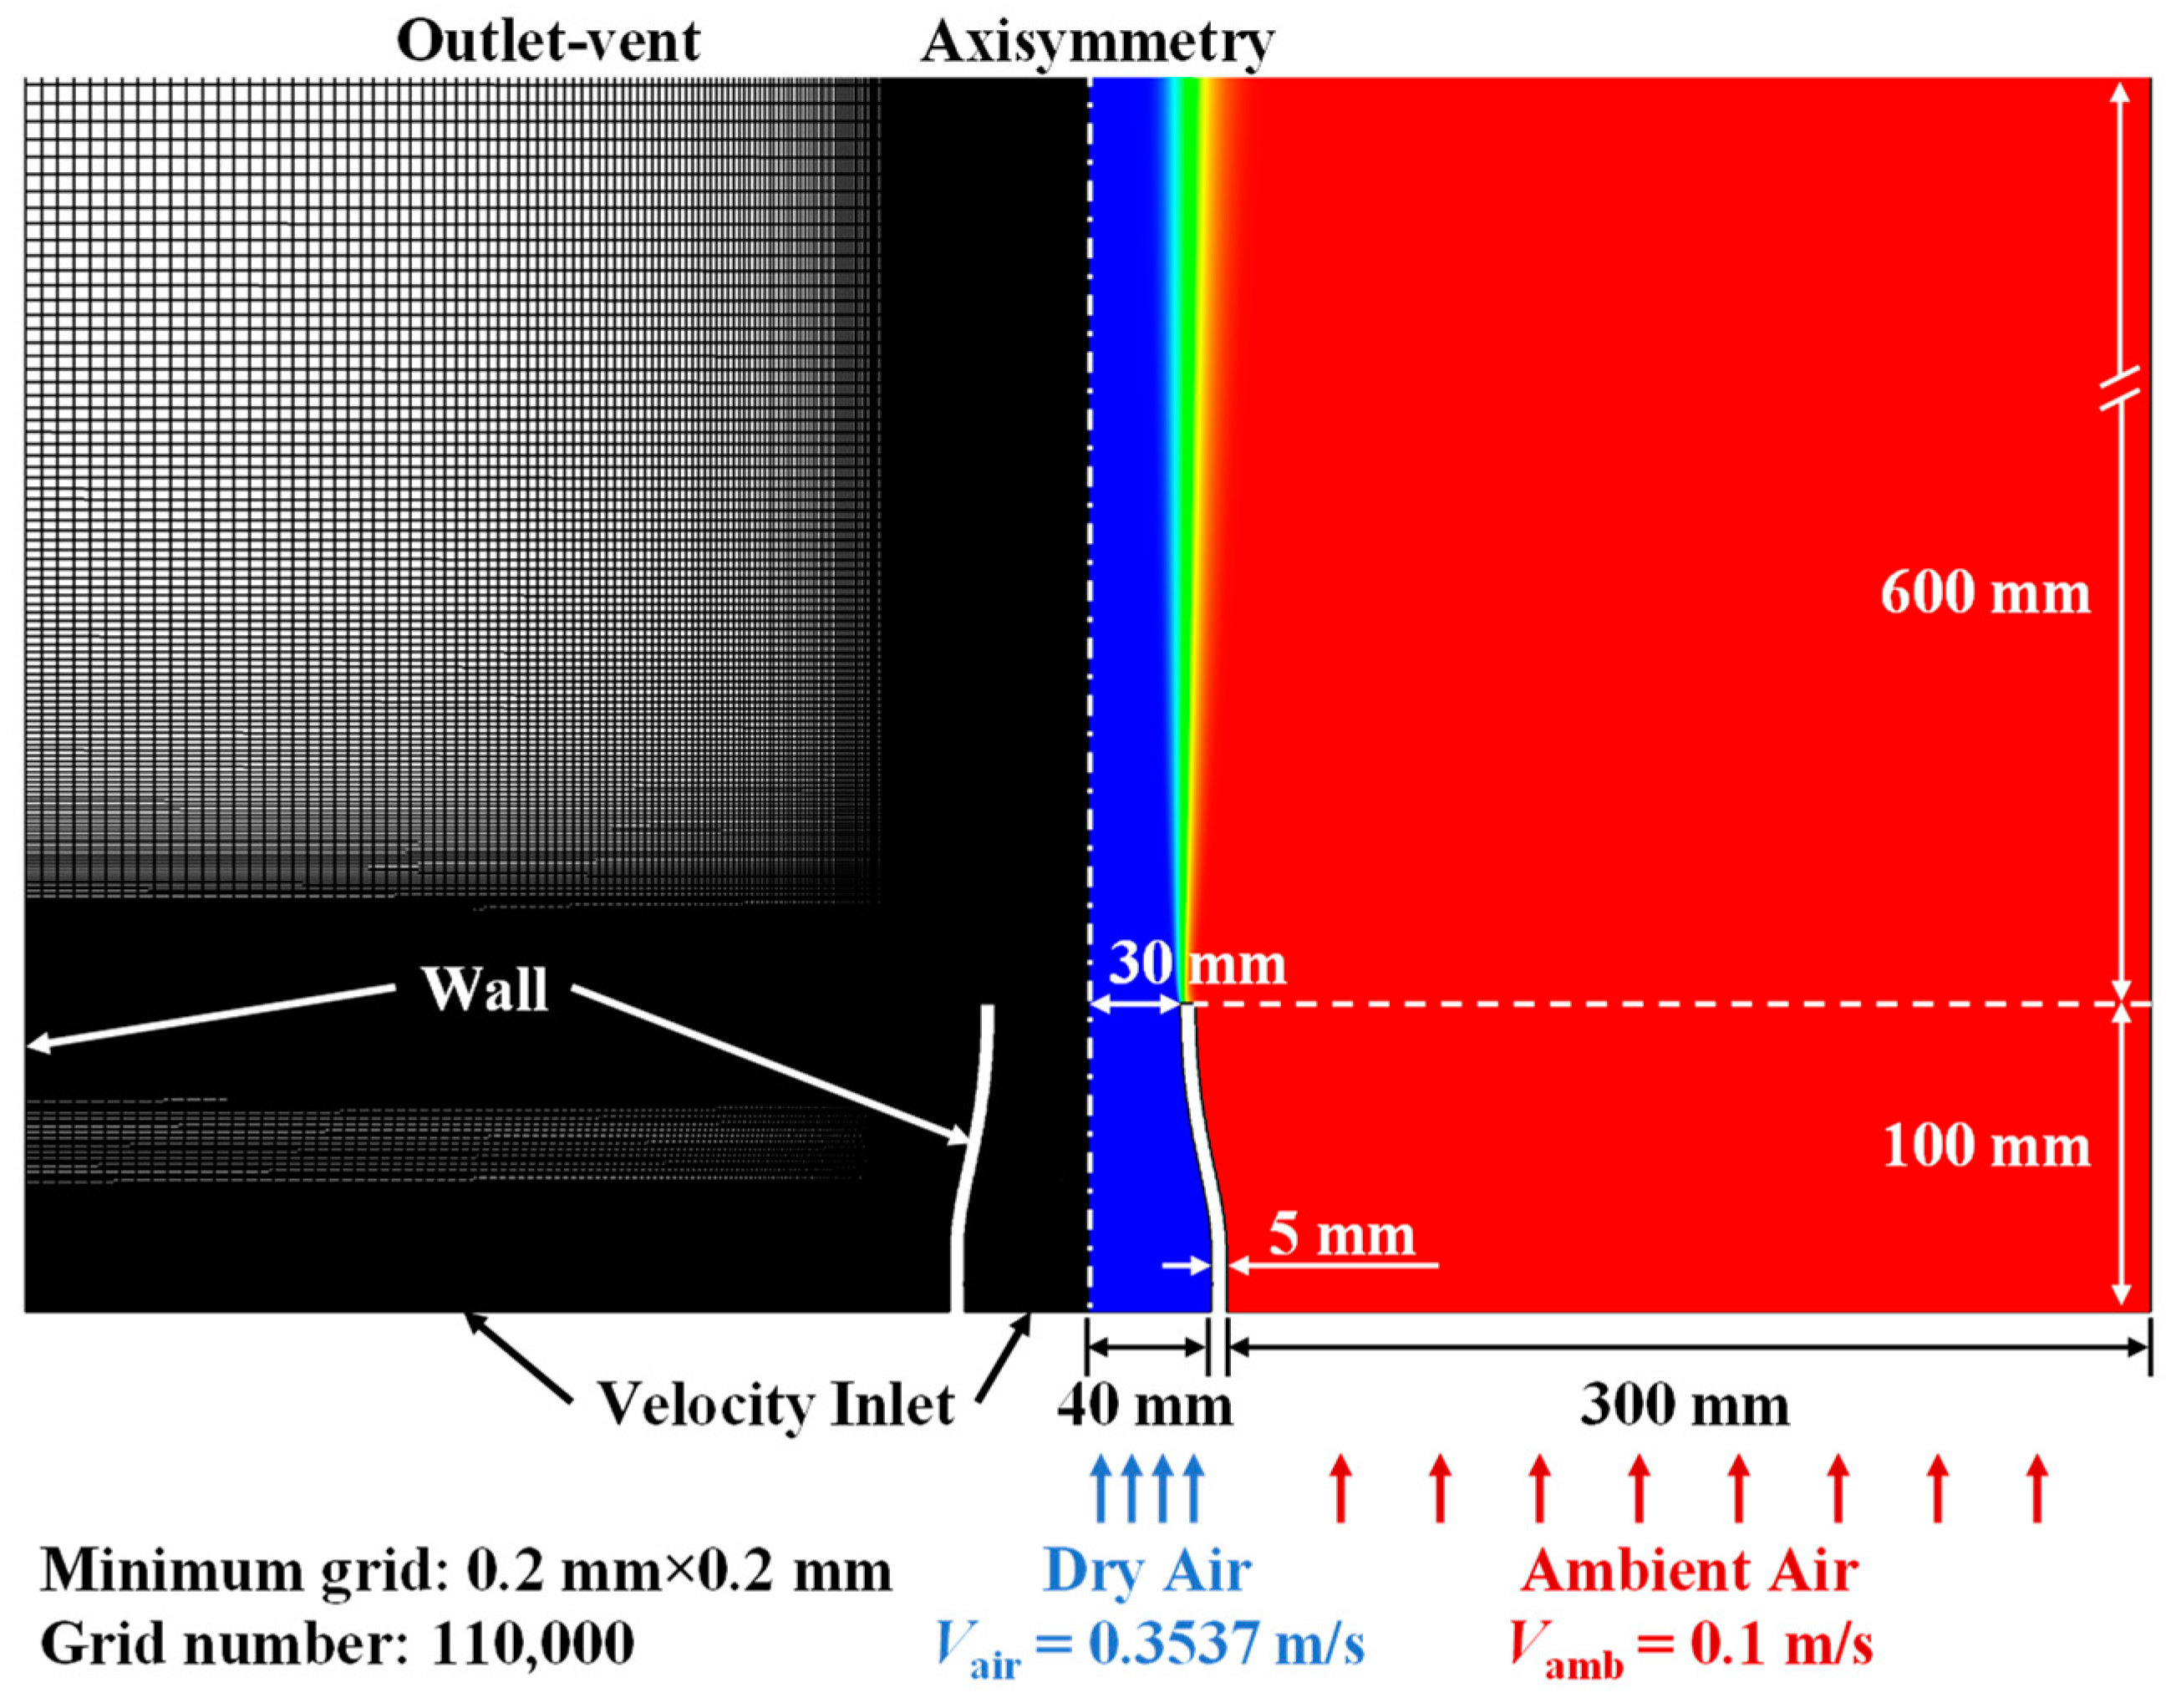
2.3. CFD Simulation
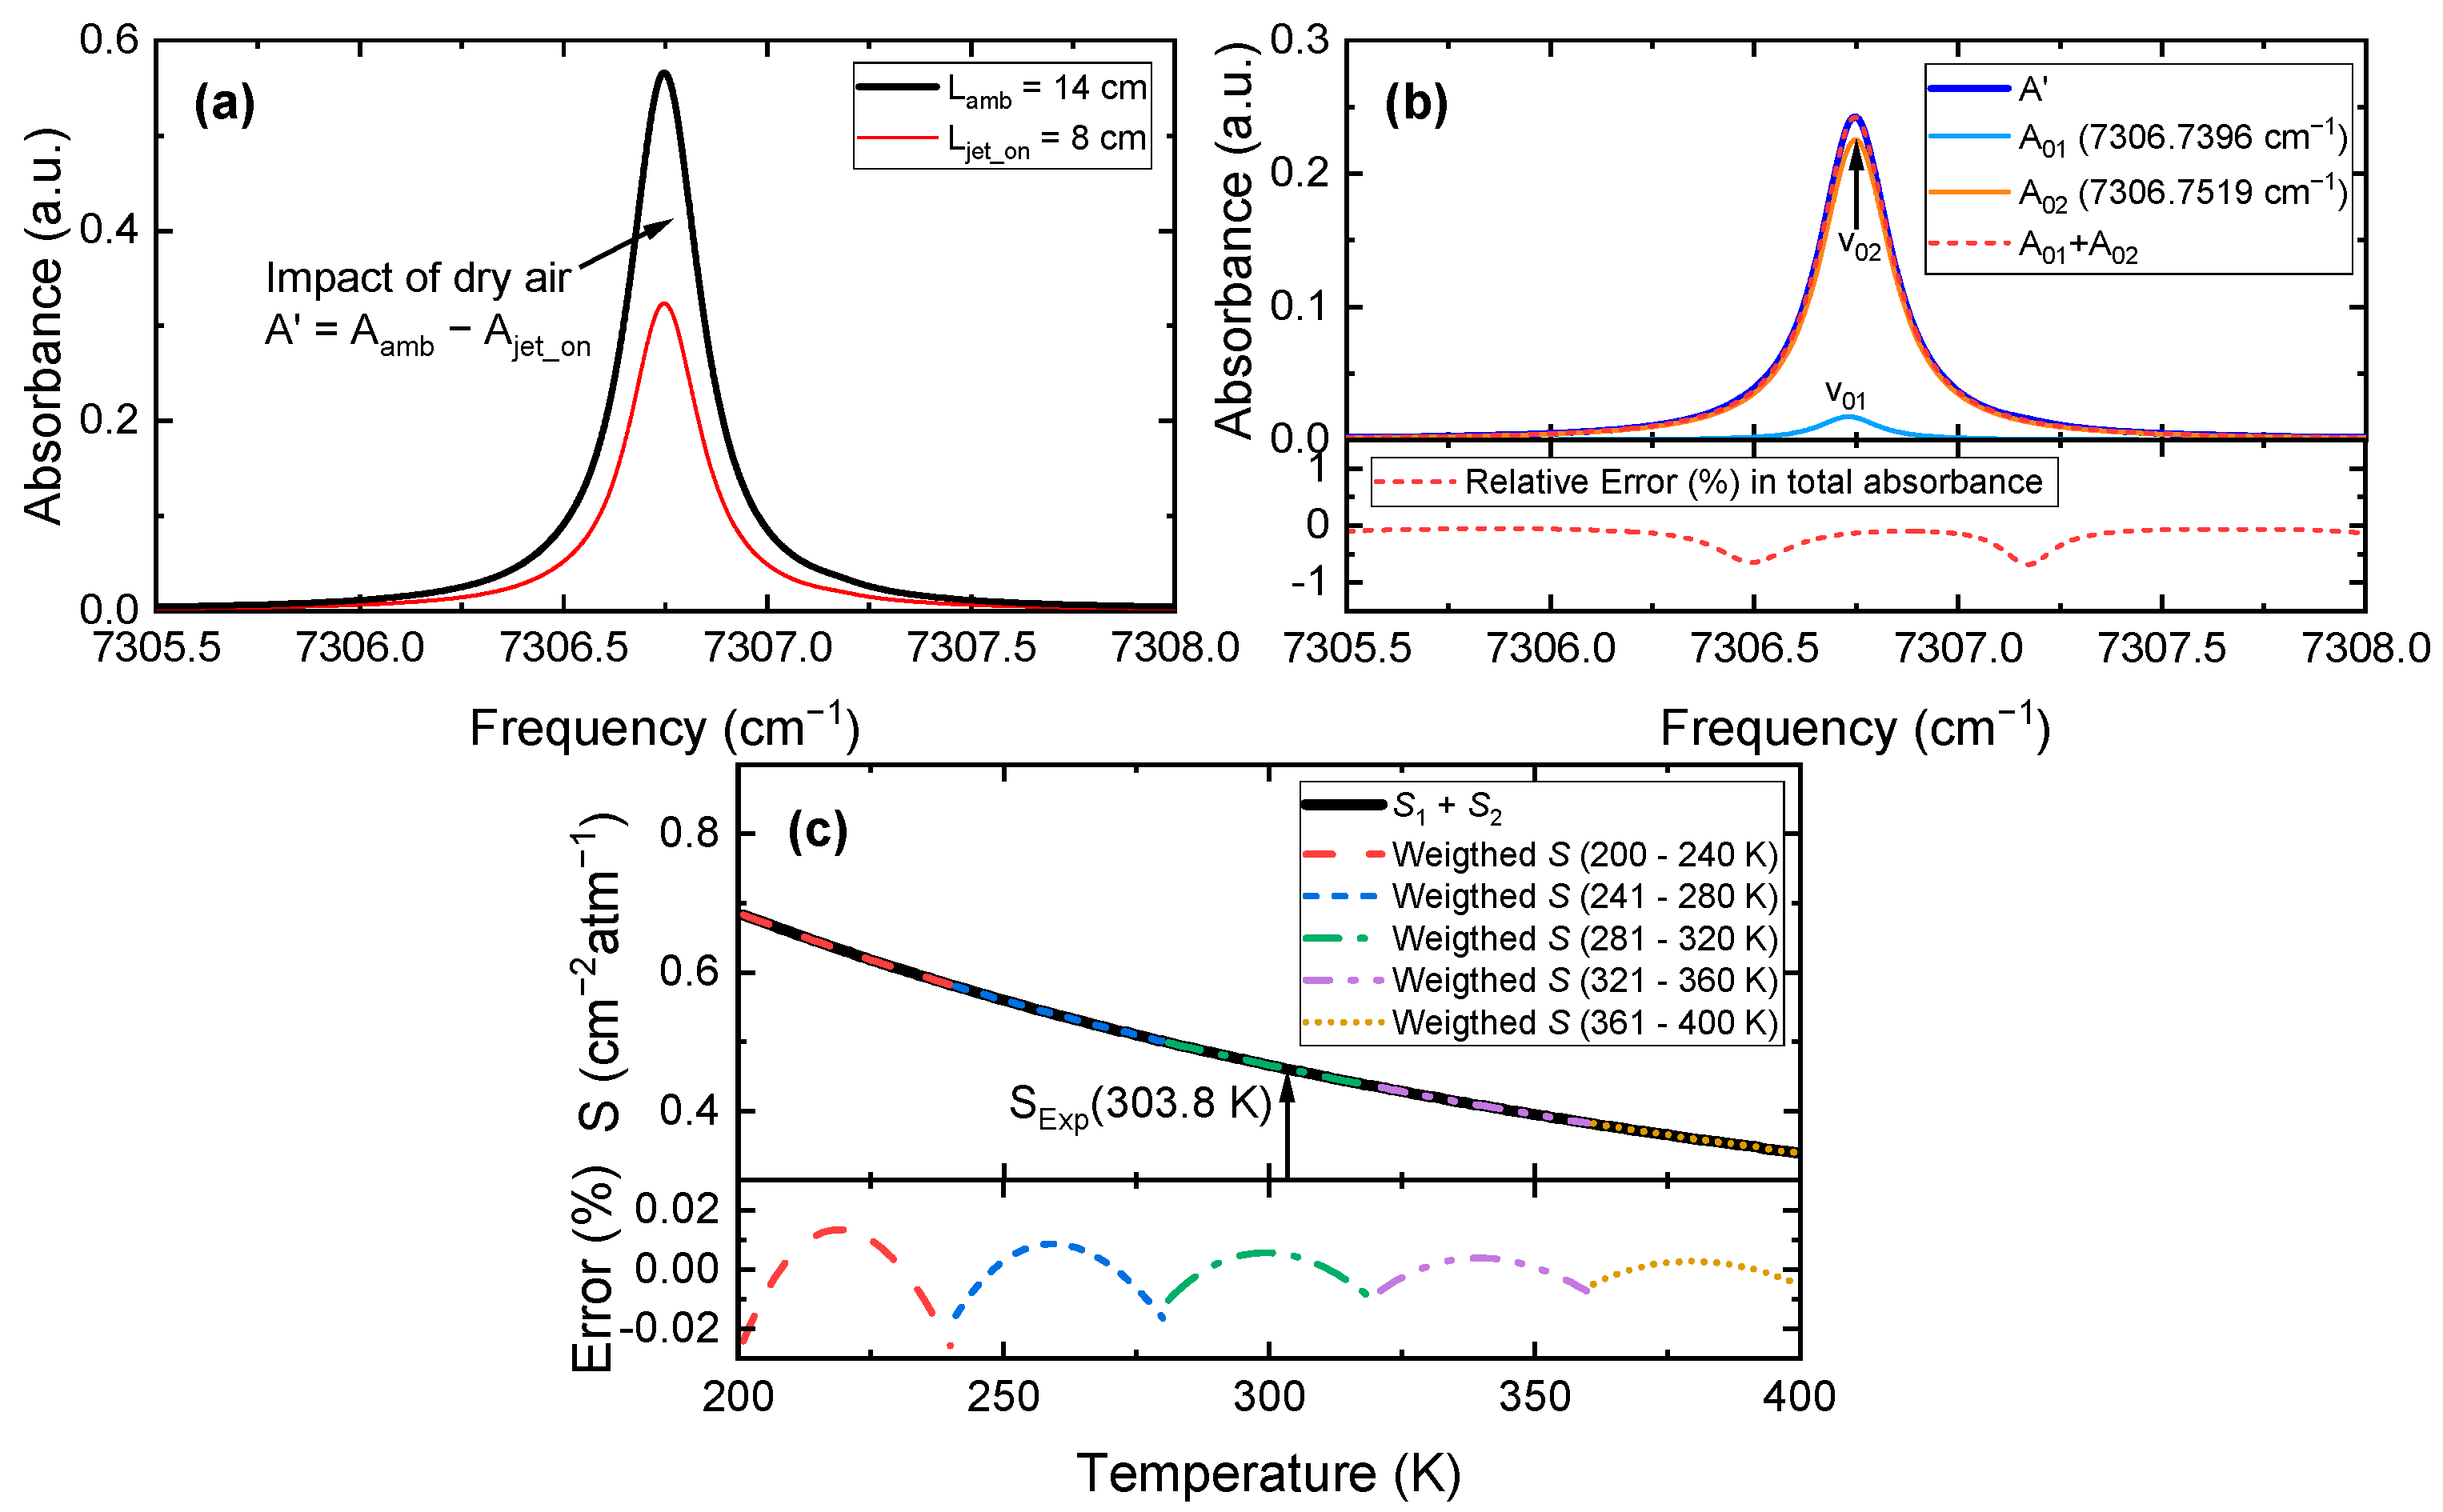
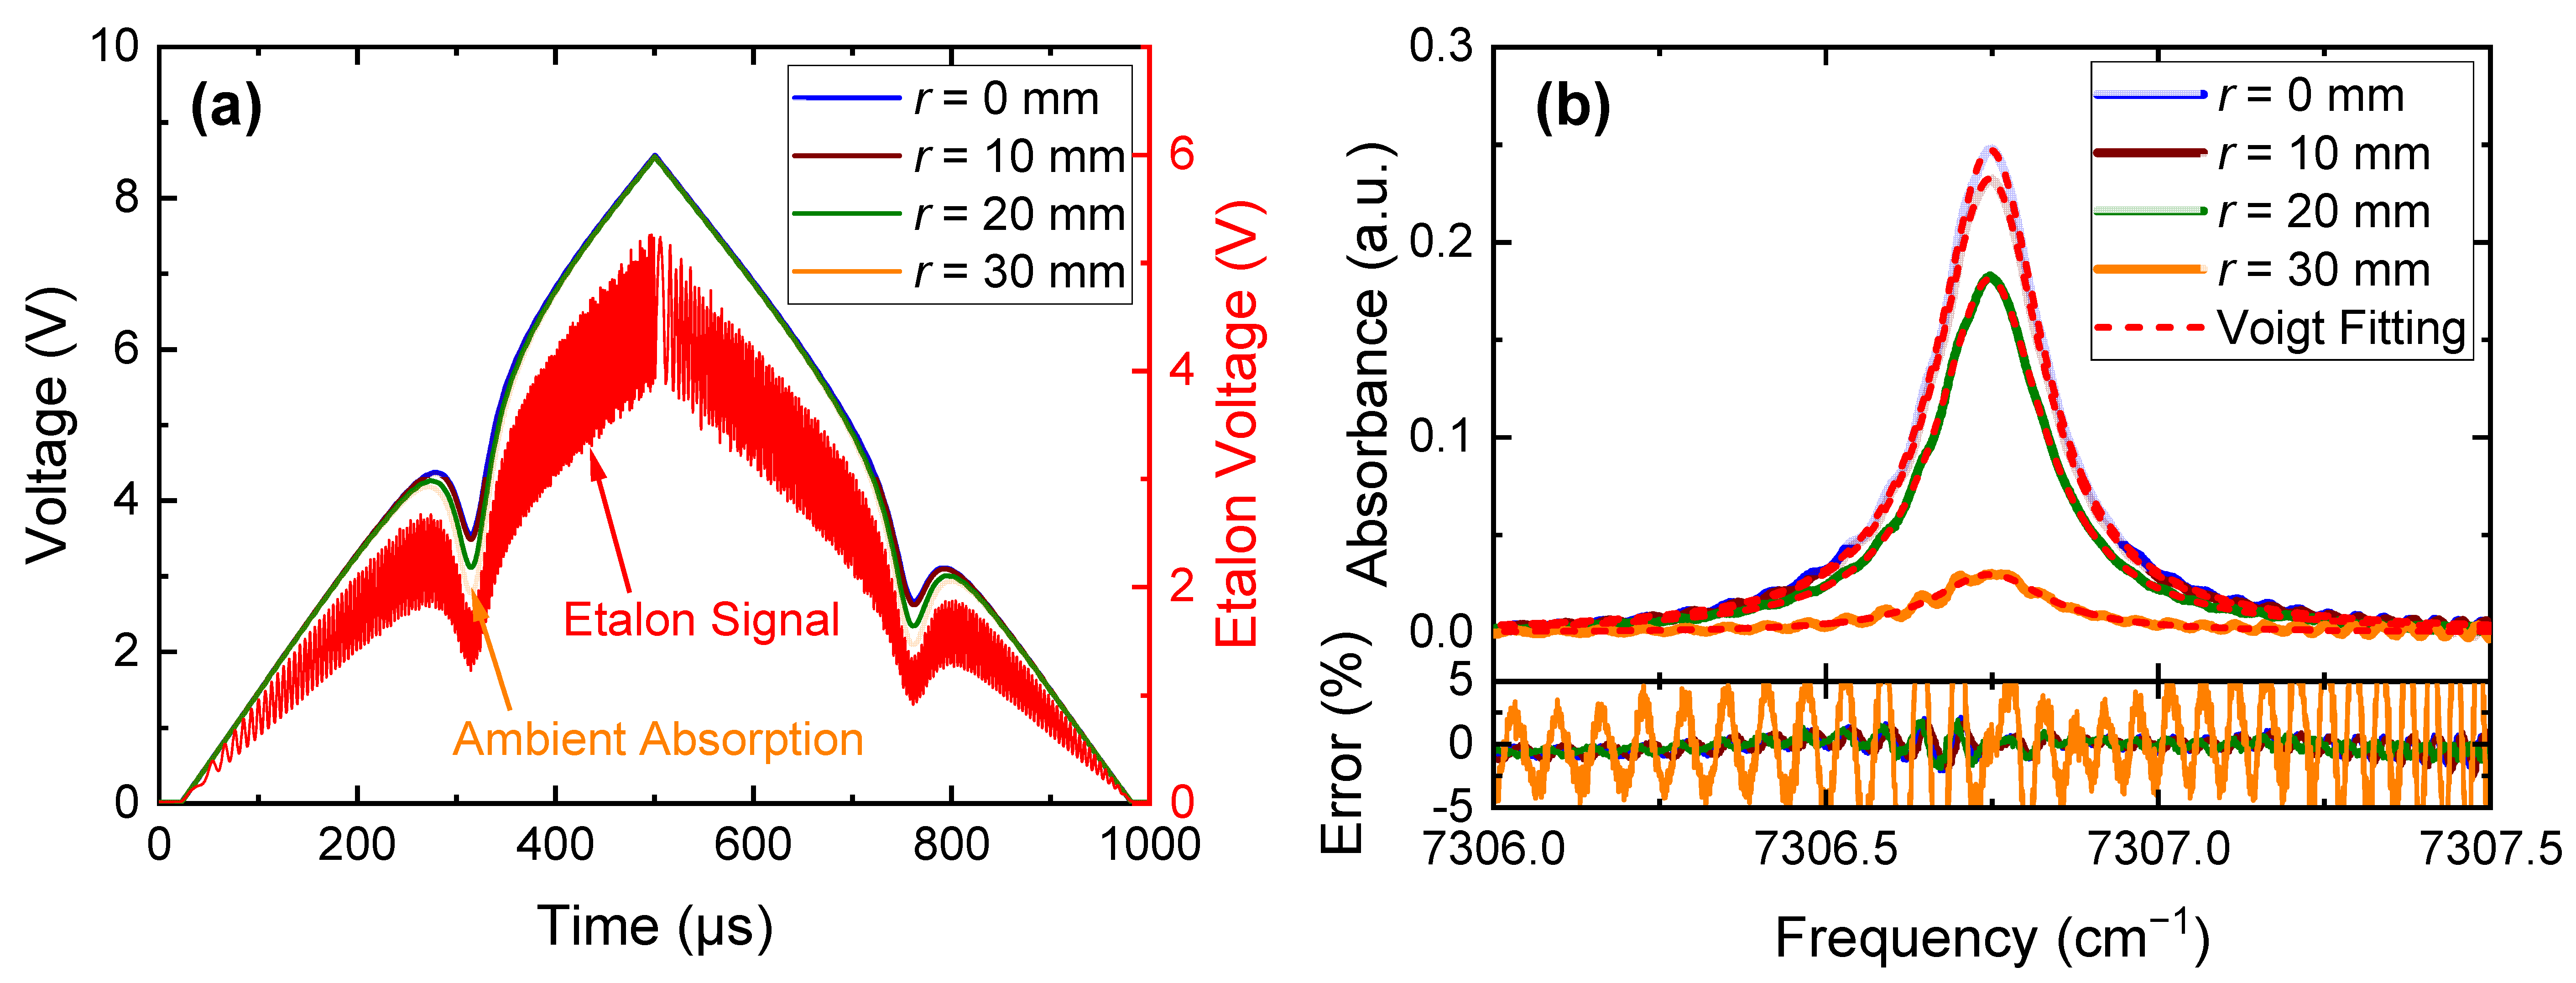
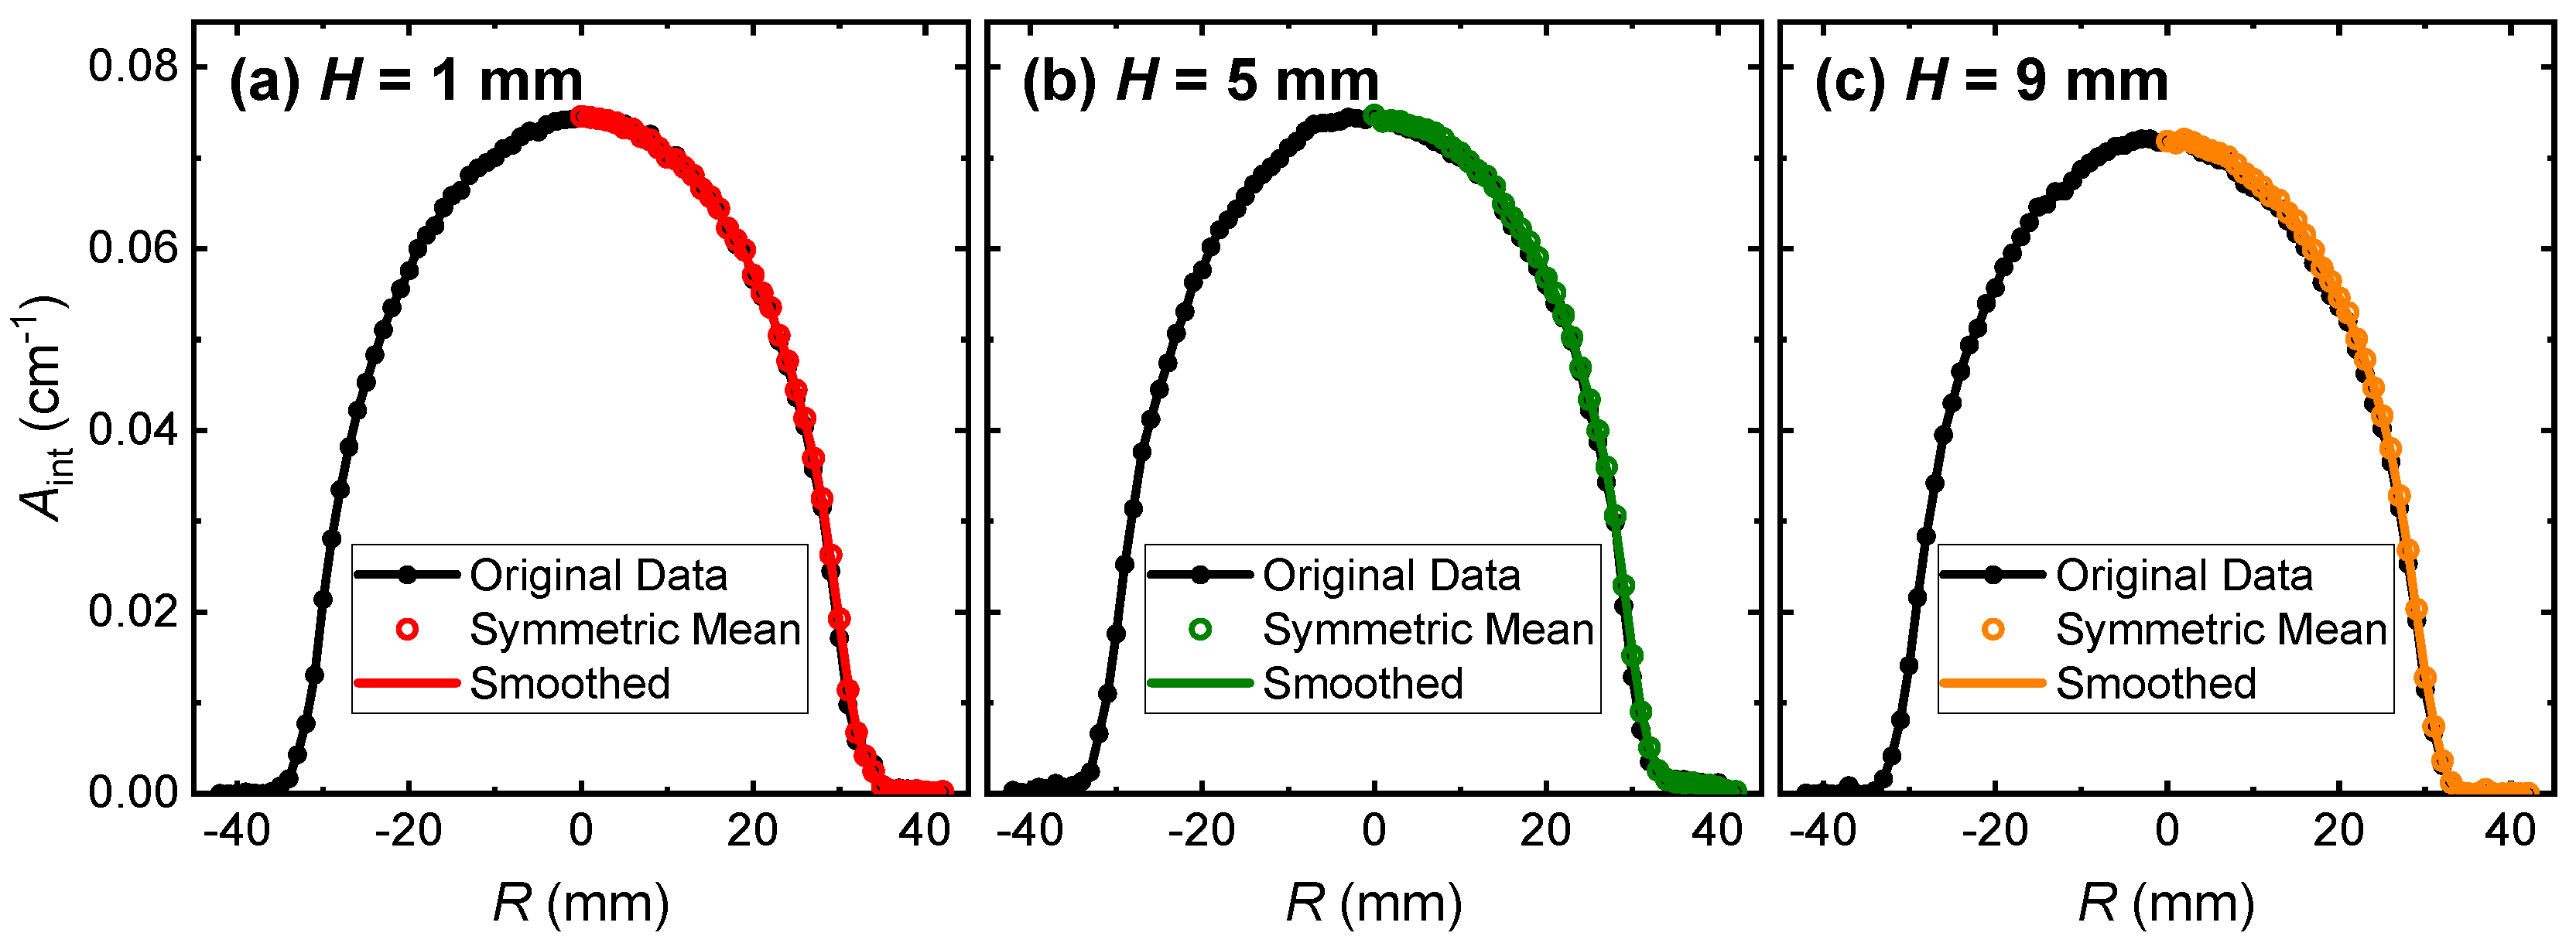
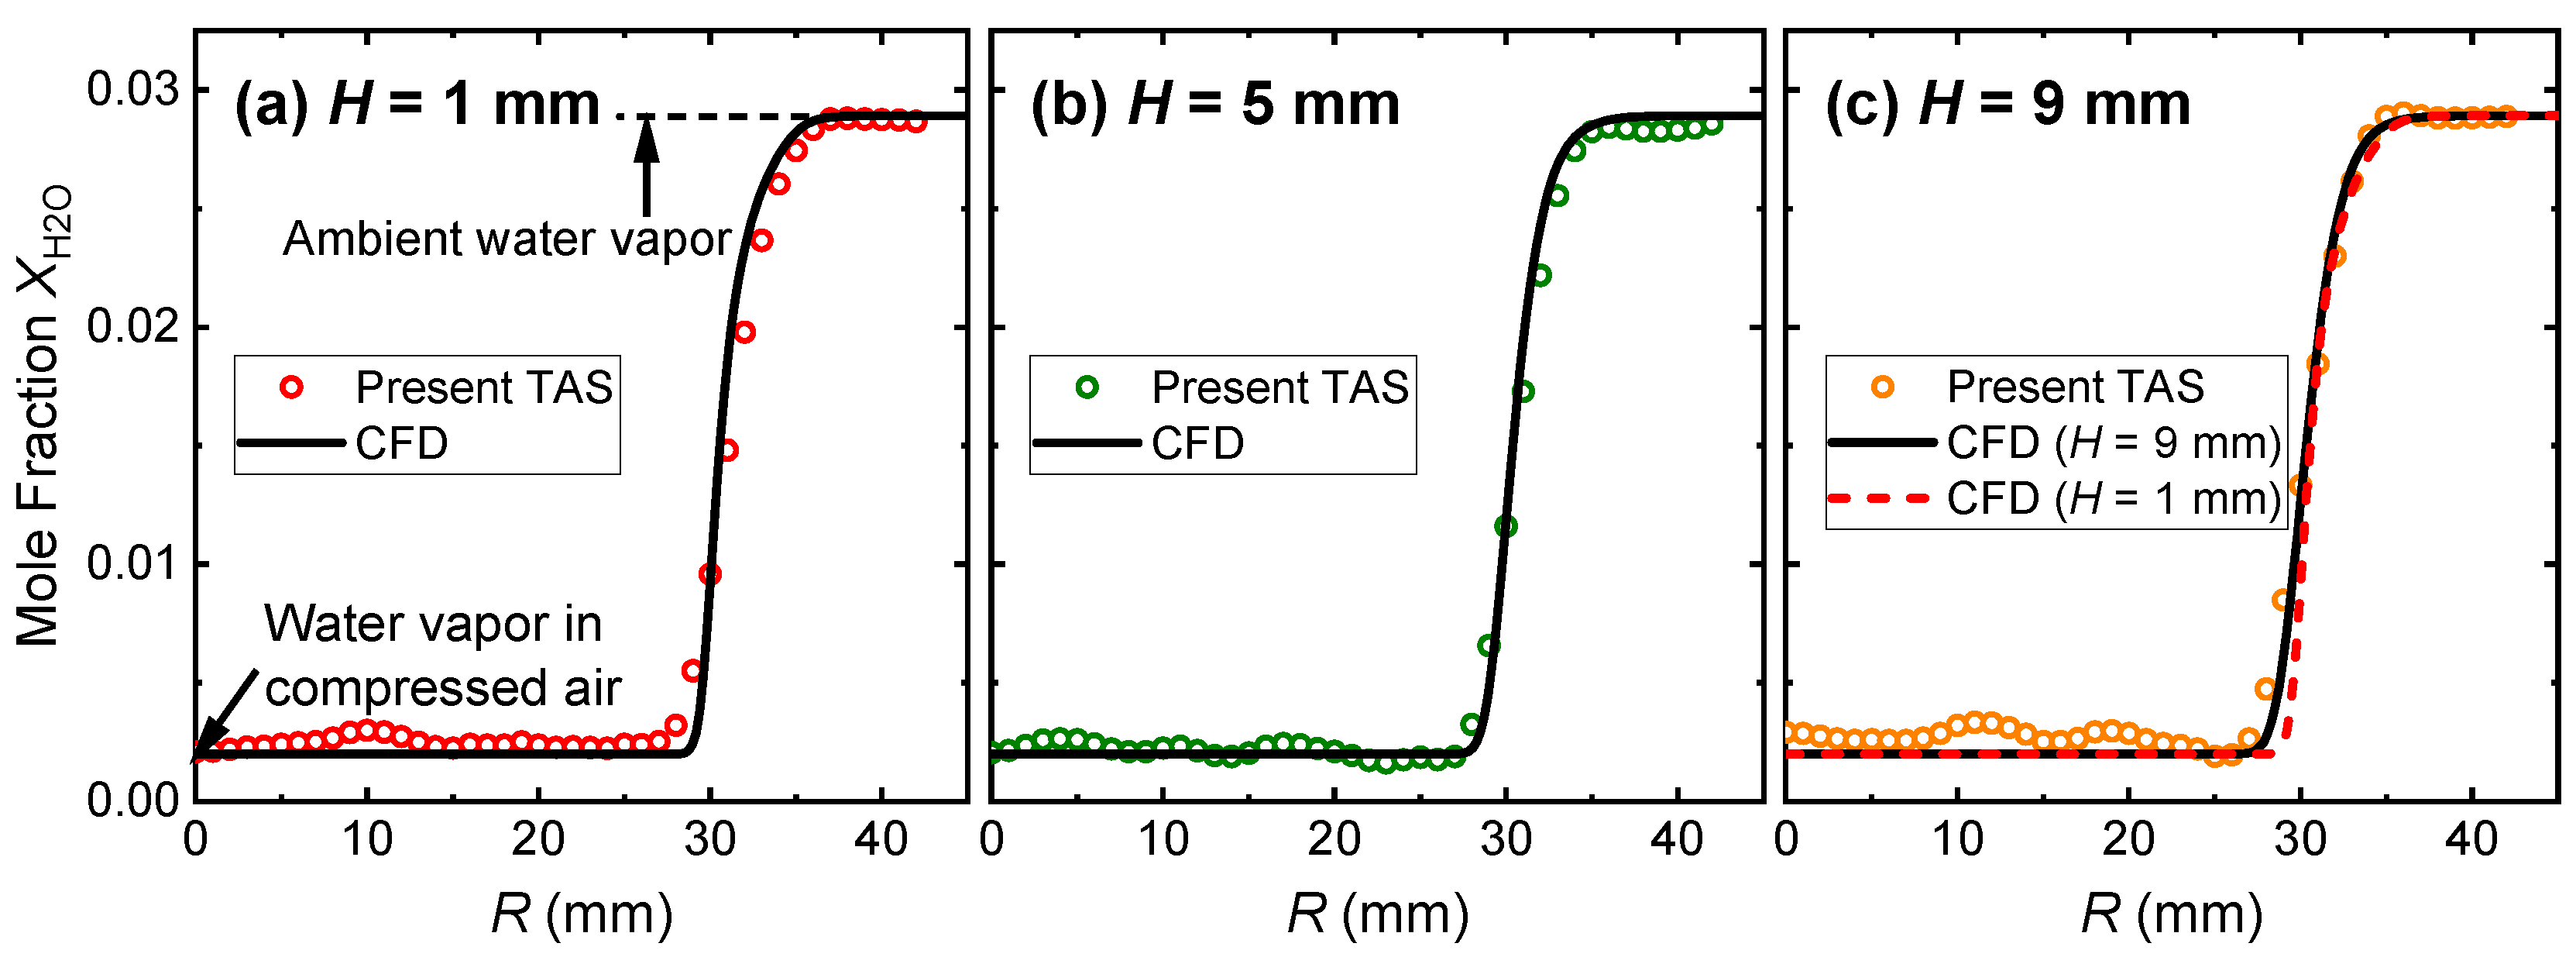
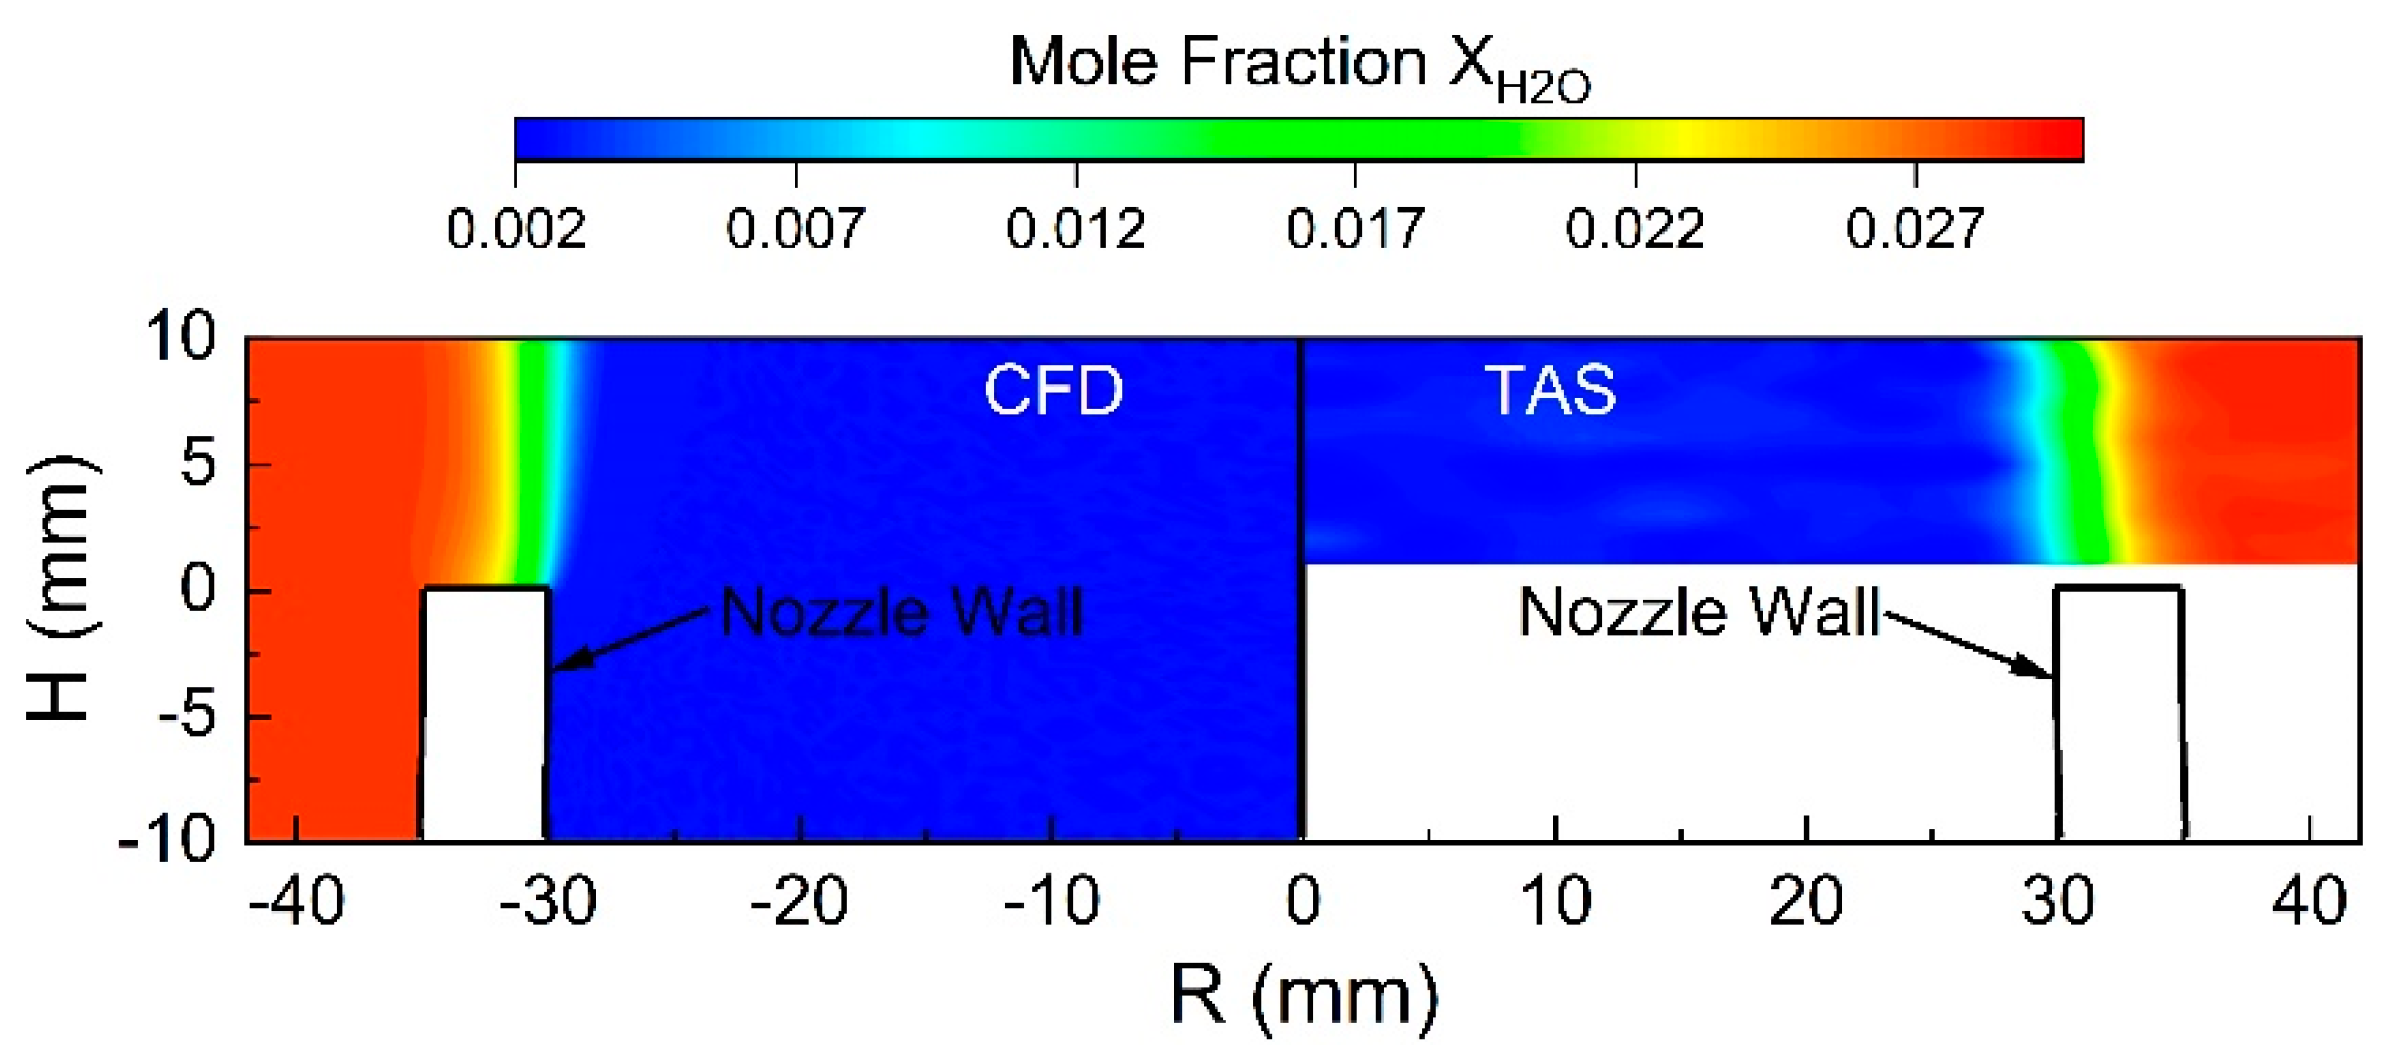
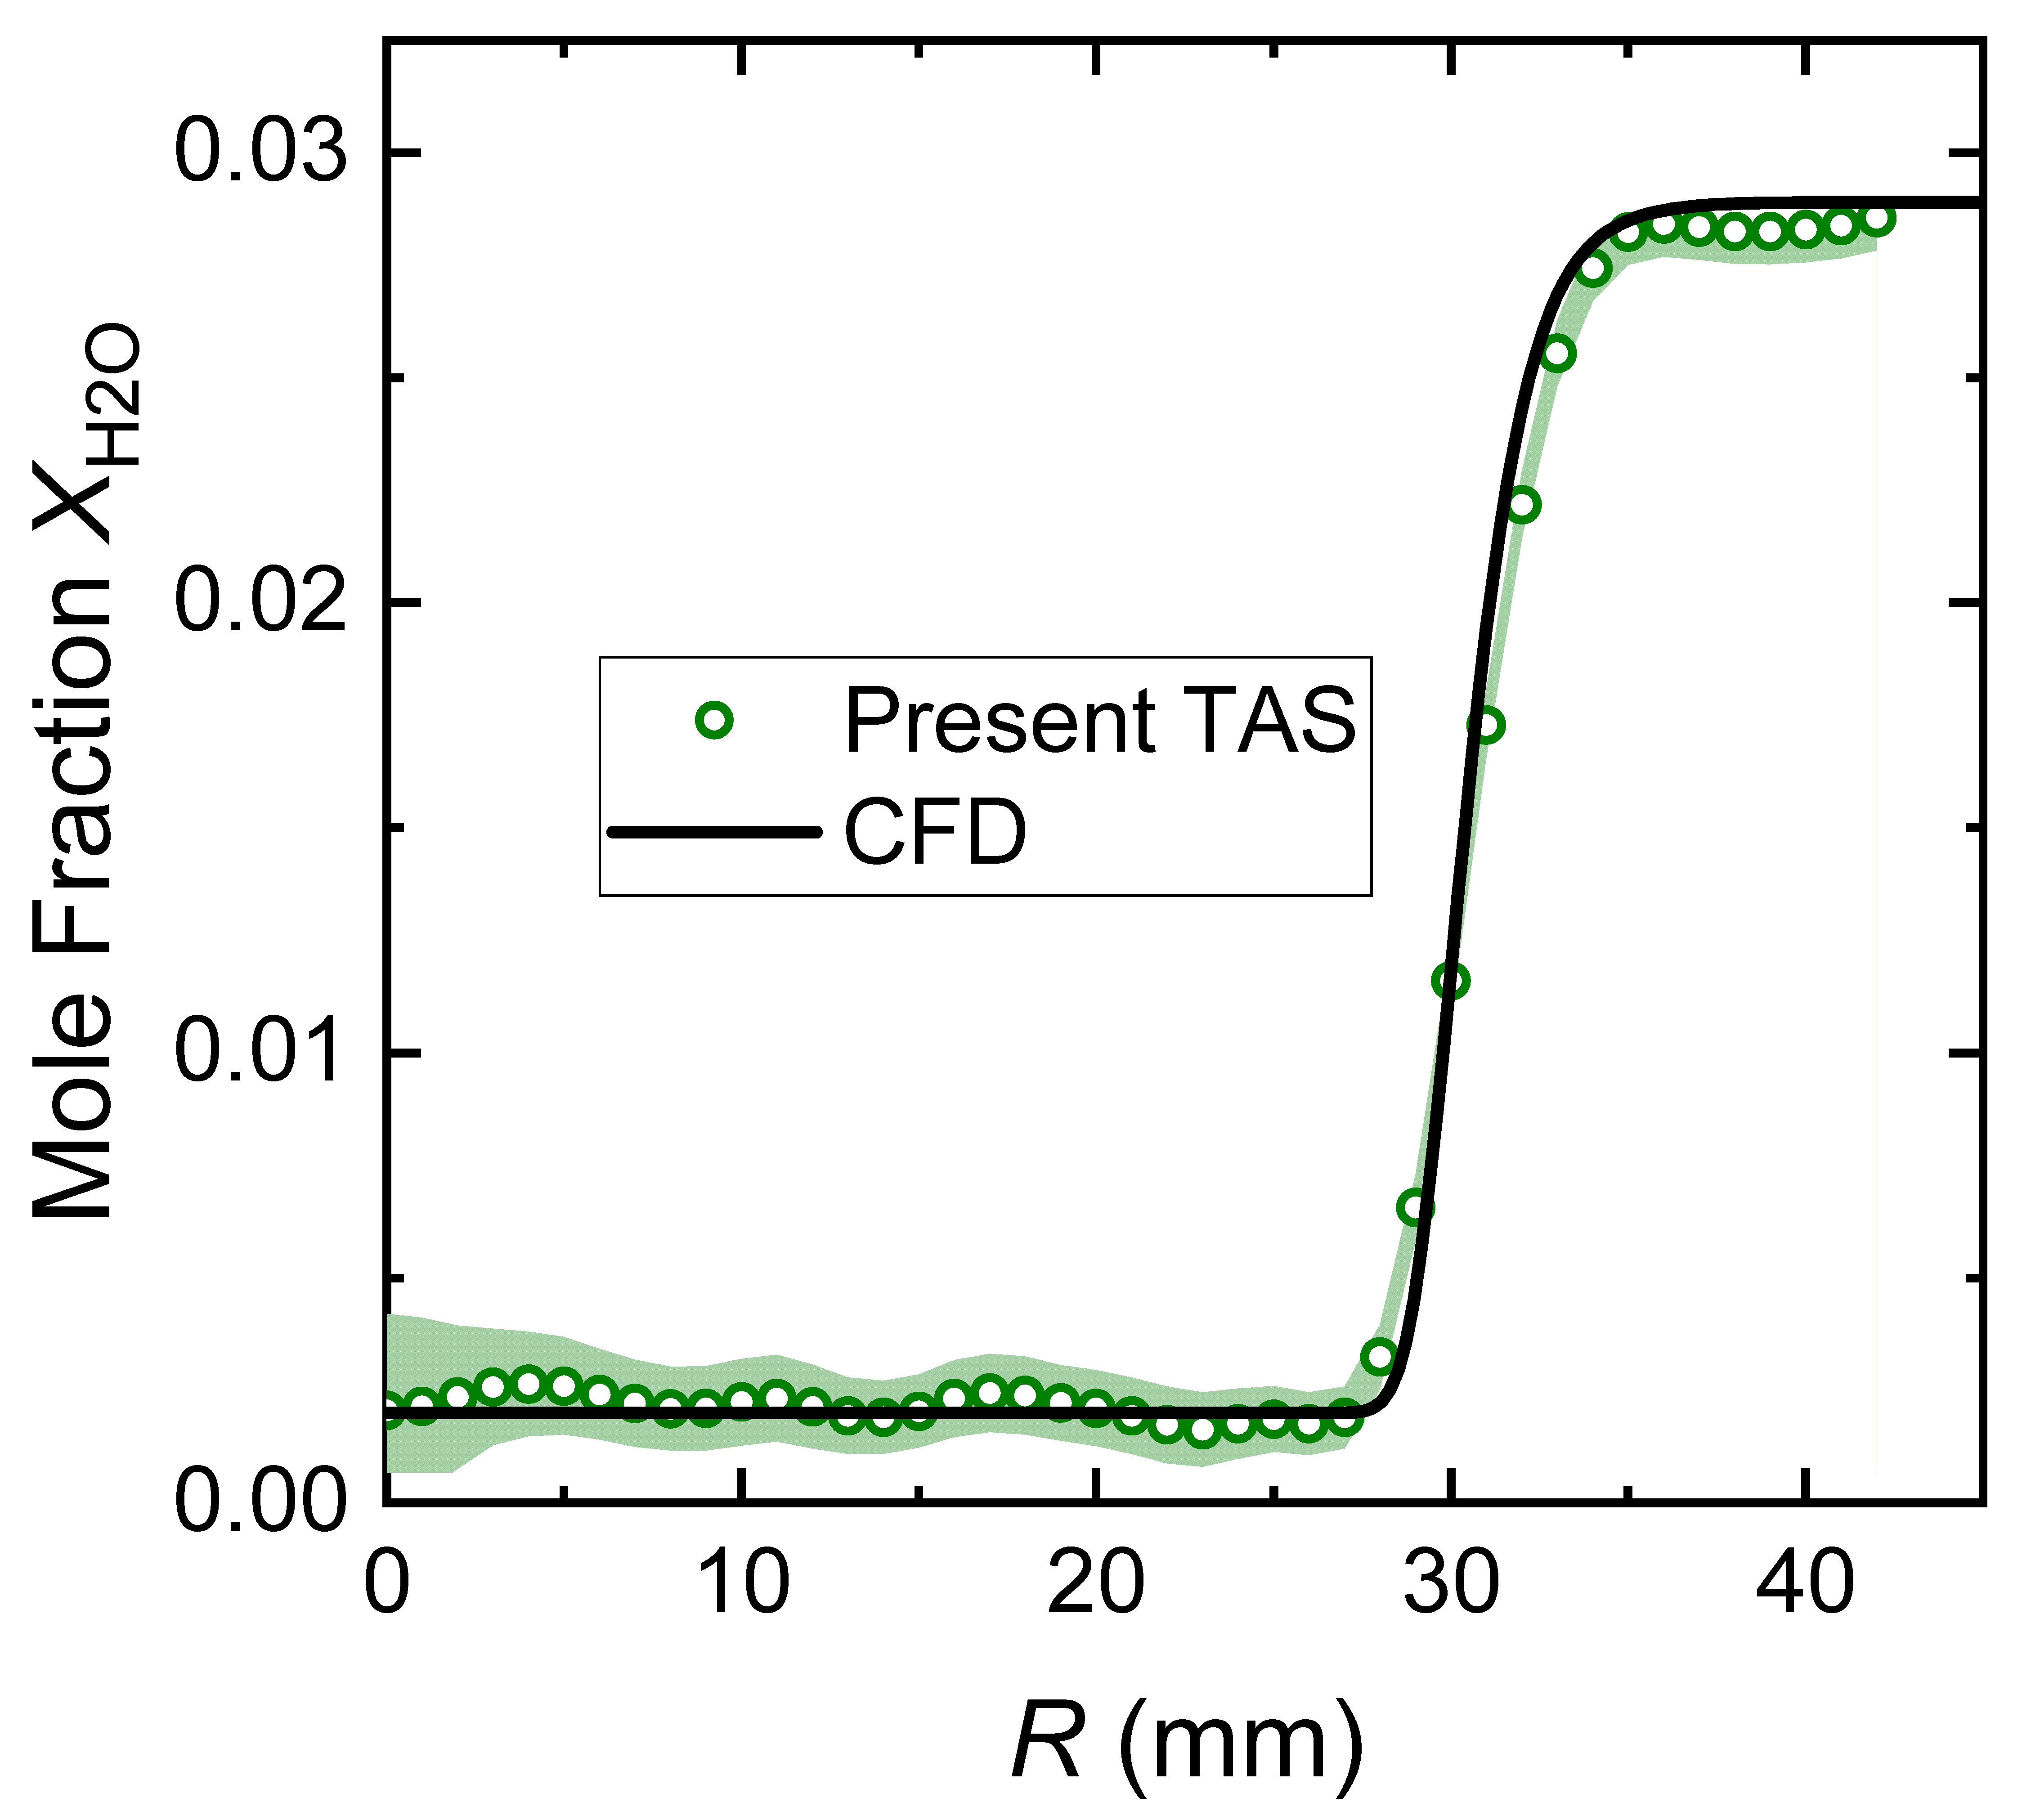
3. Results and Discussion
4. Conclusions
Author Contributions
Funding
Institutional Review Board Statement
Informed Consent Statement
Data Availability Statement
Conflicts of Interest
References
- Hanson, R.K.; Spearrin, R.M.; Goldenstein, C.S. Spectroscopy and Optical Diagnostics for Gases; Springer: Berlin/Heidelberg, Germany, 2016; ISBN 3-319-23252-5. [Google Scholar]
- Farooq, A.; Alquaity, A.B.S.; Raza, M.; Nasir, E.F.; Yao, S.; Ren, W. Laser Sensors for Energy Systems and Process Industries: Perspectives and Directions. Prog. Energy Combust. Sci. 2022, 91, 100997. [Google Scholar] [CrossRef]
- Hanson, R.K. Applications of Quantitative Laser Sensors to Kinetics, Propulsion and Practical Energy Systems. Proc. Combust. Inst. 2011, 33, 1–40. [Google Scholar] [CrossRef]
- Lackner, M. Tunable Diode Laser Absorption Spectroscopy (TDLAS) in the Process Industries—A Review. Rev. Chem. Eng. 2007, 23, 65–147. [Google Scholar] [CrossRef]
- Fu, B.; Zhang, C.; Lyu, W.; Sun, J.; Shang, C.; Cheng, Y.; Xu, L. Recent Progress on Laser Absorption Spectroscopy for Determination of Gaseous Chemical Species. Appl. Spectrosc. Rev. 2022, 57, 112–152. [Google Scholar] [CrossRef]
- Hanson, R.K.; Davidson, D.F. Recent Advances in Laser Absorption and Shock Tube Methods for Studies of Combustion Chemistry. Prog. Energy Combust. Sci. 2014, 44, 103–114. [Google Scholar] [CrossRef]
- Cai, W.; Kaminski, C.F. Tomographic Absorption Spectroscopy for the Study of Gas Dynamics and Reactive Flows. Prog. Energy Combust. Sci. 2017, 59, 1–31. [Google Scholar] [CrossRef]
- Liu, C.; Xu, L.; Li, F.; Cao, Z.; Tsekenis, S.A.; McCann, H. Resolution-Doubled One-Dimensional Wavelength Modulation Spectroscopy Tomography for Flame Flatness Validation of a Flat-Flame Burner. Appl. Phys. B Lasers Opt. 2015, 120, 407–416. [Google Scholar] [CrossRef]
- Liu, X.; Zhang, G.; Huang, Y.; Wang, Y.; Qi, F. Two-Dimensional Temperature and Carbon Dioxide Concentration Profiles in Atmospheric Laminar Diffusion Flames Measured by Mid-Infrared Direct Absorption Spectroscopy at 4.2 Μm. Appl. Phys. B Lasers Opt. 2018, 124, 61. [Google Scholar] [CrossRef]
- Ma, L.; Li, X.; Sanders, S.T.; Caswell, A.W.; Roy, S.; Plemmons, D.H.; Gord, J.R. 50-KHz-Rate 2D Imaging of Temperature and H2O Concentration at the Exhaust Plane of a J85 Engine Using Hyperspectral Tomography. Opt. Express 2013, 21, 1152–1162. [Google Scholar] [CrossRef] [Green Version]
- Liu, C.; Xu, L.; Cao, Z. Measurement of Nonuniform Temperature and Concentration Distributions by Combining Line-of-Sight Tunable Diode Laser Absorption Spectroscopy with Regularization Methods. Appl. Opt. 2013, 52, 4827–4842. [Google Scholar] [CrossRef]
- Wei, C.; Pineda, D.I.; Paxton, L.; Egolfopoulos, F.N.; Spearrin, R.M. Mid-Infrared Laser Absorption Tomography for Quantitative 2D Thermochemistry Measurements in Premixed Jet Flames. Appl. Phys. B 2018, 124, 123. [Google Scholar] [CrossRef]
- Wei, C.; Schwarm, K.K.; Pineda, D.I.; Spearrin, R.M. Volumetric Laser Absorption Imaging of Temperature, CO and CO2 in Laminar Flames Using 3D Masked Tikhonov Regularization. Combust. Flame 2021, 224, 239–247. [Google Scholar] [CrossRef]
- Qu, Z.; Fatehi, H.; Schmidt, F.M. Potassium Release from Biomass Particles during Combustion—Real-Time In Situ TDLAS Detection and Numerical Simulation. Appl. Sci. 2021, 11, 8887. [Google Scholar] [CrossRef]
- Wang, Z.; Zhou, W.; Yan, J.; Kamimoto, T.; Tsujimoto, K.; Li, Y.; Deguchi, Y.; Sani, N.A.; Samsuri, S.H.; Zulkifli, M.F. Application of 2D Temperature Measurement to a Coal-Fired Furnace Using CT-TDLAS. Meas. Sci. Technol. 2020, 31, 035203. [Google Scholar] [CrossRef]
- Qu, Z.; Holmgren, P.; Skoglund, N.; Wagner, D.R.; Broström, M.; Schmidt, F.M. Distribution of Temperature, H2O and Atomic Potassium during Entrained Flow Biomass Combustion—Coupling in Situ TDLAS with Modeling Approaches and Ash Chemistry. Combust. Flame 2018, 188, 488–497. [Google Scholar] [CrossRef]
- Sanders, I.C.; Bendana, F.A.; Hagström, C.G.; Mitchell Spearrin, R. Injector Effects on Hybrid Polymethylmethacrylate Combustion Assessed by Thermochemical Tomography. J. Propuls. Power 2021, 37, 928–943. [Google Scholar] [CrossRef]
- Dong, M.; Zheng, C.; Miao, S.; Zhang, Y.; Du, Q.; Wang, Y.; Tittel, F. Development and Measurements of a Mid-Infrared Multi-Gas Sensor System for CO, CO2 and CH4 Detection. Sensors 2017, 17, 2221. [Google Scholar] [CrossRef] [PubMed] [Green Version]
- Daun, K.J.; Thomson, K.A.; Liu, F.; Smallwood, G.J. Deconvolution of Axisymmetric Flame Properties Using Tikhonov Regularization. Appl. Opt. 2006, 45, 4638. [Google Scholar] [CrossRef] [PubMed]
- Yu, T.; Tian, B.; Cai, W. Development of a Beam Optimization Method for Absorption-Based Tomography. Opt. Express 2017, 25, 5982–5999. [Google Scholar] [CrossRef]
- Ma, L.; Li, X.; Cai, W.; Roy, S.; Gord, J.R.; Sanders, S.T. Selection of Multiple Optimal Absorption Transitions for Nonuniform Temperature Sensing. Appl. Spectrosc. 2010, 64, 1273–1282. [Google Scholar] [CrossRef]
- Cheong, K.-P.; Ma, L.; Wang, Z.; Ren, W. Influence of Line Pair Selection on Flame Tomography Using Infrared Absorption Spectroscopy. Appl. Spectrosc. 2019, 73, 529–539. [Google Scholar] [CrossRef]
- Ma, L.; Cheong, K.-P.; Duan, K.; Yuan, C.; Ren, W. Hybrid Constraint Multi-Line Absorption Spectroscopy for Non-Uniform Thermochemical Measurements in Axisymmetric Laminar and Jet Flames. Opt. Lasers Eng. 2022, 154, 107014. [Google Scholar] [CrossRef]
- Wei, C.; Perakis, N.; Pineda, D.I.; Egolfopoulos, F.N.; Ihme, M.; Spearrin, R.M. Turbulence-Induced Bias in Time-Averaged Laser Absorption Tomography of Correlated Concentration and Temperature Fields with a First-Order Correction. Combust. Flame 2022, 242, 112210. [Google Scholar] [CrossRef]
- Wang, Z.; Zhu, N.; Wang, W.; Chao, X. Y-Net: A Dual-Branch Deep Learning Network for Nonlinear Absorption Tomography with Wavelength Modulation Spectroscopy. Opt. Express 2022, 30, 2156. [Google Scholar] [CrossRef]
- Li, H.; Ren, T.; Liu, X.; Zhao, C. U-Net Applied to Retrieve Two-Dimensional Temperature and CO2 Concentration Fields of Laminar Diffusion Flames. Fuel 2022, 324, 124447. [Google Scholar] [CrossRef]
- Gordon, I.E.; Rothman, L.S.; Hargreaves, R.J.; Hashemi, R.; Karlovets, E.V.; Skinner, F.M.; Conway, E.K.; Hill, C.; Kochanov, R.V.; Tan, Y.; et al. The HITRAN2020 Molecular Spectroscopic Database. J. Quant. Spectrosc. Radiat. Transf. 2022, 277, 107949. [Google Scholar] [CrossRef]
- Rothman, L.S.; Gordon, I.E.; Barber, R.J.; Dothe, H.; Gamache, R.R.; Goldman, A.; Perevalov, V.I.; Tashkun, S.A.; Tennyson, J. HITEMP, the High-Temperature Molecular Spectroscopic Database. J. Quant. Spectrosc. Radiat. Transf. 2010, 111, 2139–2150. [Google Scholar] [CrossRef]
- Goldenstein, C.S.; Jeffries, J.B.; Hanson, R.K. Diode Laser Measurements of Linestrength and Temperature-Dependent Lineshape Parameters of H2O-, CO2-, and N2-Perturbed H2O Transitions near 2474 and 2482nm. J. Quant. Spectrosc. Radiat. Transf. 2013, 130, 100–111. [Google Scholar] [CrossRef]
- Hansen, P.C.; O’Leary, D.P. The Use of the L-Curve in the Regularization of Discrete Ill-Posed Problems. SIAM J. Sci. Comput. 1993, 14, 1487–1503. [Google Scholar] [CrossRef]
- Bouvet, N. On the Simulation of Laminar Strained Flames in Stagnation Flows: 1D and 2D Approaches versus Experiments. Combust. Flame 2014, 161, 438–452. [Google Scholar] [CrossRef]
- Wang, Z.; Wang, W.; Ma, L.; Fu, P.; Ren, W.; Chao, X. Mid-Infrared CO2 Sensor with Blended Absorption Features for Non-Uniform Laminar Premixed Flames. Appl. Phys. B 2022, 128, 31. [Google Scholar] [CrossRef]
- Lemmon, E.W.; Huber, M.L.; McLinden, M.O. NIST Standard Reference Database 23. Reference Fluid Thermodynamic and Transport Properties (REFPROP); version 9; National Institute of Standards and Technology: Boulder, CO, USA, 2010.


| Line Number | Frequency (cm−1) | Wavelength (nm) | S (296 K) (cm−2 atm−1) | E″ (cm−1) |
|---|---|---|---|---|
| 1 | 7306.7396 | 1368.599 | 0.027500 | 325.3479 |
| 2 | 7306.7519 | 1368.597 | 0.445359 | 79.4964 |
| Weighted line 1 | 7306.7470 | 1368.598 | 0.472900 | 93.9700 |
Publisher’s Note: MDPI stays neutral with regard to jurisdictional claims in published maps and institutional affiliations. |
© 2022 by the authors. Licensee MDPI, Basel, Switzerland. This article is an open access article distributed under the terms and conditions of the Creative Commons Attribution (CC BY) license (https://creativecommons.org/licenses/by/4.0/).
Share and Cite
Cheong, K.-P.; Shi, D.; Liu, S.; Wu, J.; Duan, K.; Song, Y.; Ren, W. Tomographic Absorption Spectroscopy for H2O Transport in a Laminar Jet with Inverse Concentration Gradient. Sensors 2022, 22, 5939. https://doi.org/10.3390/s22165939
Cheong K-P, Shi D, Liu S, Wu J, Duan K, Song Y, Ren W. Tomographic Absorption Spectroscopy for H2O Transport in a Laminar Jet with Inverse Concentration Gradient. Sensors. 2022; 22(16):5939. https://doi.org/10.3390/s22165939
Chicago/Turabian StyleCheong, Kin-Pang, Dingfeng Shi, Shaotong Liu, Junjun Wu, Kun Duan, Yong Song, and Wei Ren. 2022. "Tomographic Absorption Spectroscopy for H2O Transport in a Laminar Jet with Inverse Concentration Gradient" Sensors 22, no. 16: 5939. https://doi.org/10.3390/s22165939