
EIEN: Endoscopic Image Enhancement Network Based on Retinex Theory

Abstract
:1. Introduction
- We use a migration learning approach to retrain a pre-trained Retinex-Net decomposition network model on an endoscopic image dataset to fine-tune the decomposition network weights. The generalizability of the decomposition network in endoscopic images is improved, and suitable decomposition images are provided for illumination correction and reflection component enhancement.
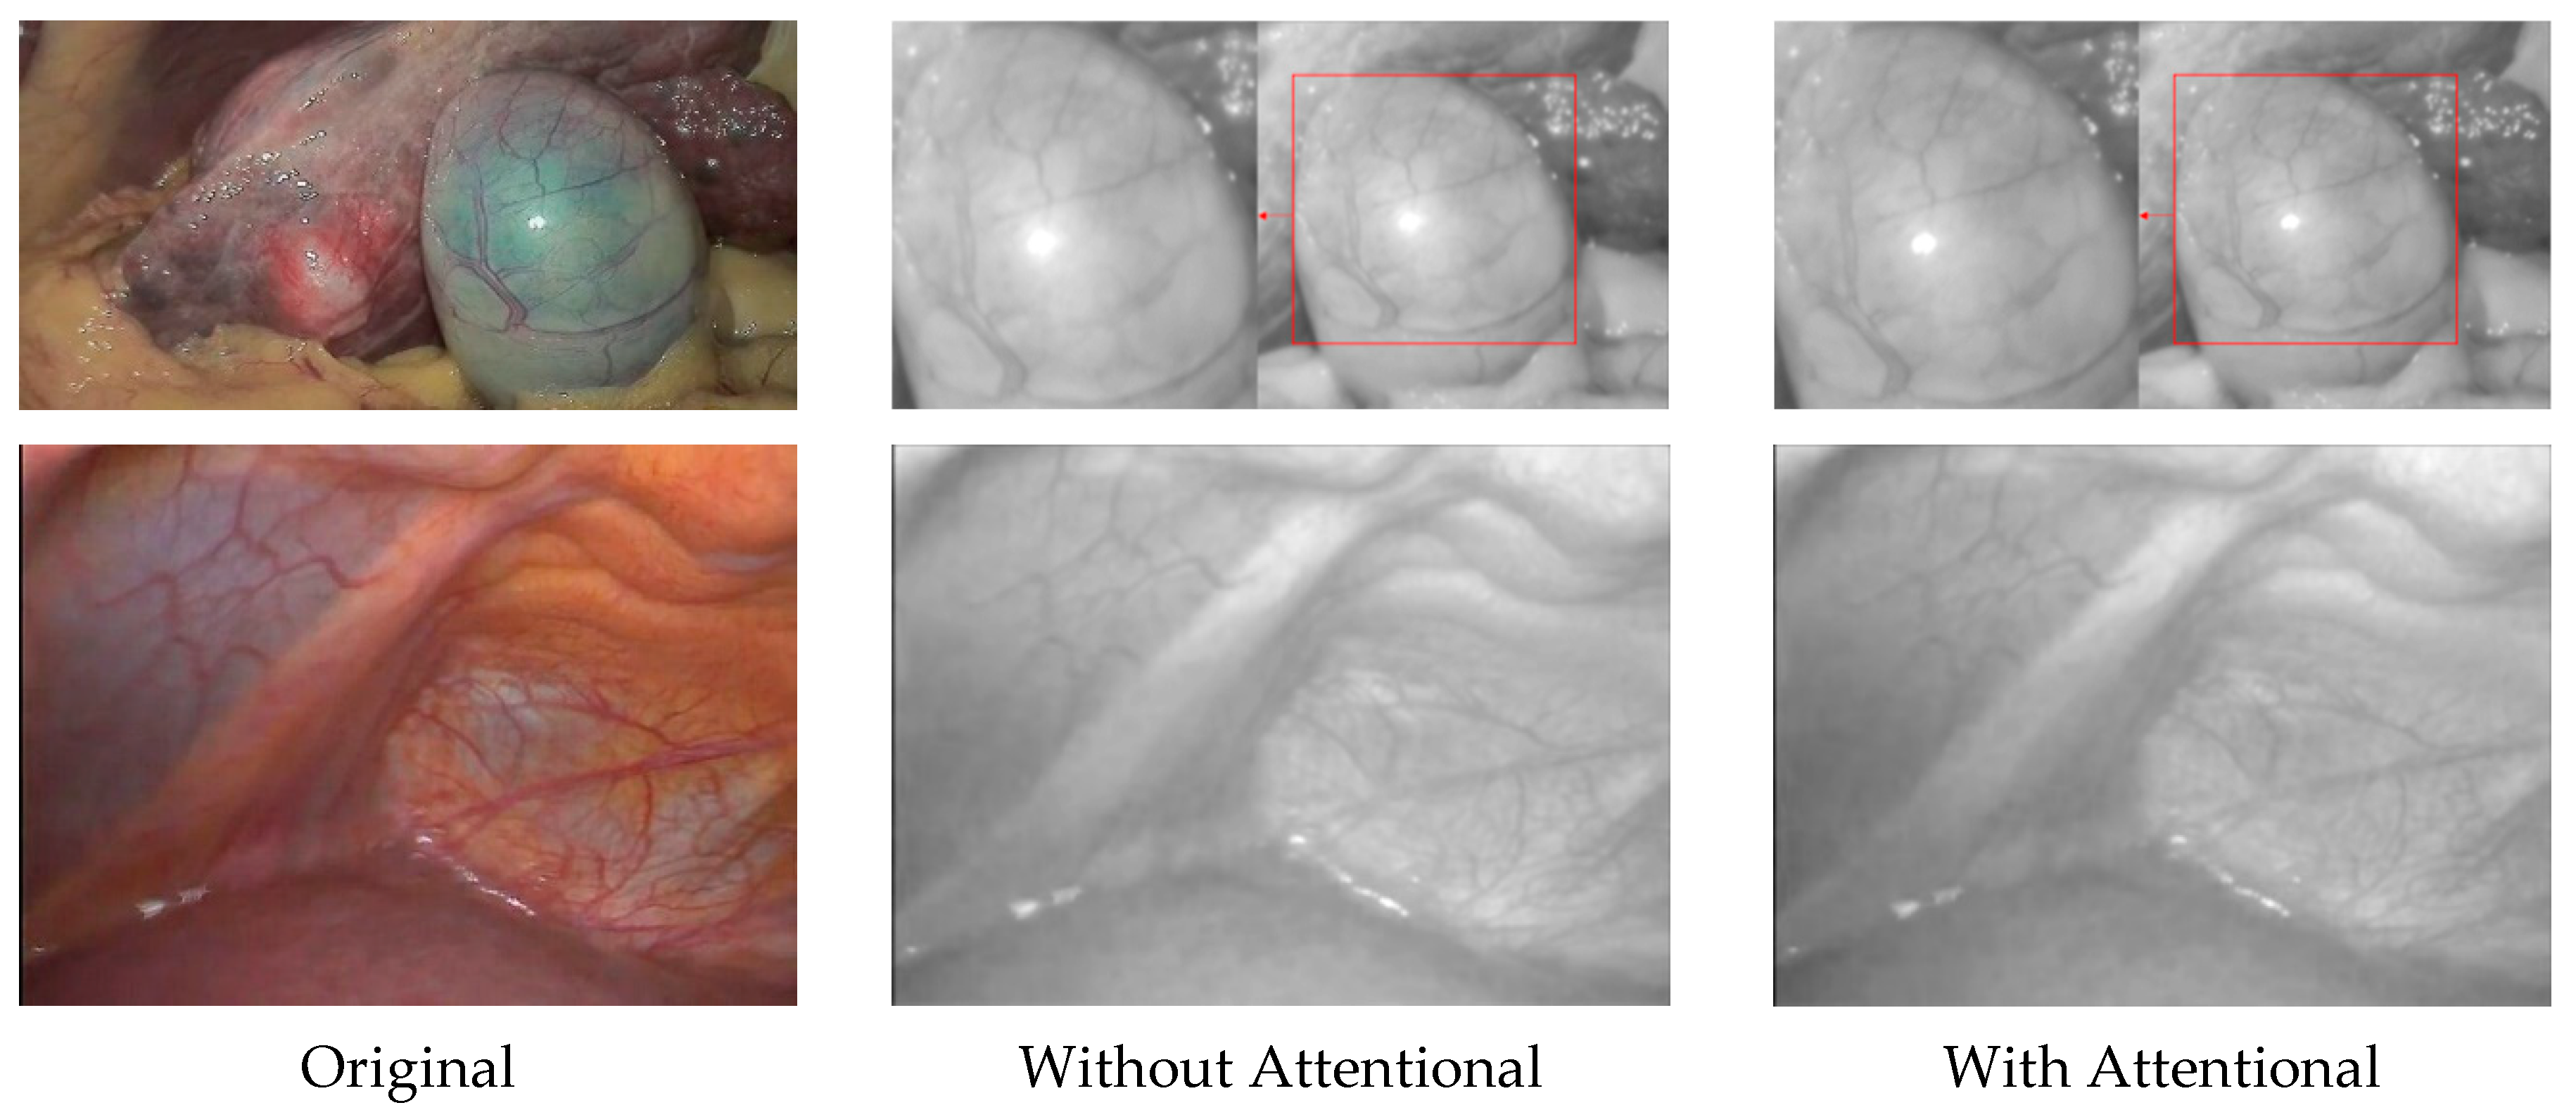
- We propose a self-attention guided multi-scale pyramid network to implement illumination correction. It can extract image features at different scales and guide the network to generate illumination components with balanced illumination and rich details through a self-attention mechanism.
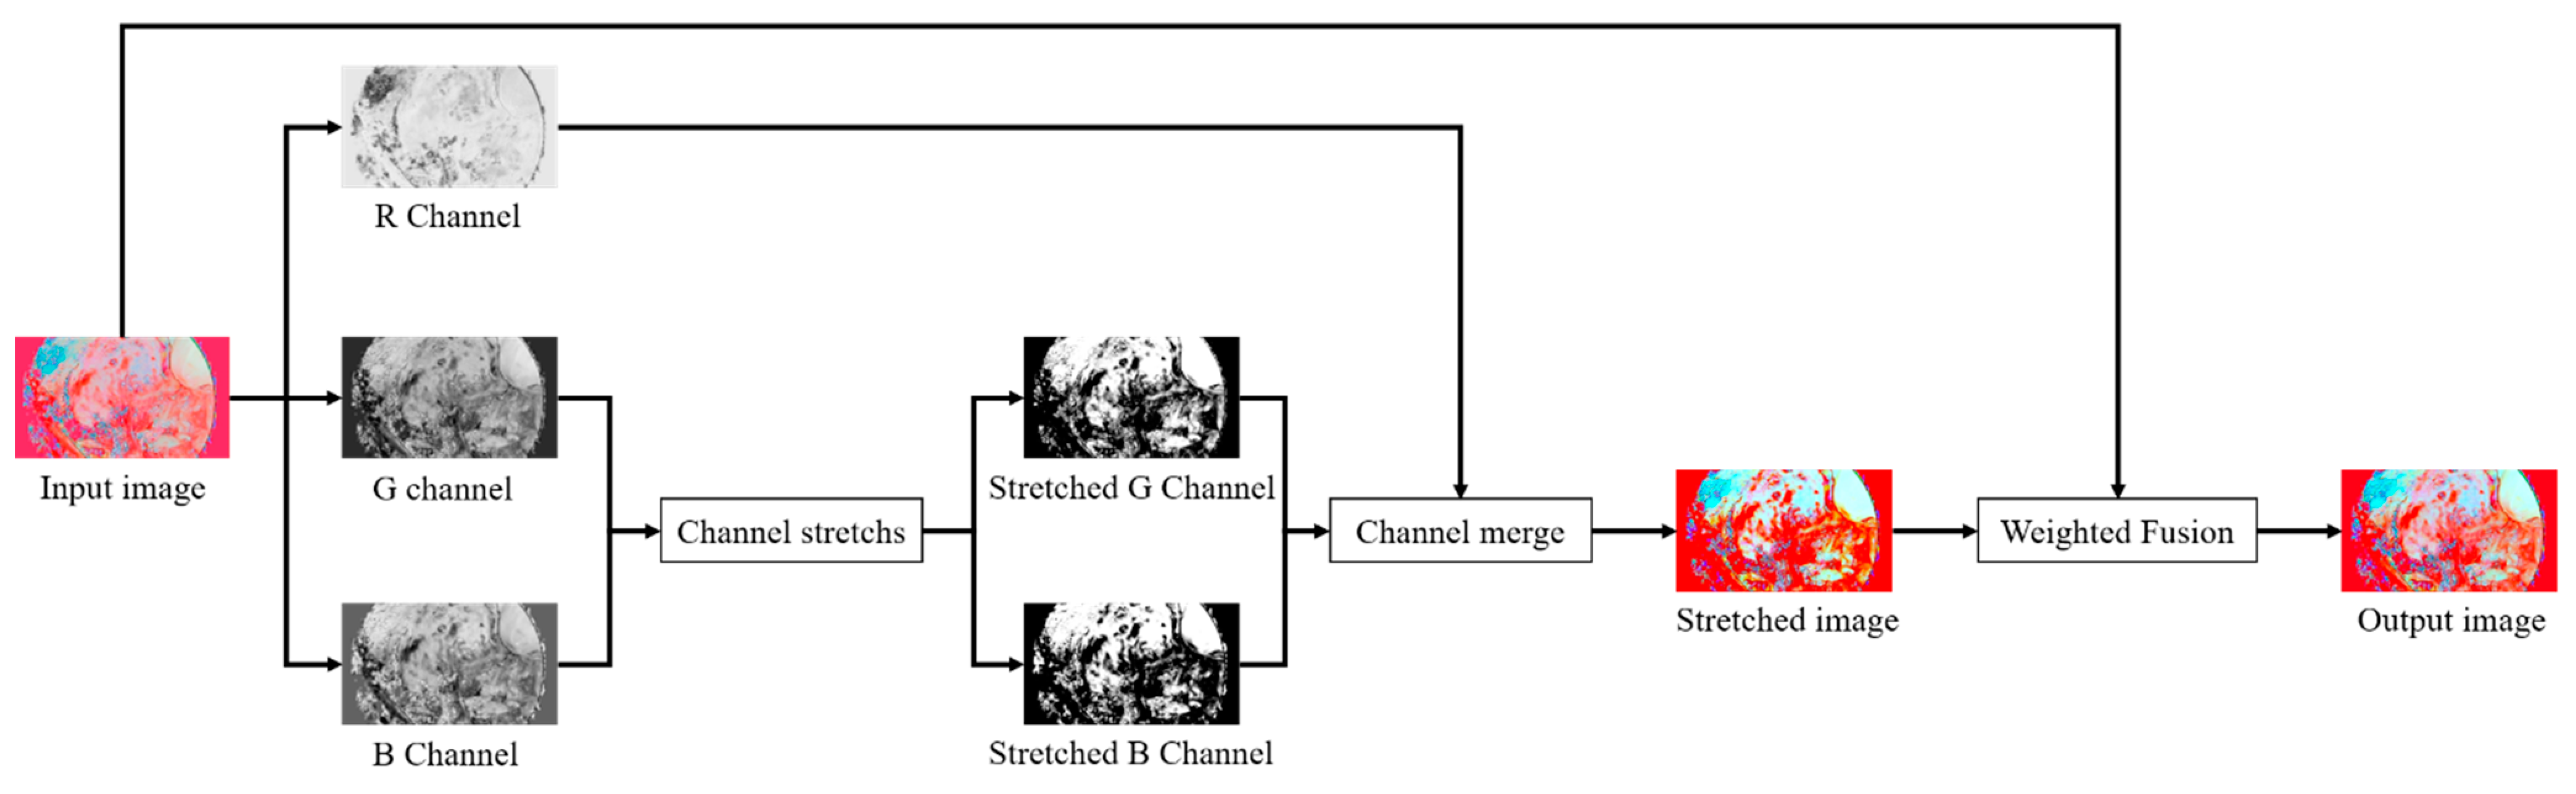
- We combine the imaging characteristics of endoscopic images, stretch the green channel and blue channel in the reflection component, and fuse the stretched reflection component with the original reflection component by weighting to achieve image fidelity while highlighting the contrast of blood vessels and tissues.
2. Related Work
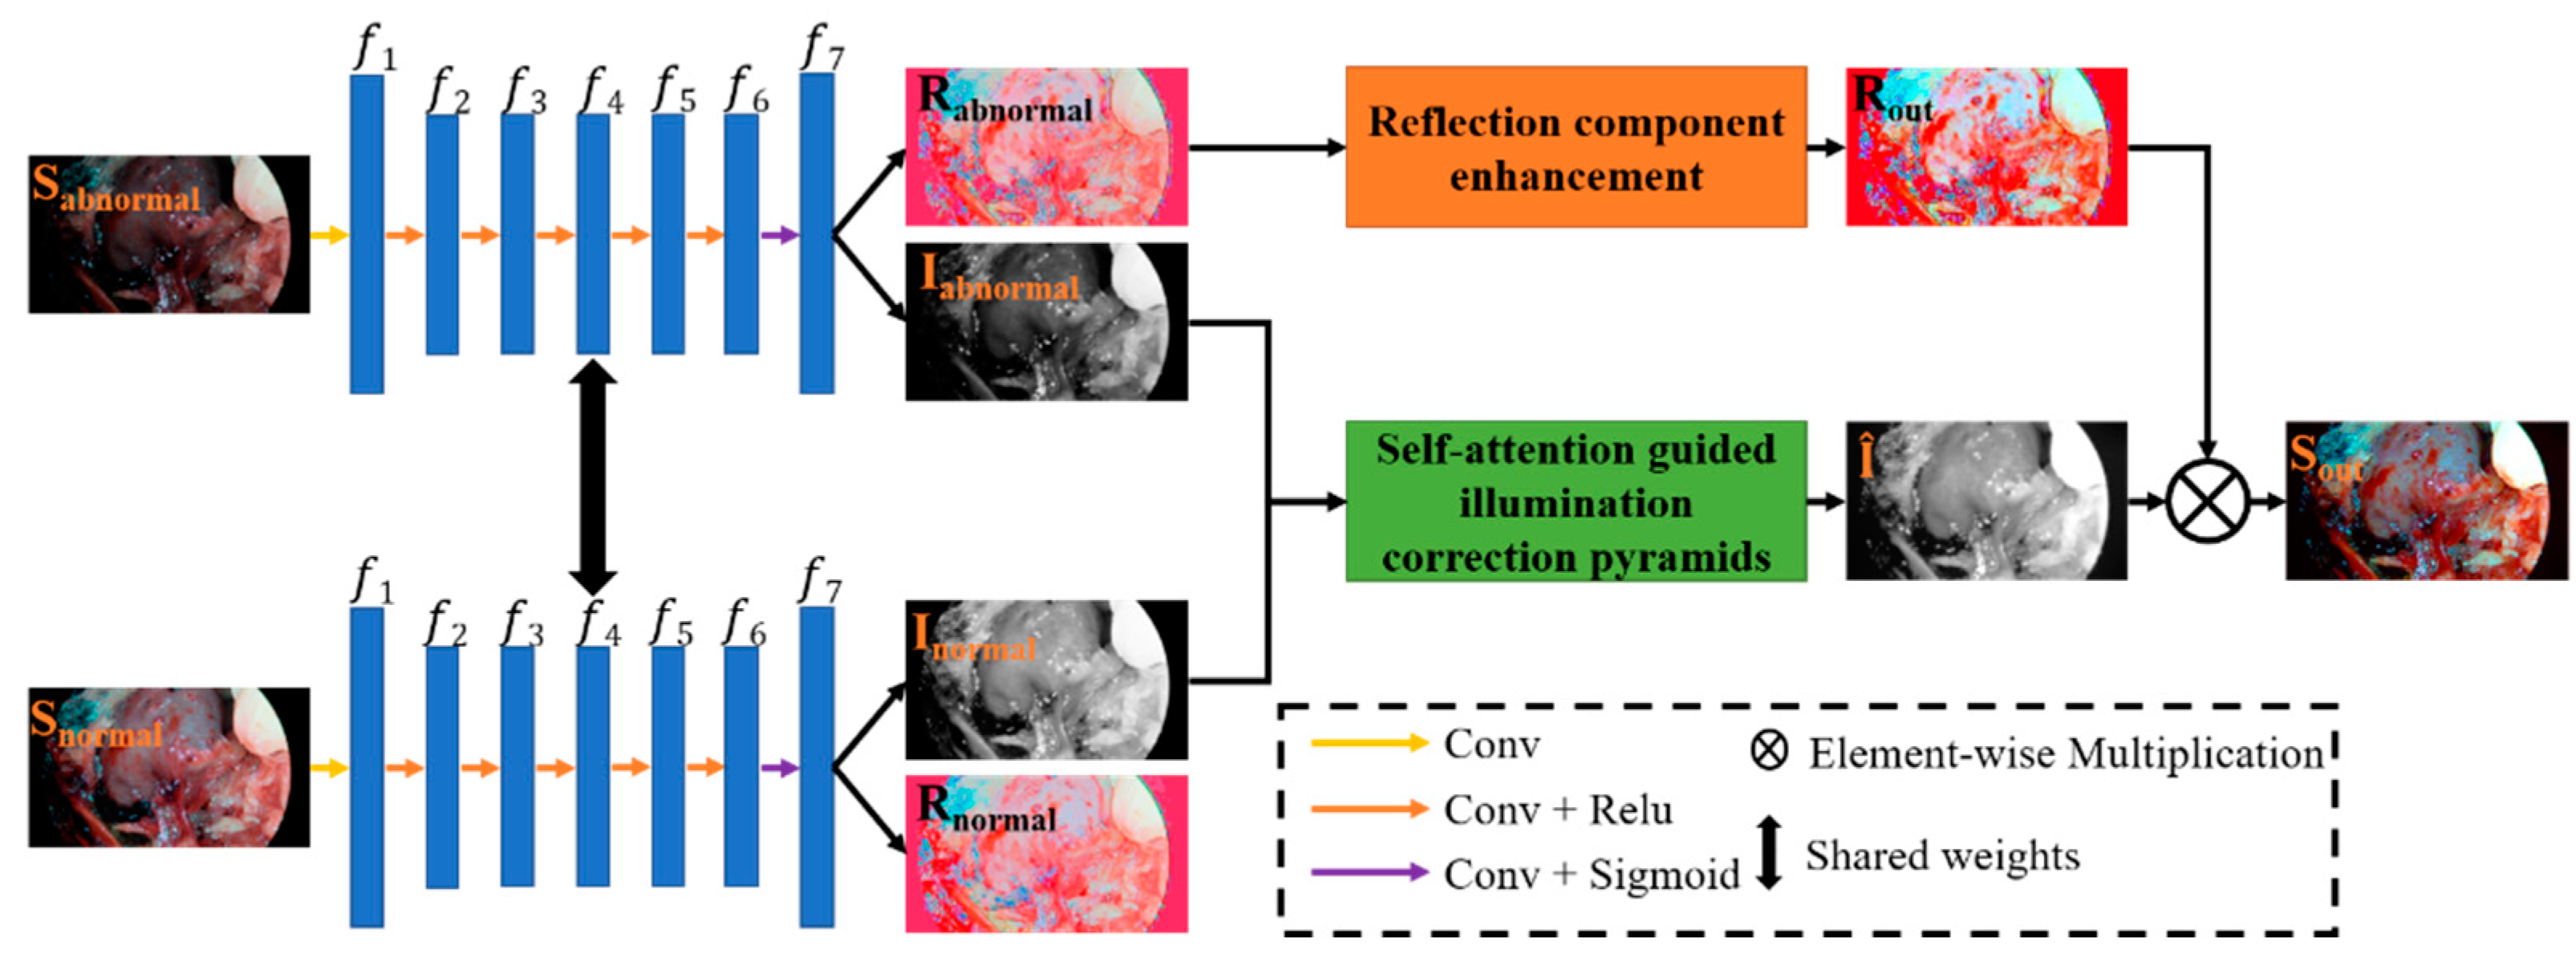
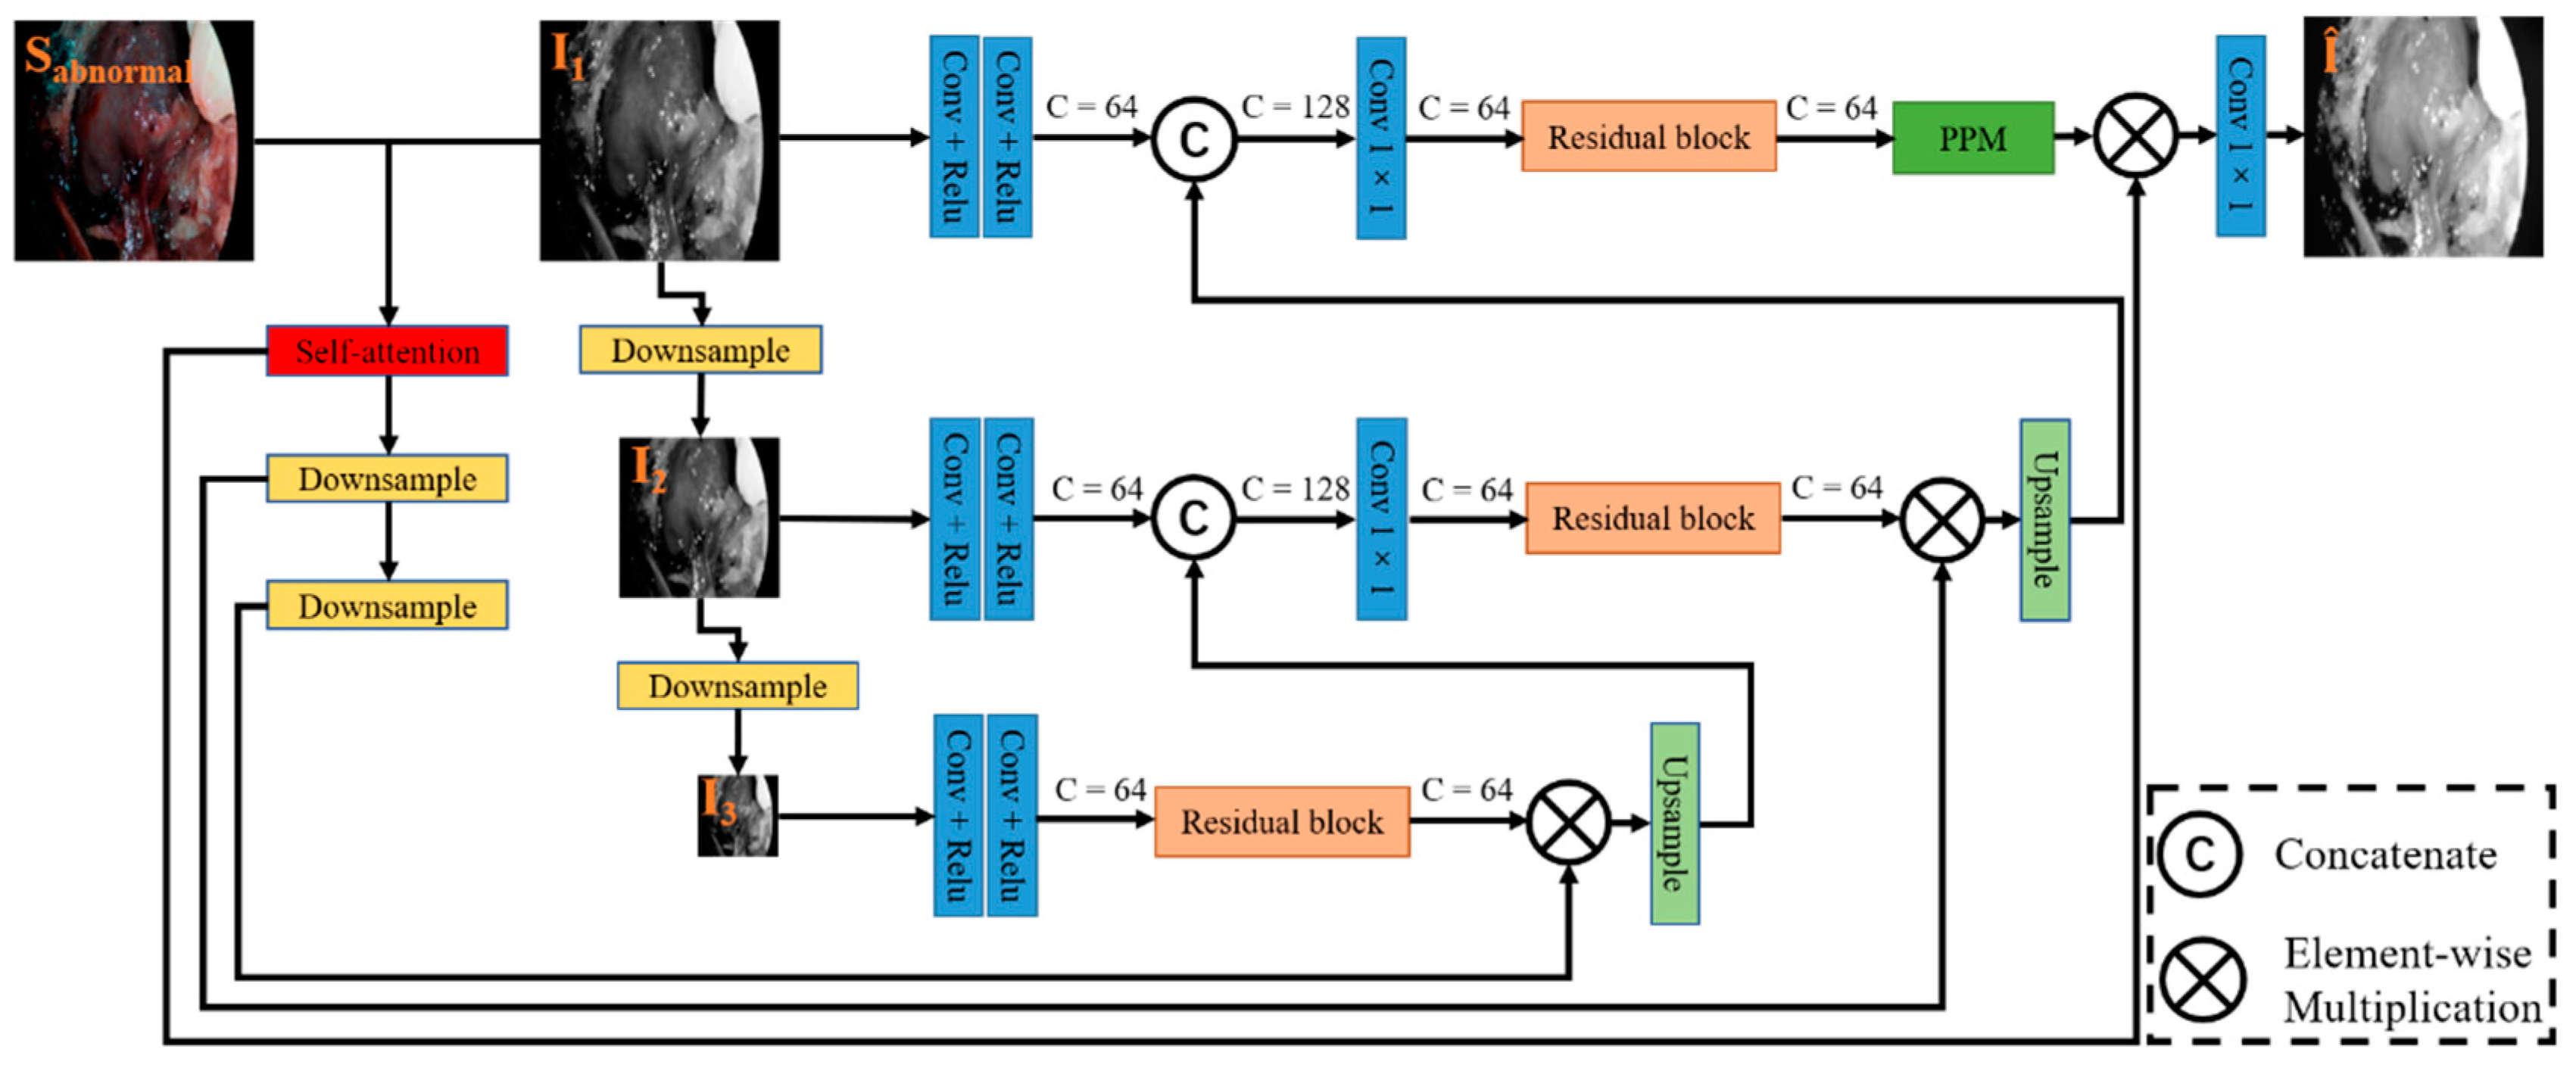
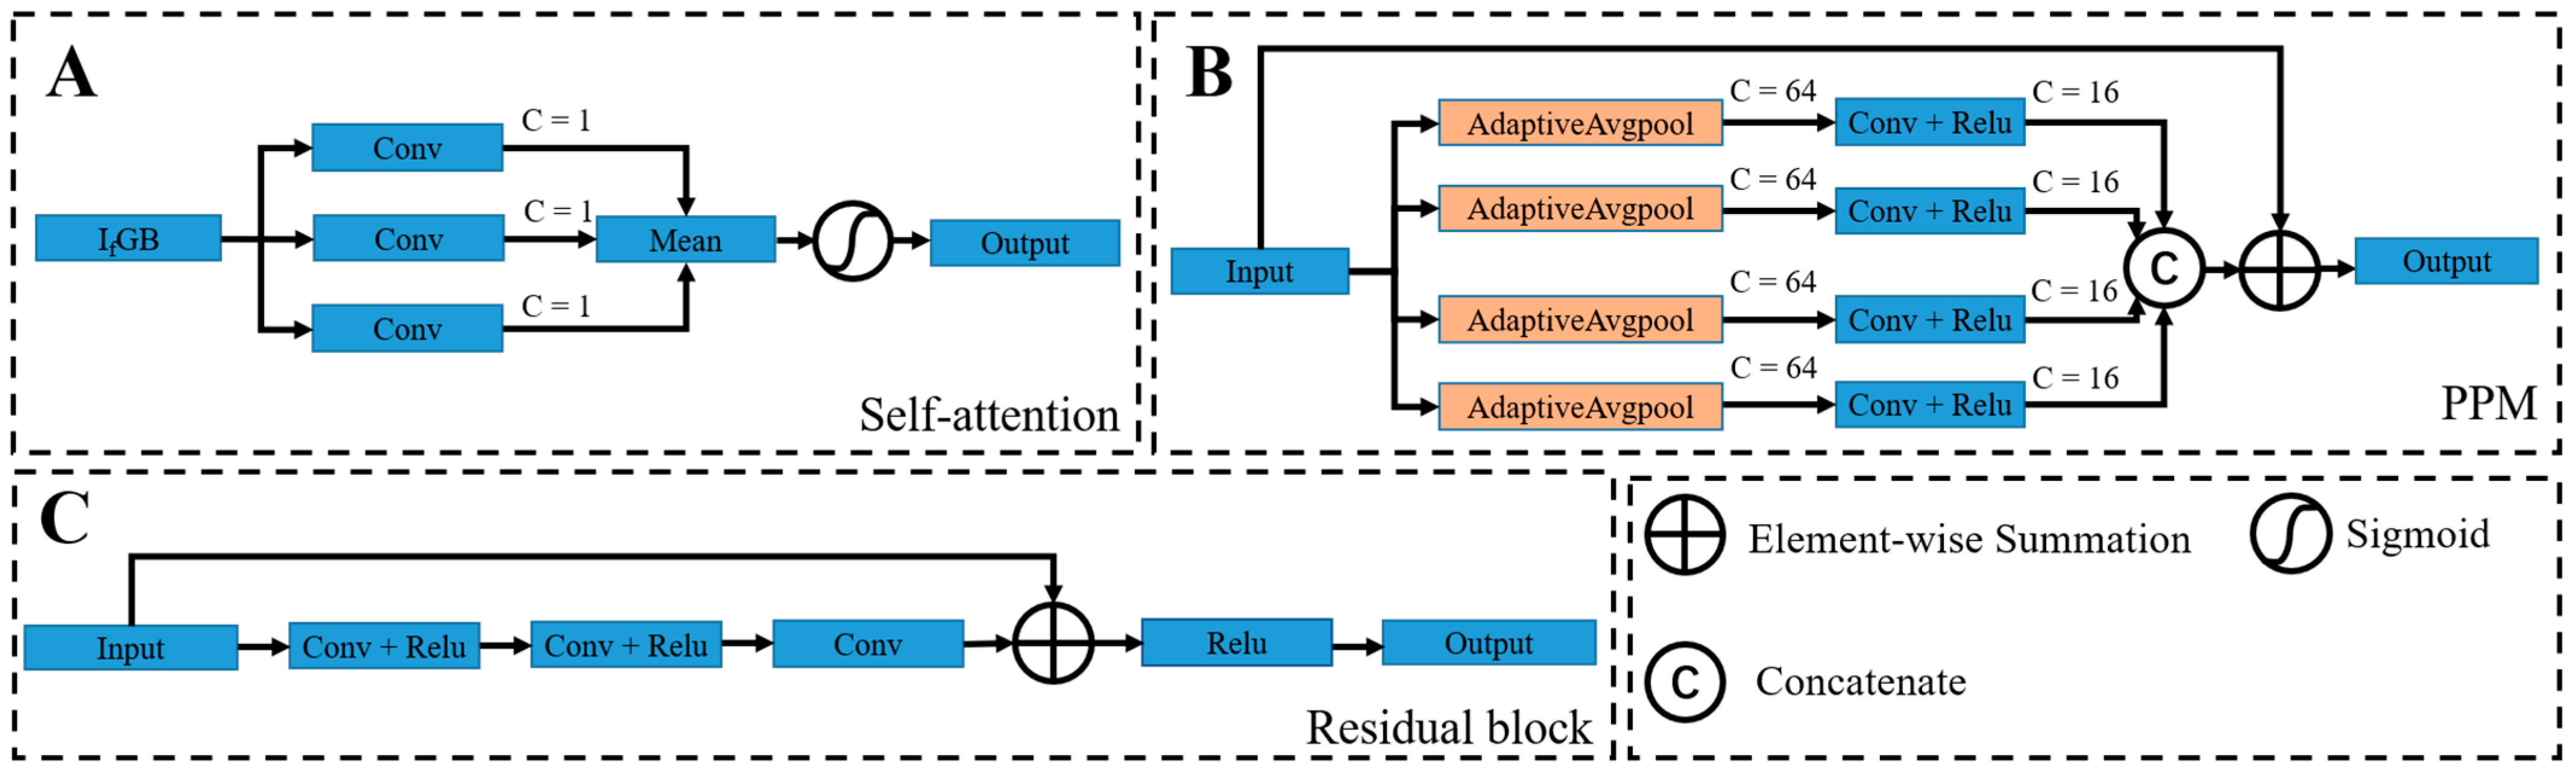
3. Methodology
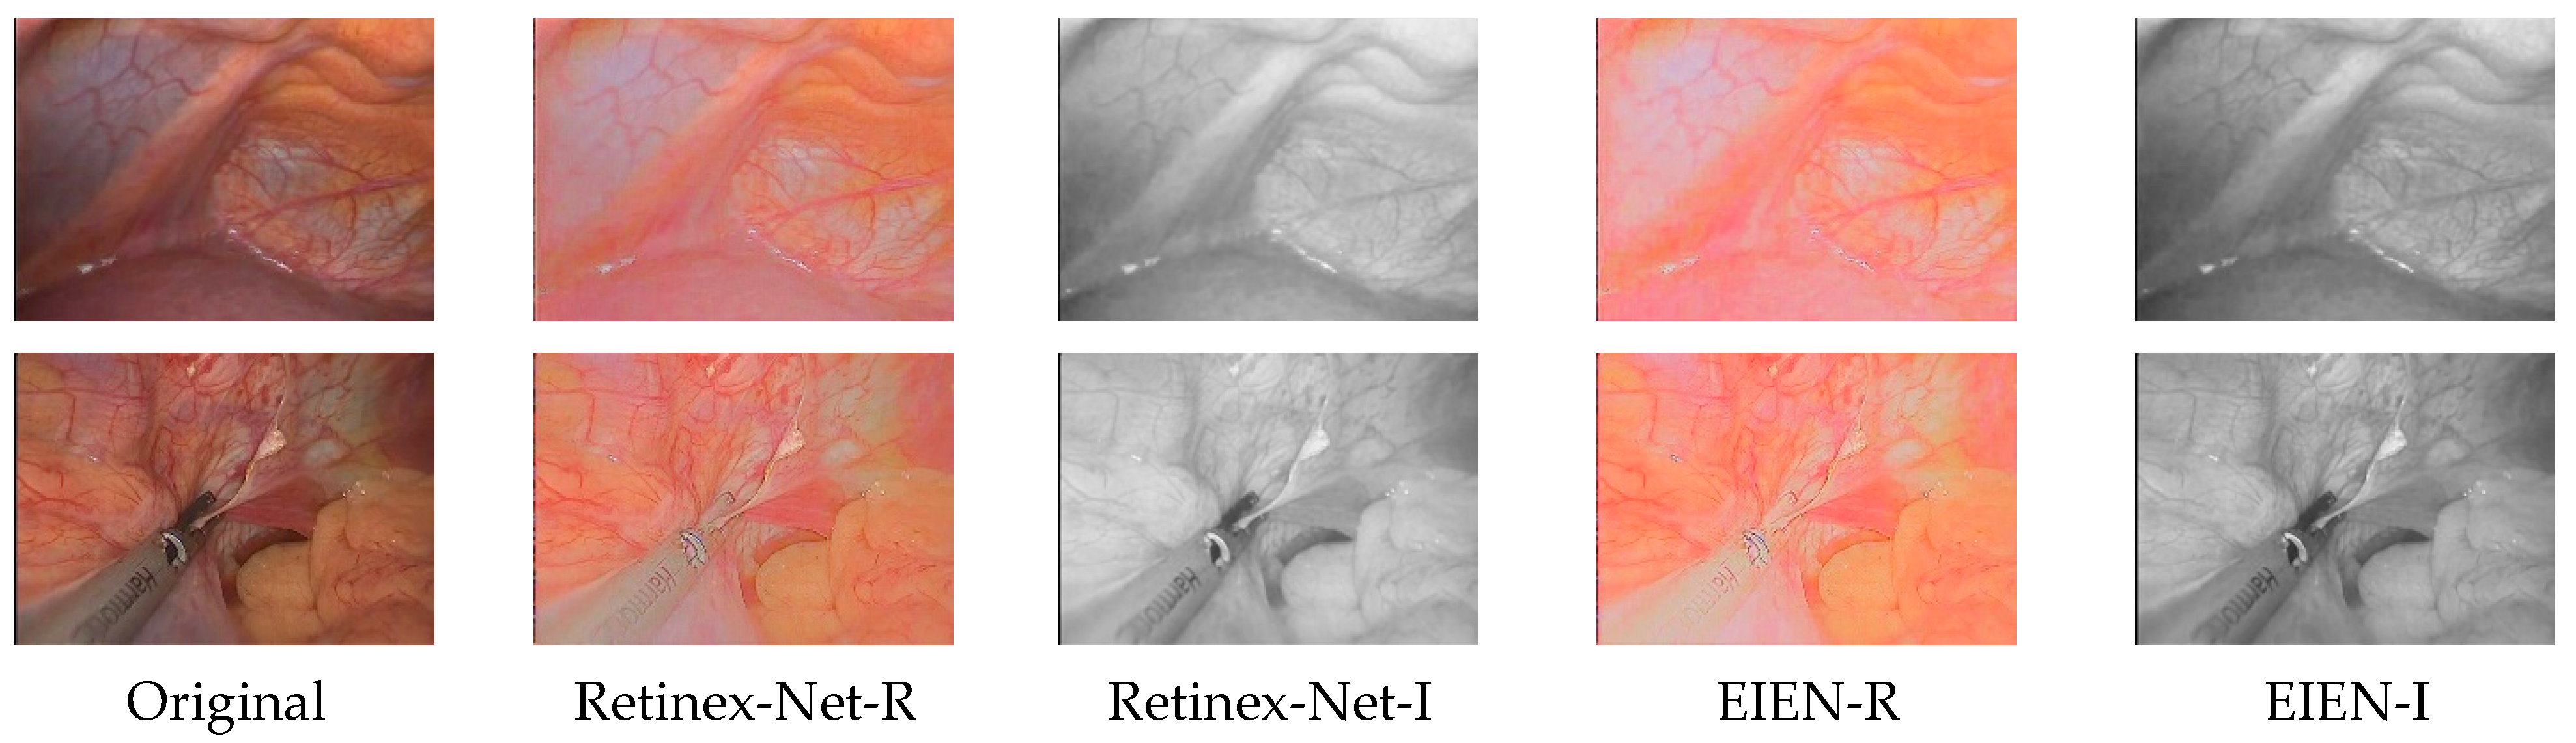
3.1. Decomposition Network
- 1.
- Invariable Reflectance Loss: According to the Retinex theory, it is known that the reflection components are invariant by the nature of the object itself, so the reflection components of the abnormal/normal illumination images are similar. The abnormal illumination image contains both low-light and high-light images. The decomposition network uses pairs of images as input. It imposes reflection consistency constraints between the two images to guide the optimization of the decomposition network, whose loss is calculated as shown in Equation (2):where is the reflection component of the abnormal image, is the reflection component of the standard image, indicates the L1 norm operation, and by minimizing , and are encouraged to be similar.
- 2.
- Illumination Smoothness Loss: Abnormal and normal image decomposition does not have the same illumination components but should highlight the structure of the image and local details while maintaining overall smoothness. The direct use of TV minimization (ToTal Variation Minimization) [26] as a loss function can cause unsatisfactory results and over-smoothing in areas with uniform pixels or significant luminance variations. Therefore, the loss is improved based on the TV to prevent over-smoothing of the illumination component. The improved TV formula adds the gradient of the reflectance component as a weight, and the original TV function is weighted with the gradient of the reflectance component to achieve adaptive adjustment of the illuminance component structure. The illuminance component smoothing loss is shown in Equation (3):where represents the gradient (including horizontal and vertical gradient), represents the gradient-aware balance coefficient, and relaxes the smoothing constraint at locations with more complex image structures and illumination discontinuities, where is set to 10. The smaller the gradient of the reflection component (), the larger the weight assigned, and the smaller the gradient of the illumination component () will become, making the illumination component smooth.
- 3.
- Reconstruction Loss: To further constrain the decomposition of the network, we need to focus not only on the similarity between the reconstructed results of the reflection and illumination components of the image’s own decomposition and the original image. It is also necessary to pay attention to the similarity between the combined reconstruction results of the reflection component and the illuminance component of the paired image decomposition and the abnormal/normal image. Reconstruction loss is shown in Equation (4):where is the original image, is the reflection component, is the illumination component, and is the weighting factor, = 1 when and = 0.1 when .
3.2. Illumination Correction Network
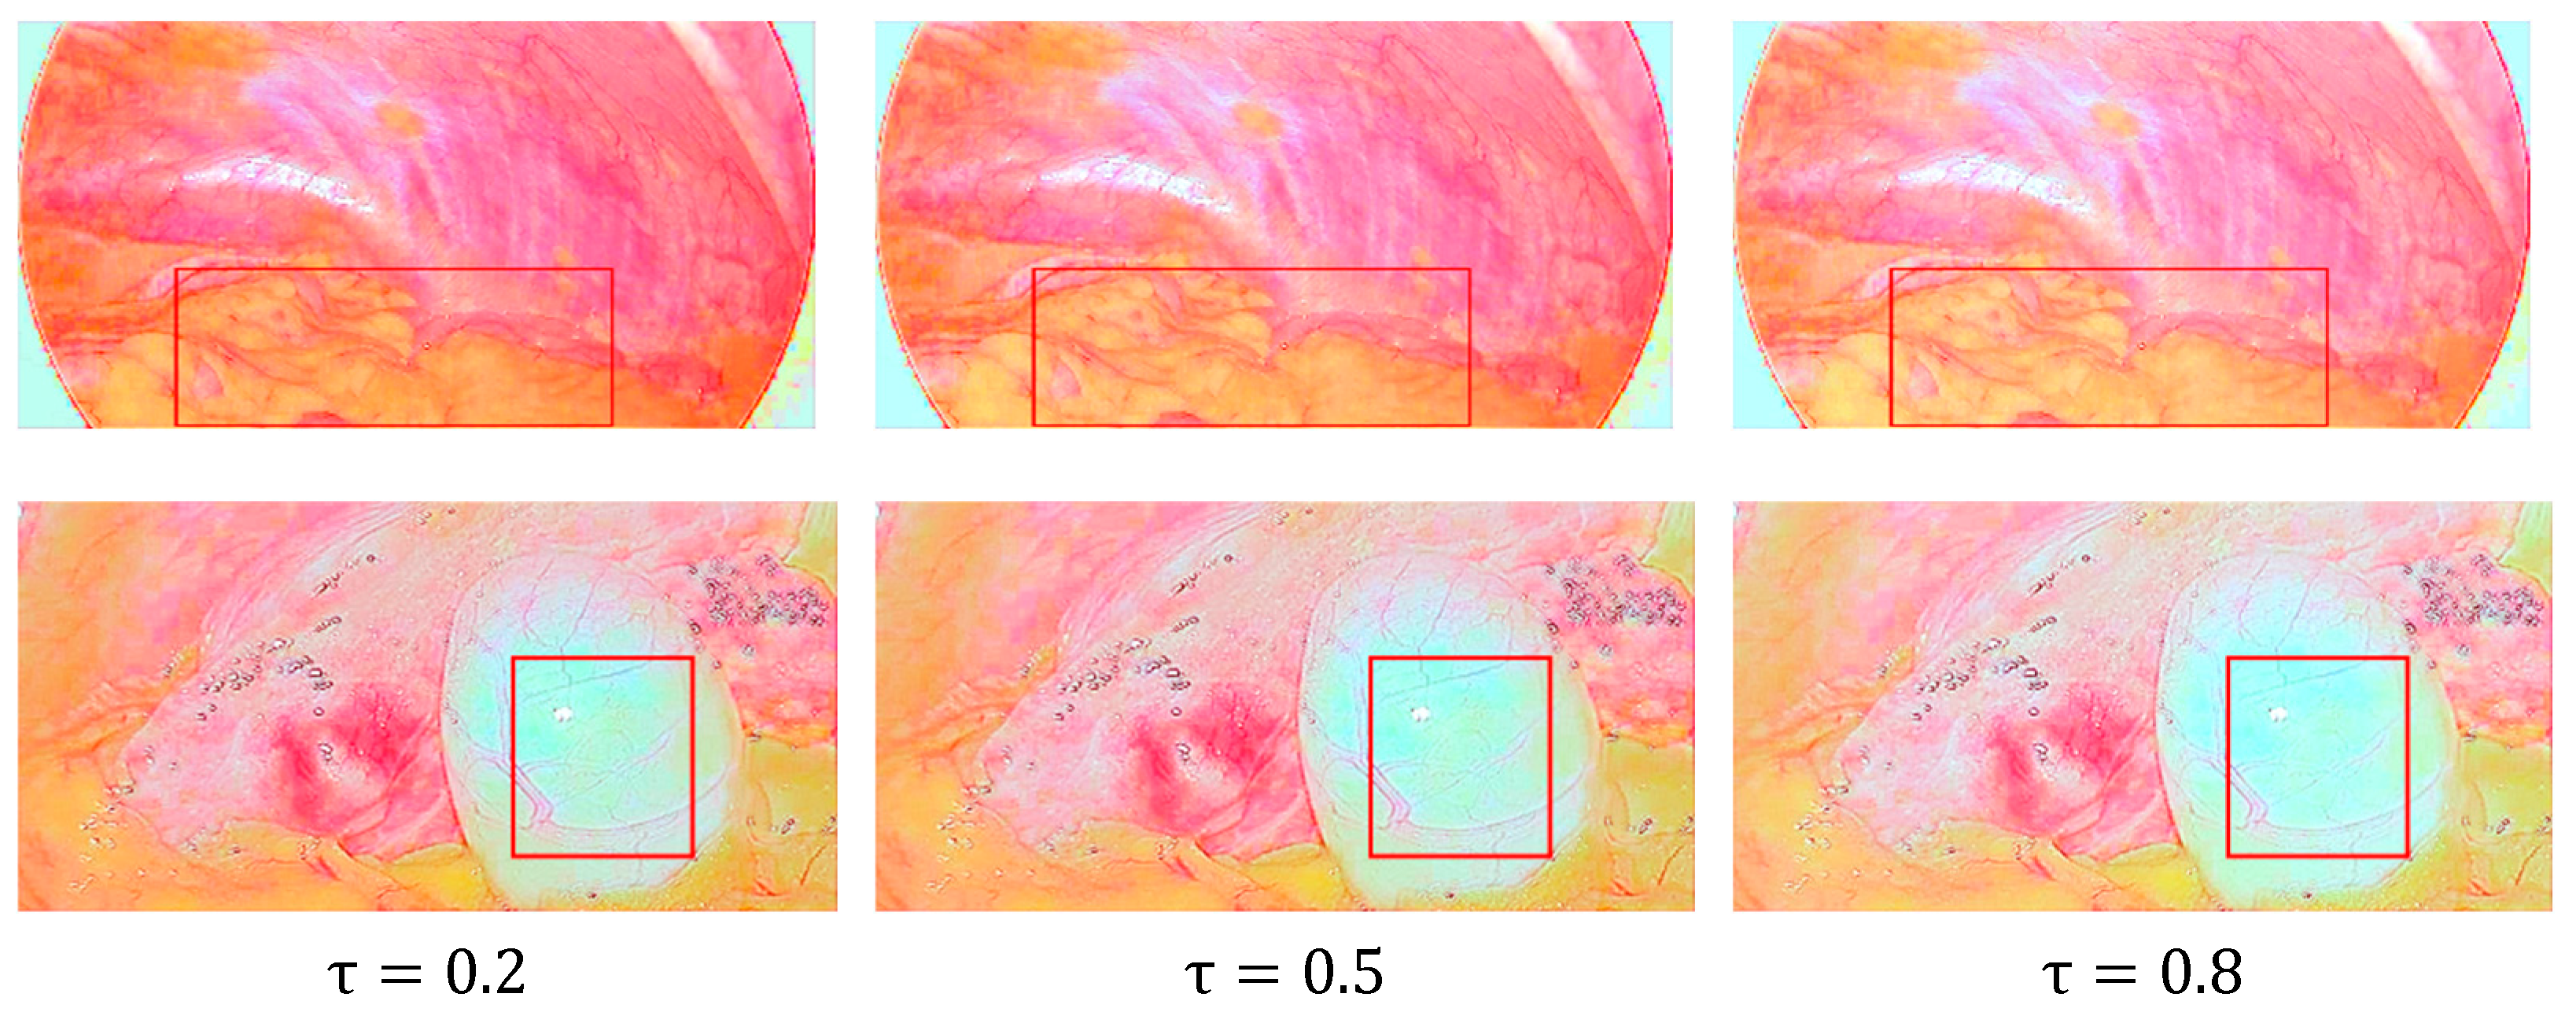
3.3. Reflection Component Enhancement
3.4. Network Training
4. Experiment Results and Discussions
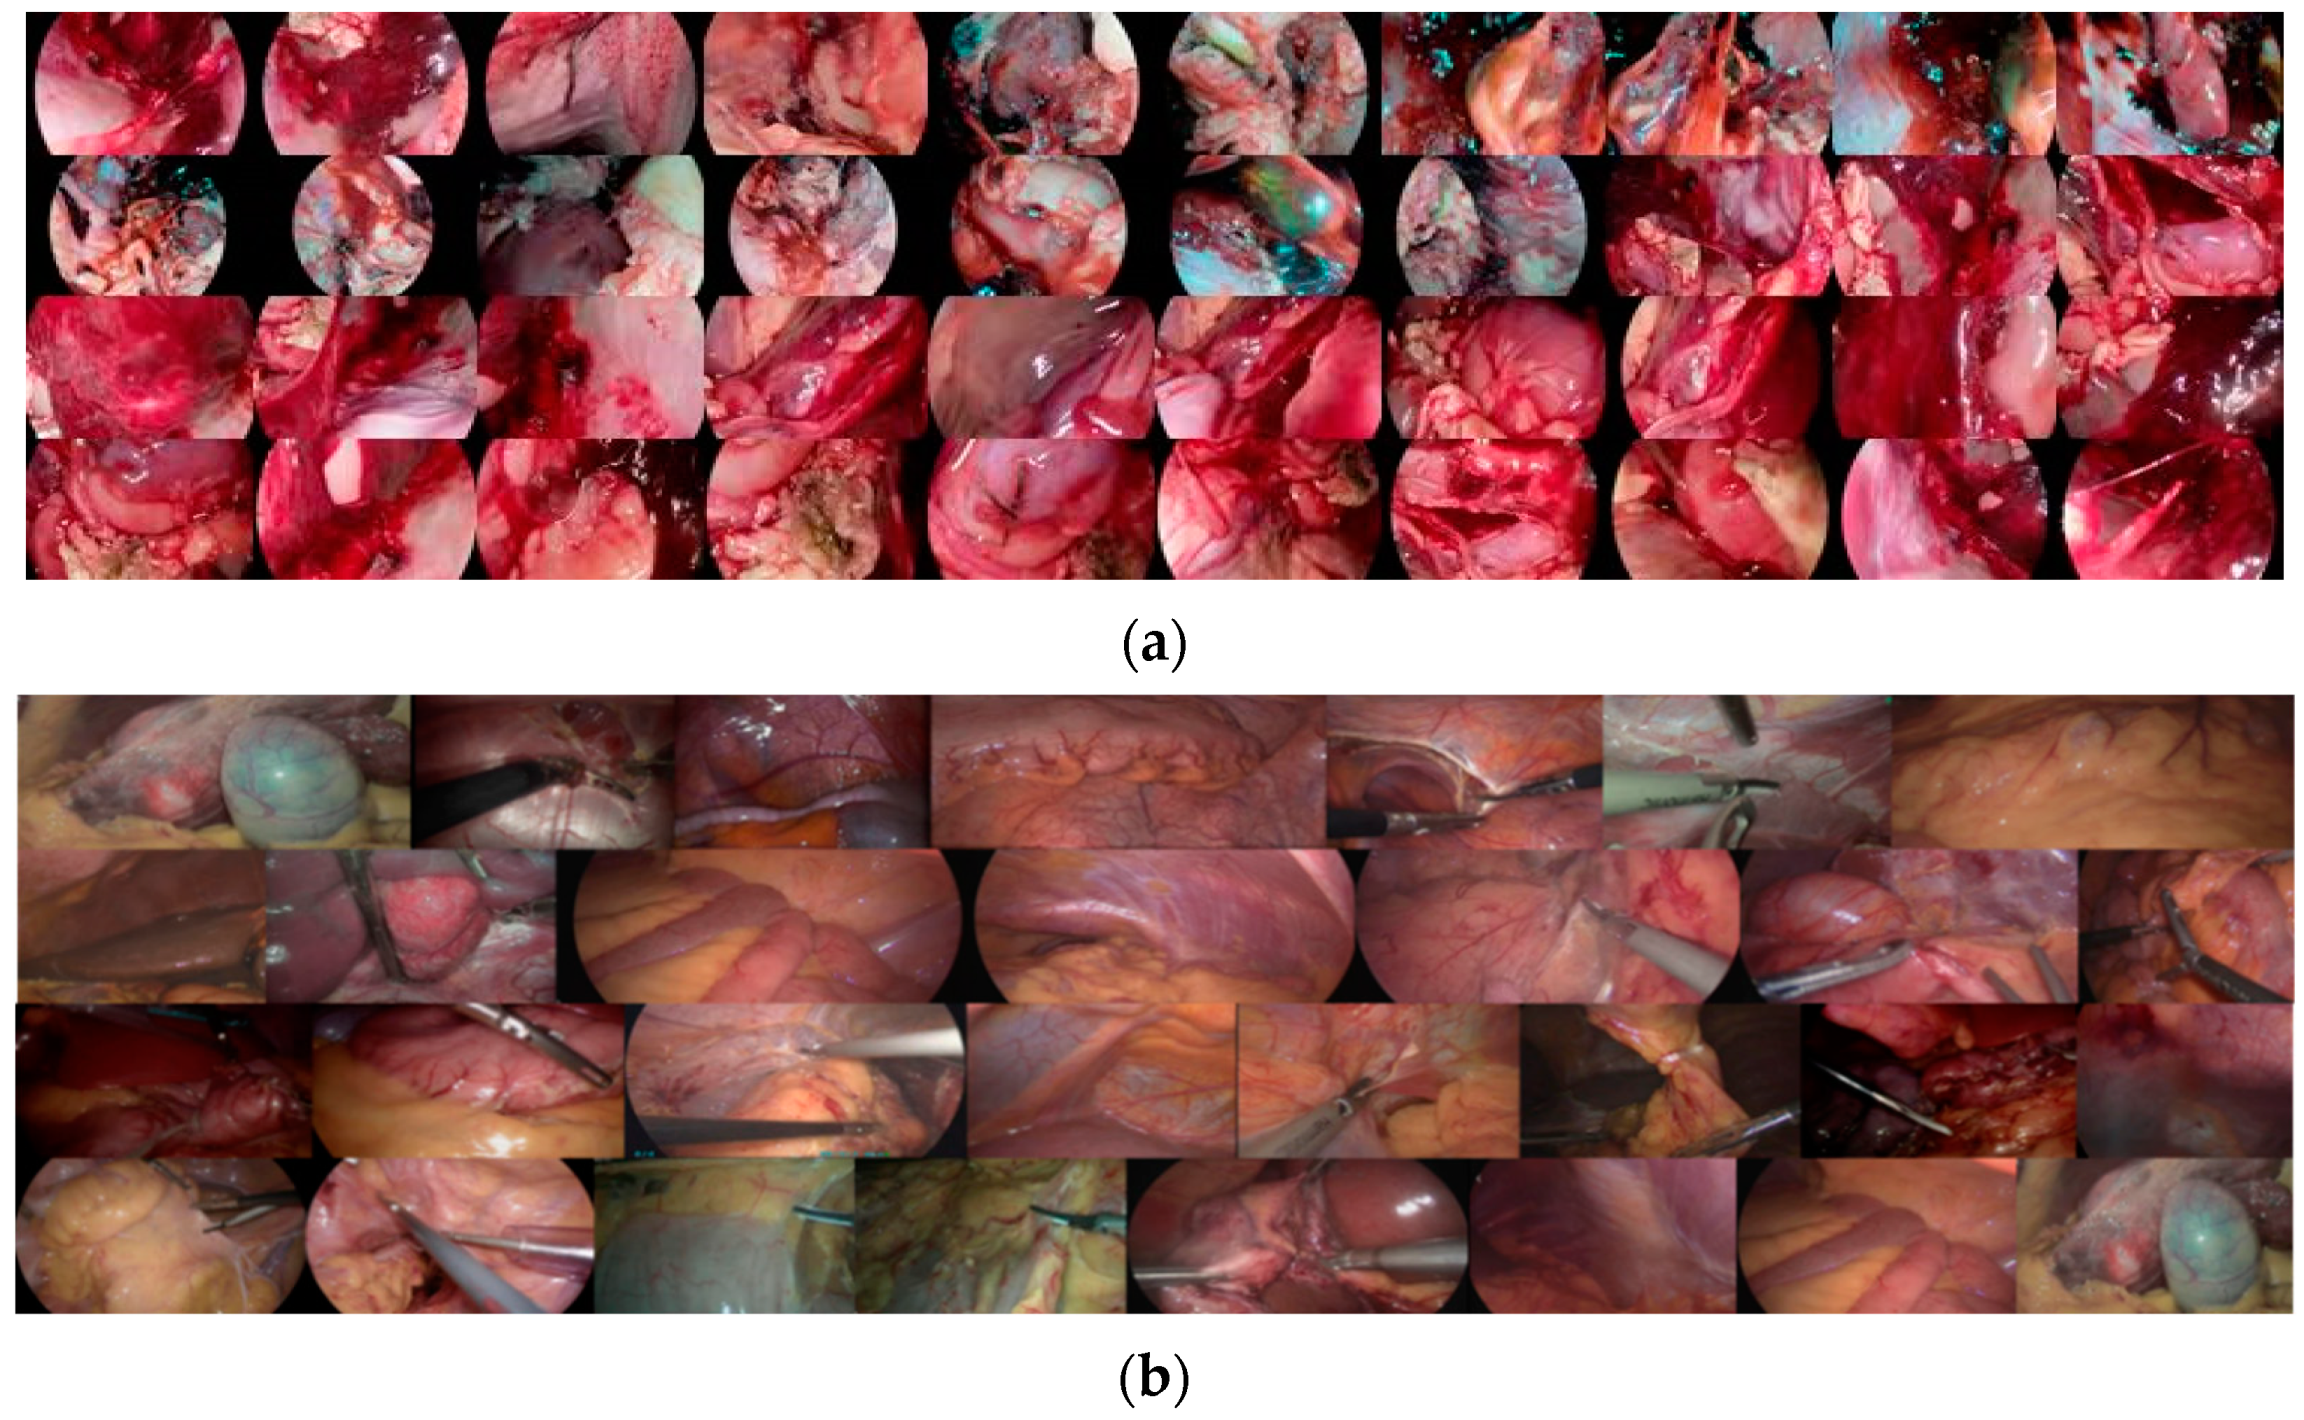
4.1. Datasets
4.2. Subjective and Objective Analysis
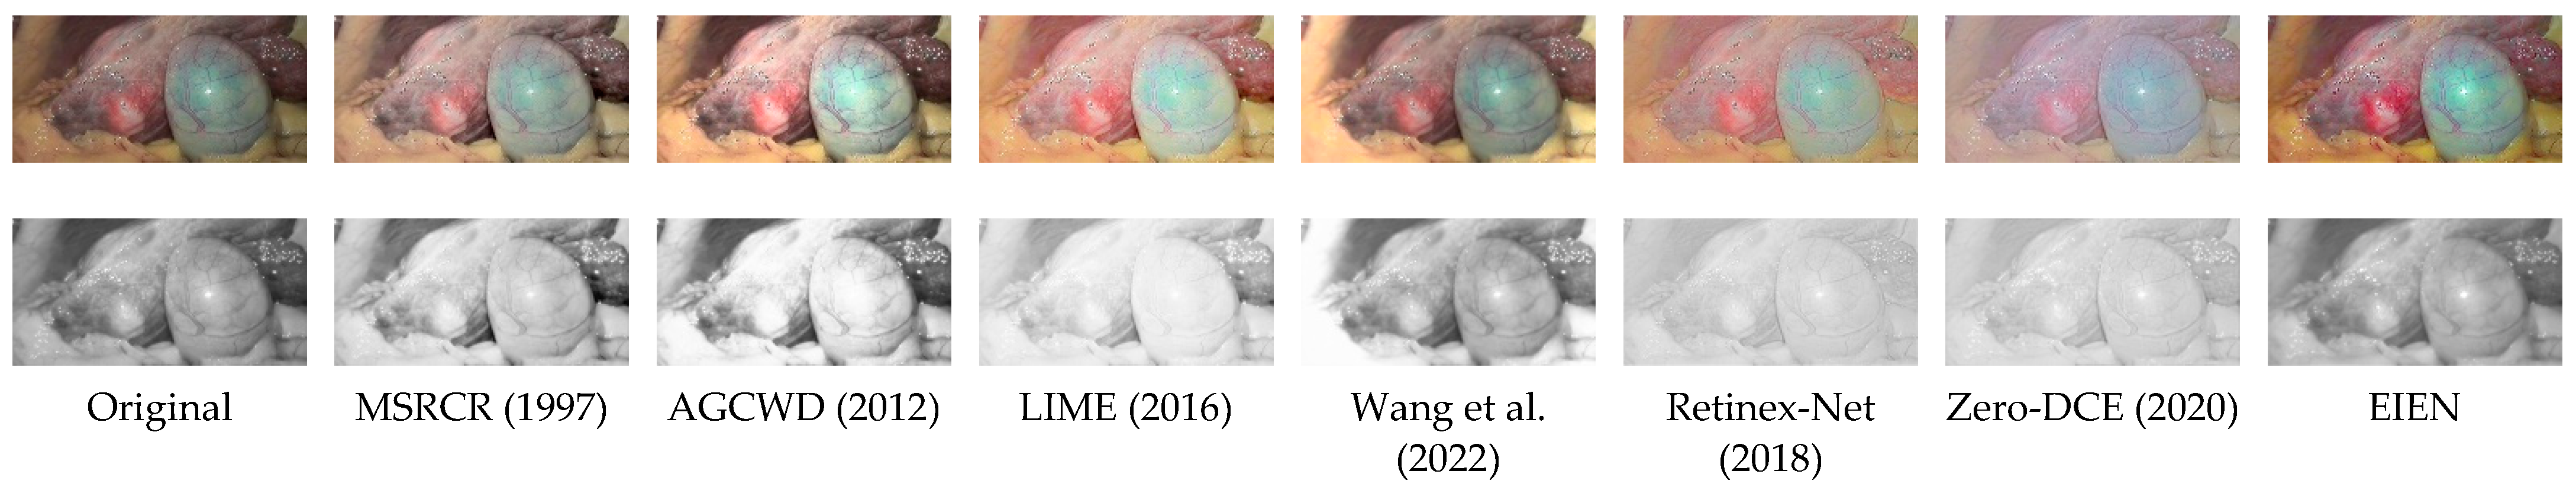
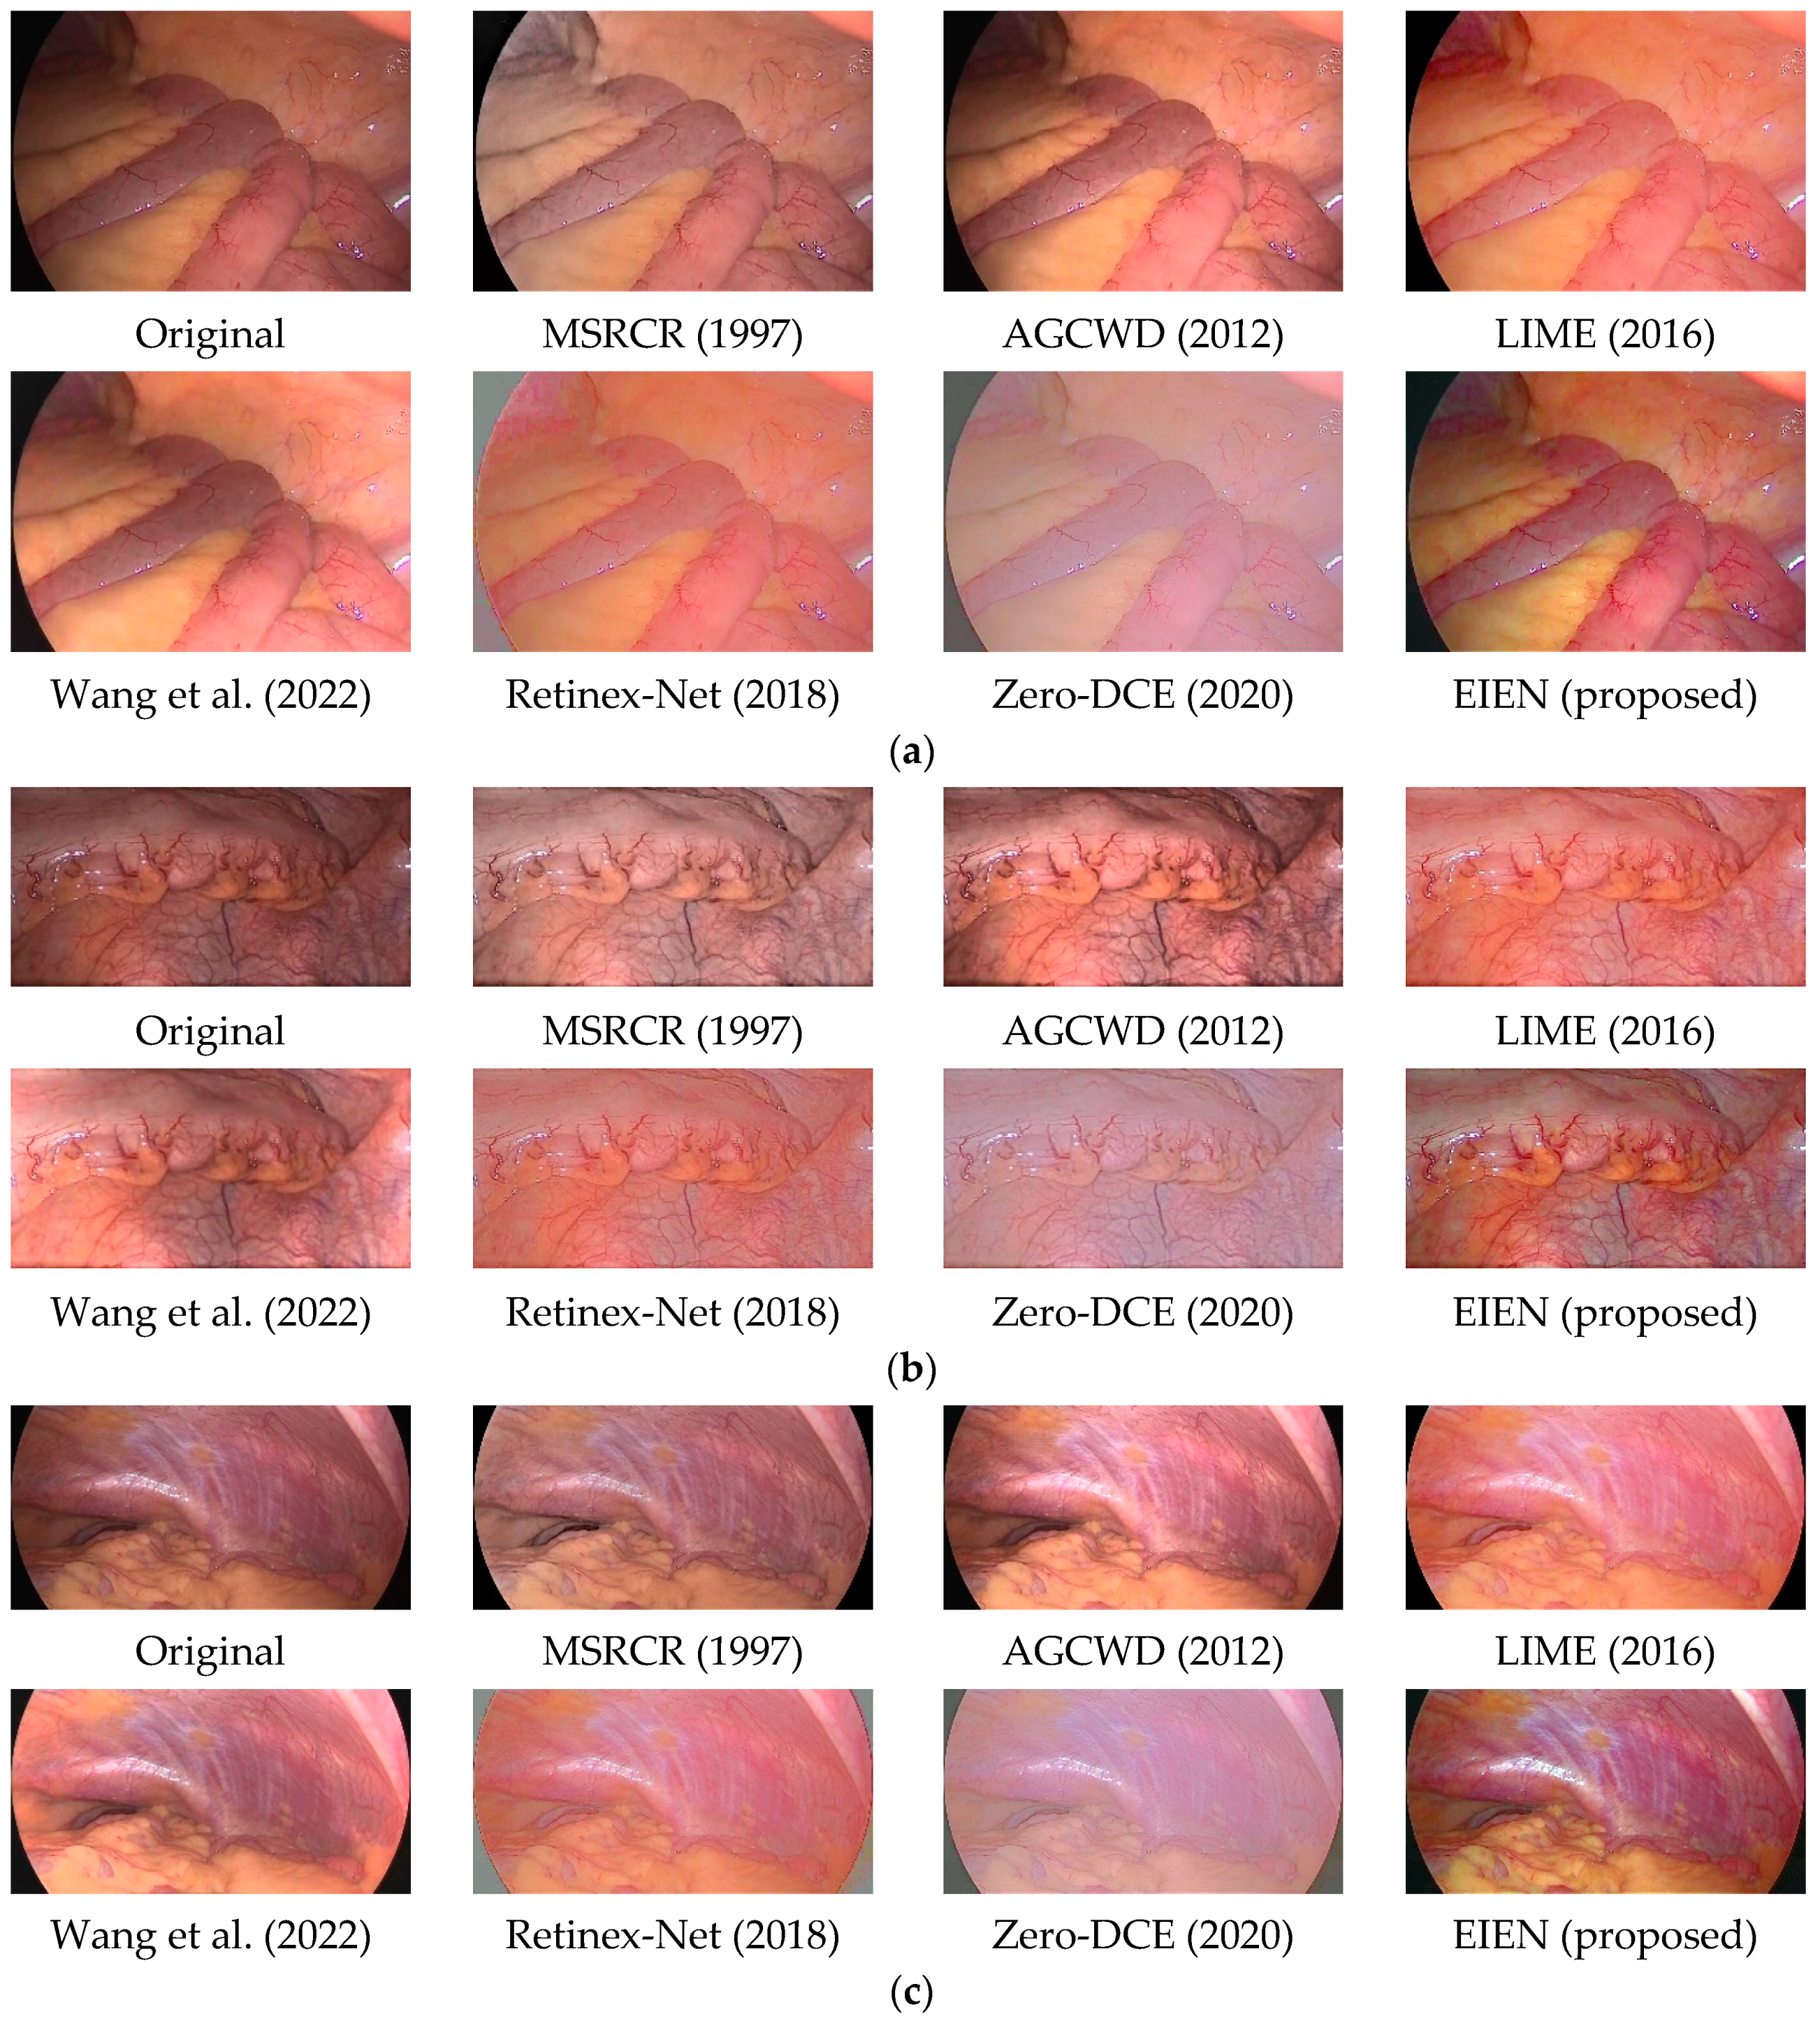
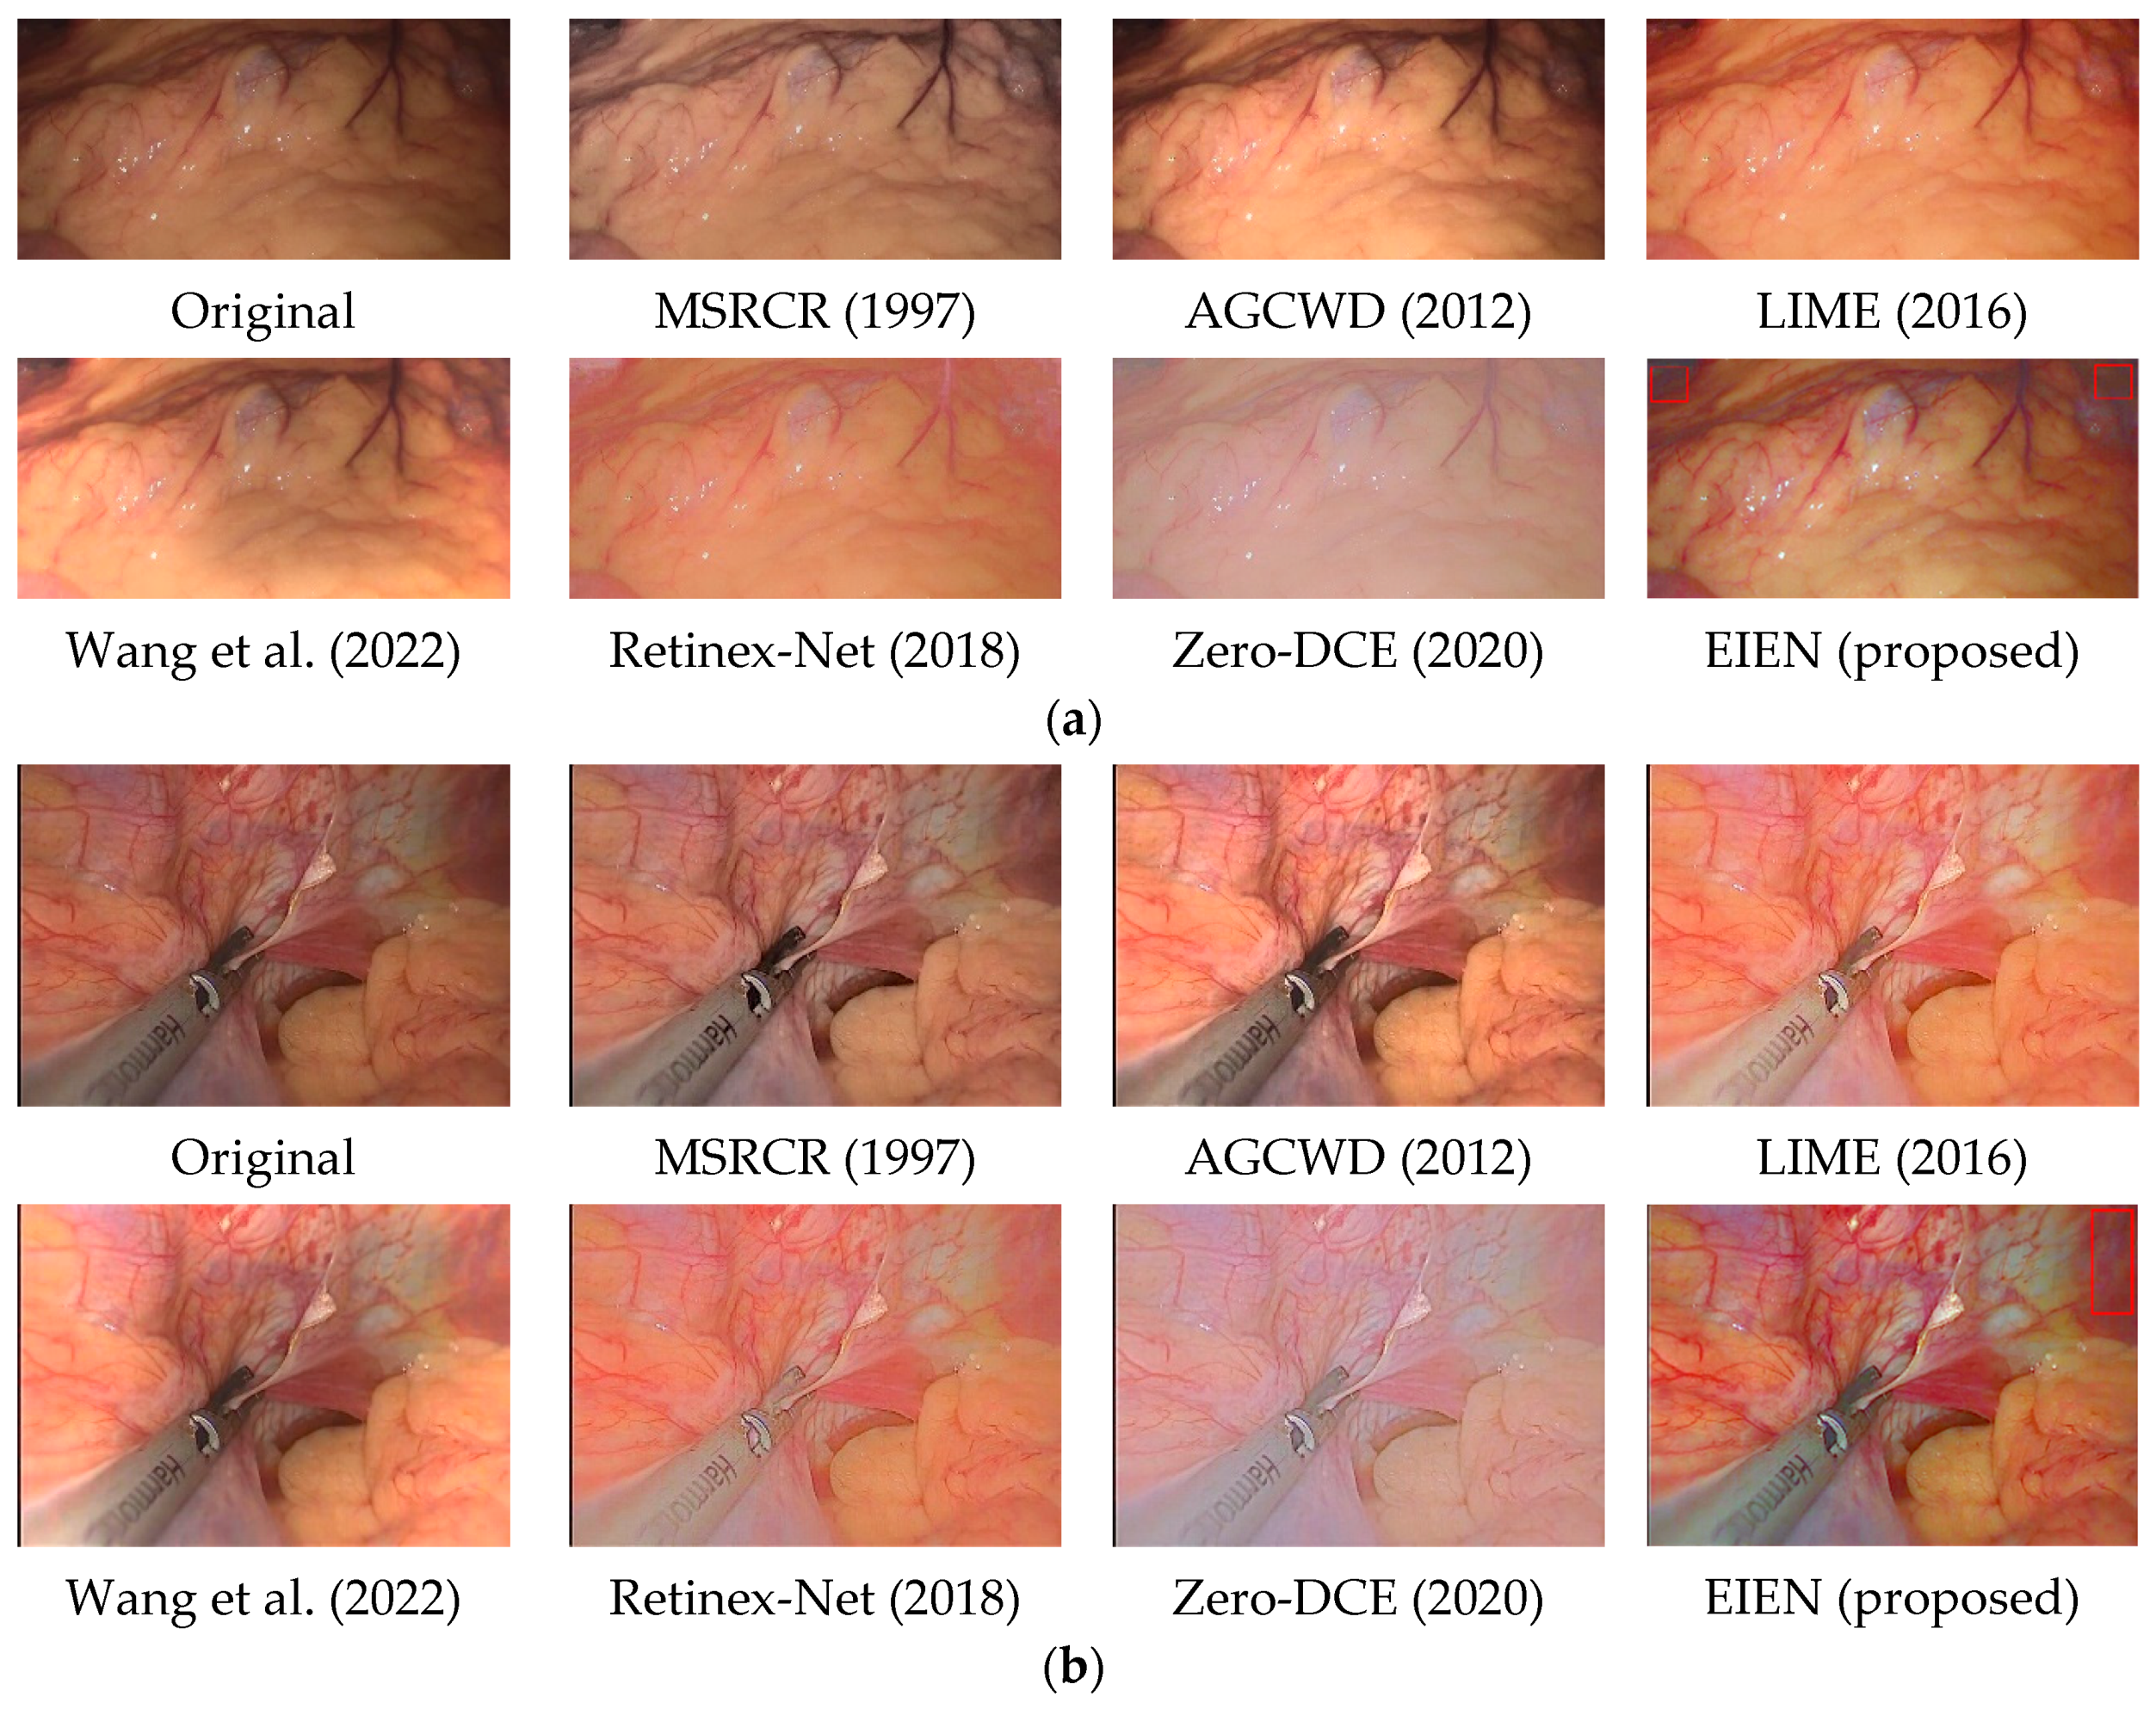
4.2.1. Subjective Analysis
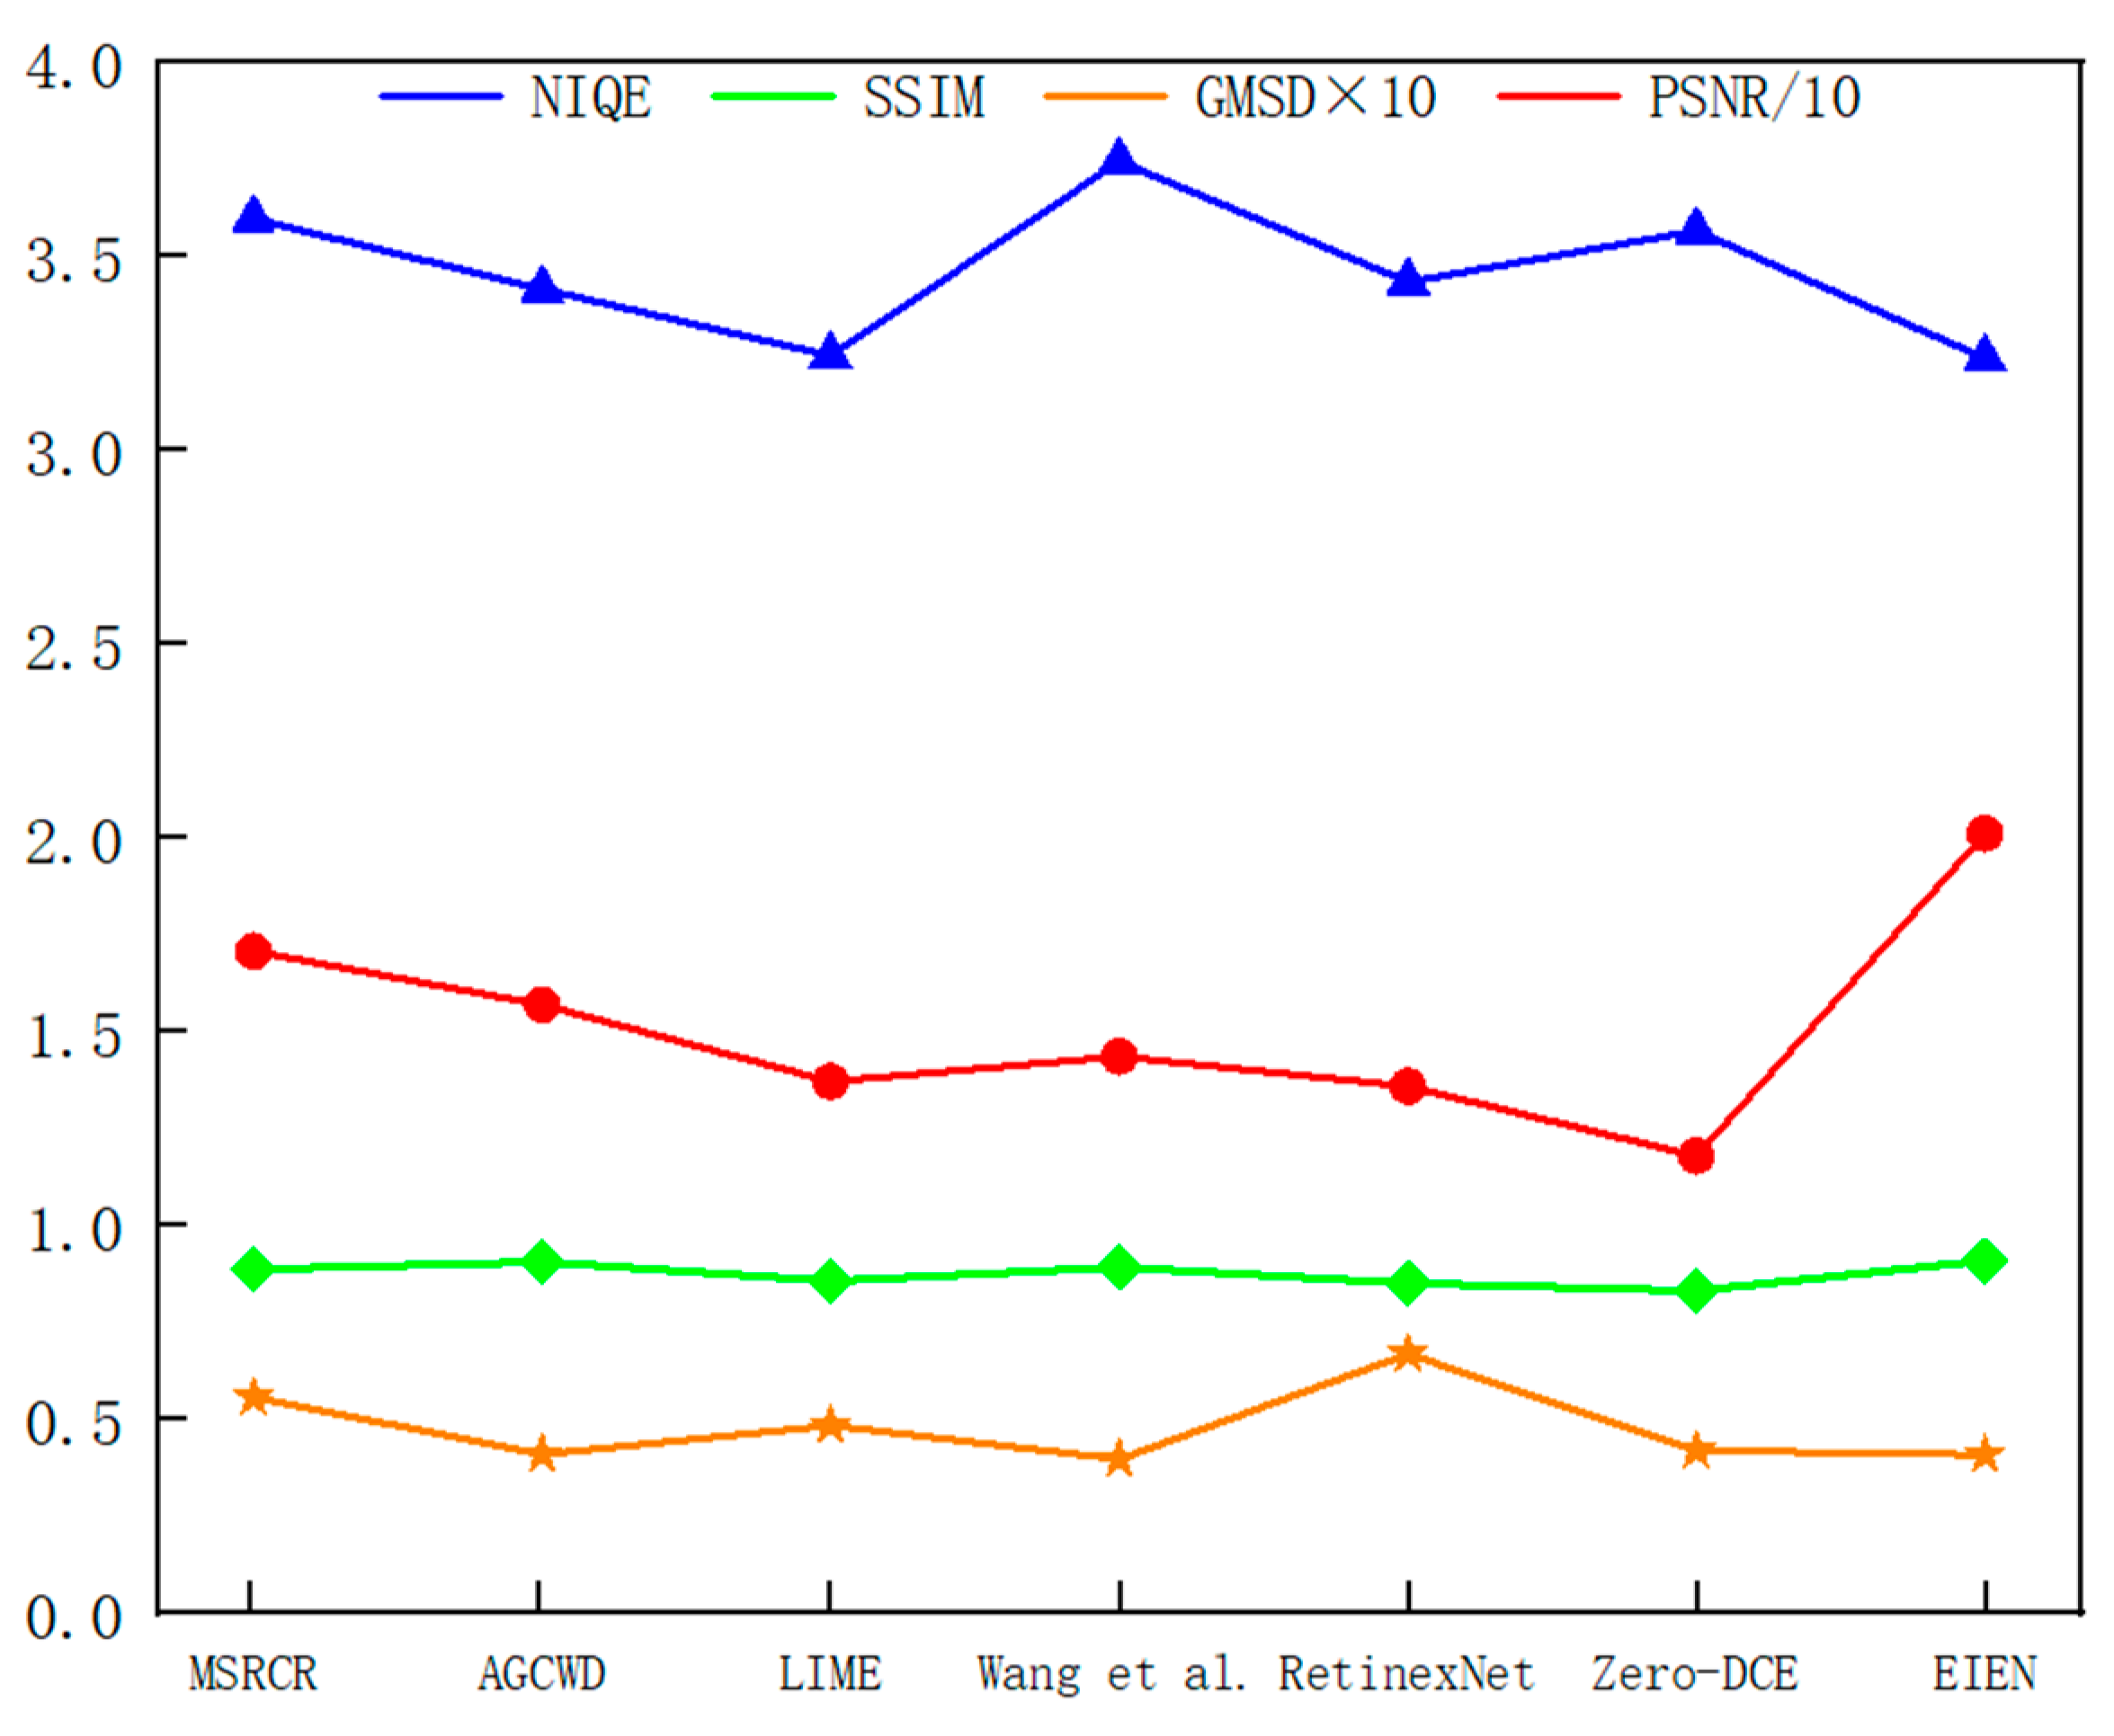
4.2.2. Objective Analysis
4.3. Ablation Studies
4.4. Discussion on the Novelty Our Proposed Method
5. Conclusions and Future Directions
Author Contributions
Funding
Institutional Review Board Statement
Informed Consent Statement
Data Availability Statement
Conflicts of Interest
References
- Sato, T. TXI: Texture and color enhancement imaging for endoscopic image enhancement. J. Healthc. Eng. 2021, 2021, 5518948. [Google Scholar] [CrossRef] [PubMed]
- Pizer, S.M.; Amburn, E.P.; Austin, J.D.; Cromartie, R.; Geselowitz, A.; Greer, T.; ter Haar Romeny, B.; Zimmerman, J.B.; Zuiderveld, K. Adaptive histogram equalization, and its variations. Comput. Vis. Graph. Image Process. 1987, 39, 355–368. [Google Scholar] [CrossRef]
- Ibrahim, H.; Kong, N.S.P. Brightness preserving dynamic histogram equalization for image contrast enhancement. IEEE Trans. Consum. Electron. 2007, 53, 1752–1758. [Google Scholar] [CrossRef]
- Kim, J.-Y.; Kim, L.-S.; Hwang, S.-H. An advanced contrast enhancement using partially overlapped sub-block histogram equalization. IEEE Trans. Circuits Syst. Video Technol. 2001, 11, 475–484. [Google Scholar]
- Veluchamy, M.; Subramani, B. Fuzzy dissimilarity color histogram equalization for contrast enhancement and color correction. Appl. Soft Comput. 2020, 89, 106077. [Google Scholar] [CrossRef]
- Huang, S.-C.; Cheng, F.-C.; Chiu, Y.-S. Efficient contrast enhancement using adaptive gamma correction with weighting distribution. IEEE Trans. Image Process. 2012, 22, 1032–1041. [Google Scholar] [CrossRef]
- Jobson, D.J.; Rahman, Z.-u.; Woodell, G.A. Properties and performance of a center/surround retinex. IEEE Trans. Image Process. 1997, 6, 451–462. [Google Scholar] [CrossRef]
- Rahman, Z.; Jobson, D.J.; Woodell, G.A. Multiscale retinex for color rendition and dynamic range compression. In Proceedings of the SPIE’s 1996 International Symposium on Optical Science, Engineering, and Instrumentation, Denver, CO, USA, 4–9 August 1996; pp. 183–191. [Google Scholar]
- Jobson, D.J.; Rahman, Z.; Woodell, G.A. A multiscale retinex for bridging the gap between color images and the human observation of scenes. IEEE Trans. Image Process. 1997, 6, 965–976. [Google Scholar] [CrossRef] [Green Version]
- Fu, X.; Zeng, D.; Huang, Y.; Zhang, X.-P.; Ding, X. A weighted variational model for simultaneous reflectance and illumination estimation. In Proceedings of the 2016 IEEE Conference on Computer Vision and Pattern Recognition (CVPR), Las Vegas, NV, USA, 27–30 June 2016; pp. 2782–2790. [Google Scholar]
- Guo, X.; Li, Y.; Ling, H. LIME: Low-light image enhancement via illumination map estimation. IEEE Trans. Image Process. 2016, 26, 982–993. [Google Scholar] [CrossRef]
- Wang, L.; Wu, B.; Wang, X.; Zhu, Q.; Xu, K. Endoscopic image luminance enhancement based on the inverse square law for illuminance and retinex. Int. J. Med. Robot. Comput. Assist. Surg. 2022, 18, e2396. [Google Scholar] [CrossRef]
- Lore, K.G.; Akintayo, A.; Sarkar, S. LLNet: A deep autoencoder approach to natural low-light image enhancement. Pattern Recognit. 2017, 61, 650–662. [Google Scholar] [CrossRef] [Green Version]
- Wei, C.; Wang, W.; Yang, W.; Liu, J. Deep retinex decomposition for low-light enhancement. arXiv 2018, arXiv:1808.04560. [Google Scholar]
- Jiang, Y.; Gong, X.; Liu, D.; Cheng, Y.; Fang, C.; Shen, X.; Yang, J.; Zhou, P.; Wang, Z. Enlightengan: Deep light enhancement without paired supervision. IEEE Trans. Image Process. 2021, 30, 2340–2349. [Google Scholar] [CrossRef] [PubMed]
- Guo, C.; Li, C.; Guo, J.; Loy, C.C.; Hou, J.; Kwong, S.; Cong, R. Zero-reference deep curve estimation for low-light image enhancement. In Proceedings of the IEEE/CVF Conference on Computer Vision and Pattern Recognition (CVPR), Seattle, WA, USA, 13–19 June 2020; pp. 1780–1789. [Google Scholar]
- Li, J.; Li, J.; Fang, F.; Li, F.; Zhang, G. Luminance-aware pyramid network for low-light image enhancement. IEEE Trans. Multimed. 2020, 23, 3153–3165. [Google Scholar] [CrossRef]
- Jiang, Q.; Mao, Y.; Cong, R.; Ren, W.; Huang, C.; Shao, F. Unsupervised Decomposition and Correction Network for Low-Light Image Enhancement. IEEE Trans. Intell. Transp. Syst. 2022, 1–16. [Google Scholar] [CrossRef]
- Fu, X.; Liang, B.; Huang, Y.; Ding, X.; Paisley, J. Lightweight pyramid networks for image deraining. IEEE Trans. Neural Netw. Learn. Syst. 2019, 31, 1794–1807. [Google Scholar] [CrossRef] [Green Version]
- Hu, J.; Shen, L.; Sun, G. Squeeze-and-excitation networks. In Proceedings of the IEEE Conference on Computer Vision and Pattern Recognition, Salt Lake City, UT, USA, 18–23 June 2018; pp. 7132–7141. [Google Scholar]
- Gao, Z.; Xie, J.; Wang, Q.; Li, P. Global second-order pooling convolutional networks. In Proceedings of the IEEE/CVF Conference on Computer Vision and Pattern Recognition, Long Beach, CA, USA, 15–20 June 2019; pp. 3024–3033. [Google Scholar]
- Wang, X.; Girshick, R.; Gupta, A.; He, K. Non-local neural networks. In Proceedings of the IEEE Conference on Computer Vision and Pattern Recognition, Salt Lake City, UT, USA, 18–23 June 2018; pp. 7794–7803. [Google Scholar]
- Woo, S.; Park, J.; Lee, J.-Y.; Kweon, I.S. Cbam: Convolutional block attention module. In Proceedings of the European Conference on Computer Vision (ECCV), Munich, Germany, 8–14 September 2018; pp. 3–19. [Google Scholar]
- Lee, H.; Sohn, K.; Min, D. Unsupervised low-light image enhancement using bright channel prior. IEEE Signal Process. Lett. 2020, 27, 251–255. [Google Scholar] [CrossRef]
- Hongpeng, J.; Kejian, Z.; Bo, Y.; Liqiang, W.J. A vascular enhancement algorithm for endoscope image. Opto-Electron. Eng. 2019, 46, 180167. [Google Scholar]
- Chan, S.H.; Khoshabeh, R.; Gibson, K.B.; Gill, P.E.; Nguyen, T.Q. An augmented Lagrangian method for total variation video restoration. IEEE Trans. Image Process. 2011, 20, 3097–3111. [Google Scholar] [CrossRef]
- Zhao, H.; Shi, J.; Qi, X.; Wang, X.; Jia, J. Pyramid scene parsing network. In Proceedings of the IEEE Conference on Computer Vision and Pattern Recognition, Honolulu, HI, USA, 21–26 July 2017; pp. 2881–2890. [Google Scholar]
- Paszke, A.; Gross, S.; Massa, F.; Lerer, A.; Bradbury, J.; Chanan, G.; Killeen, T.; Lin, Z.; Gimelshein, N.; Antiga, L. Pytorch: An imperative style, high-performance deep learning library. In Proceedings of the 33rd Conference on Neural Information Processing Systems (NeurIPS 2019), Vancouver, Canada, 8–14 December 2019; Volume 32. [Google Scholar]
- Kingma, D.P.; Ba, J. Adam: A method for stochastic optimization. arXiv 2014, arXiv:1412.6980. [Google Scholar]
- Hore, A.; Ziou, D. Image Quality Metrics: PSNR vs. SSIM. In Proceedings of the 2010 20th International Conference on Pattern Recognition, Istanbul, Turkey, 23–26 August 2010; pp. 2366–2369. [Google Scholar]
- Wang, Z.; Bovik, A.C.; Sheikh, H.R.; Simoncelli, E.P. Image quality assessment: From error visibility to structural similarity. IEEE Trans. Image Process. 2004, 13, 600–612. [Google Scholar] [CrossRef] [PubMed] [Green Version]
- Xue, W.; Zhang, L.; Mou, X.; Bovik, A.C. Gradient magnitude similarity deviation: A highly efficient perceptual image quality index. IEEE Trans. Image Process. 2013, 23, 684–695. [Google Scholar] [CrossRef] [PubMed] [Green Version]
- Mittal, A.; Soundararajan, R.; Bovik, A.C. Making a “completely blind” image quality analyzer. IEEE Signal Process. Lett. 2012, 20, 209–212. [Google Scholar] [CrossRef]


| Methods | Images | |||
|---|---|---|---|---|
| Figure 8a | Figure 8b | Figure 8c | Average | |
| MSRCR [9] | 3.439 | 3.954 | 3.489 | 3.598 |
| AGCWD [6] | 3.372 | 3.652 | 3.547 | 3.416 |
| LIME [11] | 2.892 | 3.836 | 2.804 | 3.244 |
| Wang et al. [12] | 3.882 | 3.848 | 4.360 | 3.746 |
| Retinex-Net [14] | 2.928 | 4.180 | 3.061 | 3.434 |
| Zero-DCE [16] | 3.353 | 3.905 | 3.613 | 3.567 |
| EIEN | 3.065 | 3.577 | 2.984 | 3.237 |
| Methods | Images | |||
|---|---|---|---|---|
| Figure 8a | Figure 8b | Figure 8c | Average | |
| MSRCR [9] | 0.884 | 0.870 | 0.918 | 0.888 |
| AGCWD [6] | 0.941 | 0.870 | 0.942 | 0.908 |
| LIME [11] | 0.870 | 0.866 | 0.873 | 0.857 |
| Wang et al. [12] | 0.896 | 0.887 | 0.906 | 0.894 |
| Retinex-Net [14] | 0.866 | 0.884 | 0.888 | 0.852 |
| Zero-DCE [16] | 0.832 | 0.852 | 0.858 | 0.832 |
| EIEN | 0.949 | 0.908 | 0.967 | 0.910 |
| Methods | Images | |||
|---|---|---|---|---|
| Figure 8a | Figure 8b | Figure 8c | Average | |
| MSRCR [9] | 0.058 | 0.048 | 0.042 | 0.056 |
| AGCWD [6] | 0.021 | 0.061 | 0.030 | 0.041 |
| LIME [11] | 0.042 | 0.036 | 0.045 | 0.049 |
| Wang et al. [12] | 0.030 | 0.043 | 0.037 | 0.040 |
| Retinex-Net [14] | 0.060 | 0.040 | 0.067 | 0.067 |
| Zero-DCE [16] | 0.040 | 0.031 | 0.049 | 0.042 |
| EIEN | 0.031 | 0.040 | 0.028 | 0.041 |
| Methods | Images | |||
|---|---|---|---|---|
| Figure 8a | Figure 8b | Figure 8c | Average | |
| MSRCR [9] | 15.684 | 14.182 | 20.026 | 17.086 |
| AGCWD [6] | 16.436 | 15.803 | 16.444 | 15.706 |
| LIME [11] | 14.516 | 13.445 | 14.321 | 13.723 |
| Wang et al. [12] | 13.846 | 13.29 | 14.561 | 14.365 |
| Retinex-Net [14] | 13.547 | 14.265 | 14.102 | 13.595 |
| Zero-DCE [16] | 11.741 | 11.626 | 12.297 | 11.801 |
| EIEN | 21.428 | 19.648 | 24.543 | 20.112 |
| Methods | EIEN-Decom | EIEN-ICN | EIEN-RCE | EIEN |
|---|---|---|---|---|
| SIZE (M) | 0.831 | 1.074 | - | 1.905 |
| TIME (S) | 0.015 | 0.033 | 0.005 | 0.053 |
Publisher’s Note: MDPI stays neutral with regard to jurisdictional claims in published maps and institutional affiliations. |
© 2022 by the authors. Licensee MDPI, Basel, Switzerland. This article is an open access article distributed under the terms and conditions of the Creative Commons Attribution (CC BY) license (https://creativecommons.org/licenses/by/4.0/).
Share and Cite
An, Z.; Xu, C.; Qian, K.; Han, J.; Tan, W.; Wang, D.; Fang, Q. EIEN: Endoscopic Image Enhancement Network Based on Retinex Theory. Sensors 2022, 22, 5464. https://doi.org/10.3390/s22145464
An Z, Xu C, Qian K, Han J, Tan W, Wang D, Fang Q. EIEN: Endoscopic Image Enhancement Network Based on Retinex Theory. Sensors. 2022; 22(14):5464. https://doi.org/10.3390/s22145464
Chicago/Turabian StyleAn, Ziheng, Chao Xu, Kai Qian, Jubao Han, Wei Tan, Dou Wang, and Qianqian Fang. 2022. "EIEN: Endoscopic Image Enhancement Network Based on Retinex Theory" Sensors 22, no. 14: 5464. https://doi.org/10.3390/s22145464