
Selection of the Best Set of Features for sEMG-Based Hand Gesture Recognition Applying a CNN Architecture

 and
and
Abstract
:1. Introduction
- Derived from the good performance obtained with the features TD-PSD1 [27], we propose to extract the set of five features derived from spectral moments in time (TD-PSD2), which Khushaba et al. [28] demonstrated decreases the variability in the classification performance by changing limb position and to use these features to generate the image set for training a CNN, where the width of the image is TD-PSD2 features and the height is the acquisition channels rearranged accordingly so that each signal has the opportunity to be adjacent to all the others, which allows the CNN to obtain all the possible correlations between the signals involved [25].
- A new type of image is proposed where not only the channels but also the features are reorganized, in such a way that the image has all the possible correlations between features and channels involved, the width of the image is TD-PSD2 features rearranged and the height is the channels rearranged.
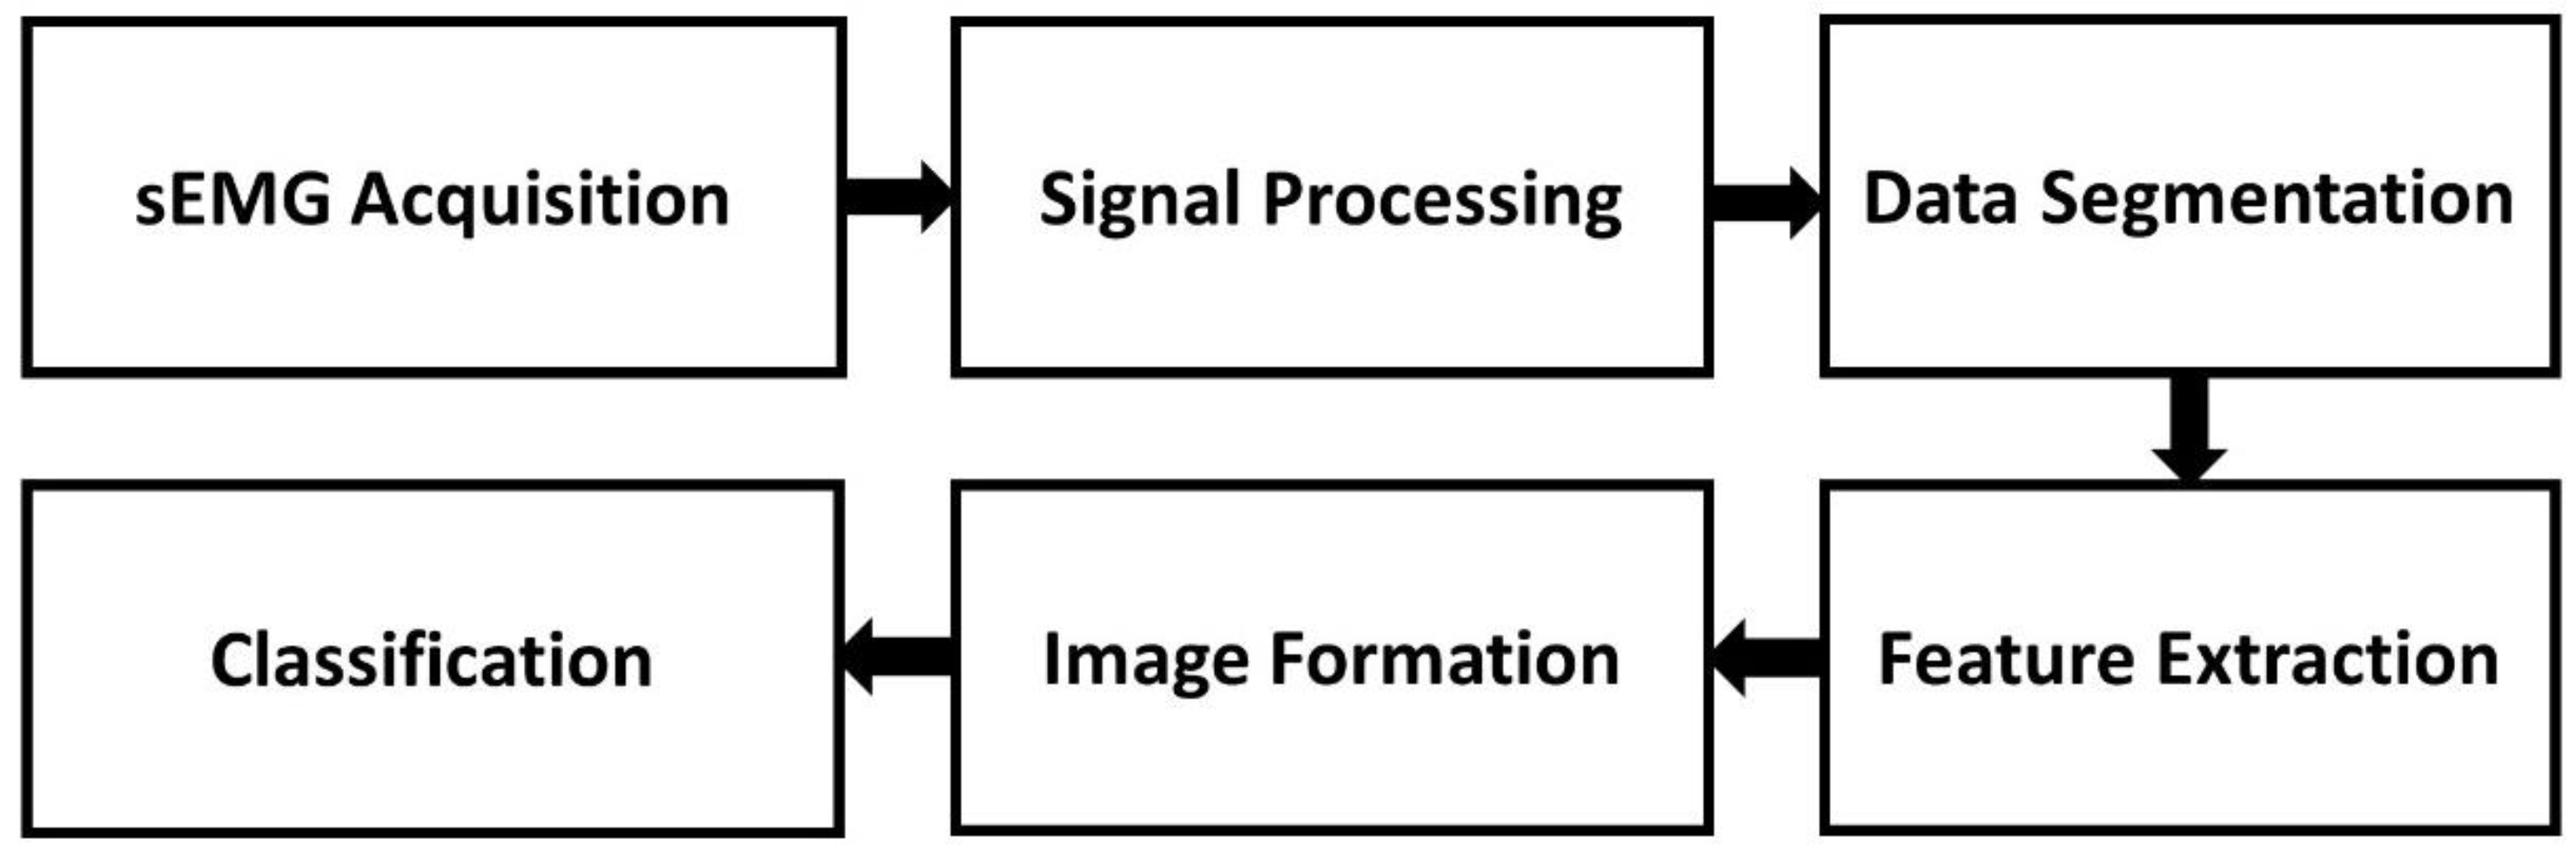
2. Materials and Methods
2.1. sEMG Acquisition
2.1.1. Nina Pro Database
2.1.2. Acquisition Protocol
2.2. Signal Processing
2.3. Data Segmentation
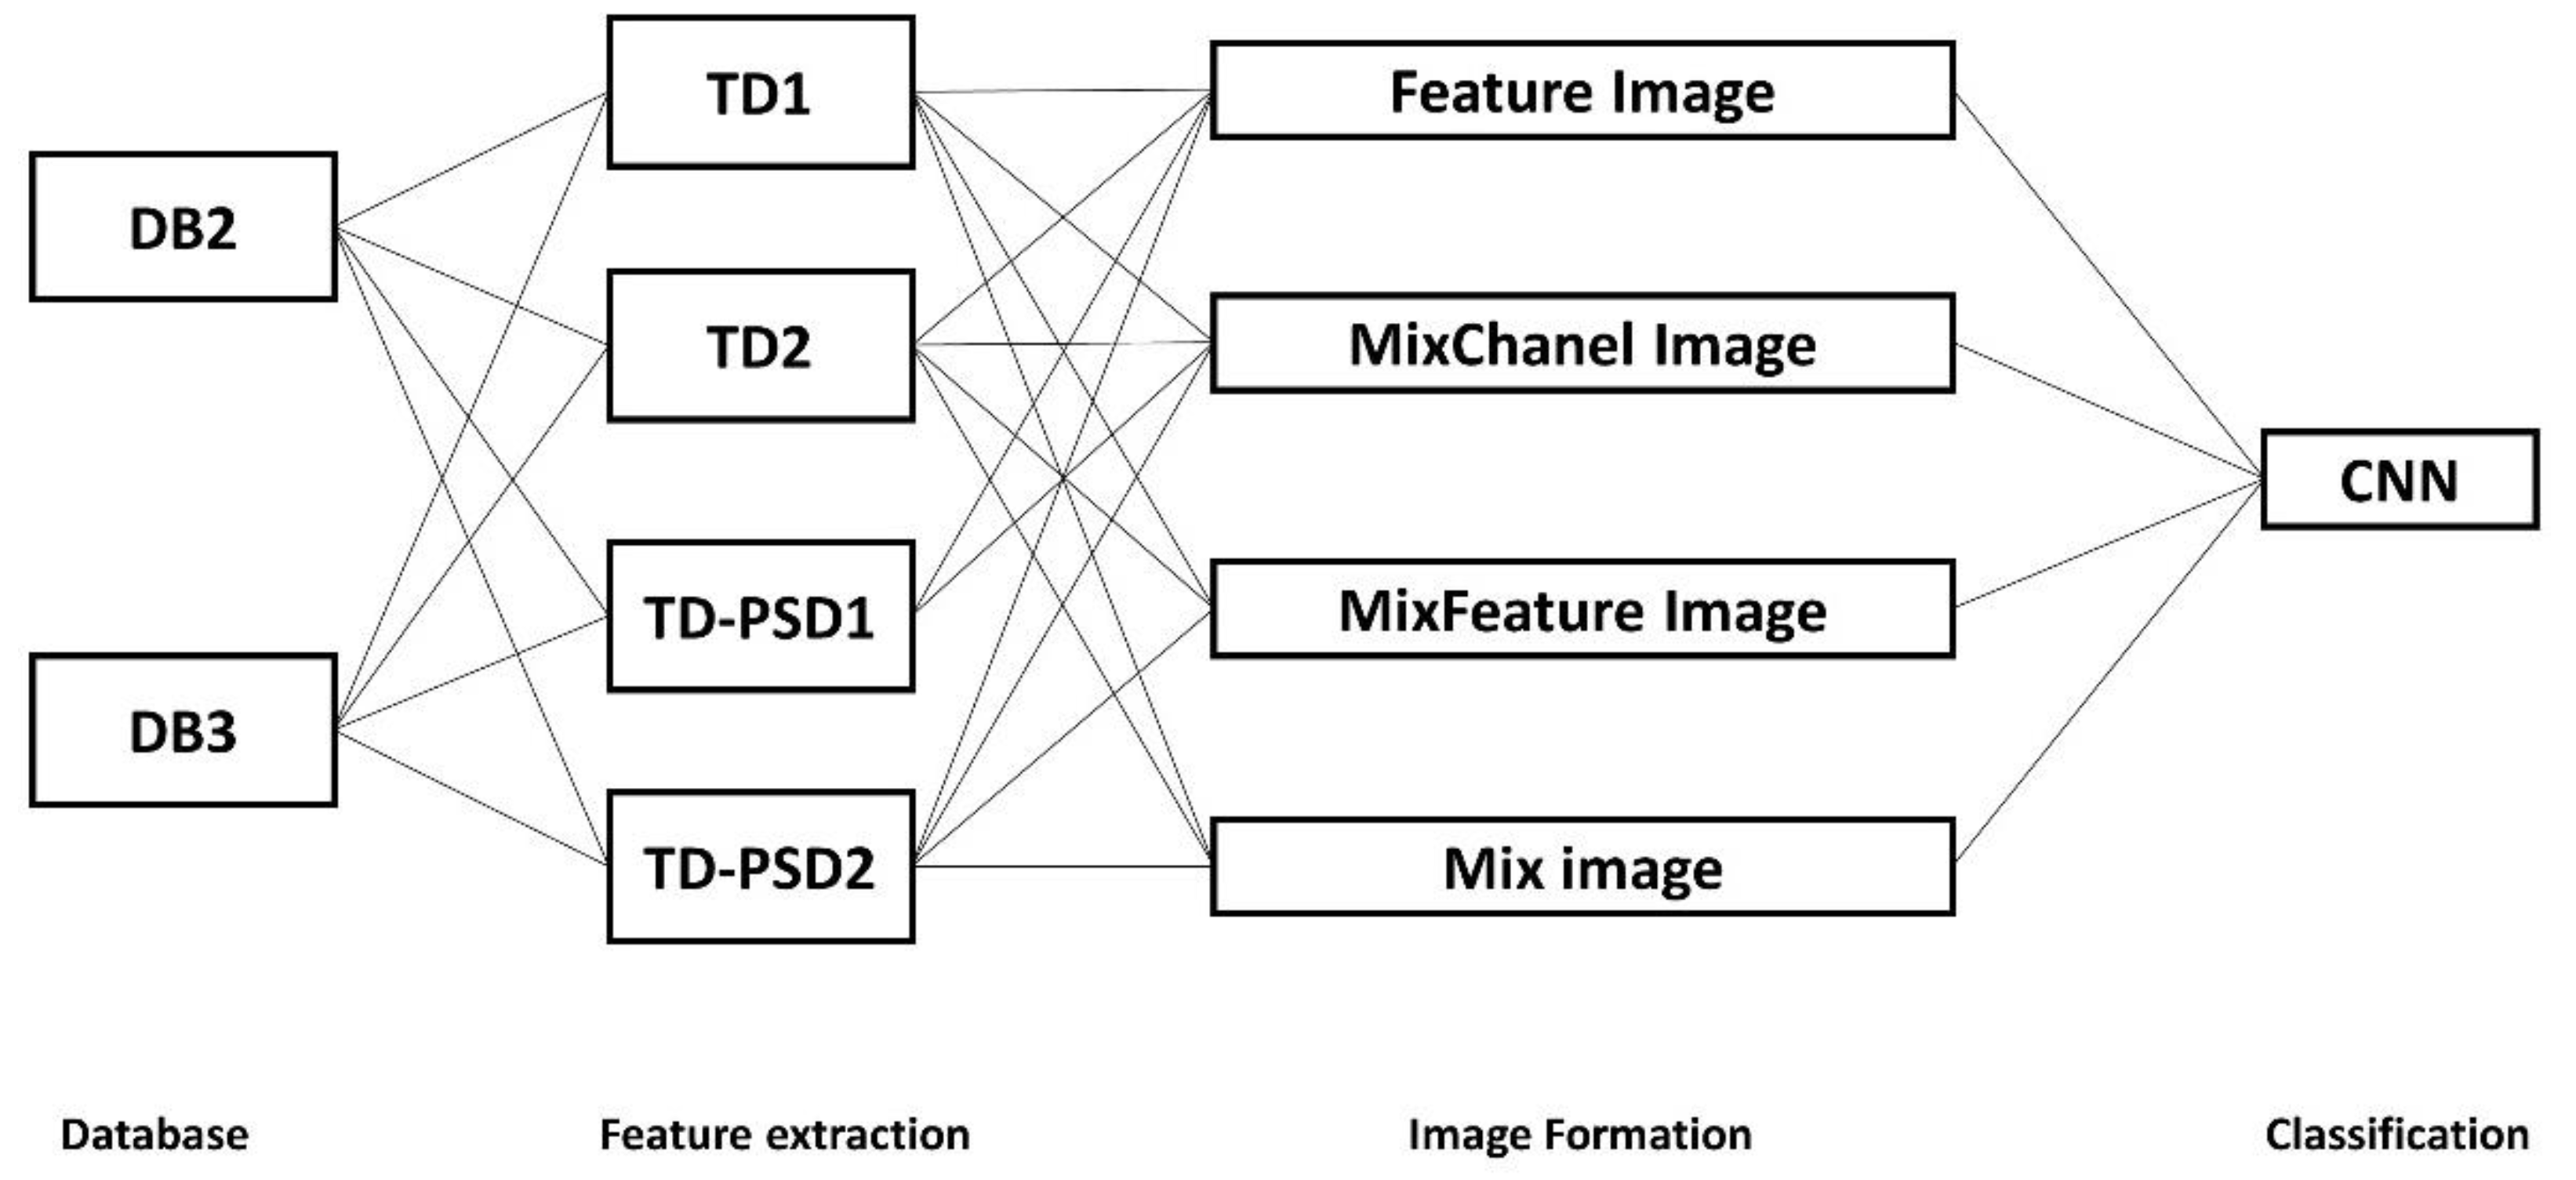
2.4. Feature Extraction
2.5. Image Formation
- Feature Image is obtained directly from the feature extraction of each window, with a size of 12 × W, where 12 is the height of the image (channels) and W is the width of the image, equal to the number of features extracted, which depends on the feature set used.
- MixChannel Image is obtained by applying the rearranged algorithm to the acquisition channels as in [25], leaving an image of 72 × W, where 72 is the height of the image after applying the algorithm and W is the width of the image, equal to the number of features extracted, which depends on the feature set used.
- MixFeature Image is obtained by applying the rearranged algorithm [25] to the features, with a size of 12 × W, where 12 is the height of the image (channels) and W is the width of the image, the result of applying the algorithm to the features, leaving a different image width for each proposed set of features. For the TD-PSD1 set, this type of image is not implemented because only two features are already adjacent to each other.
- Mix Image is obtained by applying the rearranged algorithm [25] both to the channels and to the features, with a size of 72 × W, where 72 is the height of the image after applying the algorithm to the channels, and W is the width of the image, the result of applying the algorithm to the features, leaving a different image width for each set of features proposed, in the same way. For the TD-PSD1 set, this type of image is not implemented since it has only two features, and the image would be identical to the MixChannel Image.
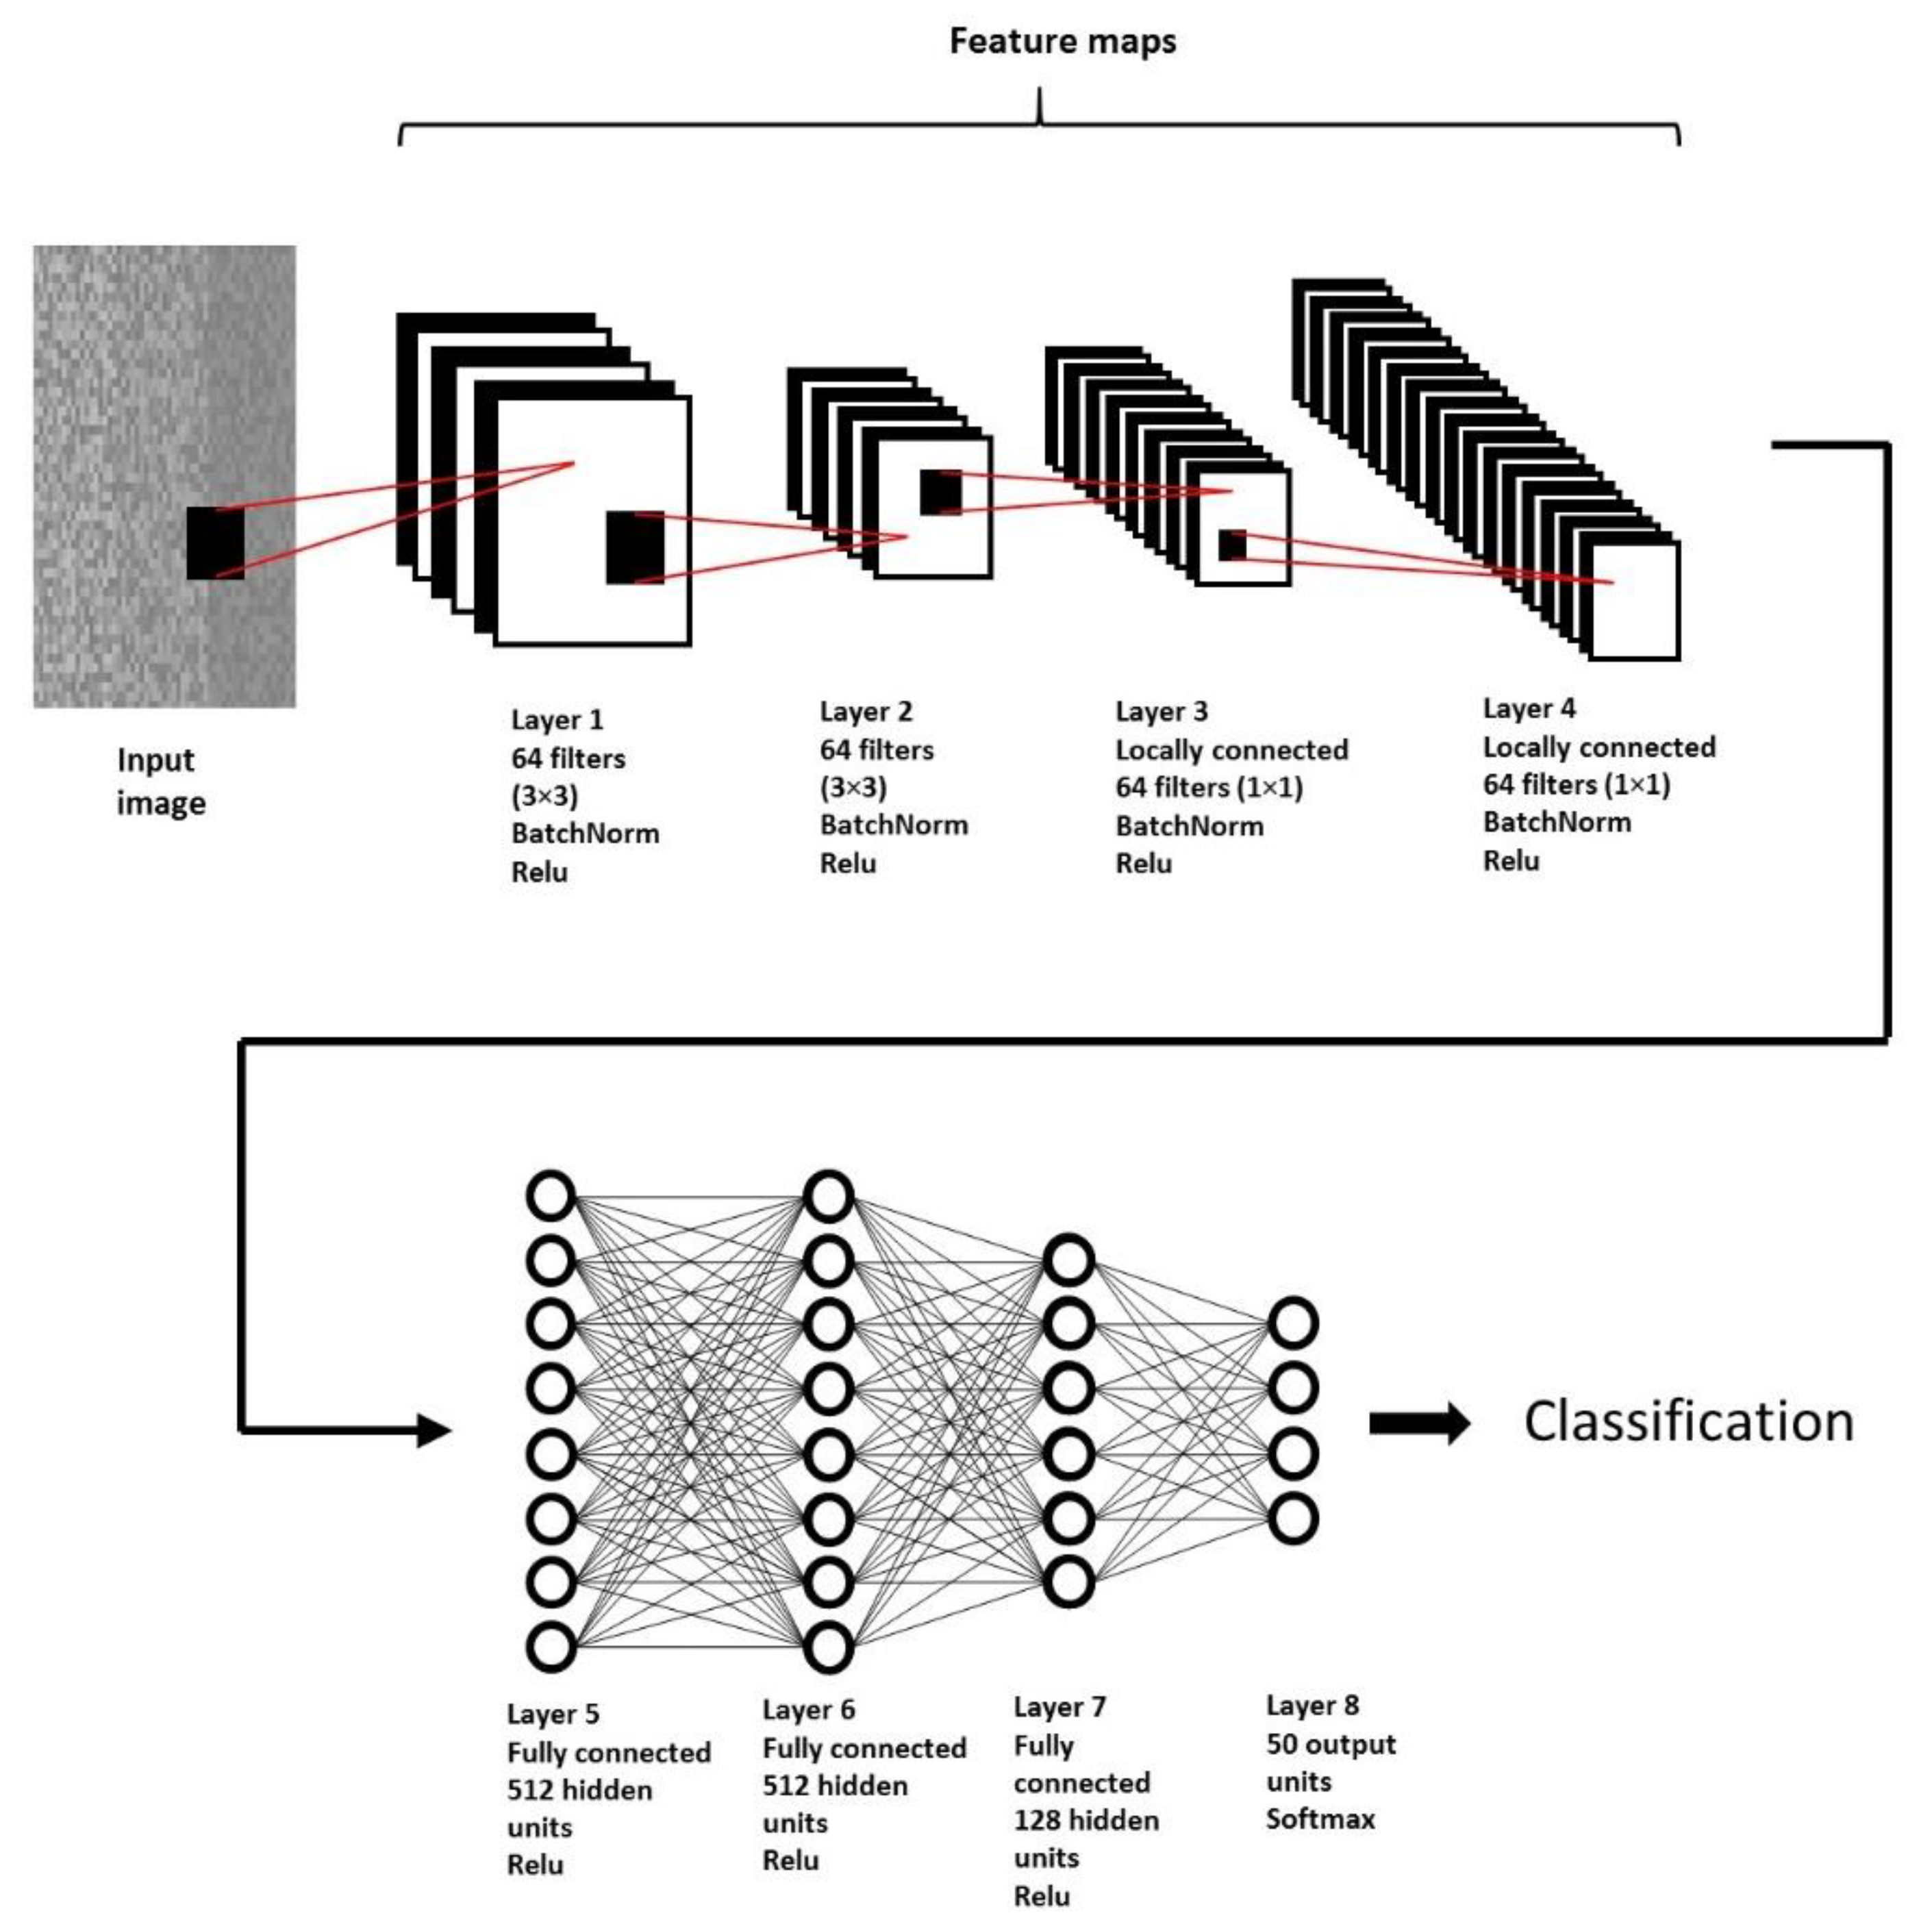
2.6. CNN Architecture
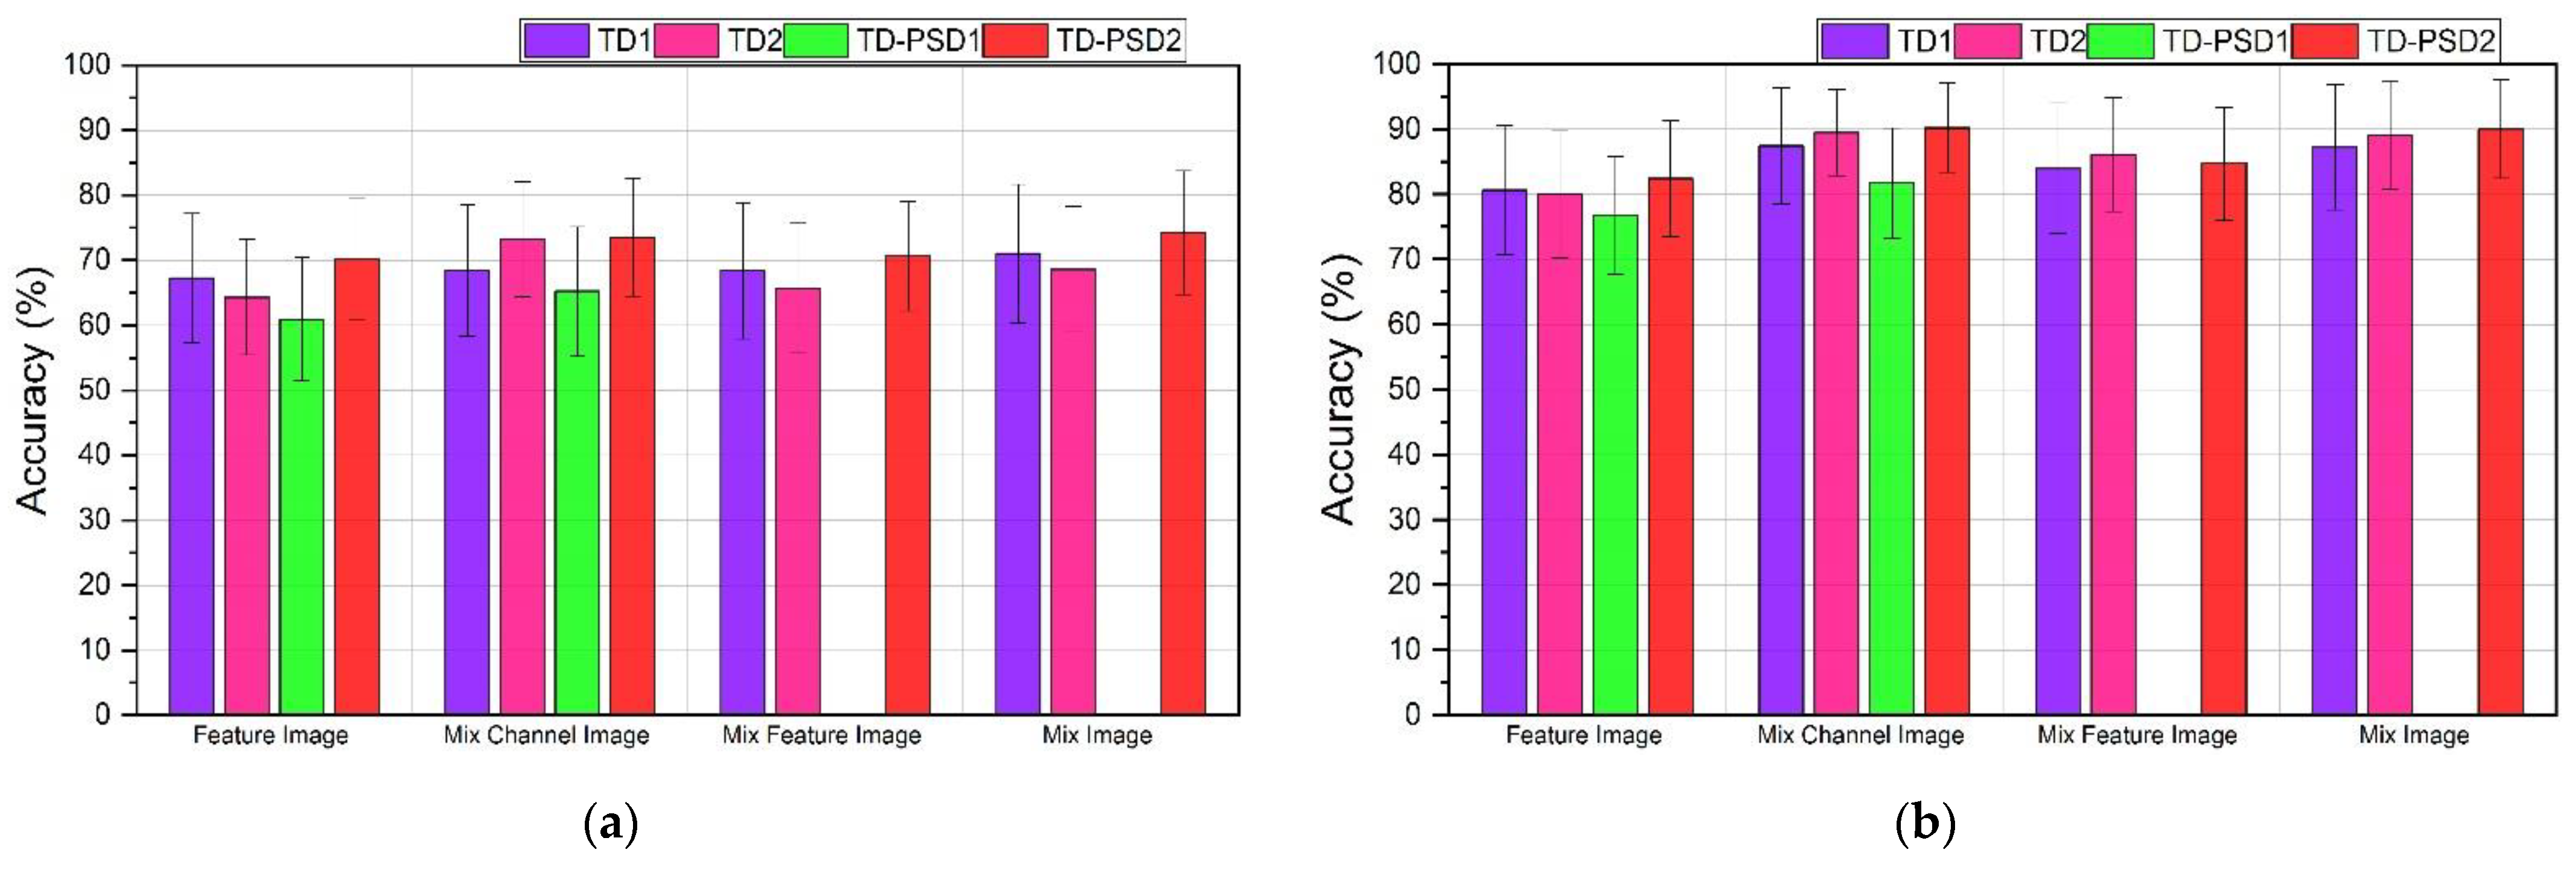
3. Results
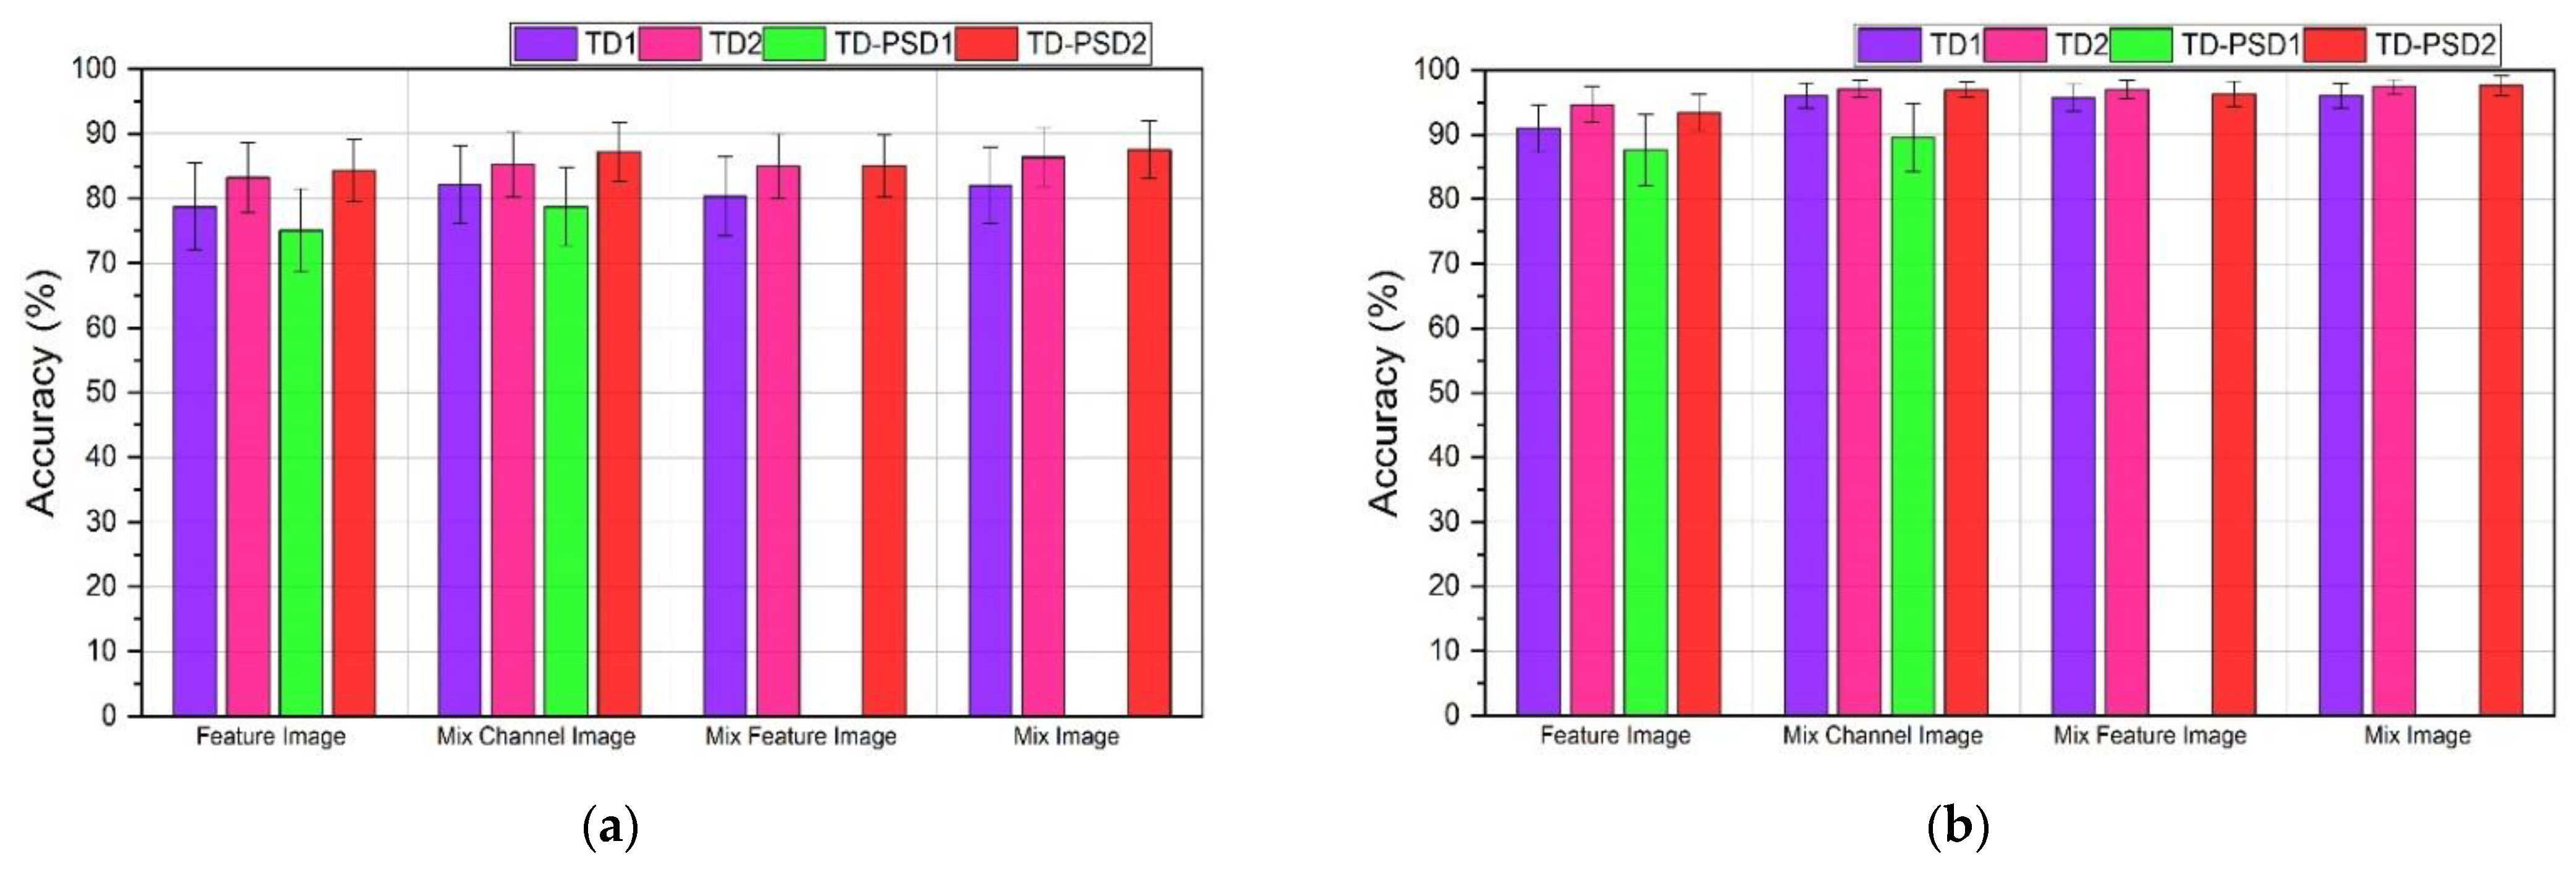
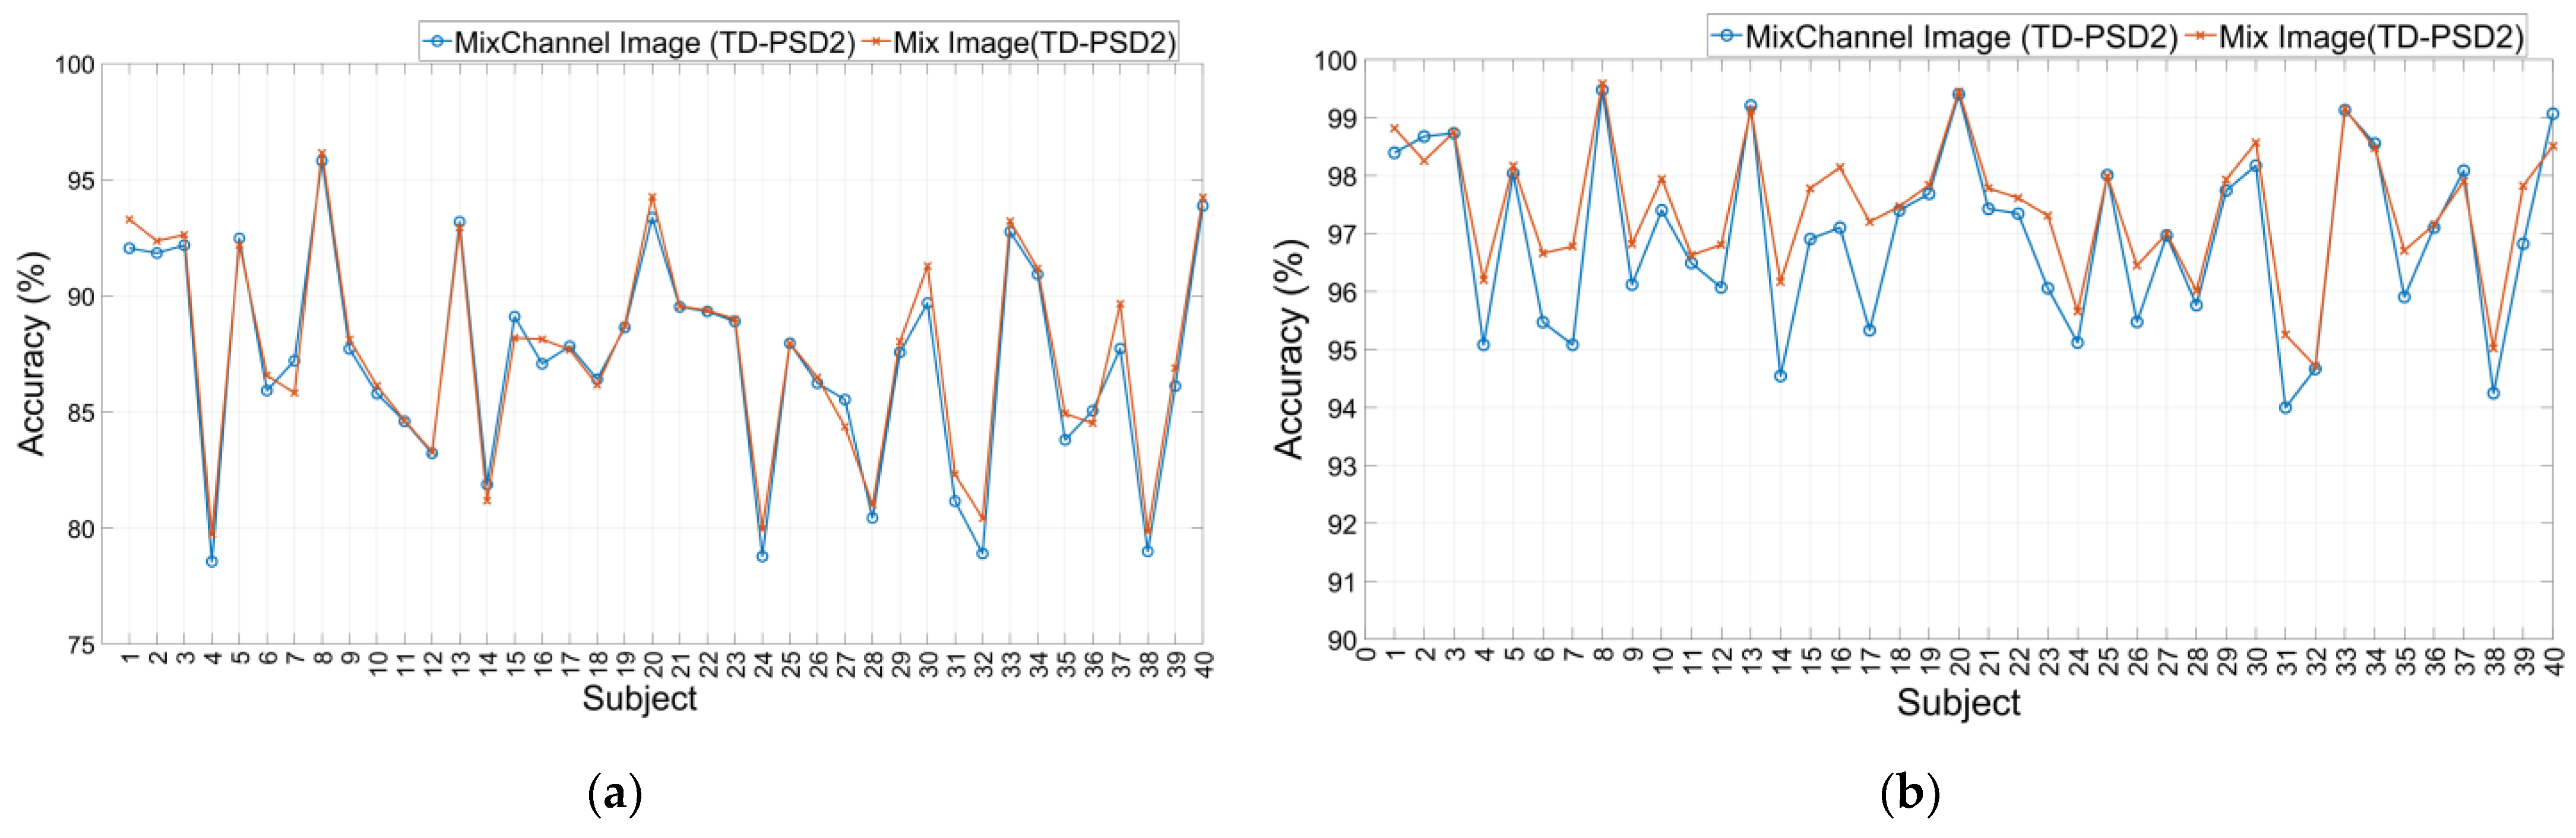
3.1. DB2 Database
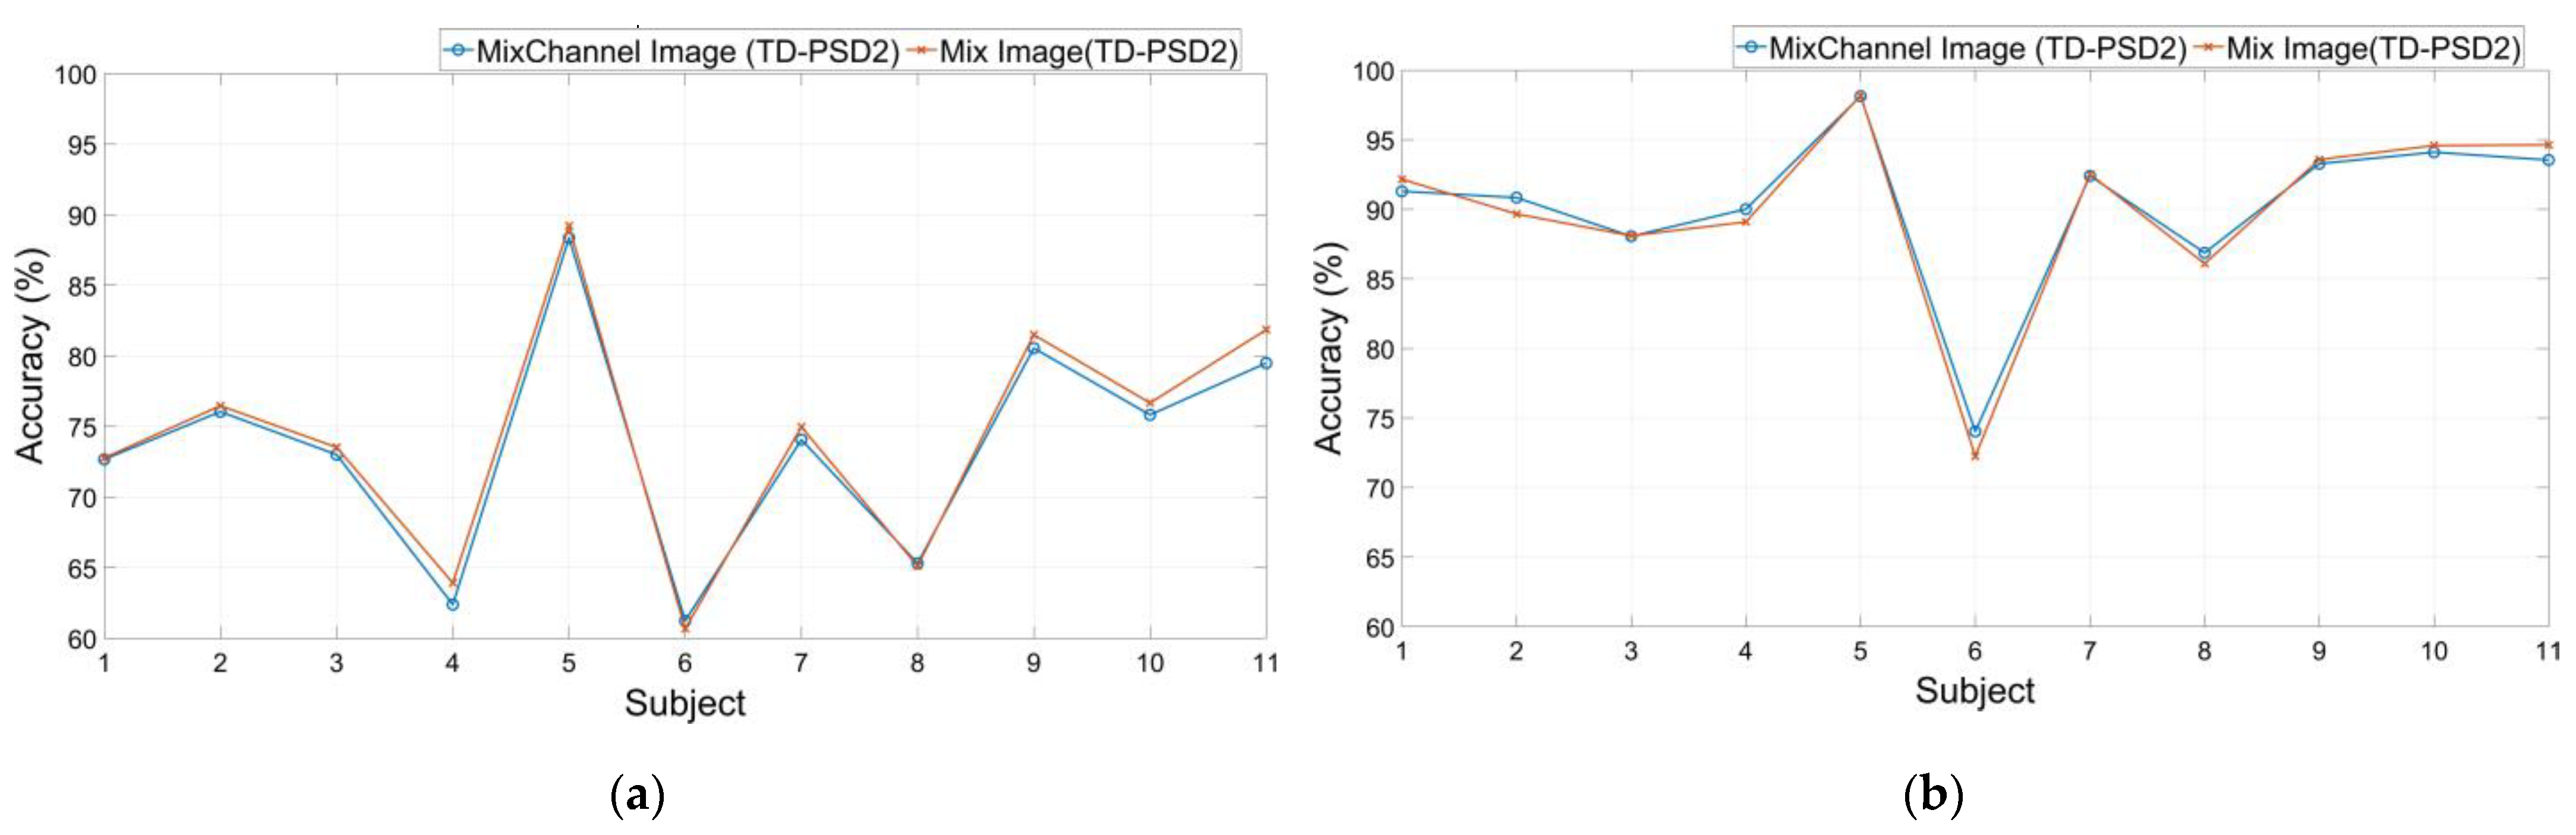
3.2. DB3 Database
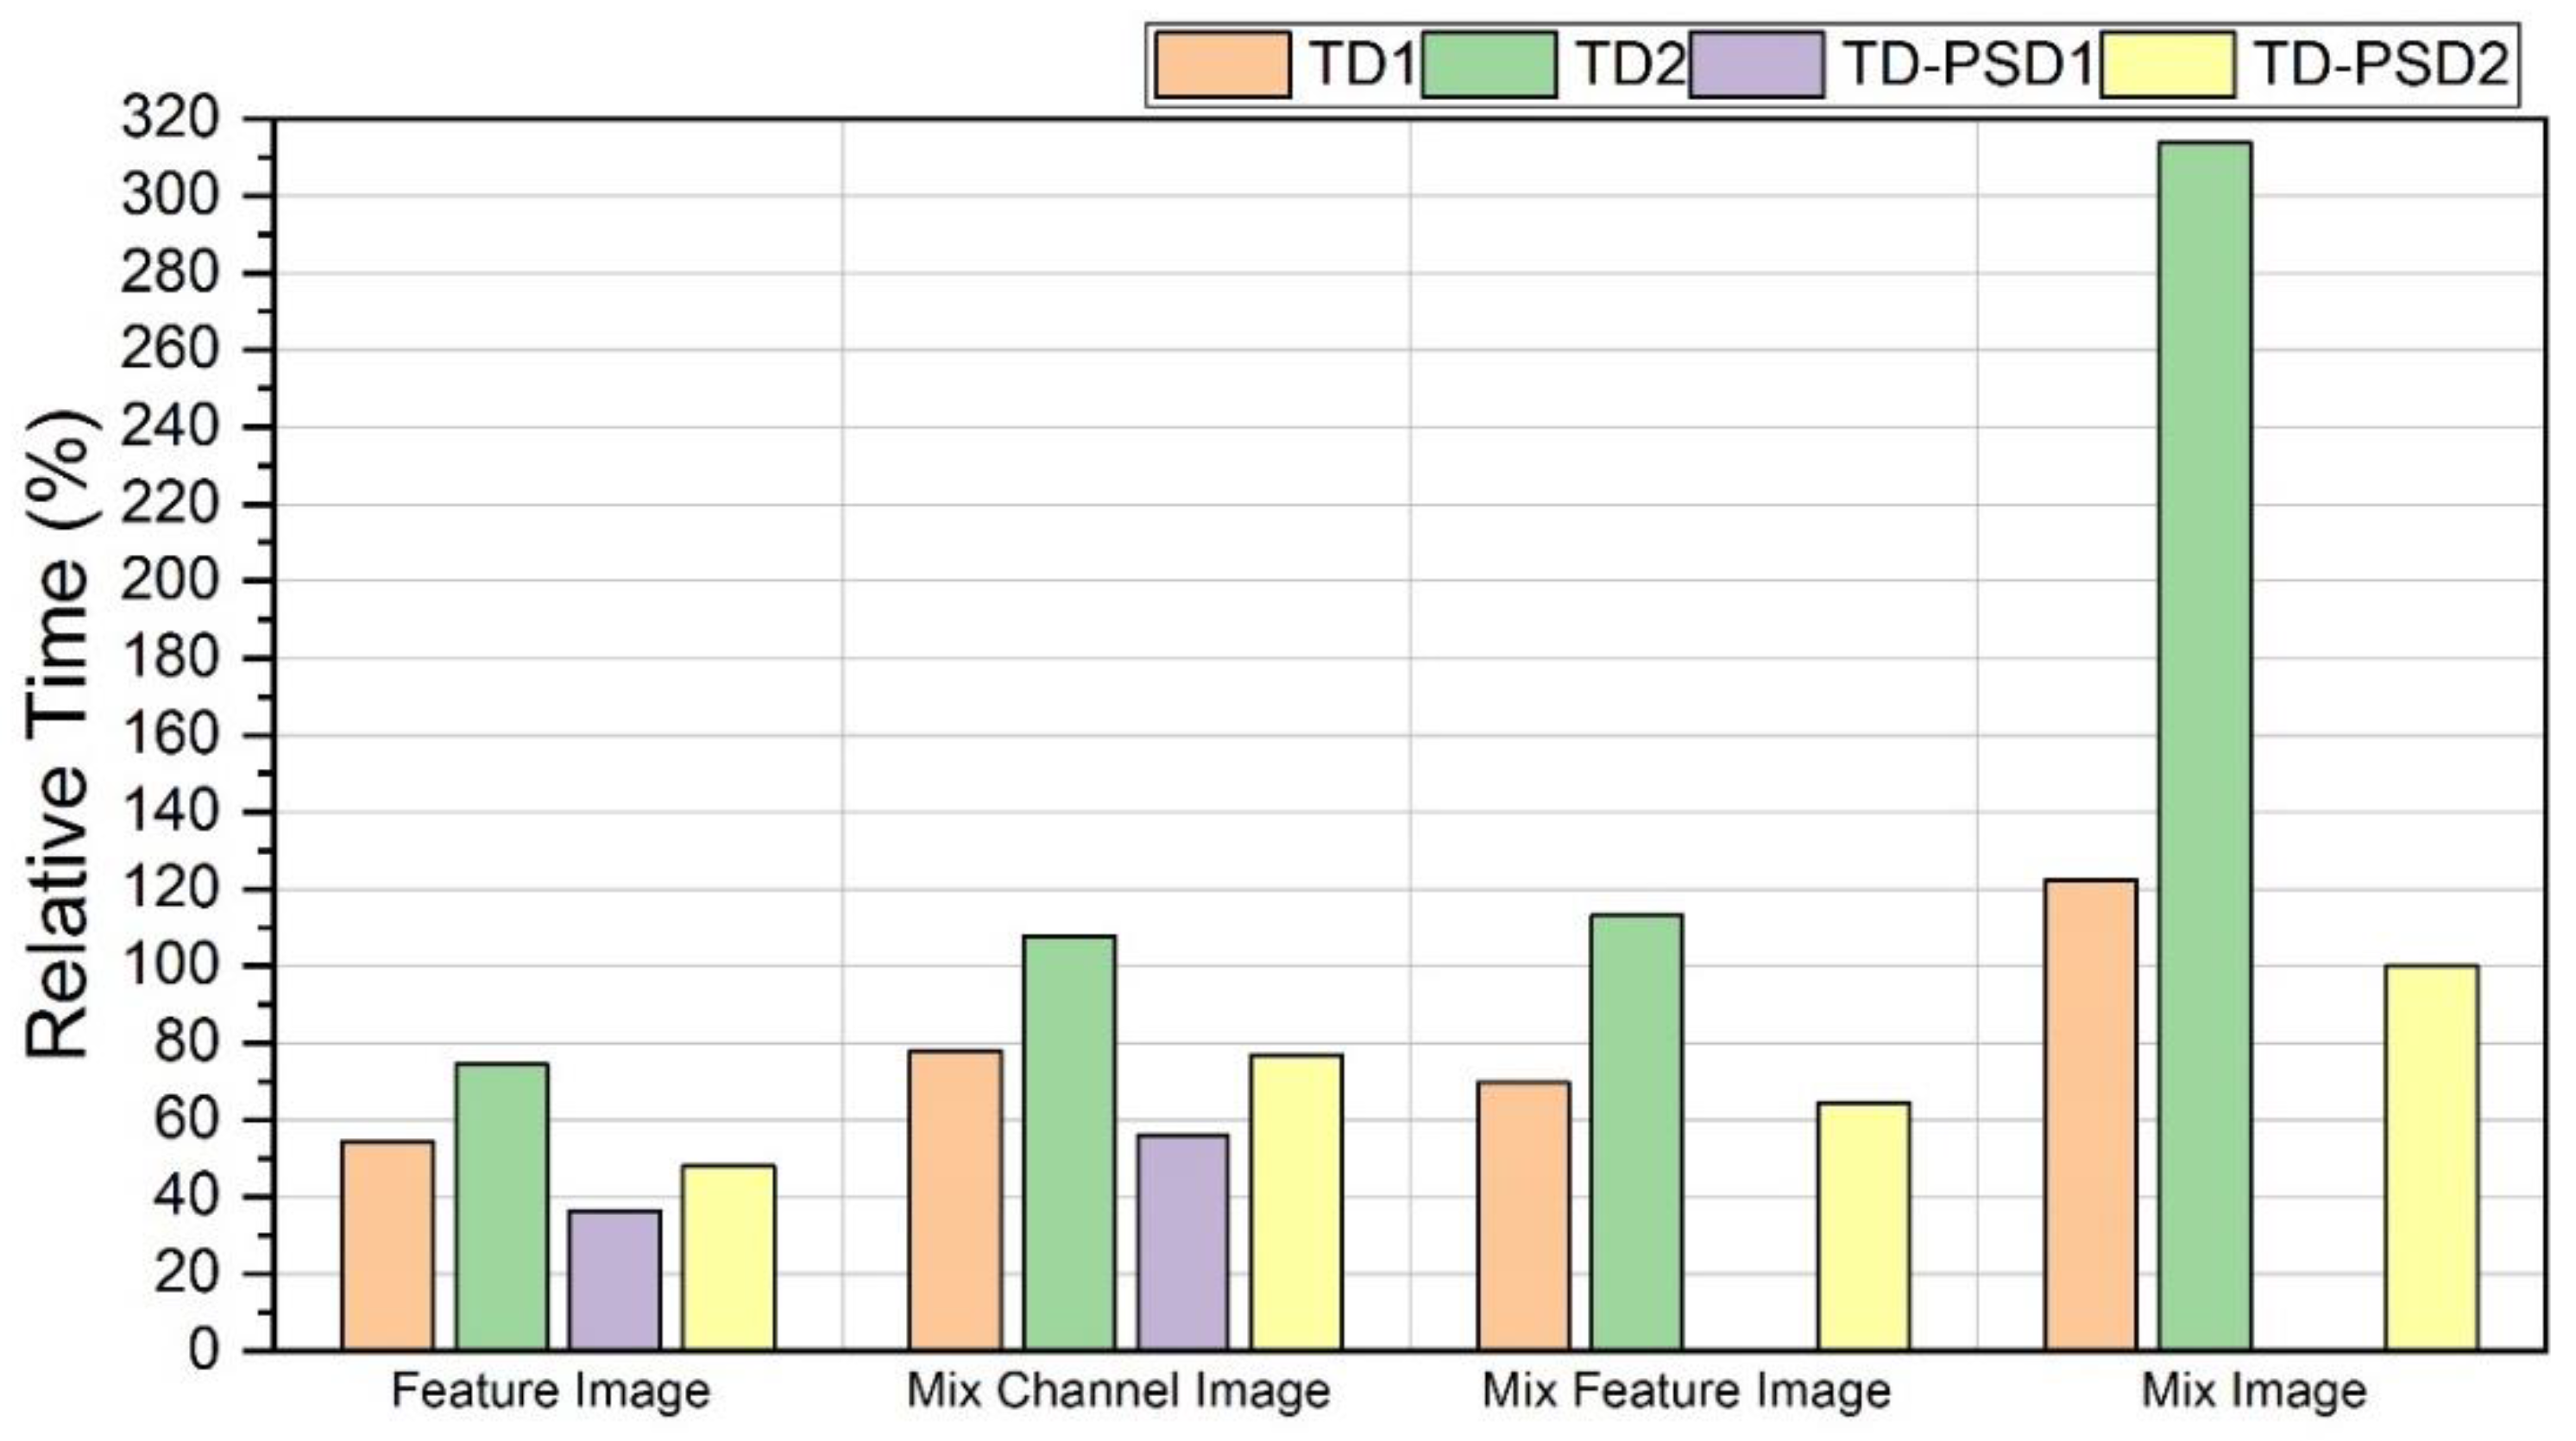
3.3. Processing Time Comparison
3.4. Comparison of Results with Previous Works
4. Discussion
5. Conclusions
- The results shown by the features obtained from the power spectrum in the time domain were the ones that showed the best performances. Additionally, when reorganizing channels and features, the performance of the model is increased.
- As mentioned above, the performance increases (by less than 1%) when using images with rearranged channels and features. However, the processing time for this type of image increases by approximately 20% compared to using images where only channels are rearranged.
Author Contributions
Funding
Institutional Review Board Statement
Informed Consent Statement
Data Availability Statement
Conflicts of Interest
References
- Jamal, M.Z. Signal Acquisition Using Surface EMG and Circuit Design Considerations for Robotic Prosthesis. In Computational Intelligence in Electromyography Analysis—A Perspective on Current Applications and Future Challenges; Naik, G.R., Ed.; InTech: London, UK, 2012. [Google Scholar] [CrossRef] [Green Version]
- Farina, D.; Fosci, M.; Merletti, R. Motor Unit Recruitment Strategies Investigated by Surface EMG Variables. J. Appl. Physiol. 2002, 92, 235–247. [Google Scholar] [CrossRef] [PubMed]
- Gao, Z.; Tang, R.; Huang, Q.; He, J. A Multi-DoF Prosthetic Hand Finger Joint Controller for Wearable SEMG Sensors by Nonlinear Autoregressive Exogenous Model. Sensors 2021, 21, 2576. [Google Scholar] [CrossRef]
- Rim, B.; Sung, N.-J.; Min, S.; Hong, M. Deep Learning in Physiological Signal Data: A Survey. Sensors 2020, 20, 969. [Google Scholar] [CrossRef] [PubMed] [Green Version]
- Lecun, Y. Gradient-Based Learning Applied to Document Recognition. Proc. IEEE 1998, 86, 2278–2324. [Google Scholar] [CrossRef] [Green Version]
- Park, K.-H.; Lee, S.-W. Movement Intention Decoding Based on Deep Learning for Multiuser Myoelectric Interfaces. In Proceedings of the 2016 4th International Winter Conference on Brain-Computer Interface (BCI), Gangwon, Korea, 22–24 February 2016; pp. 1–2. [Google Scholar] [CrossRef]
- Geng, W.; Du, Y.; Jin, W.; Wei, W.; Hu, Y.; Li, J. Gesture Recognition by Instantaneous Surface EMG Images. Sci. Rep. 2016, 6, 36571. [Google Scholar] [CrossRef]
- Atzori, M.; Cognolato, M.; Müller, H. Deep Learning with Convolutional Neural Networks Applied to Electromyography Data: A Resource for the Classification of Movements for Prosthetic Hands. Neurorobotics 2016, 10, 1–10. [Google Scholar] [CrossRef] [Green Version]
- Du, Y.; Jin, W.; Wei, W.; Hu, Y.; Geng, W. Surface EMG-Based Inter-Session Gesture Recognition Enhanced by Deep Domain Adaptation. Sensors 2017, 17, 458. [Google Scholar] [CrossRef] [Green Version]
- Hu, Y.; Wong, Y.; Wei, W.; Du, Y.; Kankanhalli, M.; Geng, W. A Novel Attention-Based Hybrid CNN-RNN Architecture for SEMG-Based Gesture Recognition. PLoS ONE 2018, 13, e0206049. [Google Scholar] [CrossRef] [Green Version]
- Atzori, M.; Gijsberts, A.; Kuzborskij, I.; Elsig, S.; Mittaz Hager, A.-G.; Deriaz, O.; Castellini, C.; Muller, H.; Caputo, B. Characterization of a Benchmark Database for Myoelectric Movement Classification. IEEE Trans. Neural Syst. Rehabil. Eng. 2015, 23, 73–83. [Google Scholar] [CrossRef]
- Amma, C.; Krings, T.; Böer, J.; Schultz, T. Advancing Muscle-Computer Interfaces with High-Density Electromyography. In Proceedings of the 33rd Annual ACM Conference on Human Factors in Computing Systems, Seoul, Korea, 18–23 April 2015; pp. 929–938. [Google Scholar] [CrossRef]
- Rechy-Ramirez, E.J.; Hu, H. Stages for Developing Control Systems Using EMG and EEG Signals: A Survey. Sch. Comput. Sci. Electron. Eng. Univ. Essex 2011, 1744–8050. [Google Scholar]
- Hargrove, L.J.; Englehart, K.; Hudgins, B. A Comparison of Surface and Intramuscular Myoelectric Signal Classification. IEEE Trans. Biomed. Eng. 2007, 54, 847–853. [Google Scholar] [CrossRef] [PubMed]
- Hargrove, L.; Englehart, K.; Hudgins, B. A Training Strategy to Reduce Classification Degradation Due to Electrode Displacements in Pattern Recognition Based Myoelectric Control. Biomed. Signal Process. Control 2008, 3, 175–180. [Google Scholar] [CrossRef]
- Phinyomark, A.; Limsakul, C.; Phukpattaranont, P. A Novel Feature Extraction for Robust EMG Pattern Recognition. J. Comput. 2009, 1, 71–80. [Google Scholar] [CrossRef]
- Phinyomark, A.; Phukpattaranont, P.; Limsakul, C. Feature Reduction and Selection for EMG Signal Classification. Expert Syst. Appl. 2012, 39, 7420–7431. [Google Scholar] [CrossRef]
- Al-Timemy, A.H.; Bugmann, G.; Escudero, J.; Outram, N. Classification of Finger Movements for the Dexterous Hand Prosthesis Control with Surface Electromyography. IEEE J. Biomed. Health Inform. 2013, 17, 608–618. [Google Scholar] [CrossRef]
- Al-Timemy, A.H.; Khushaba, R.N.; Escudero, J. Selecting the Optimal Movement Subset with Different Pattern Recognition Based EMG Control Algorithms. In Proceedings of the 38th Annual International Conference of the IEEE Engineering in Medicine and Biology Society (EMBC), Orlando, FL, USA, 16–20 August 2016; pp. 315–318. [Google Scholar] [CrossRef] [Green Version]
- Hudgins, B.; Parker, P.; Scott, R.N. A New Strategy for Multifunction Myoelectric Control. IEEE Trans. Biomed. Eng. 1993, 40, 82–94. [Google Scholar] [CrossRef]
- Tenore, F.V.G.; Ramos, A.; Fahmy, A.; Acharya, S.; Etienne-Cummings, R.; Thakor, N.V. Decoding of Individuated Finger Movements Using Surface Electromyography. IEEE Trans. Biomed. Eng. 2009, 56, 1427–1434. [Google Scholar] [CrossRef]
- Oweis, R.J.; Rihani, R.; Alkhawaja, A. ANN-Based EMG Classification for Myoelectric Control. Int. J. Med. Eng. Inform. 2014, 6, 365–380. [Google Scholar] [CrossRef]
- Adewuyi, A.A.; Hargrove, L.J.; Kuiken, T.A. Evaluating EMG Feature and Classifier Selection for Application to Partial-Hand Prosthesis Control. Front. Neurorobot. 2016, 10, 15. [Google Scholar] [CrossRef] [Green Version]
- Al-Timemy, A.H.; Bugmann, G.; Escudero, J. Adaptive Windowing Framework for Surface Electromyogram-Based Pattern Recognition System for Transradial Amputees. Sensors 2018, 18, 2402. [Google Scholar] [CrossRef] [Green Version]
- Jiang, W.; Yin, Z. Human Activity Recognition Using Wearable Sensors by Deep Convolutional Neural Networks. In Proceedings of the 23rd ACM International Conference on Multimedia, Brisbane, Australia, 26–30 October 2015; pp. 1307–1310. [Google Scholar] [CrossRef]
- Wei, W.; Dai, Q.; Wong, Y.; Hu, Y.; Kankanhalli, M.; Geng, W. Surface-Electromyography-Based Gesture Recognition by Multi-View Deep Learning. IEEE Trans. Biomed. Eng. 2019, 66, 2964–2973. [Google Scholar] [CrossRef] [PubMed]
- Pancholi, S.; Joshi, A.M.; Joshi, D. A Robust and Accurate Deep Learning Based Pattern Recognition Framework for Upper Limb Prosthesis Using SEMG. arXiv preprint 2021, arXiv:2106.02463. [Google Scholar] [CrossRef]
- Khushaba, R.N.; Shi, L.; Kodagoda, S. Time-Dependent Spectral Features for Limb Position Invariant Myoelectric Pattern Recognition. In Proceedings of the 2012 International Symposium on Communications and Information Technologies (ISCIT), Gold Coast, Australia, 2–5 October 2012; pp. 1015–1020. [Google Scholar] [CrossRef]
- Atzori, M.; Gijsberts, A.; Castellini, C.; Caputo, B.; Hager, A.-G.M.; Elsig, S.; Giatsidis, G.; Bassetto, F.; Müller, H. Electromyography Data for Non-Invasive Naturally-Controlled Robotic Hand Prostheses. Sci. Data 2014, 1, 140053. [Google Scholar] [CrossRef] [PubMed] [Green Version]
- Kuzborskij, I.; Gijsberts, A.; Caputo, B. On the Challenge of Classifying 52 Hand Movements from Surface Electromyography. In Proceedings of the 2012 Annual International Conference of the IEEE Engineering in Medicine and Biology Society, San Diego, CA, USA, 28 August–1 September 2012; pp. 4931–4937. [Google Scholar] [CrossRef] [Green Version]
- Konrad, P. A Practical Introduction to Kinesiological Electromyography; Noraxon: Scottsdale, AZ, USA, 2005. [Google Scholar]
- Englehart, K.; Hudgins, B. A Robust, Real-Time Control Scheme for Multifunction Myoelectric Control. IEEE Trans. Biomed. Eng. 2003, 50, 848–854. [Google Scholar] [CrossRef]
- Du, Y.-C.; Lin, C.-H.; Shyu, L.-Y.; Chen, T. Portable Hand Motion Classifier for Multi-Channel Surface Electromyography Recognition Using Grey Relational Analysis. Expert Syst. Appl. 2010, 37, 4283–4291. [Google Scholar] [CrossRef]
- Huang, H.; Xie, H.-B.; Guo, J.-Y.; Chen, H.-J. Ant Colony Optimization-Based Feature Selection Method for Surface Electromyography Signals Classification. Comput. Biol. Med. 2012, 42, 30–38. [Google Scholar] [CrossRef]
- Ioffe, S.; Szegedy, C. Batch Normalization: Accelerating Deep Network Training by Reducing Internal Covariate Shift. In Proceedings of the 32nd International Conference on International Conference on Machine Learning, Lille, France, 6–11 July 2015; Volume 37, pp. 448–456. [Google Scholar] [CrossRef]
- Goodfellow, I.; Bengio, Y.; Courville, A. Deep Learning; The MIT Press: Cambridge, MA, USA, 2016. [Google Scholar]
- Zhai, X.; Jelfs, B.; Chan, R.H.M.; Tin, C. Self-Recalibrating Surface EMG Pattern Recognition for Neuroprosthesis Control Based on Convolutional Neural Network. Front. Neurosci. 2017, 11, 379. [Google Scholar] [CrossRef] [Green Version]
- Milosevic, B.; Benatti, S.; Farella, E. Design Challenges for Wearable EMG Applications. In Proceedings of the Design, Automation & Test in Europe Conference & Exhibition (DATE), Lausanne, Switzerland, 27–31 March 2017; pp. 1432–1437. [Google Scholar] [CrossRef]


| DB2 | DB3 | |
|---|---|---|
| Intact subjects | 40 | 0 |
| Amputated subjects | 0 | 11 |
| sEMG Electrodes | 12 Delsys | 12 Delsys |
| Number of gestures to be classified | 50 | 50 |
| Number of trials | 6 | 6 |
| Sampling rate | 2 kHz | 2 kHz |
| Feature | Description | Equation | |
|---|---|---|---|
| Indicator of total power in the frequency domain | (7) | ||
| Noise stabilizer | (8) | ||
| Noise stabilizer | (9) | ||
| Indicator of how much energy of a vector is accumulated in few elements | (10) | ||
| Irregularity factor within a defined wavelength | (11) | ||
| Database | Segmentation | Feature Set | Image Type | Classification Accuracy |
|---|---|---|---|---|
| DB2 | 200 ms | TD-PSD2 | Mix Image | 87.56 ± 4.46 |
| 150 ms | TD-PSD2 | Mix Image | 97.61 ± 1.55 | |
| DB3 | 200 ms | TD-PSD2 | Mix Image | 74.24 ± 9.45 |
| 150 ms | TD-PSD2 | Mix Image | 90.23 ± 6.82 |
| Image Type | TD1 | TD2 | TDPSD1 | TD-PSD2 |
|---|---|---|---|---|
| Feature Image | 9.0 | 15.1 | 3.0 | 7.5 |
| MixChannel Image | 54.5 | 90.9 | 18.1 | 45.5 |
| MixFeature Image | 27.2 | 75.7 | - | 16.6 |
| Mix Image | 163.6 | 454.5 | - | 100 |
| Author | Database | Classes | Windows Size | Type of Features | Classifier | Accuracy in % |
|---|---|---|---|---|---|---|
| Atzori et al. [8] 2016 | Nina Pro DB2 | 49 | 150 ms | TD | Random Forest SVM | 75.27 |
| Nina Pro DB3 | 46.27 | |||||
| Zhai et al. [37] 2017 | Nina Pro DB2 | 50 | 200 ms | Spectrogram TD | CNN | 78.71 |
| Nina Pro DB3 * | 73.31 | |||||
| Hu et al. [10] 2018 | Nina Pro DB2 | 50 | 200 ms | TD | CNN-RNN | 82.20 |
| Wei et al. [26] 2019 | Nina Pro DB2 | 50 | 150 ms | MV-CNN | 82.70 | |
| 200 ms | TD ** | 83.70 | ||||
| Nina Pro DB3 | 200 ms | 64.30 | ||||
| Pancholi et al. [27] 2021 | Nina Pro DB2 | 49 | 150 ms | TD PSD | DLPR | 89.45 |
| Nina Pro DB3 | 81.67 | |||||
| This work | Nina Pro DB2 | 50 | 150 ms | TD PSD | CNN | 97.61 |
| Nina Pro DB3 | 200 ms | 87.56 | ||||
| 150 ms | 90.23 | |||||
| 200 ms | 74.24 |
Publisher’s Note: MDPI stays neutral with regard to jurisdictional claims in published maps and institutional affiliations. |
© 2022 by the authors. Licensee MDPI, Basel, Switzerland. This article is an open access article distributed under the terms and conditions of the Creative Commons Attribution (CC BY) license (https://creativecommons.org/licenses/by/4.0/).
Share and Cite
Sandoval-Espino, J.A.; Zamudio-Lara, A.; Marbán-Salgado, J.A.; Escobedo-Alatorre, J.J.; Palillero-Sandoval, O.; Velásquez-Aguilar, J.G. Selection of the Best Set of Features for sEMG-Based Hand Gesture Recognition Applying a CNN Architecture. Sensors 2022, 22, 4972. https://doi.org/10.3390/s22134972
Sandoval-Espino JA, Zamudio-Lara A, Marbán-Salgado JA, Escobedo-Alatorre JJ, Palillero-Sandoval O, Velásquez-Aguilar JG. Selection of the Best Set of Features for sEMG-Based Hand Gesture Recognition Applying a CNN Architecture. Sensors. 2022; 22(13):4972. https://doi.org/10.3390/s22134972
Chicago/Turabian StyleSandoval-Espino, Jorge Arturo, Alvaro Zamudio-Lara, José Antonio Marbán-Salgado, J. Jesús Escobedo-Alatorre, Omar Palillero-Sandoval, and J. Guadalupe Velásquez-Aguilar. 2022. "Selection of the Best Set of Features for sEMG-Based Hand Gesture Recognition Applying a CNN Architecture" Sensors 22, no. 13: 4972. https://doi.org/10.3390/s22134972