
A Systematic Review on Feature Extraction in Electroencephalography-Based Diagnostics and Therapy in Attention Deficit Hyperactivity Disorder

 , ,
, ,
Abstract
:1. Introduction
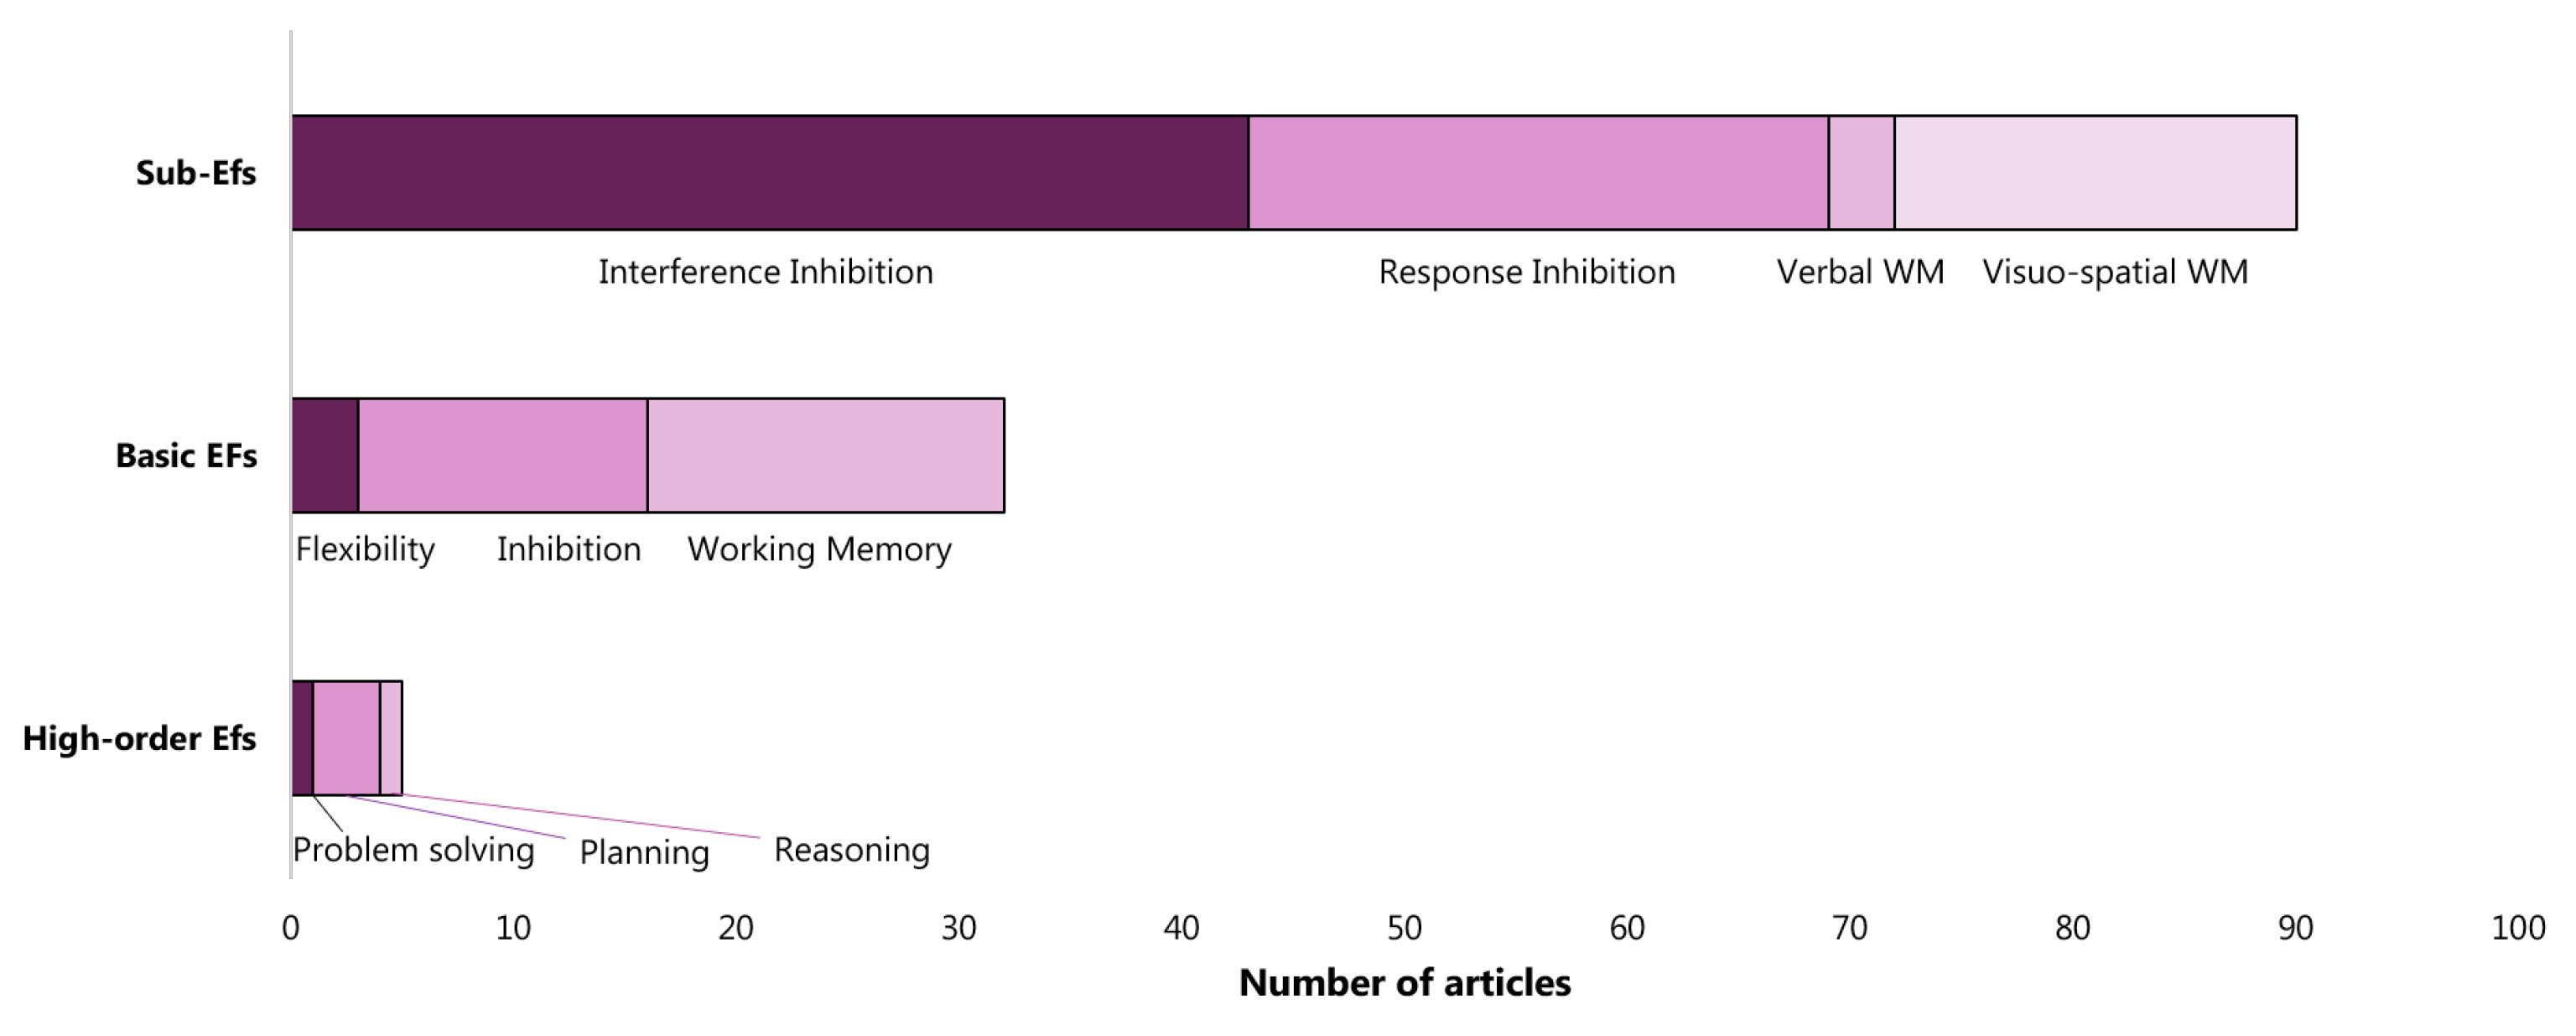
- Identifing EFs evaluated in EEG-based ADHD studies and their resolution level among high order-, basic-, sub-, and components of sub-EFs;
- Counting the articles that studied each specific relationship between an EEG feature and an EF;
- Reporting wether the relationships between EEG features and EFs are statistically relevant or not;
- Analyzing the methodological rigor of the articles and their impact within the reference scientific community.
2. Methods
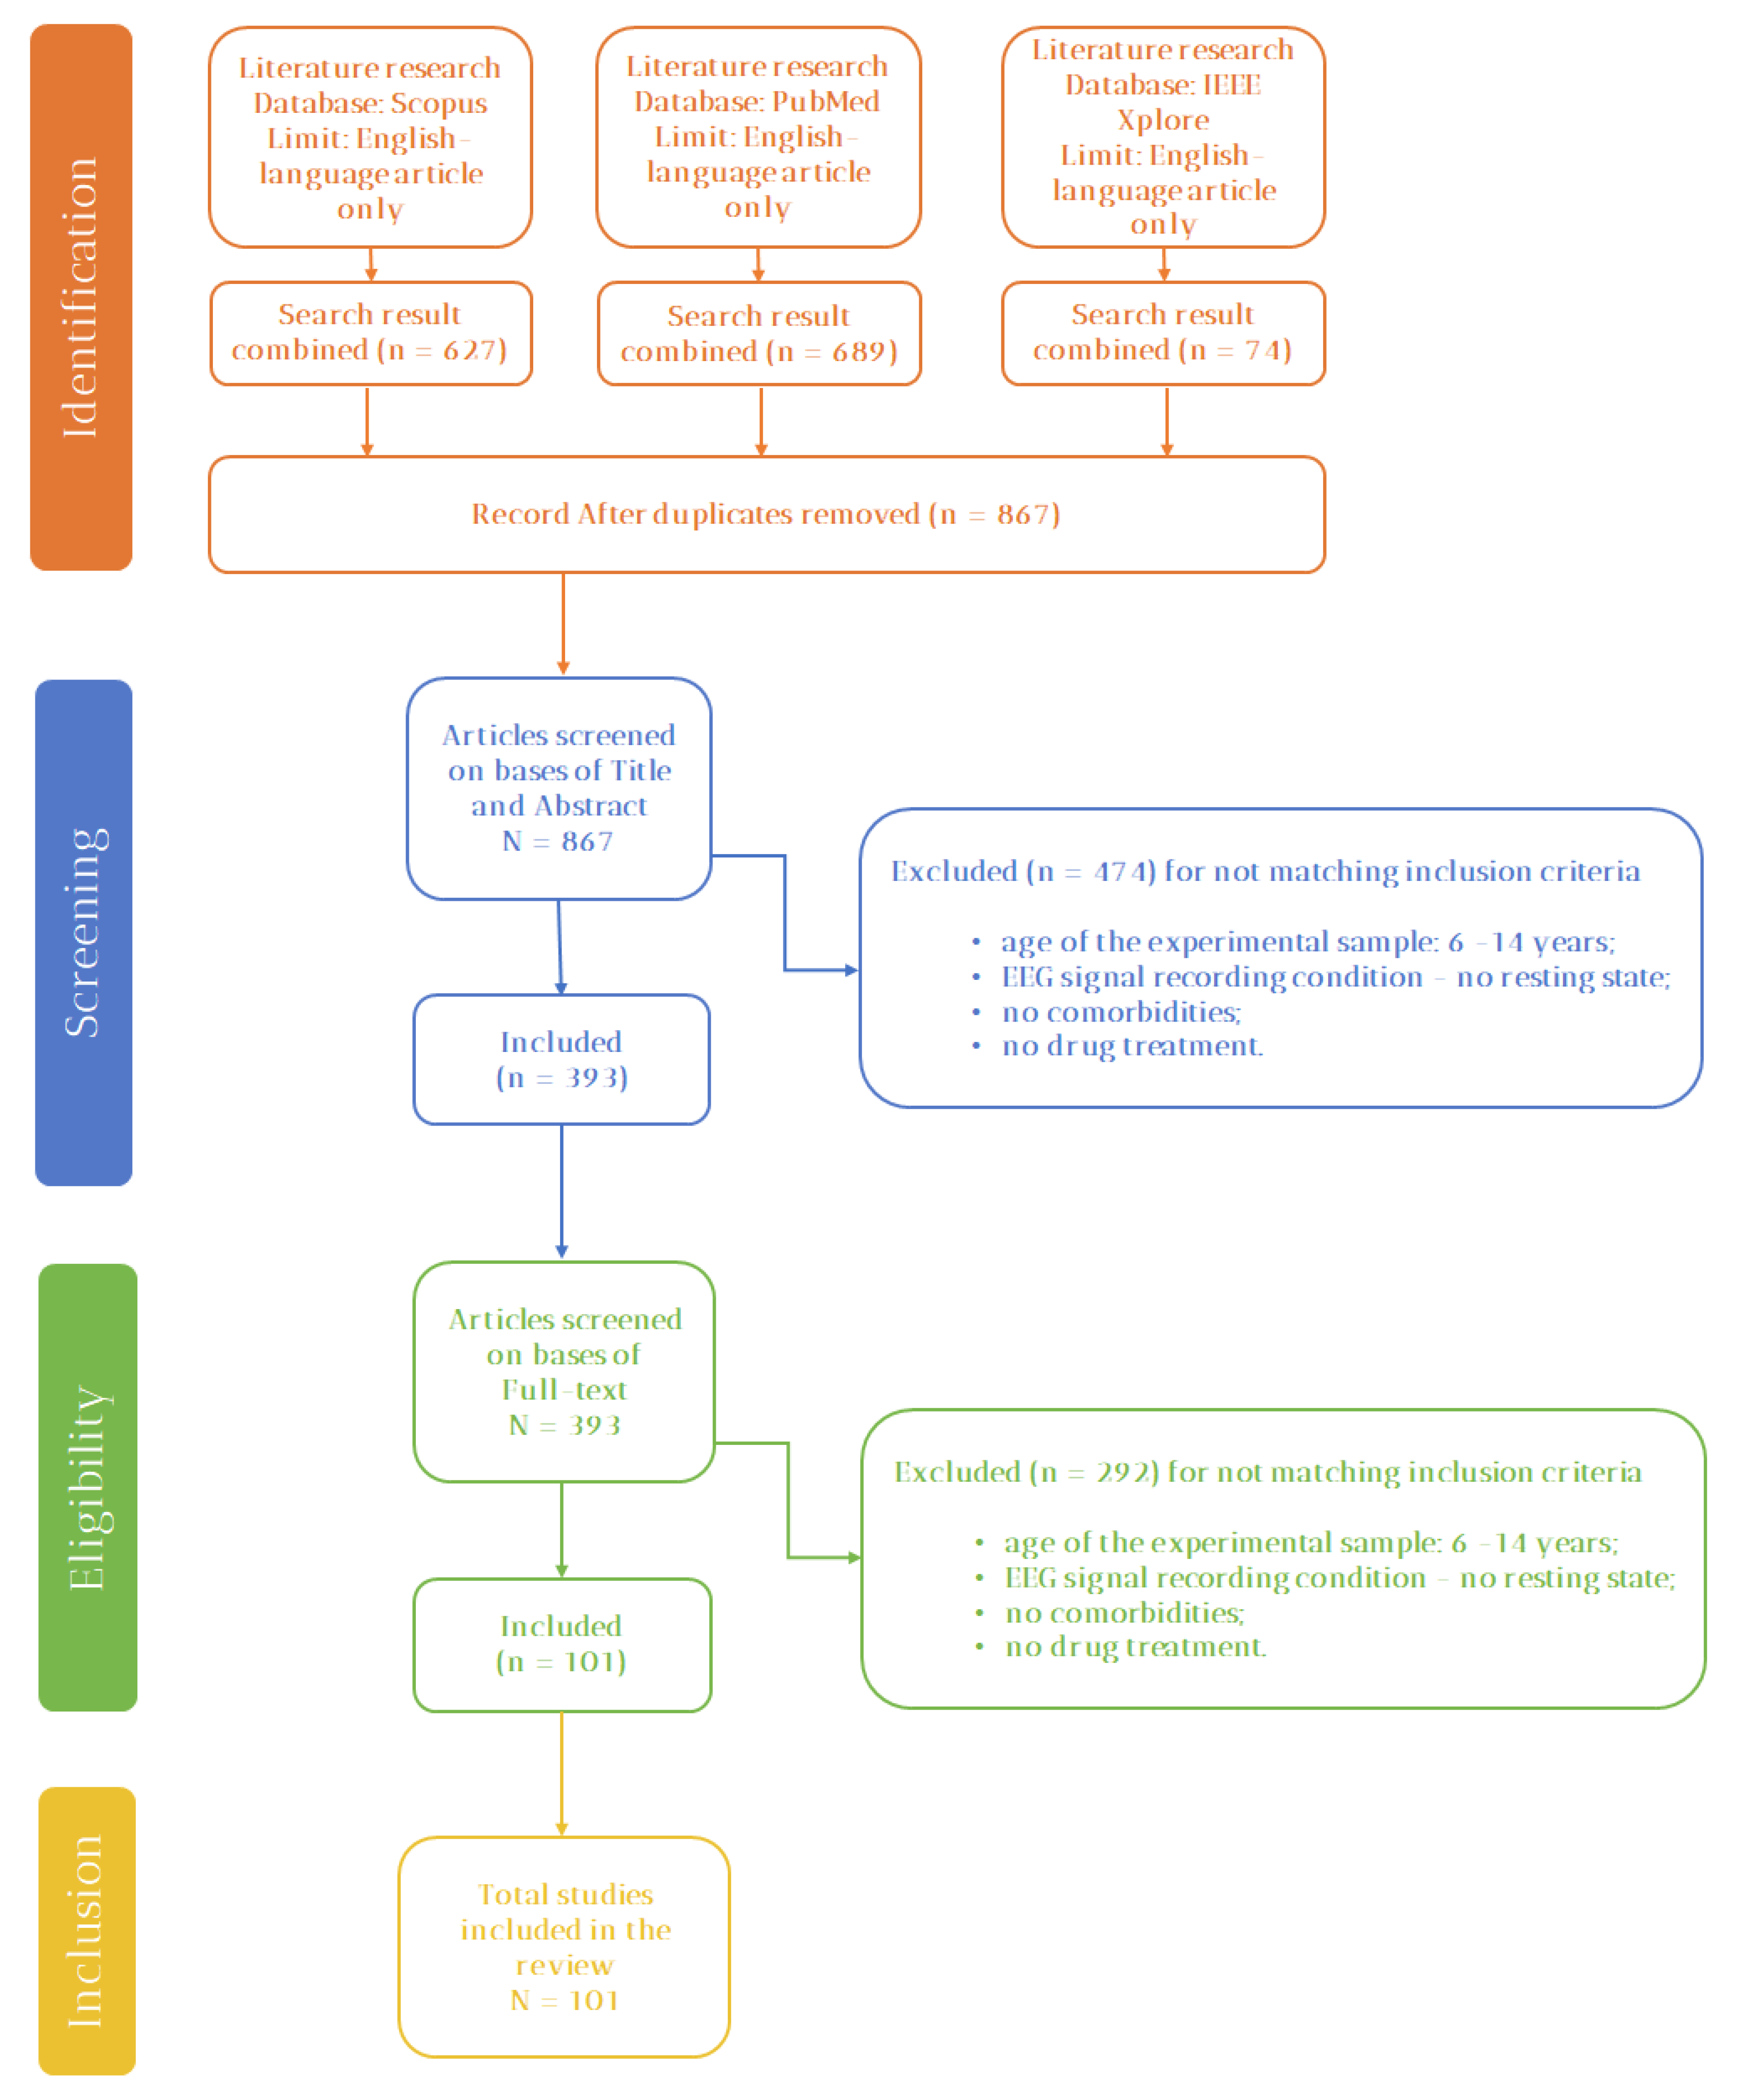
2.1. Article Selection Process
2.1.1. Inclusion and Exclusion Criteria
- The age of the experimental sample: only articles recruiting six fourteen-year-old participants were included; the choice of the age range of the experimental sample was due to (i) the maturation of basic EFs; (ii) the stimulation of higher order EFs in the school environment; (iii) the greater understanding and adherence to the various tasks; and (iv) the better exclusion of other pathologies diagnosable from the age of six.
- The participants’ conditions during EEG signal recording: studies focused on resting state were excluded. Indeed, EFs selective activation requires specific task execution;
- Comorbidities: articles with the concurrent presence of other pathologies in participants were excluded to avoid these sources of interference on the EEG signals;
- Drug therapy: articles with participants under pharmacological treatment were excluded. Nevertheless, articles were included in case of the interruption of drug assumption at least six months before the execution of the experimental sessions. Articles were excluded if information about pharmacological therapy was not specified.
- The type of article: journal and conference articles were included, while reviews, commentaries, and editorials were excluded because they do not report directly on field studies.
2.1.2. Database Searches
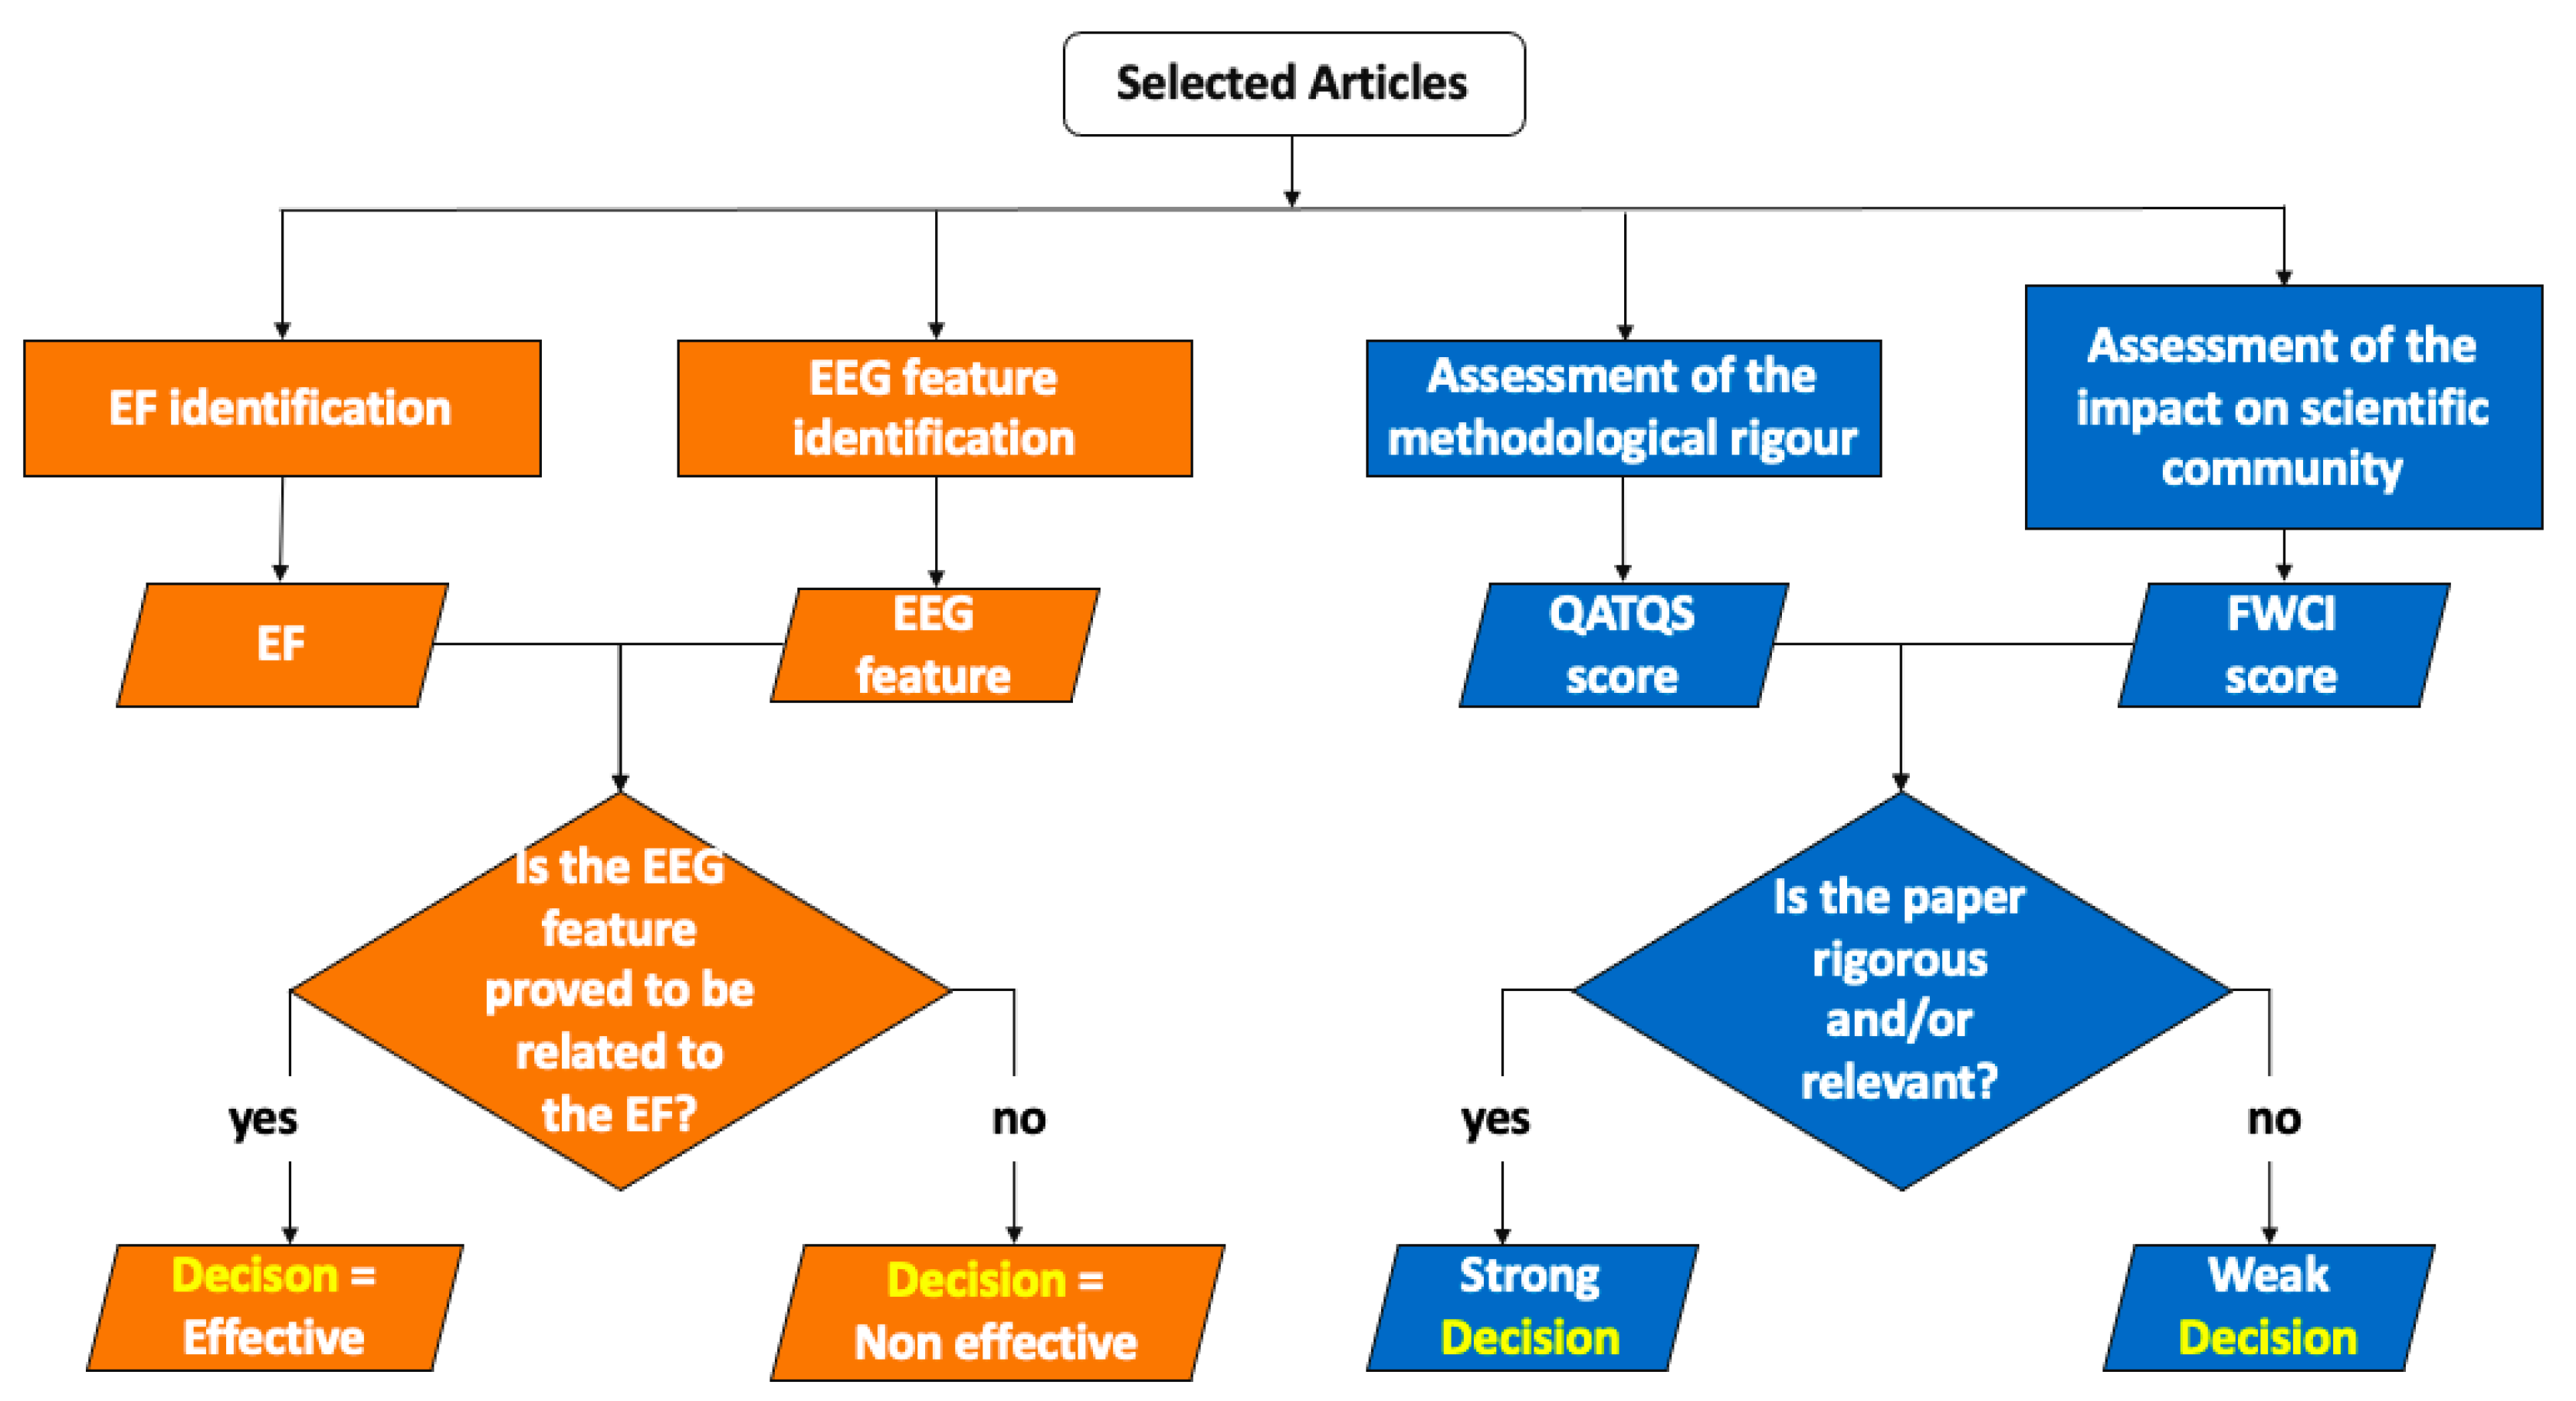
2.2. Article Analysis Procedure
2.2.1. Executive Function Identification
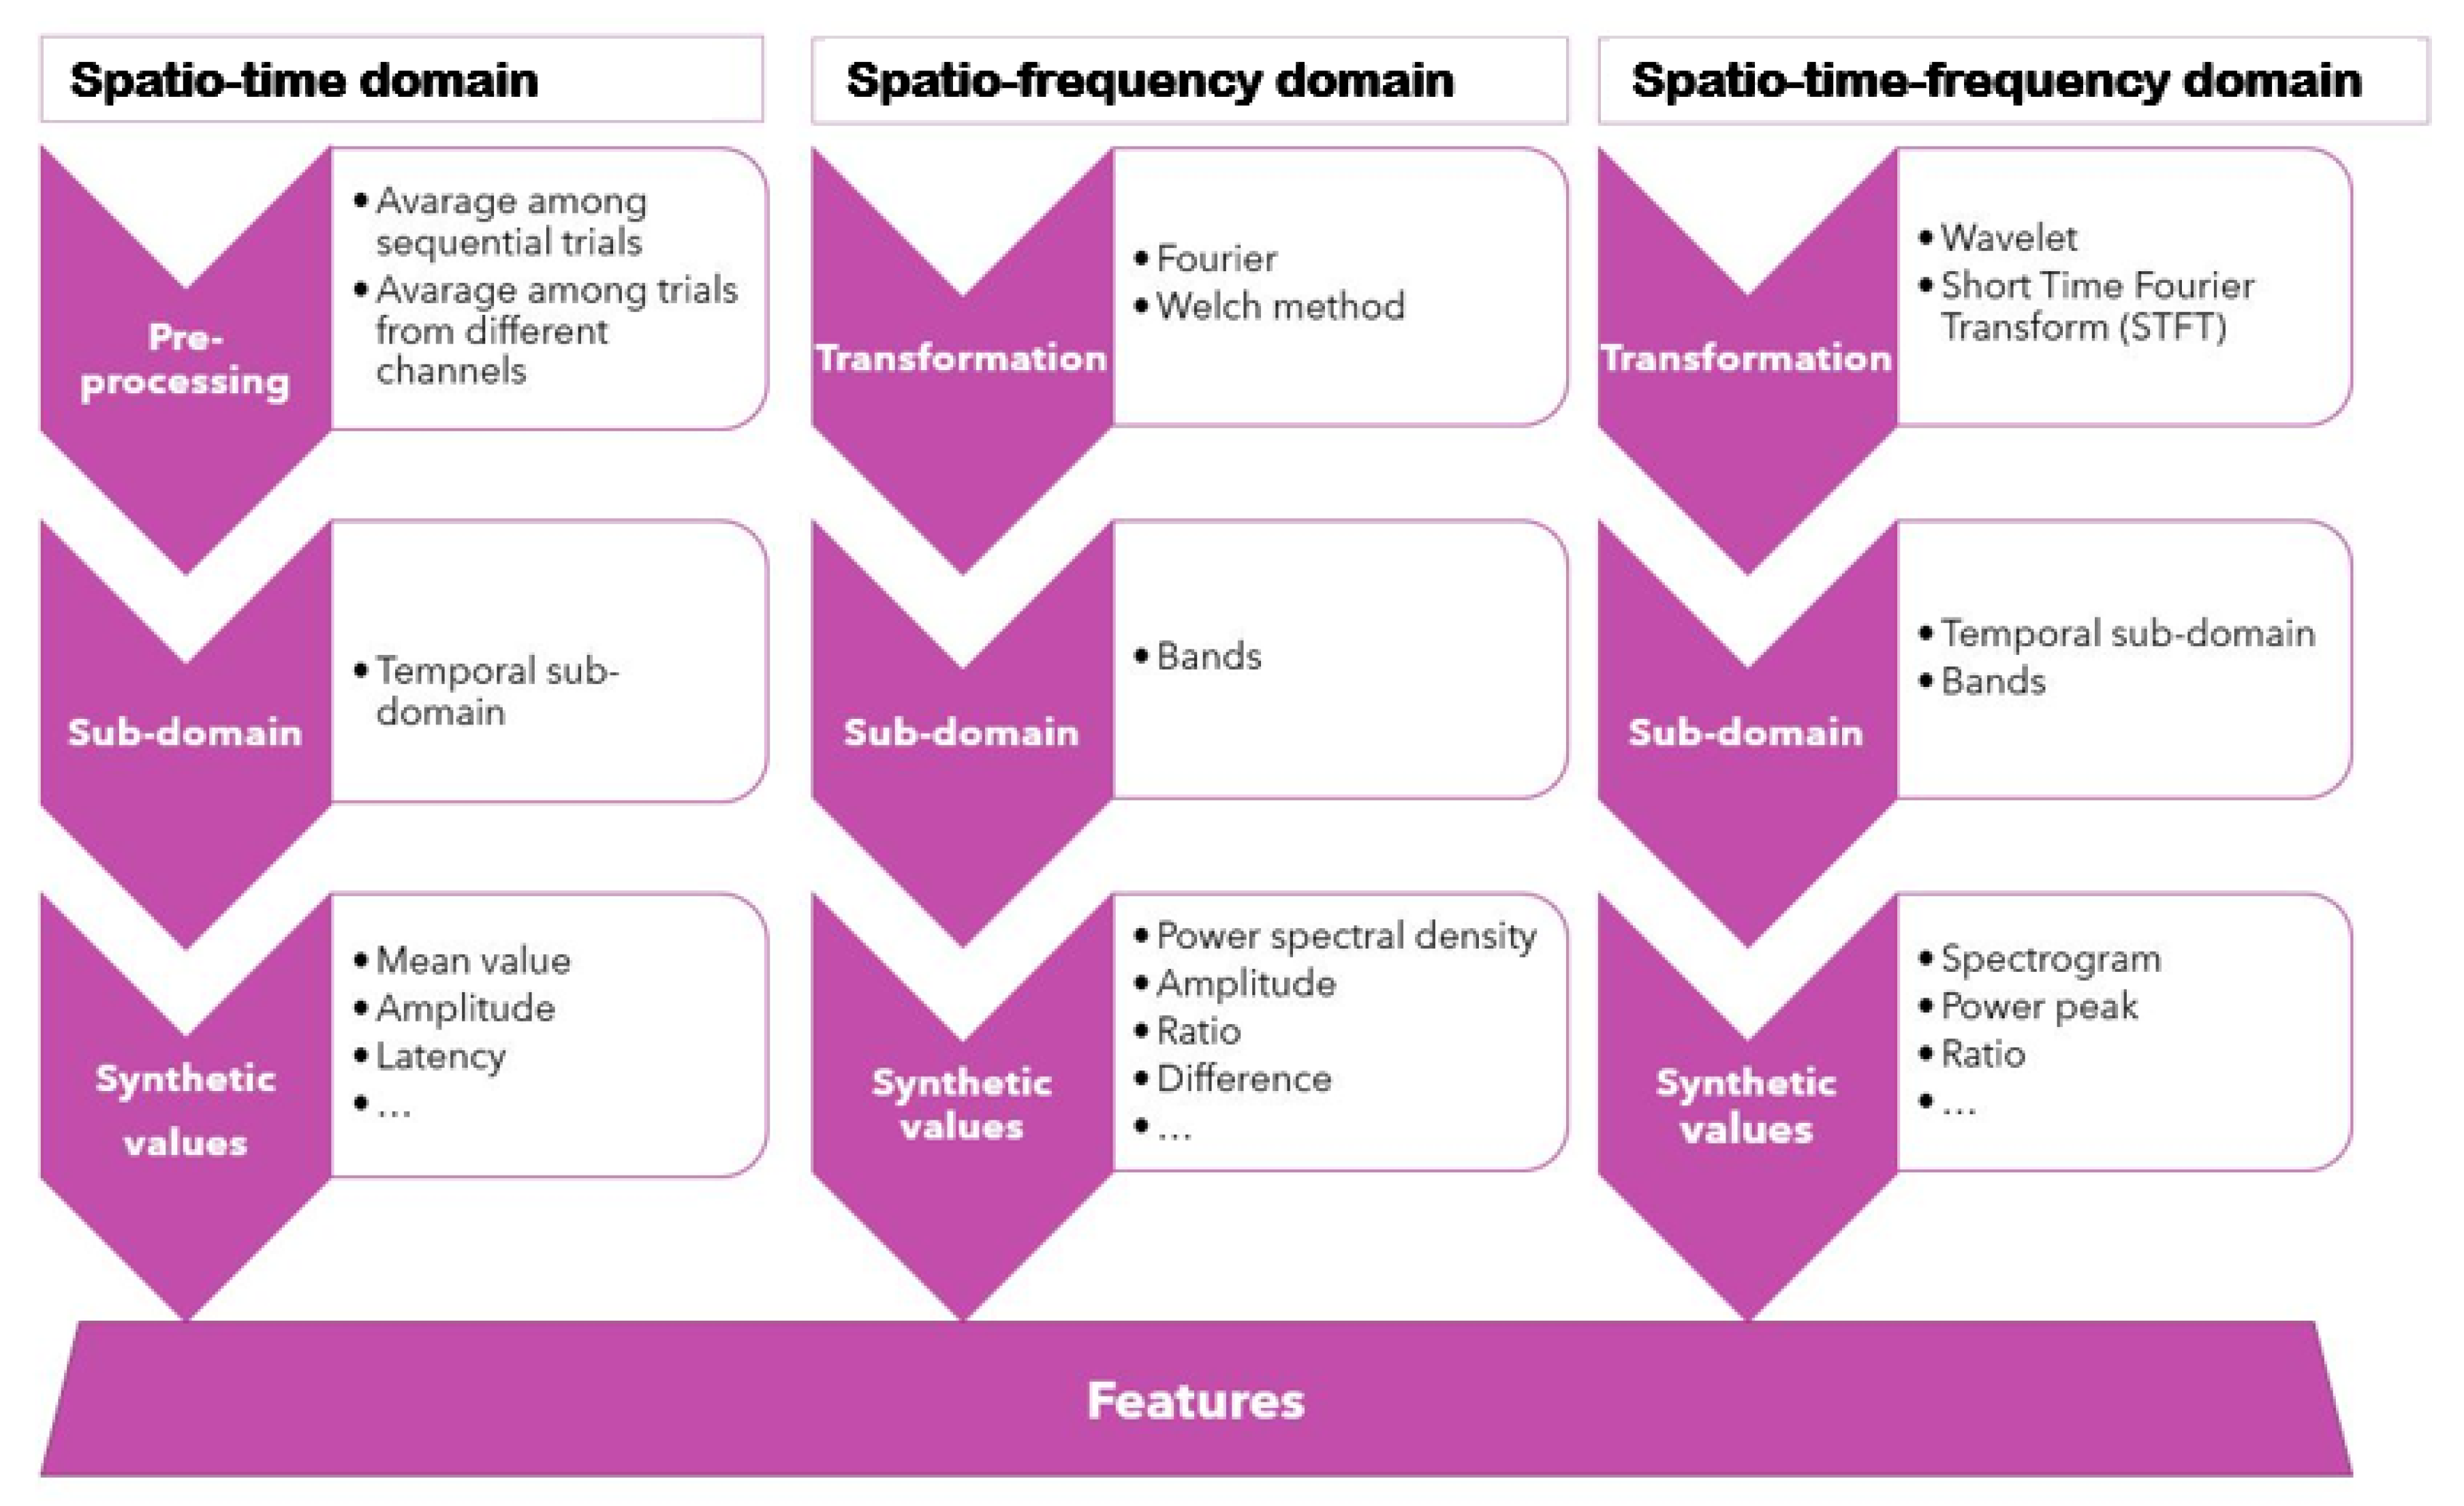
2.2.2. EEG Features Identification
2.2.3. Assessment of the Methodological Rigor and Scientific Impact of the Articles
3. Results
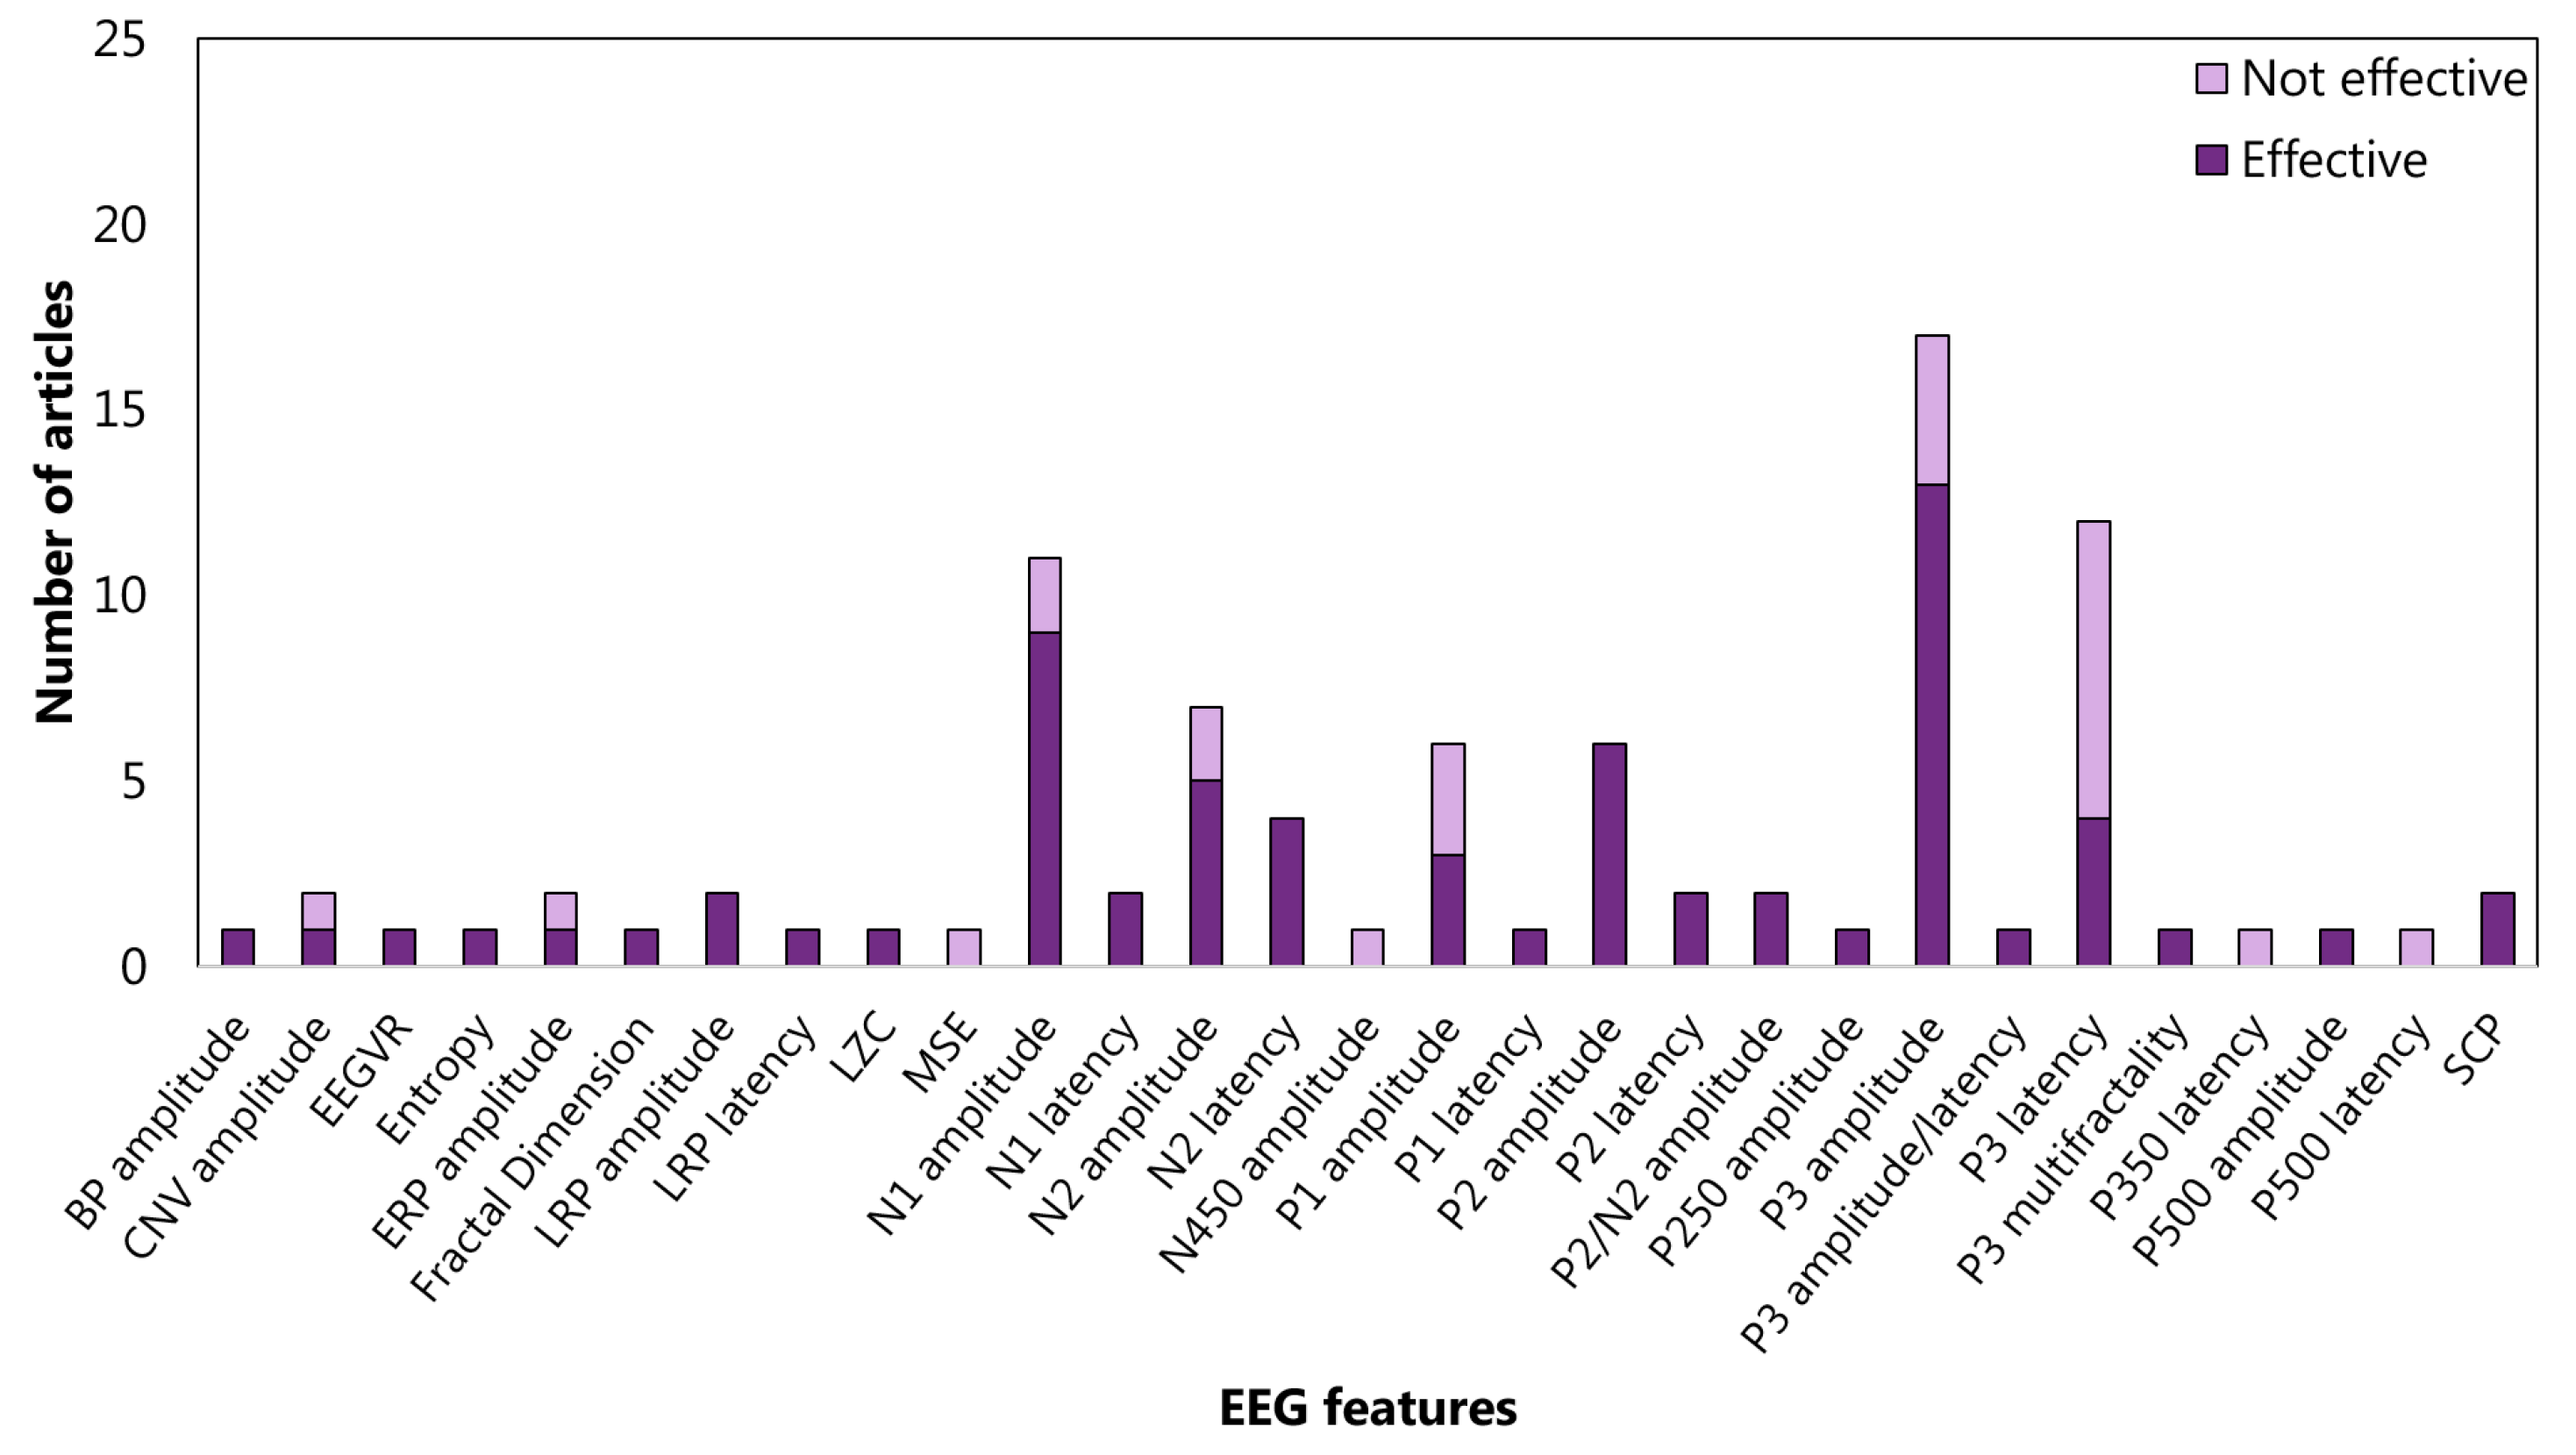
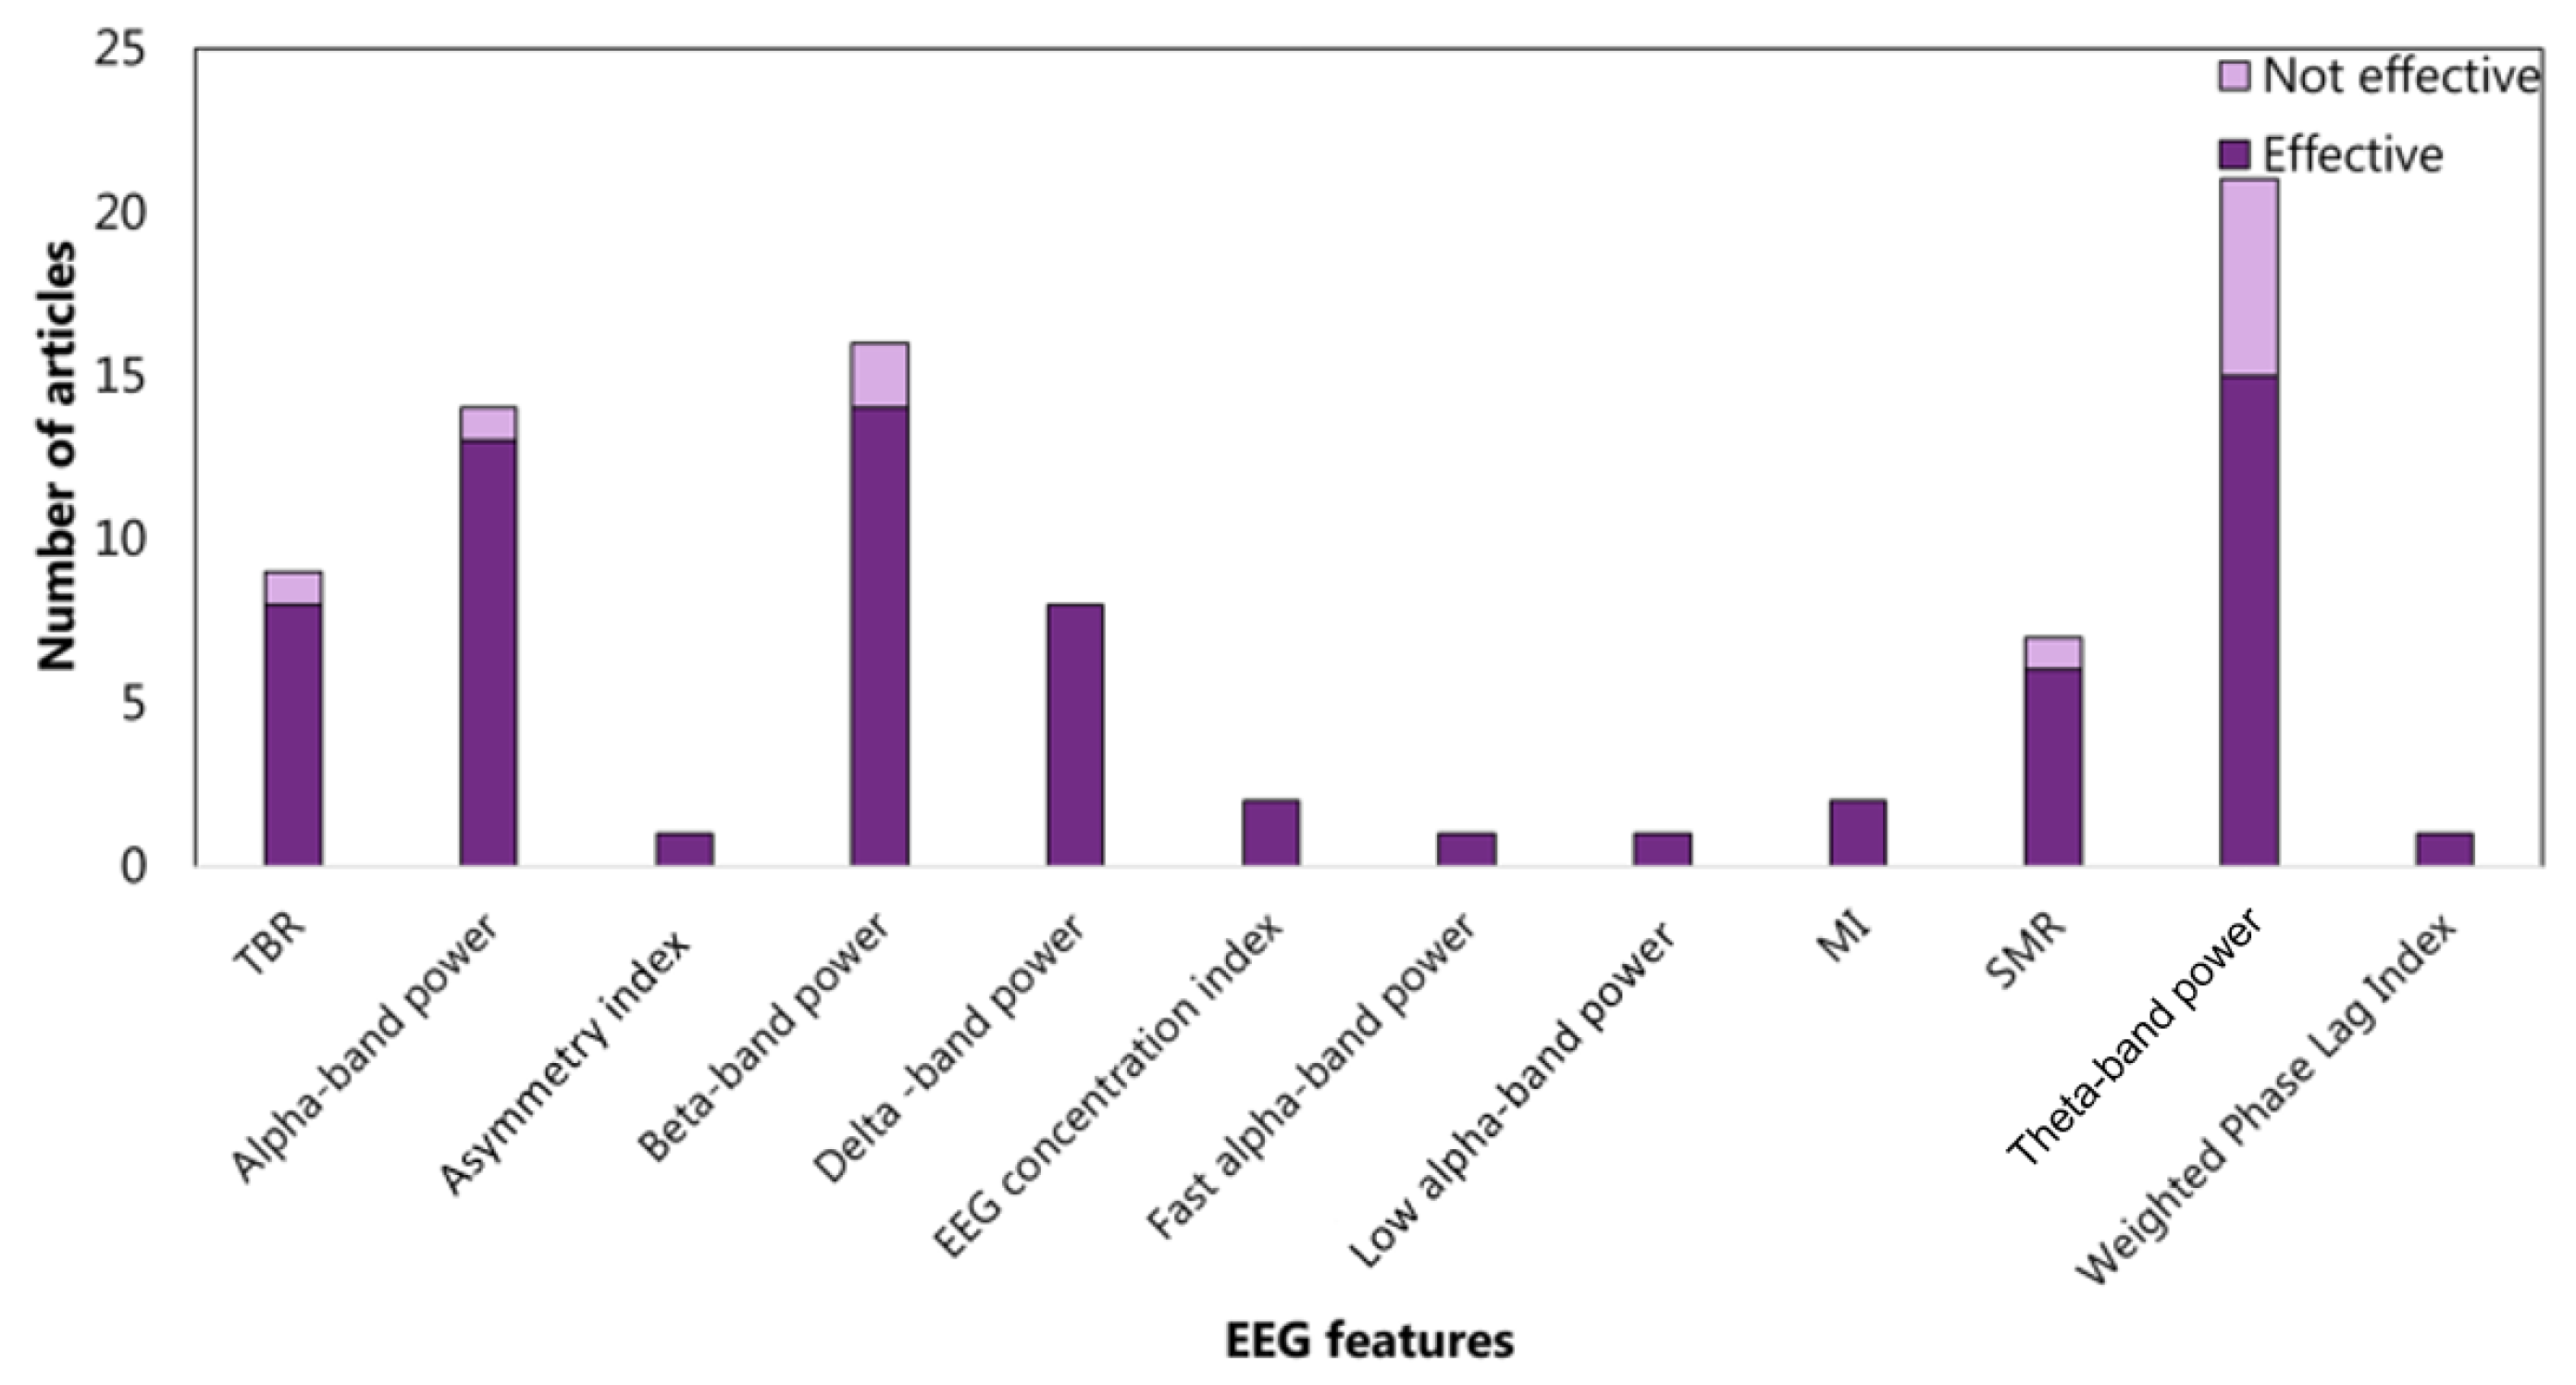
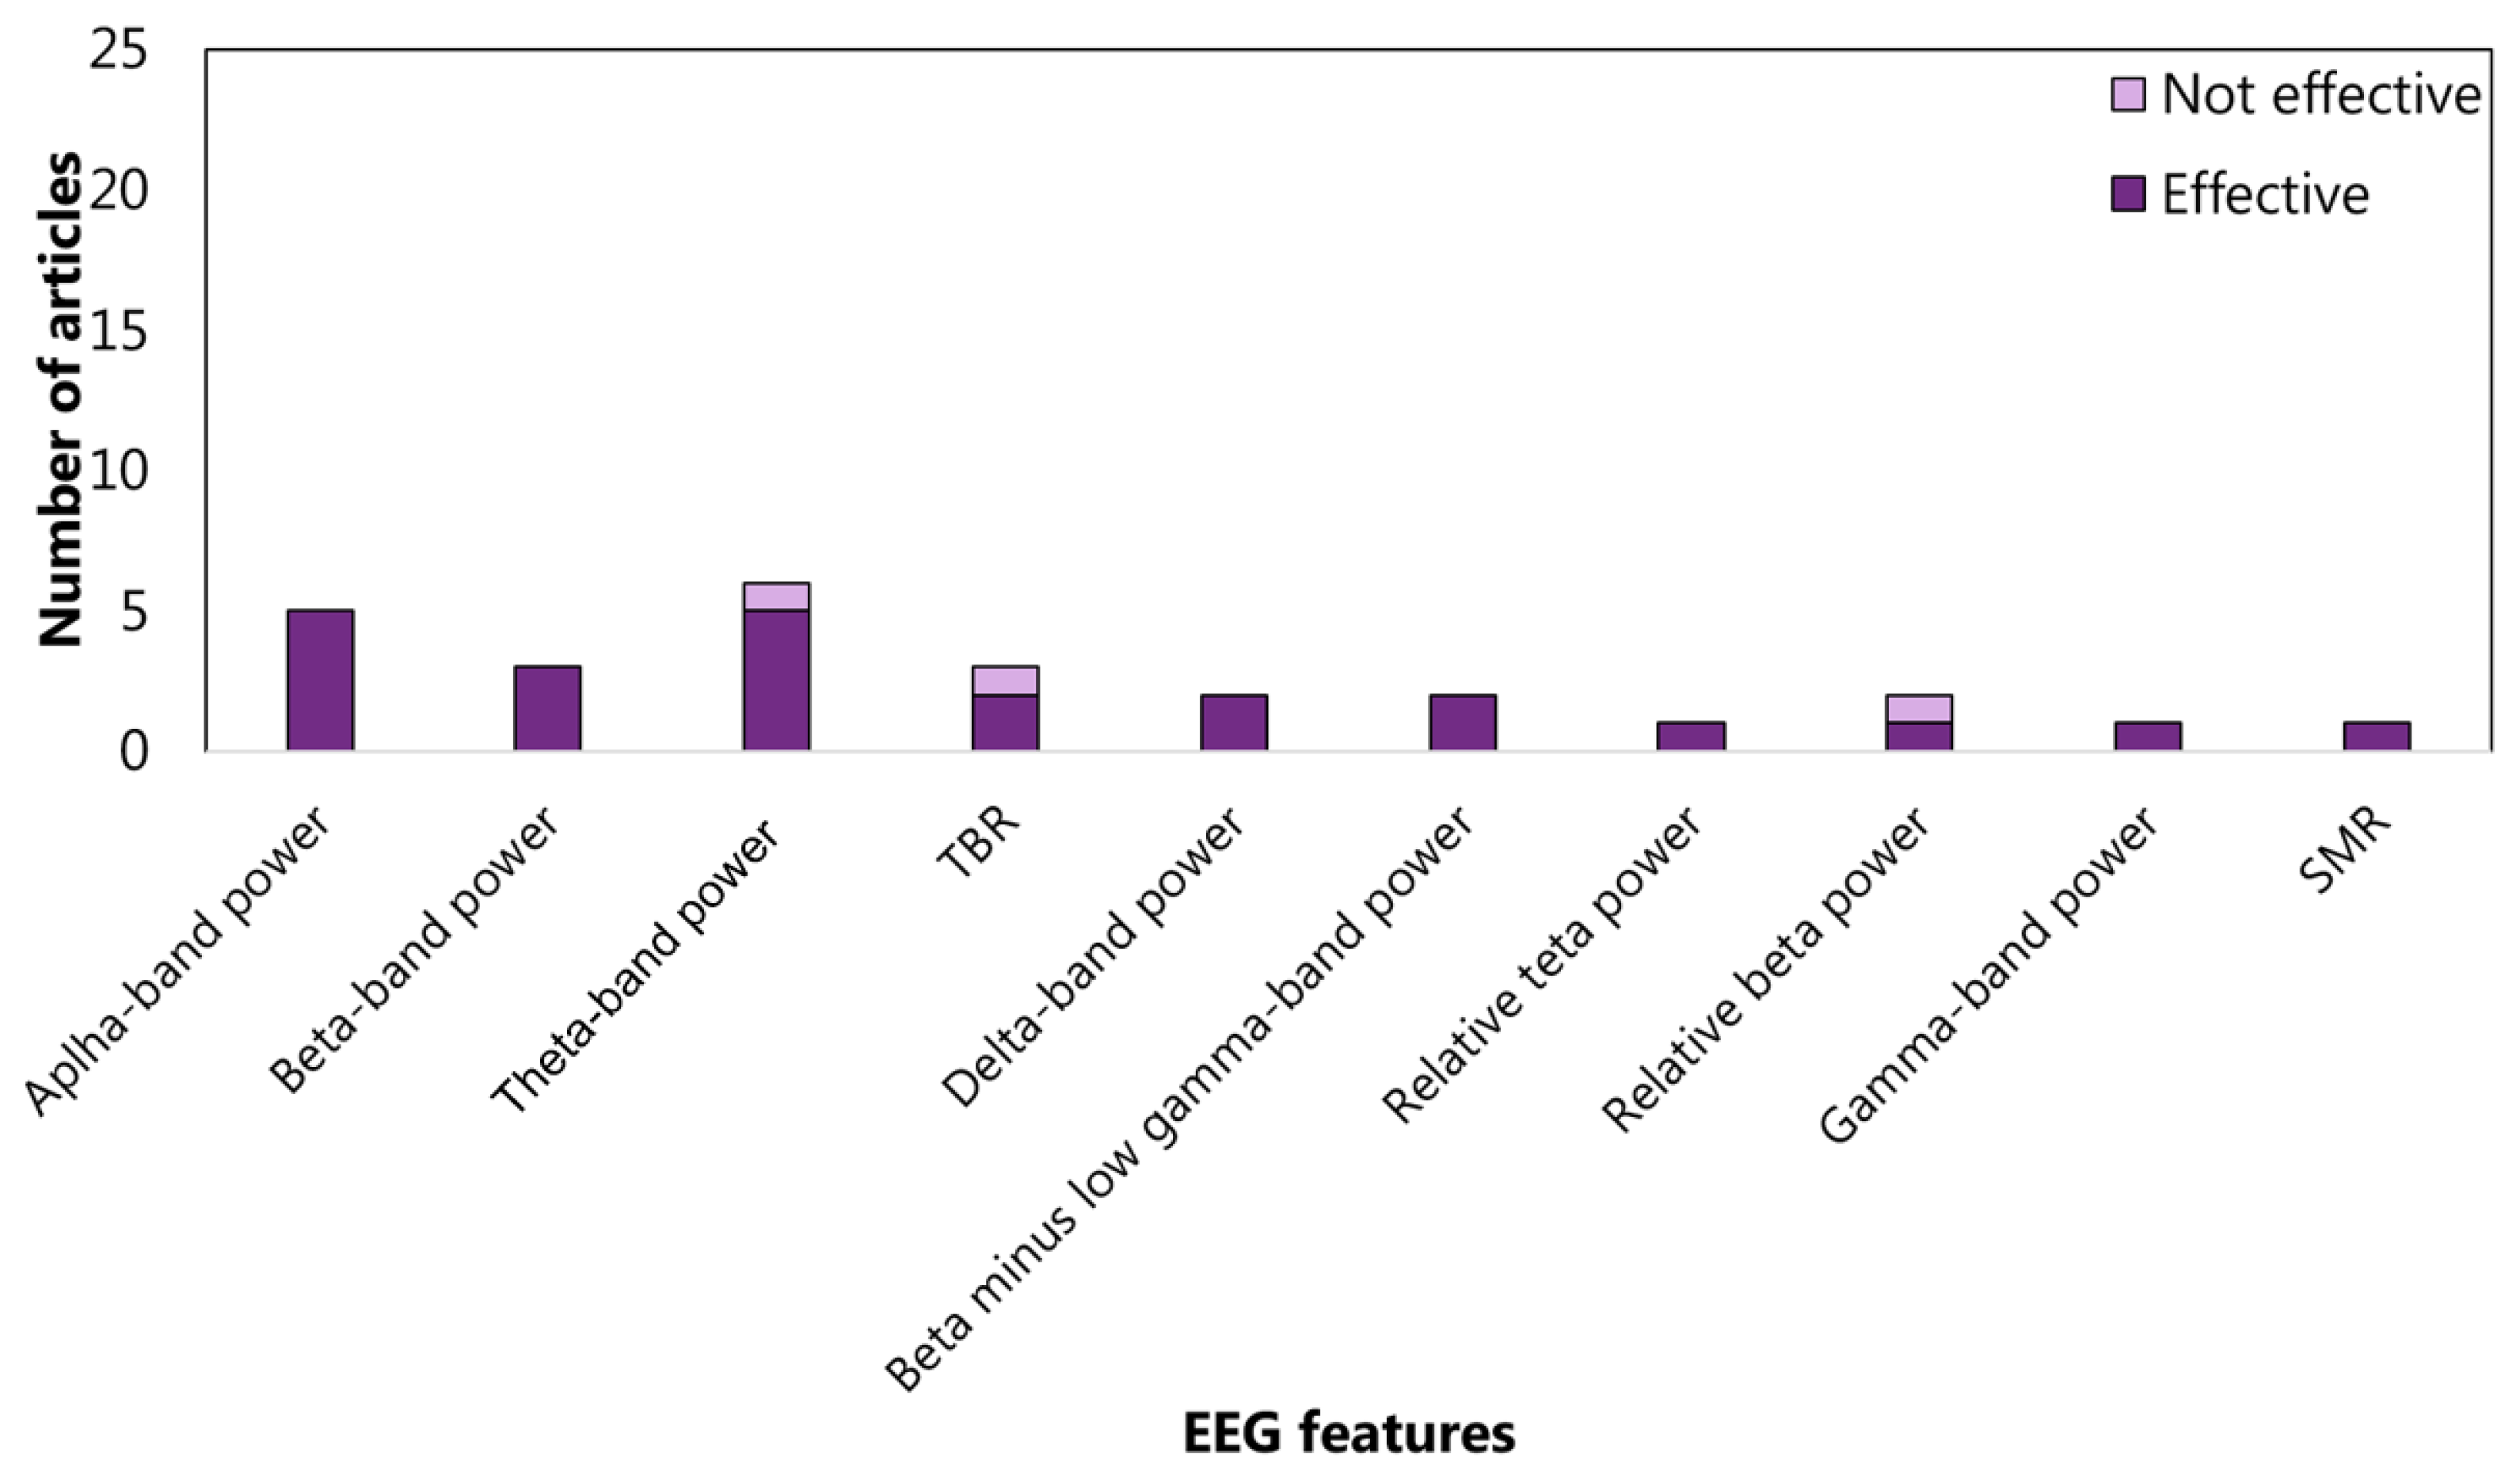
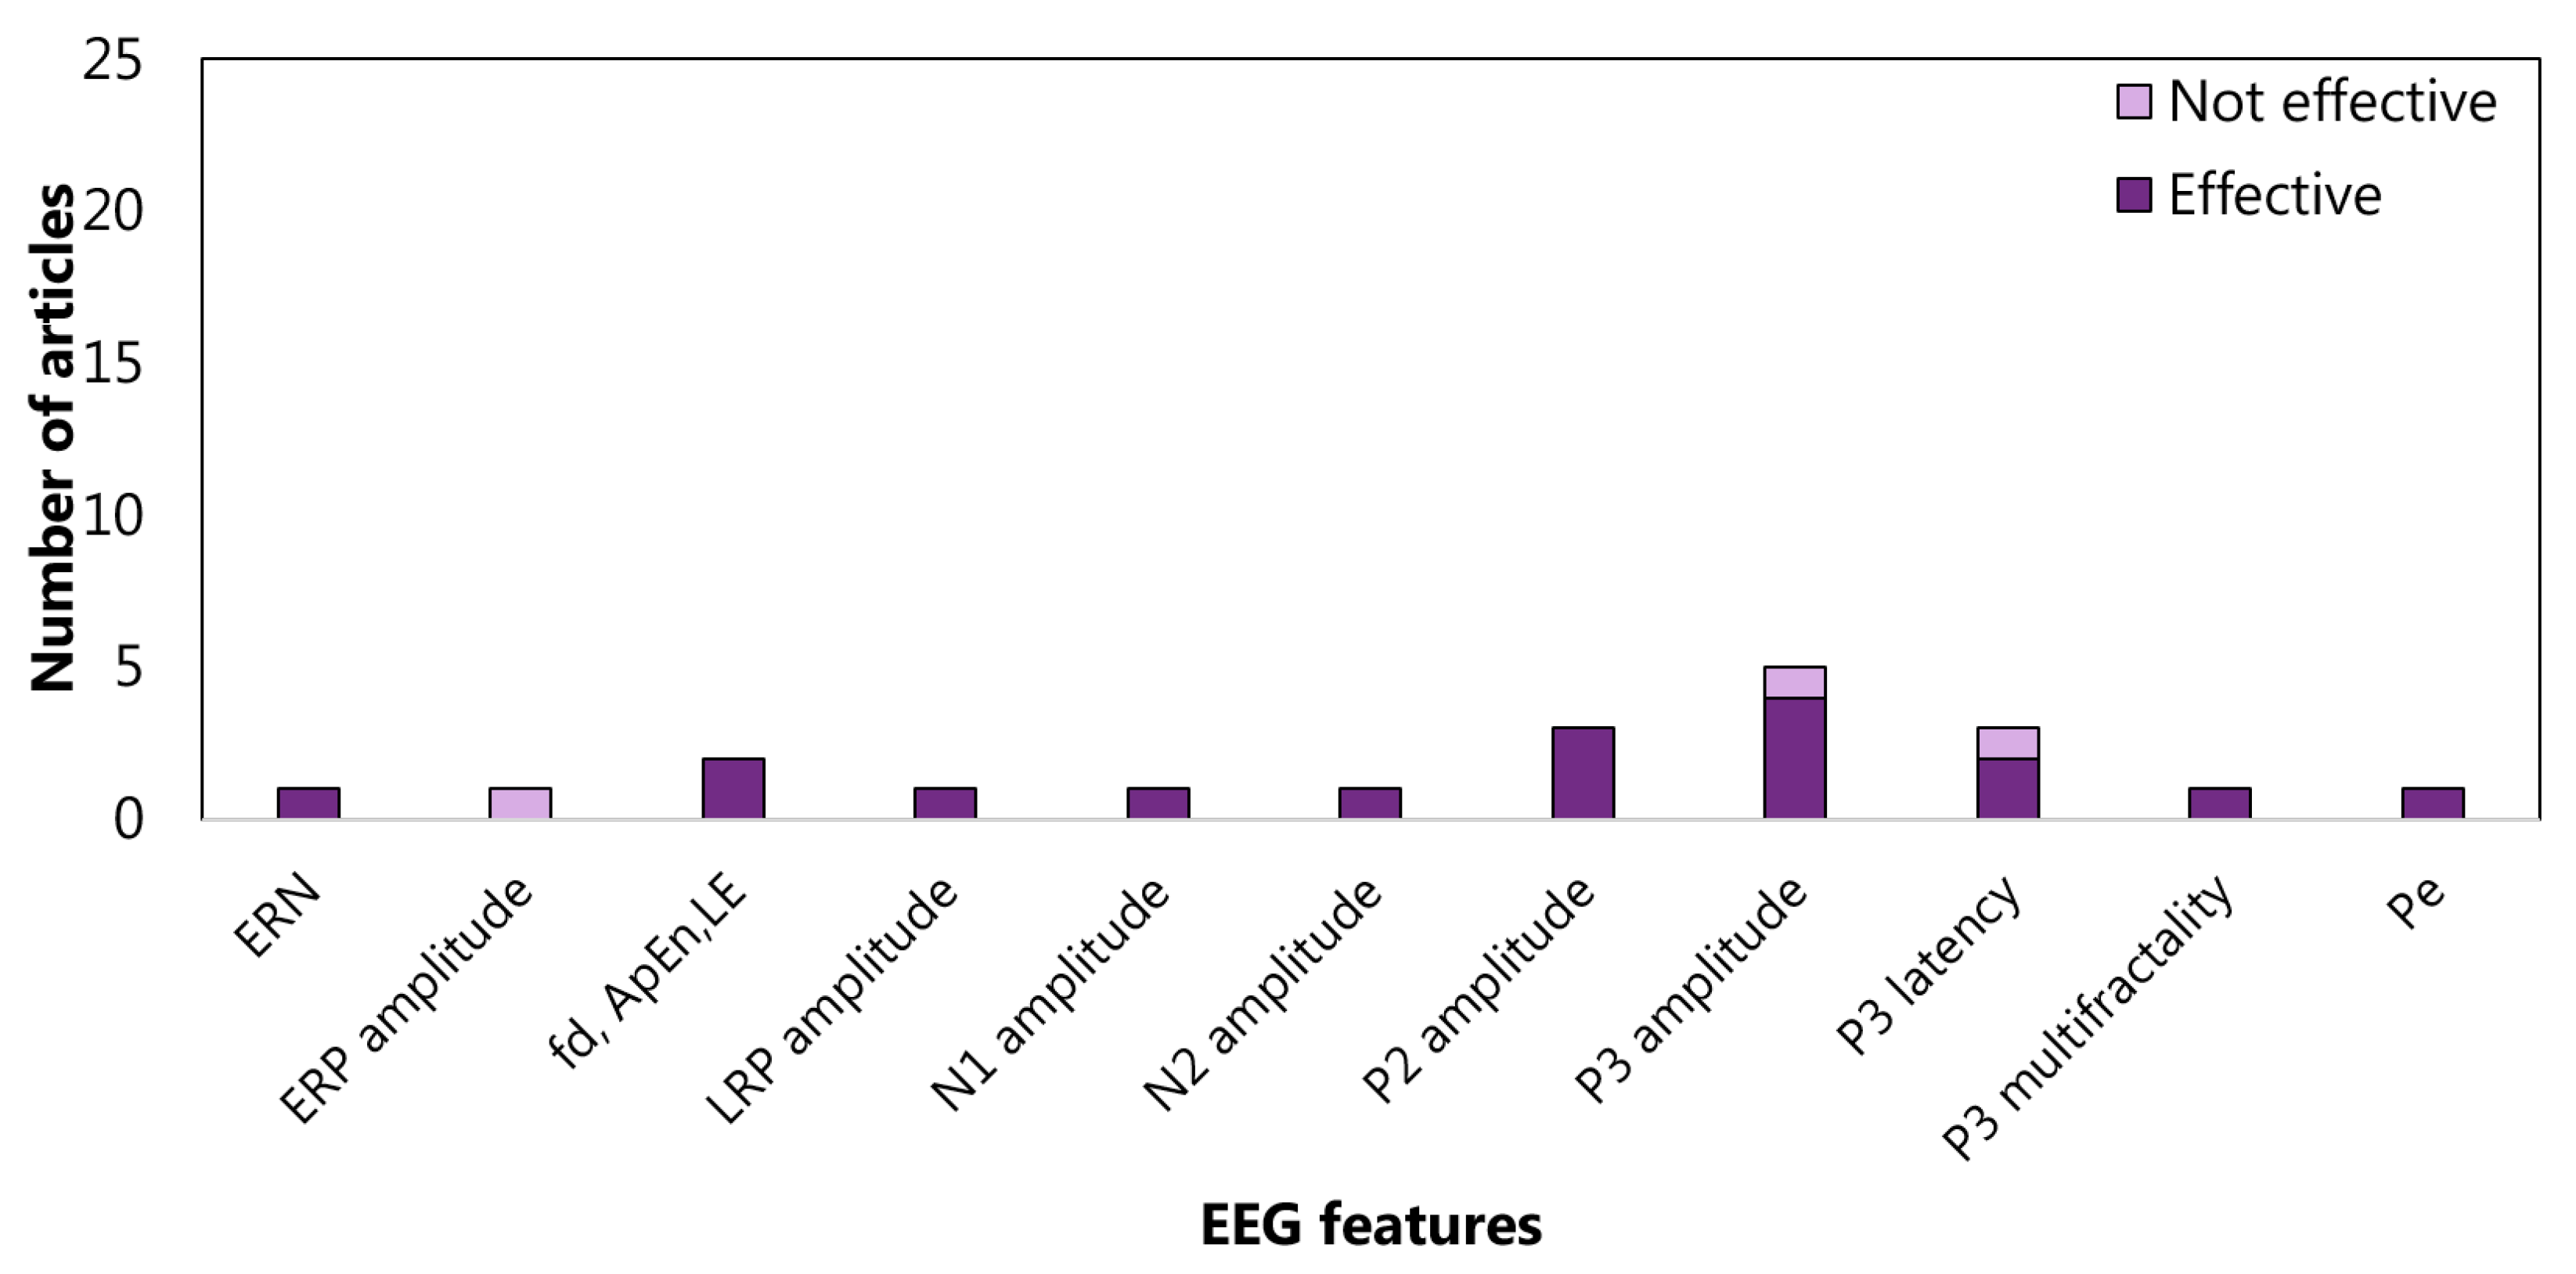
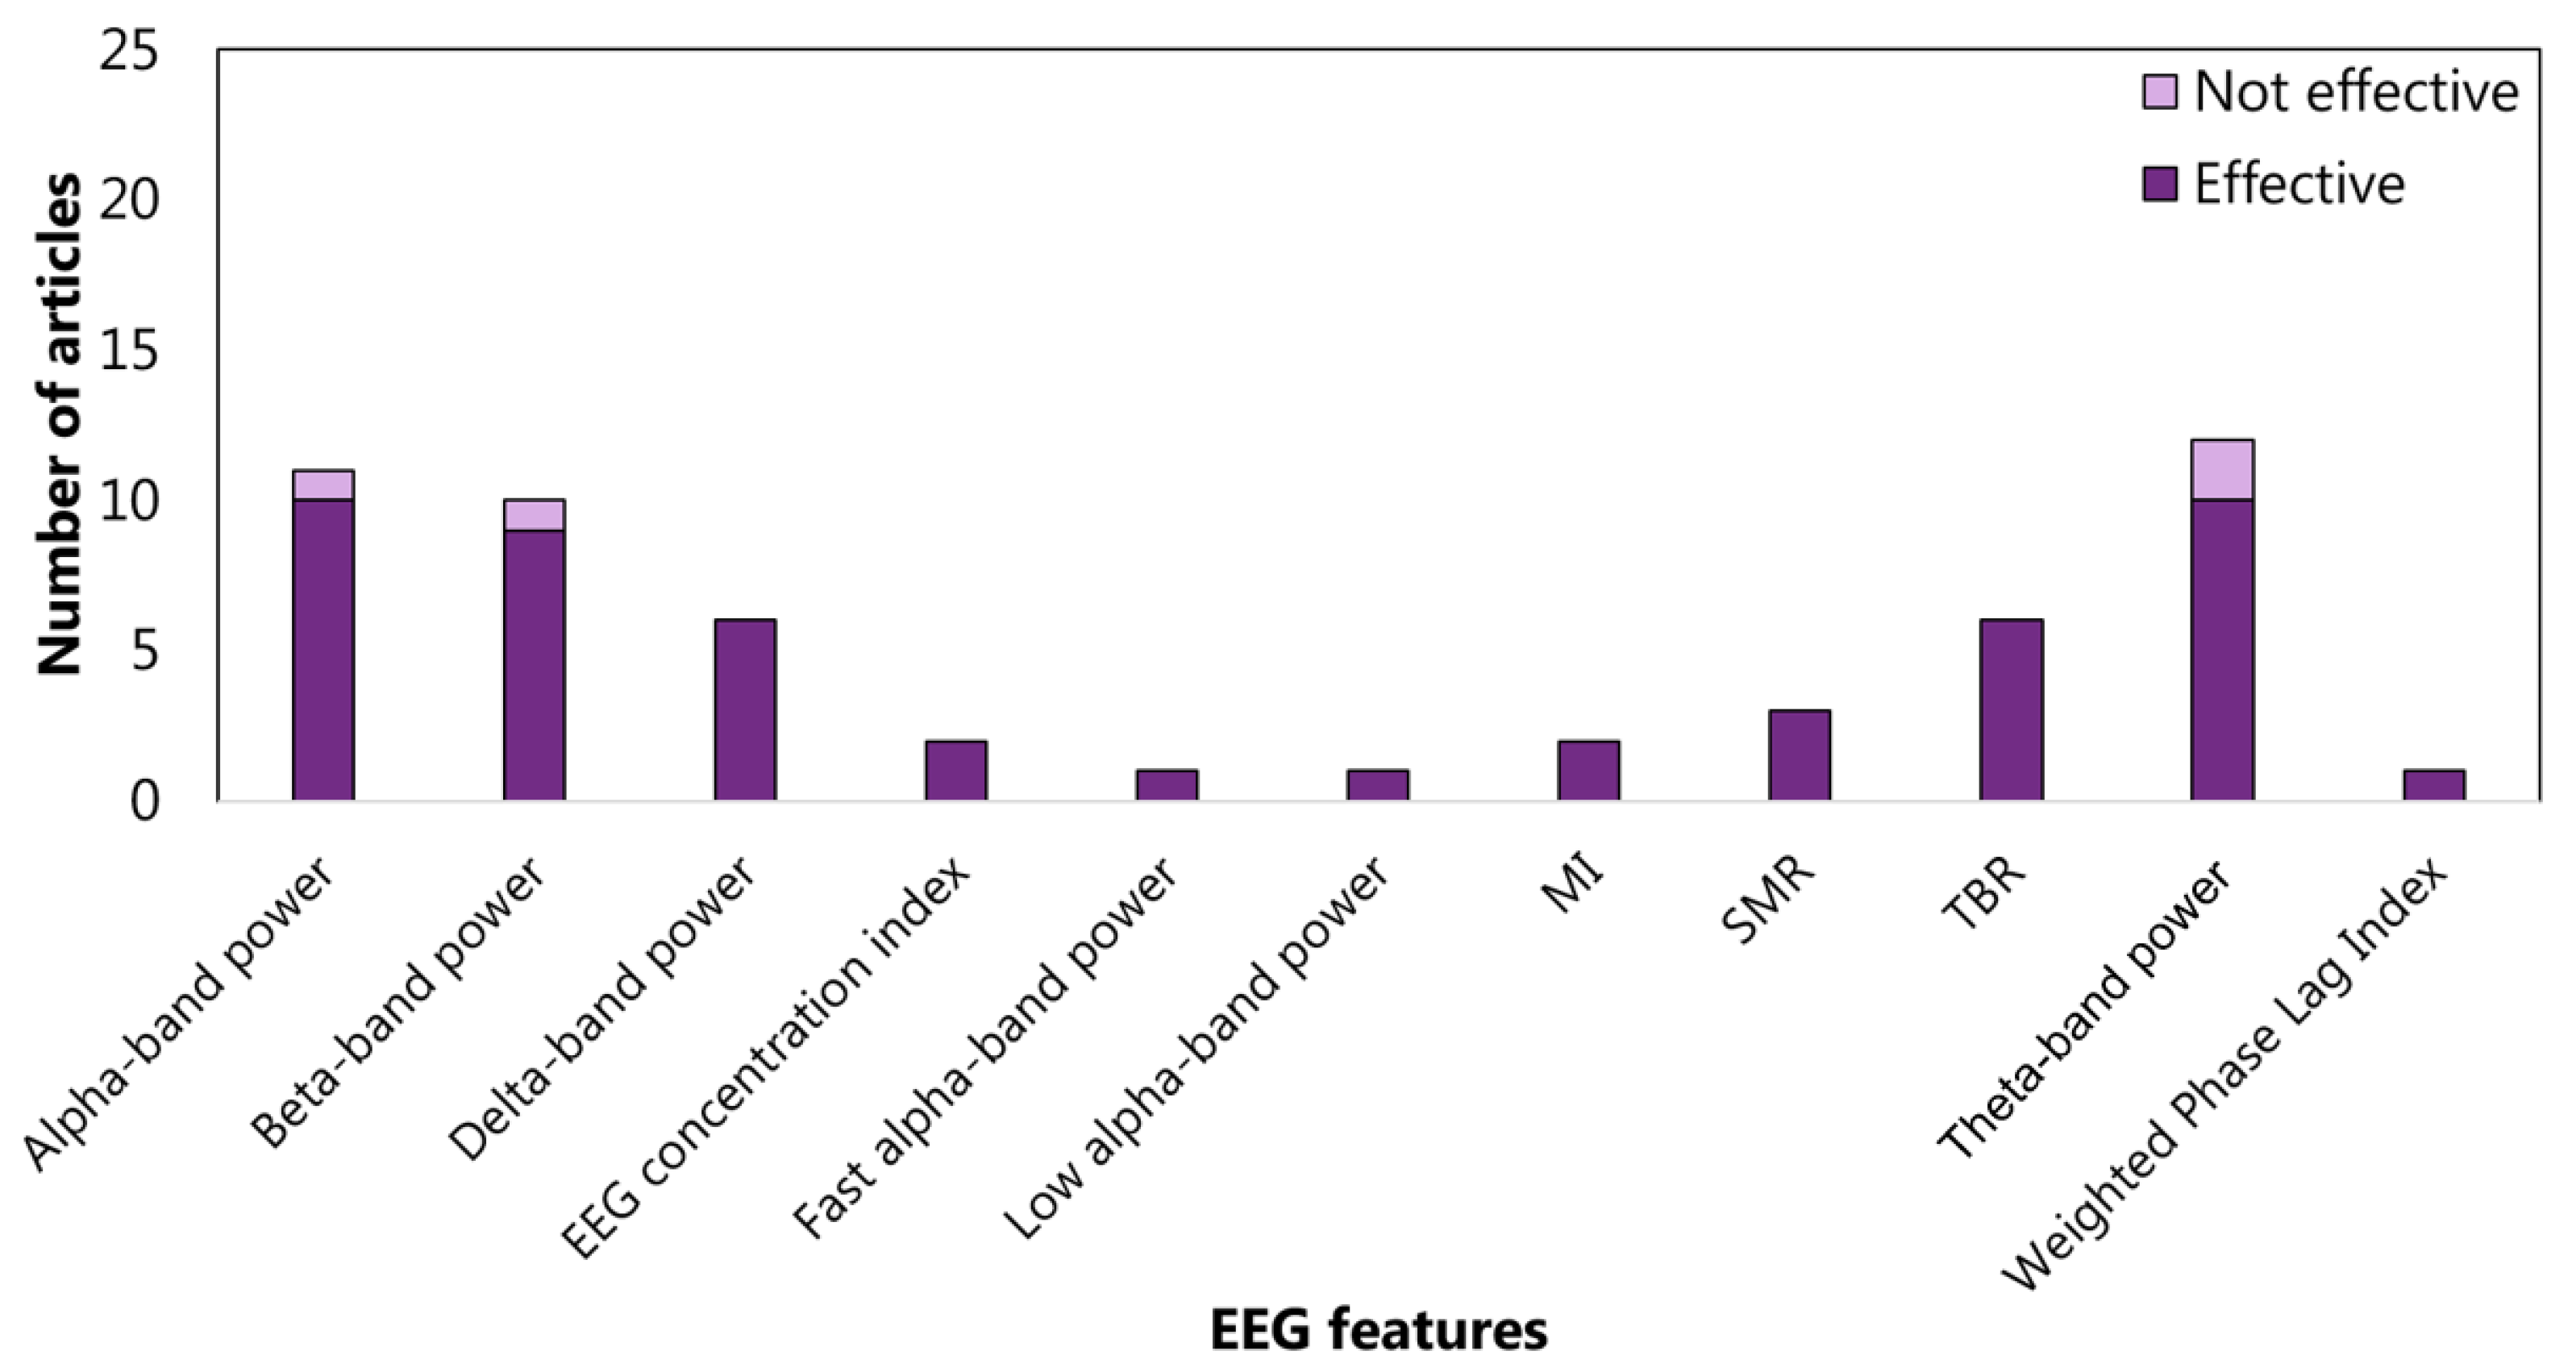
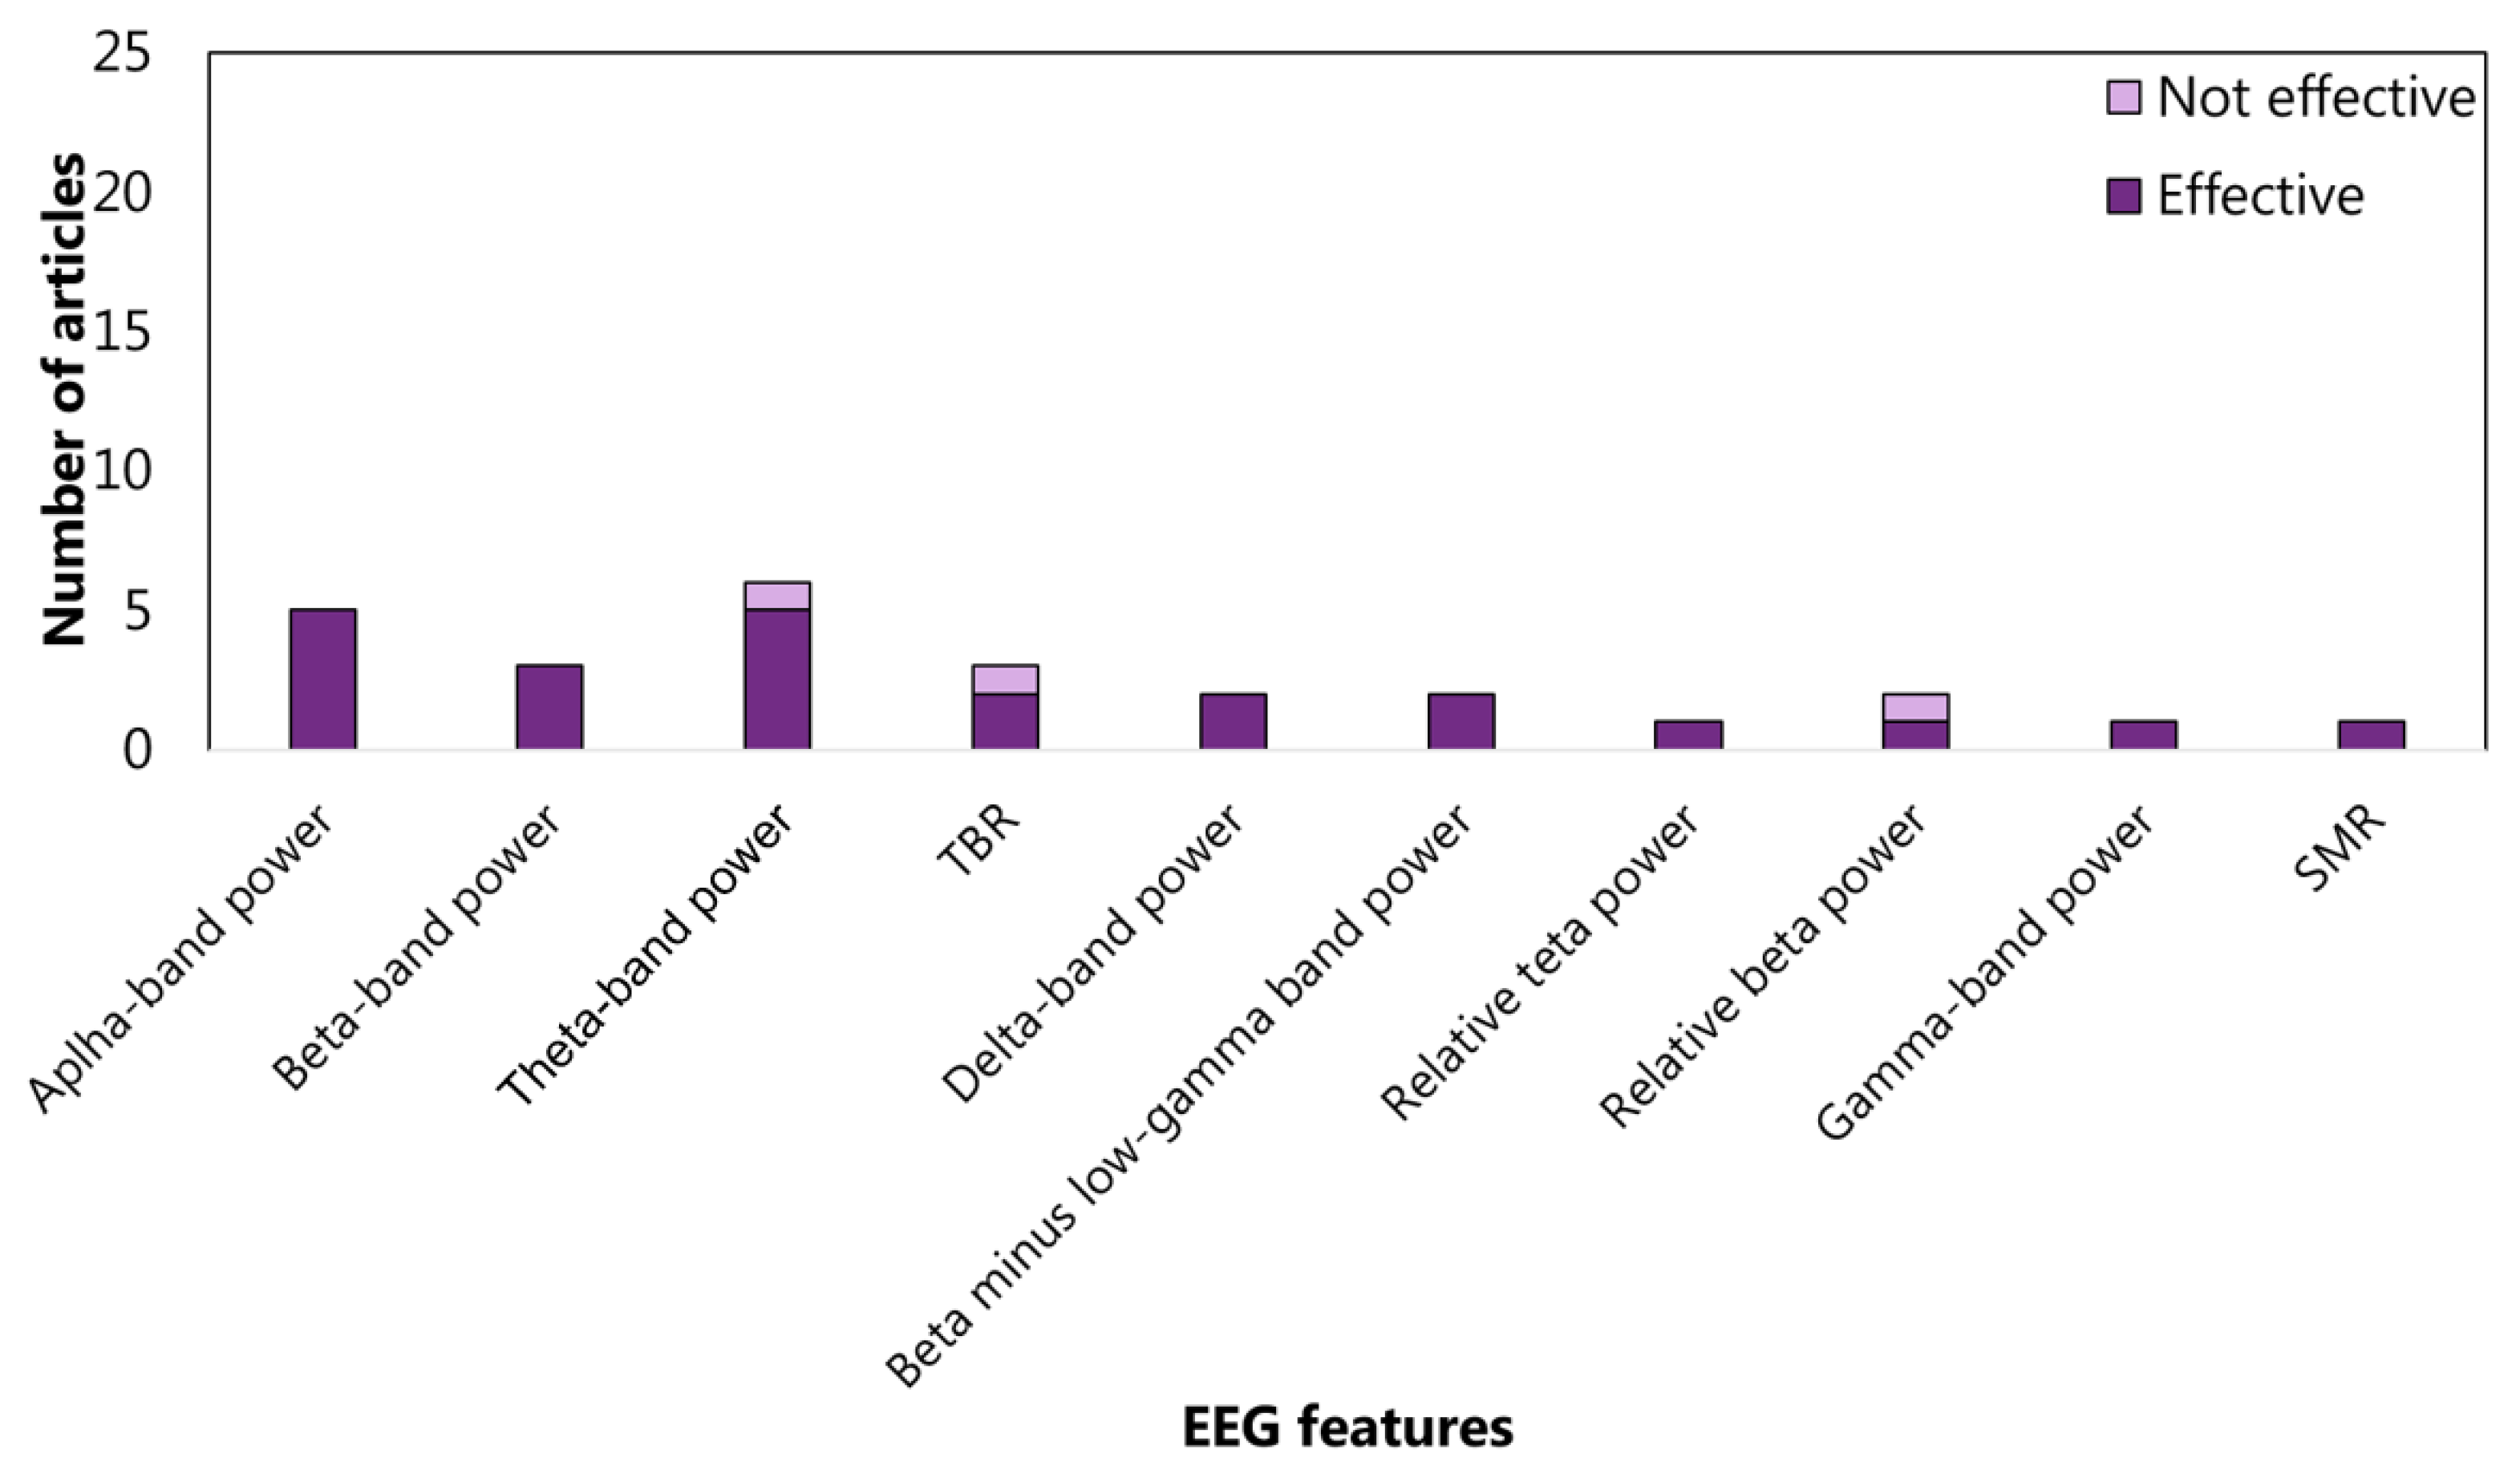
3.1. Executive Functions and EEG Features
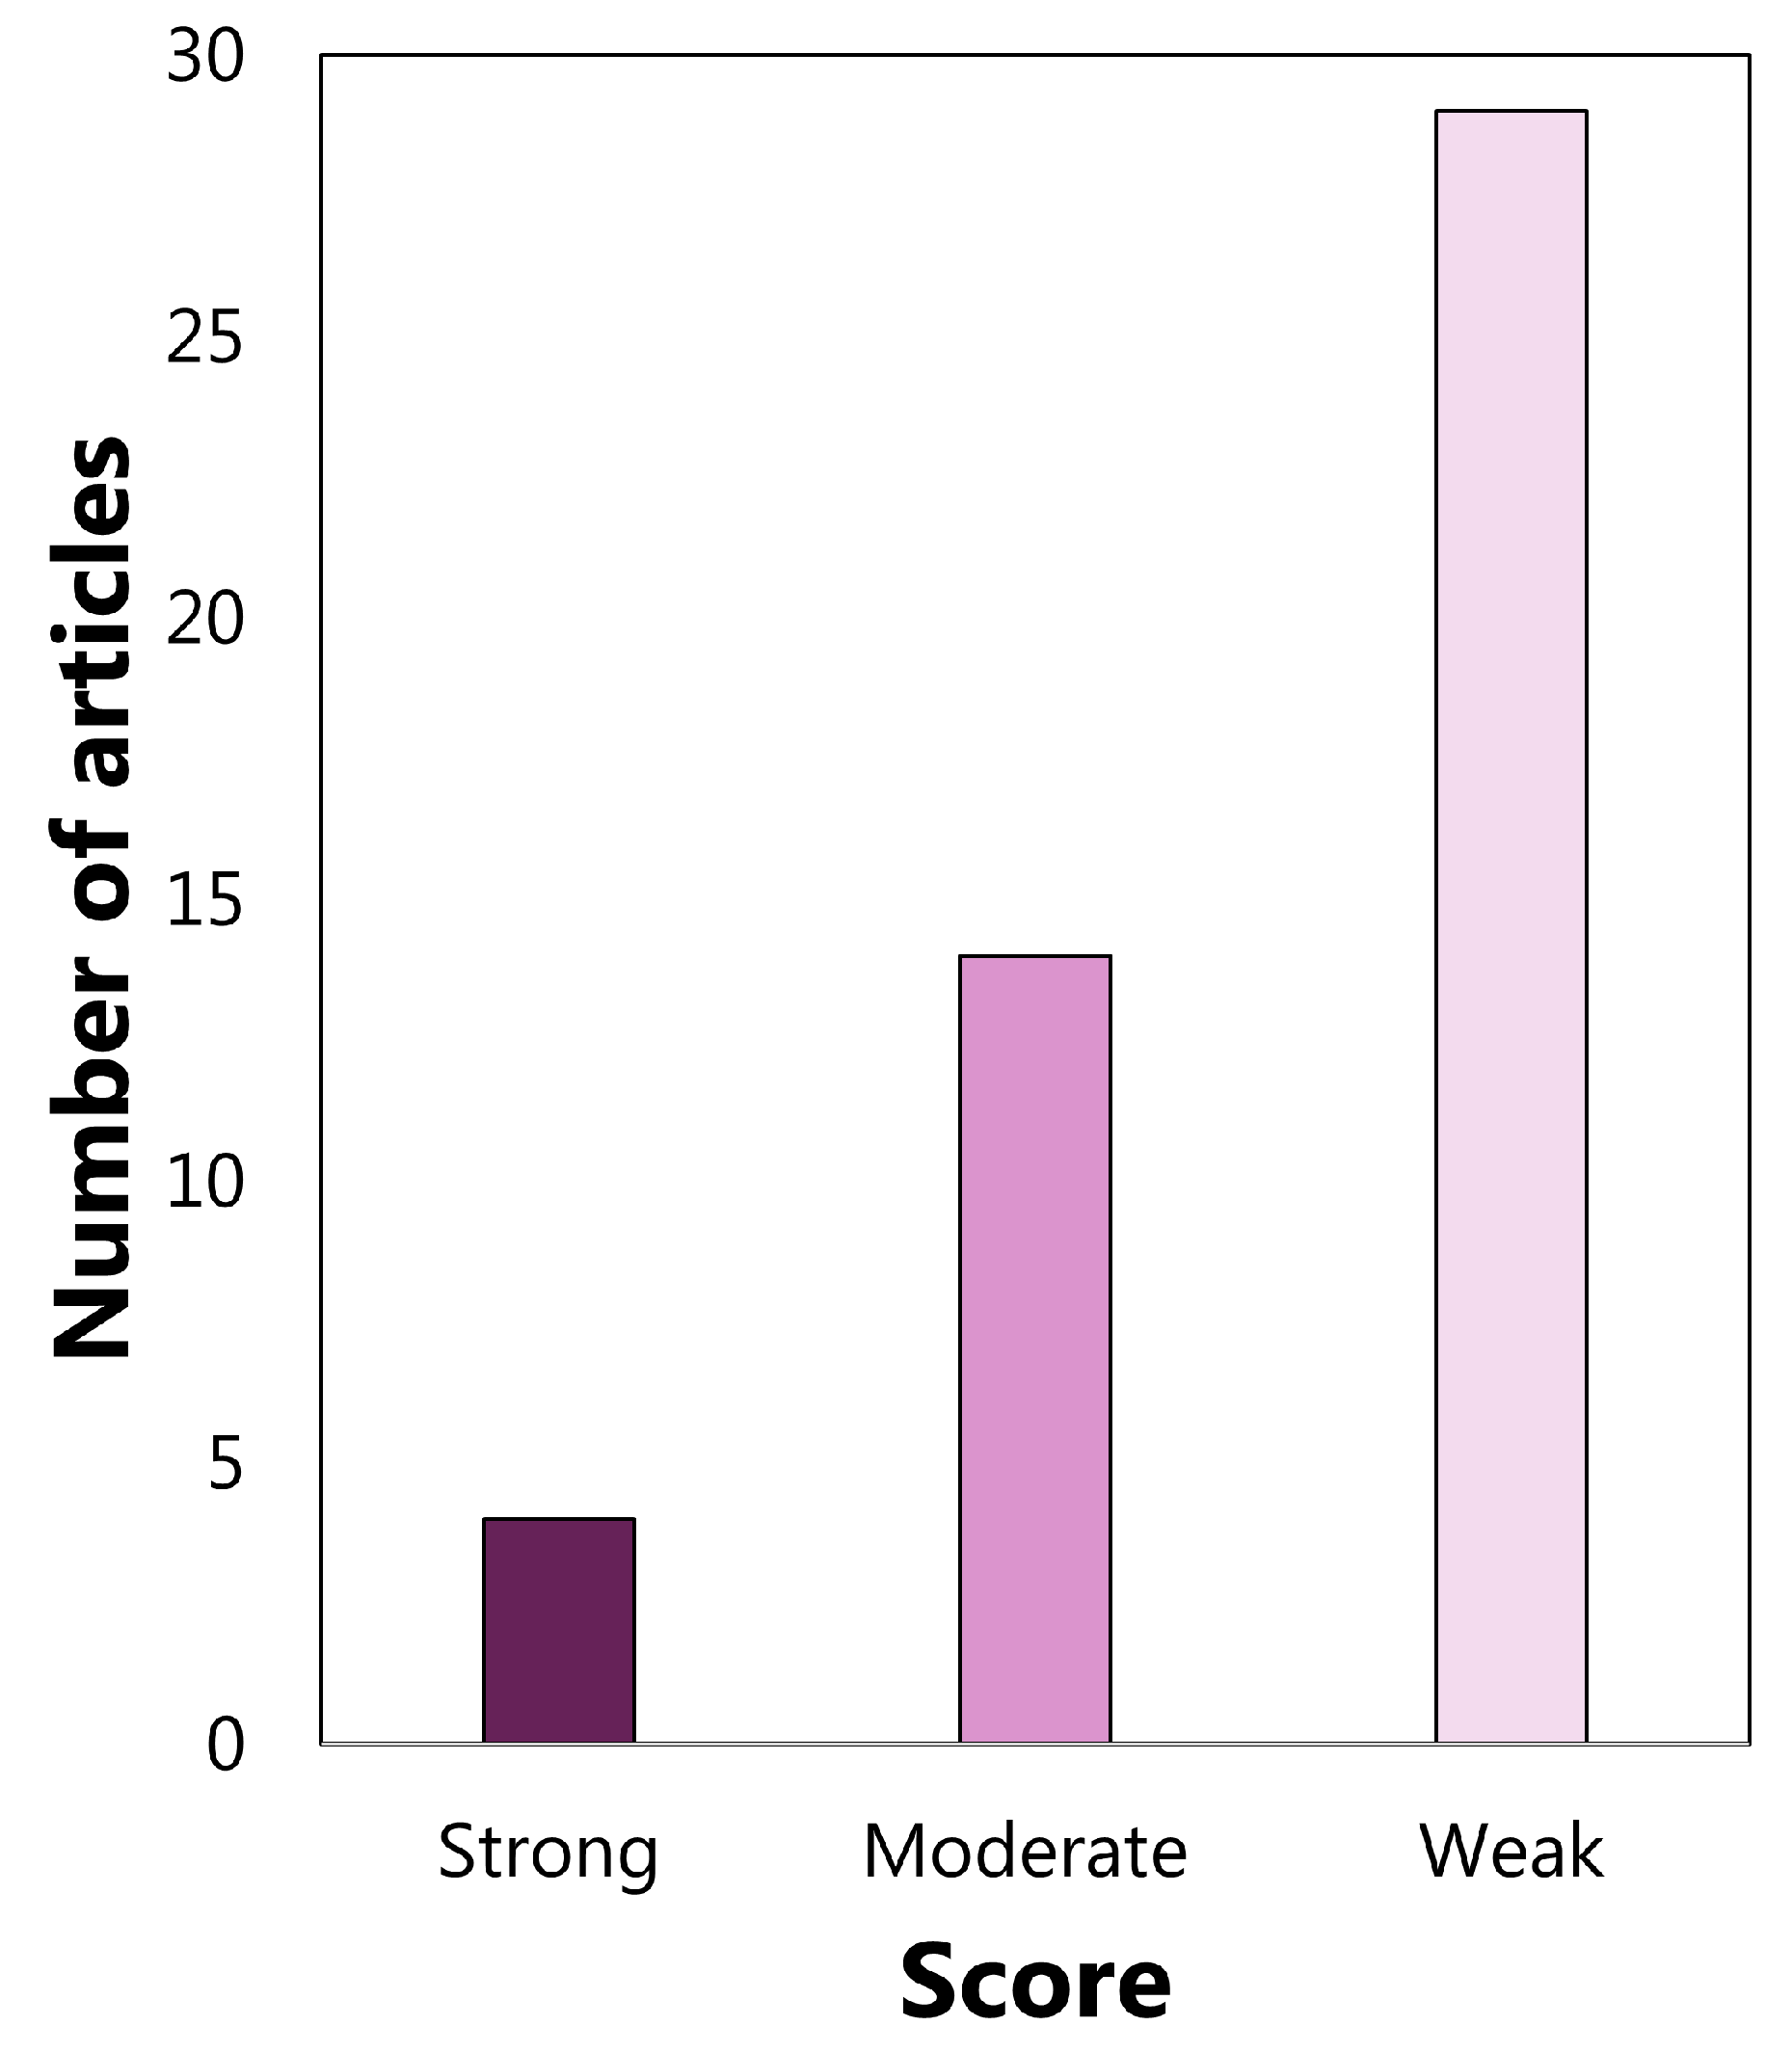
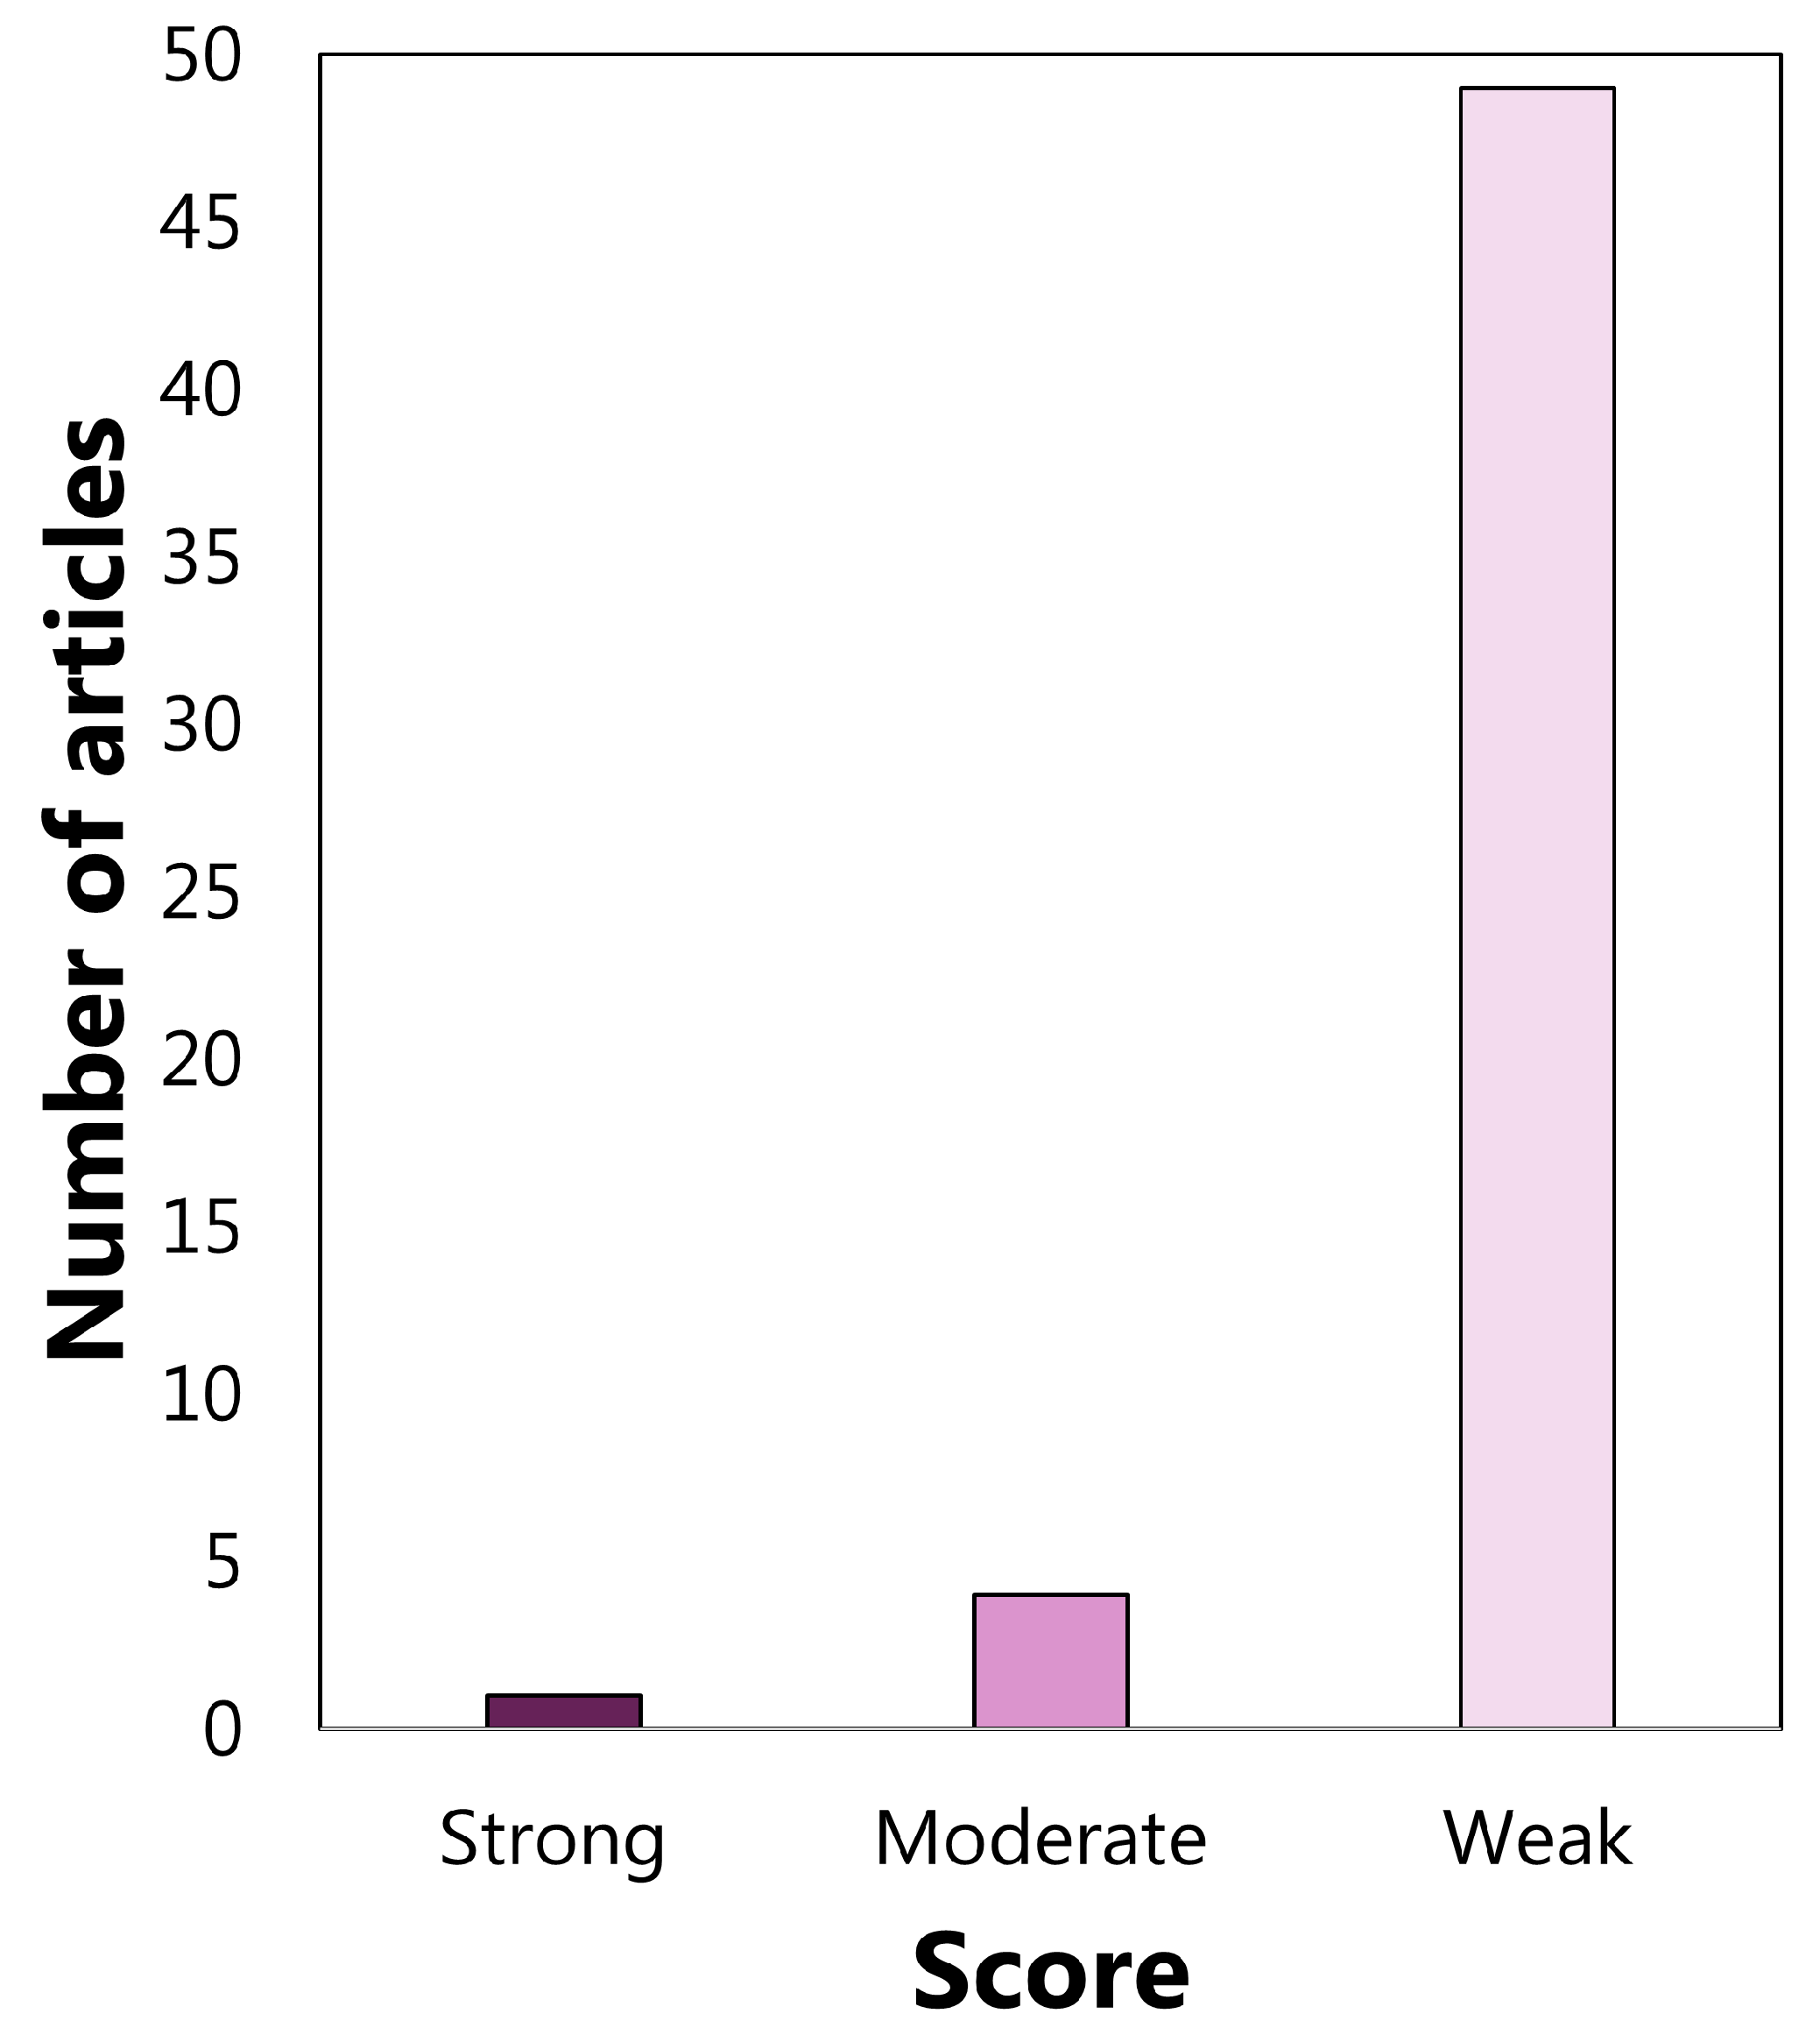
3.2. Quality Assessment Output
4. Discussion
5. Conclusions
Author Contributions
Funding
Acknowledgments
Conflicts of Interest
Appendix A. Most Used EEG Features in EF Analysis
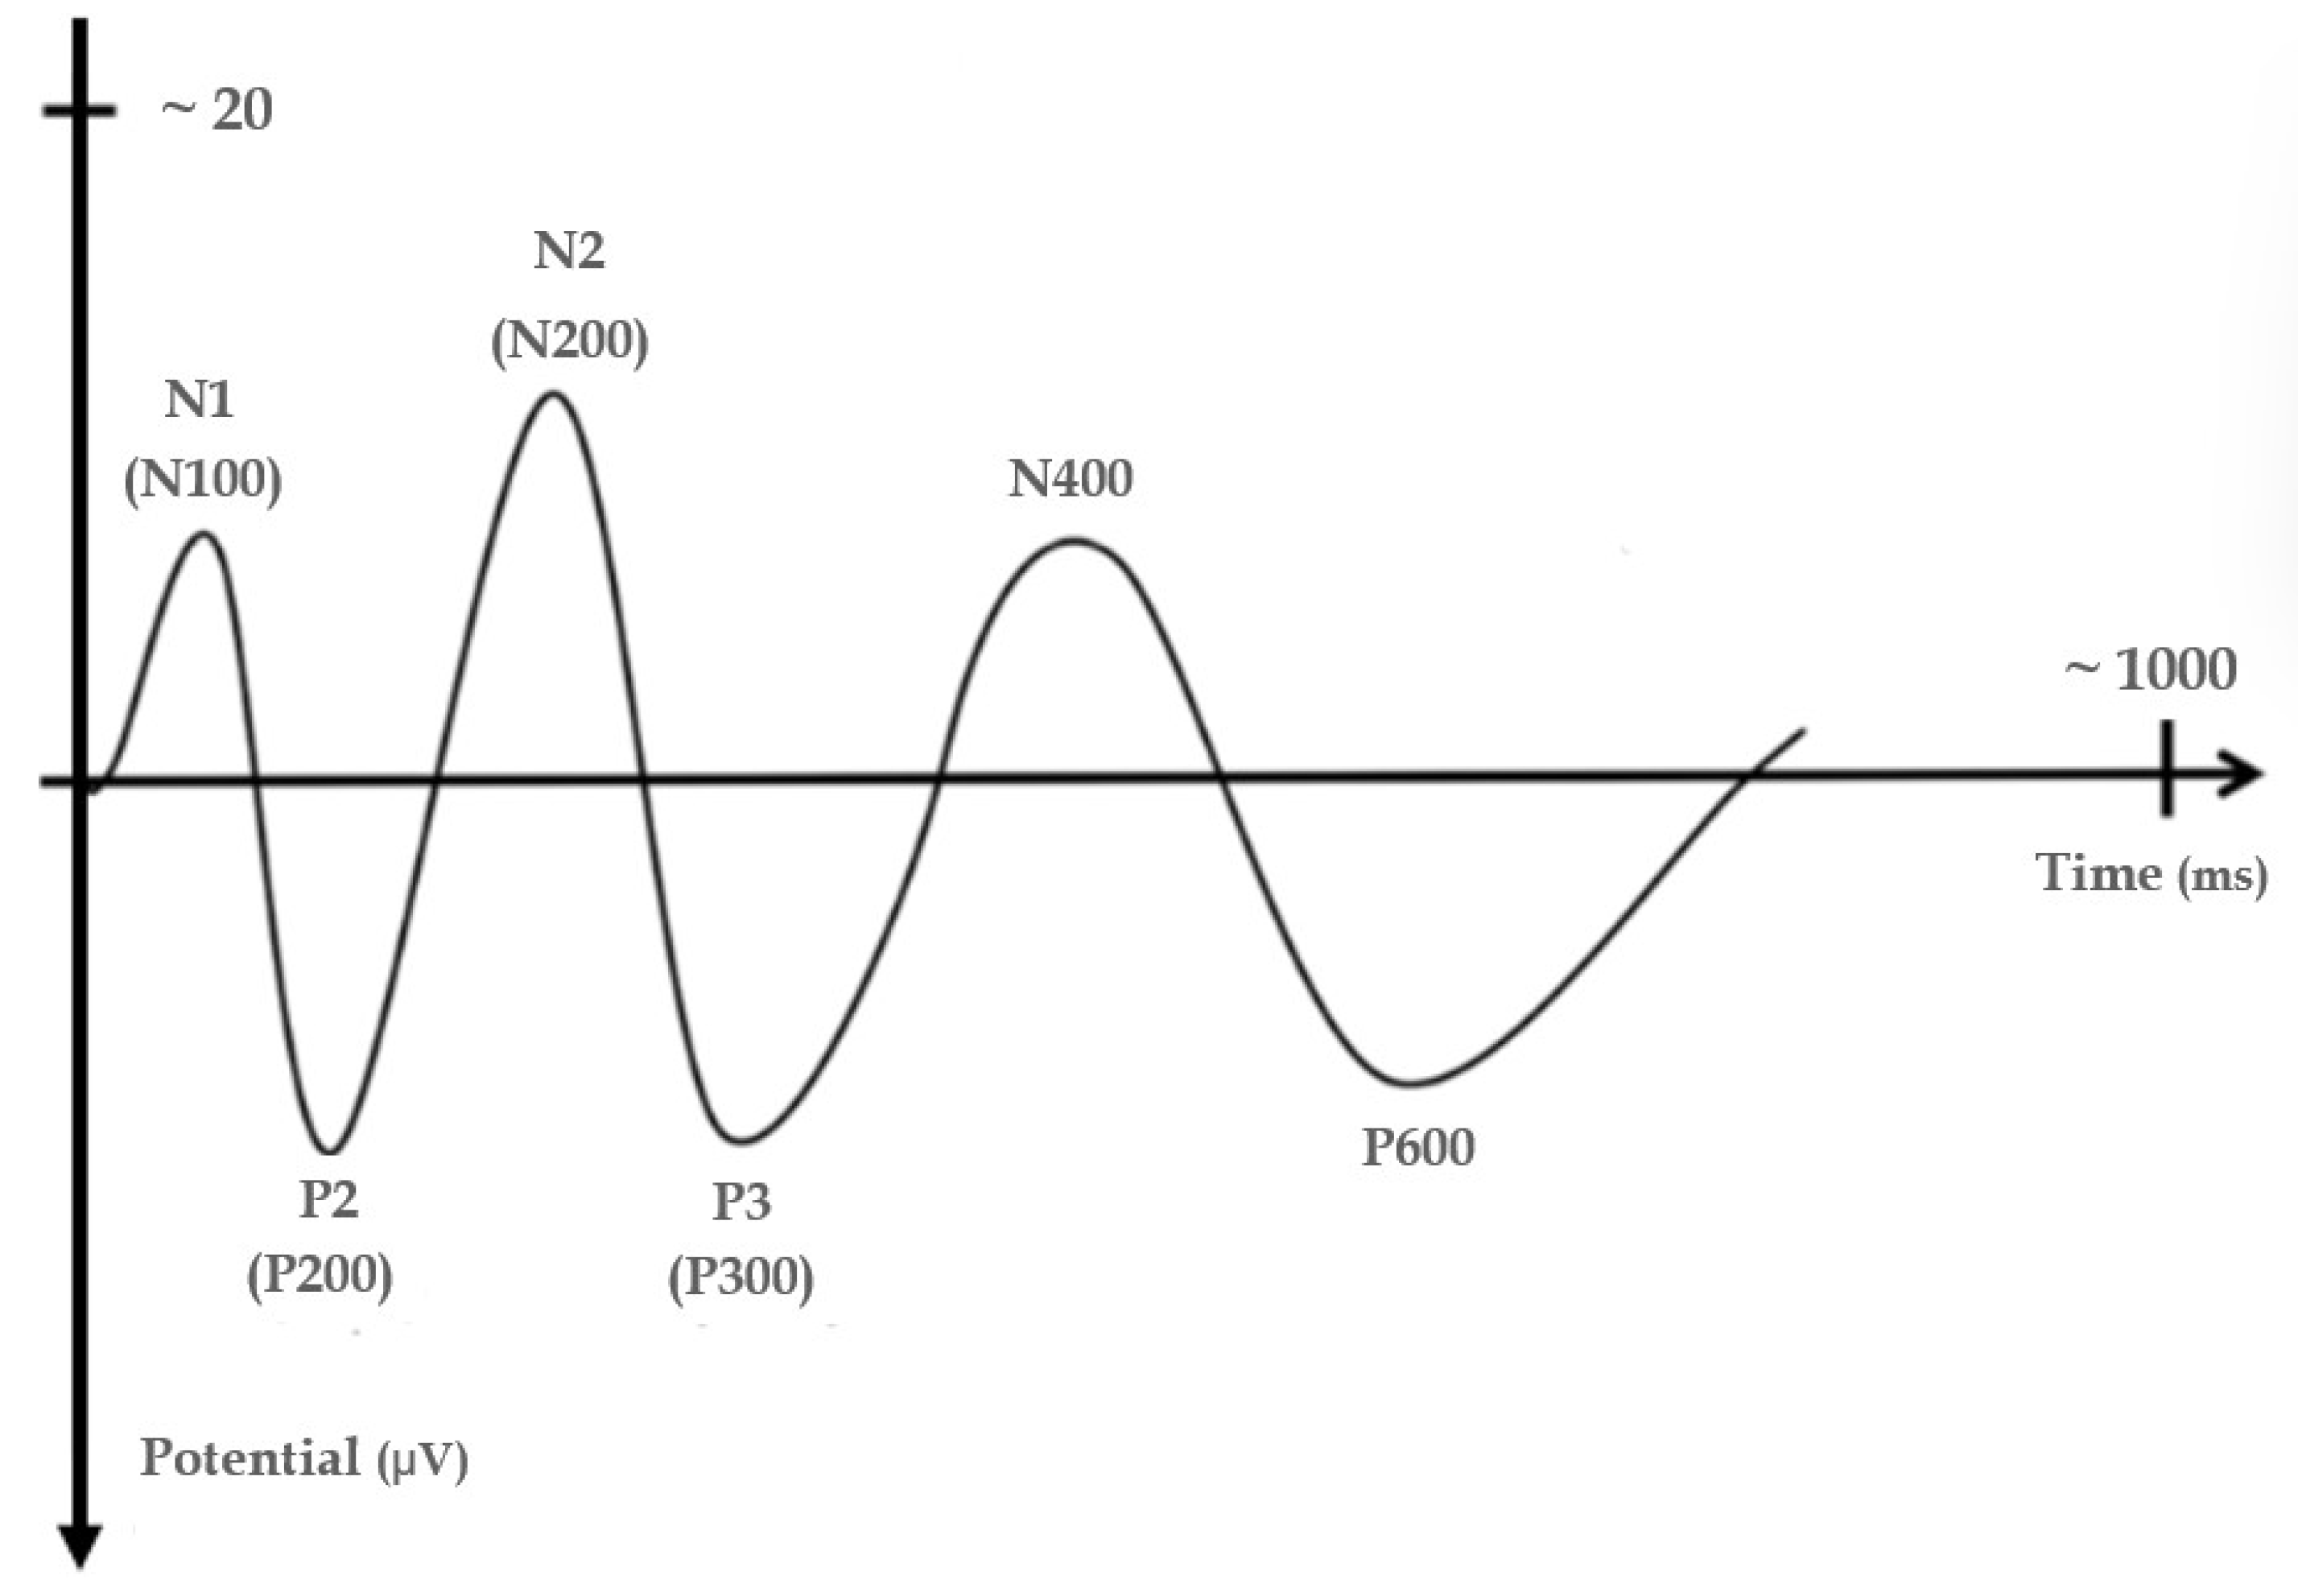
Appendix A.1. Event-Related Potential

Appendix A.1.1. N1
Appendix A.1.2. N2
Appendix A.1.3. P2
Appendix A.1.4. P3
Appendix A.1.5. N400
Appendix A.1.6. P600
Appendix A.1.7. Error-Related Negativity
Appendix A.1.8. Contingent Negative Variation
Appendix A.1.9. Lateralised Readiness Potential
Appendix A.1.10. Bereitschaftspotential
Appendix A.2. Slow Cortical Potential
Appendix A.3. Fractal Dimension
Appendix A.4. Power Spectral Density/Relative Power Spectral Density
Appendix A.5. Modulation Index
Appendix A.6. Consistency Index
Appendix A.7. Asymmetry Index
Appendix A.8. Multiscale Entropy
Appendix A.9. Lempel–Ziv Complexity
Appendix A.10. EEG Valid Rate
Appendix A.11. WPLI
Appendix A.12. Theta Beta Ratio
Appendix A.13. Sensorimotor Rhythms
Appendix A.14. The EEG Concentration Index
References
- American Psychiatric Association. Diagnostic and Statistical Manual of Mental Disorders: DSM-5; American Psychiatric Association: Washington, DC, USA, 2013; Volume 5. [Google Scholar]
- Jasper, H.H.; Solomon, P.; Bradley, C. Electroencephalographic analyses of behavior problem children. Am. J. Psychiatry 1938, 95, 641–658. [Google Scholar] [CrossRef]
- Lenartowicz, A.; Loo, S.K. Use of EEG to diagnose ADHD. Curr. Psychiatry Rep. 2014, 16, 498. [Google Scholar] [CrossRef] [PubMed] [Green Version]
- Lubar, J.F. Discourse on the development of EEG diagnostics and biofeedback for attention-deficit/hyperactivity disorders. Biofeedback Self-Regul. 1991, 16, 201–225. [Google Scholar] [CrossRef] [PubMed]
- Thomas, T.A.; Gaffney, A. Neuropsychiatric EEG-based assessment aid system. US Pharm 2017, 42, 25–27. [Google Scholar]
- Fox, D.J.; Tharp, D.F.; Fox, L.C. Neurofeedback: An alternative and efficacious treatment for attention deficit hyperactivity disorder. Appl. Psychophysiol. Biofeedback 2005, 30, 365–373. [Google Scholar] [CrossRef]
- Roberts, B.A.; Martel, M.M.; Nigg, J.T. Are there executive dysfunction subtypes within ADHD? J. Atten. Disord. 2017, 21, 284–293. [Google Scholar] [CrossRef]
- Barkley, R.A. Behavioral inhibition, sustained attention, and executive functions: Constructing a unifying theory of ADHD. Psychol. Bull. 1997, 121, 65. [Google Scholar] [CrossRef] [Green Version]
- Carlson, C.L.; Mann, M. Attention-deficit/hyperactivity disorder, predominantly inattentive subtype. Child Adolesc. Psychiatr. Clin. North Am. 2000, 9, 499–510. [Google Scholar] [CrossRef]
- Miyake, A.; Friedman, N.P.; Emerson, M.J.; Witzki, A.H.; Howerter, A.; Wager, T.D. The unity and diversity of executive functions and their contributions to complex “frontal lobe” tasks: A latent variable analysis. Cogn. Psychol. 2000, 41, 49–100. [Google Scholar] [CrossRef] [Green Version]
- Cortese, S.; Kelly, C.; Chabernaud, C.; Proal, E.; Di Martino, A.; Milham, M.P.; Castellanos, F.X. Toward systems neuroscience of ADHD: A meta-analysis of 55 fMRI studies. Am. J. Psychiatry 2012, 169, 1038–1055. [Google Scholar] [CrossRef]
- Klingberg, T.; Forssberg, H.; Westerberg, H. Training of working memory in children with ADHD. J. Clin. Exp. Neuropsychol. 2002, 24, 781–791. [Google Scholar] [CrossRef] [PubMed] [Green Version]
- Diamond, A. executive functions. Annu. Rev. Psychol. 2013, 64, 135–168. [Google Scholar] [CrossRef] [PubMed] [Green Version]
- Collins, A.; Koechlin, E. Reasoning, learning, and creativity: Frontal lobe function and human decision-making. PLoS Biol. 2012, 10, e1001293. [Google Scholar] [CrossRef] [PubMed]
- Lunt, L.; Bramham, J.; Morris, R.G.; Bullock, P.R.; Selway, R.P.; Xenitidis, K.; David, A.S. Prefrontal cortex dysfunction and ‘Jumping to Conclusions’: Bias or deficit? J. Neuropsychol. 2012, 6, 65–78. [Google Scholar] [CrossRef]
- Baddeley, A.D.; Hitch, G. Working Memory in Perspective; Psychology Press: New York, NY, USA, 2001. [Google Scholar]
- Zhang, R.; Xu, L.; Yu, Z.; Shi, Y.; Mu, C.; Xu, M. Deep-irtarget: An automatic target detector in infrared imagery using dual-domain feature extraction and allocation. IEEE Trans. Multimed. 2021, 24, 1735–1749. [Google Scholar] [CrossRef]
- Zhang, R.; Yang, S.; Zhang, Q.; Xu, L.; He, Y.; Zhang, F. Graph-based few-shot learning with transformed feature propagation and optimal class allocation. Neurocomputing 2022, 470, 247–256. [Google Scholar] [CrossRef]
- Liberati, A.; Altman, D.G.; Tetzlaff, J.; Mulrow, C.; Gøtzsche, P.C.; Ioannidis, J.P.; Clarke, M.; Devereaux, P.J.; Kleijnen, J.; Moher, D. The PRISMA statement for reporting systematic reviews and meta-analyses of studies that evaluate health care interventions: Explanation and elaboration. J. Clin. Epidemiol. 2009, 62, e1–e34. [Google Scholar] [CrossRef] [Green Version]
- Kitchenham, B.; Brereton, O.P.; Budgen, D.; Turner, M.; Bailey, J.; Linkman, S. Systematic literature reviews in software engineering–a systematic literature review. Inf. Softw. Technol. 2009, 51, 7–15. [Google Scholar] [CrossRef]
- Friedman, N.P.; Miyake, A. The relations among inhibition and interference control functions: A latent-variable analysis. J. Exp. Psychol. Gen. 2004, 133, 101. [Google Scholar] [CrossRef] [Green Version]
- Posner, M.I.; DiGirolamo, G.J. Executive Attention: Conflict, Target Detection, and Cognitive Control. In The Attentive Brain; Parasuraman, R., Ed.; MIT Press: Boston, MA, USA, 1998; pp. 401–423. [Google Scholar]
- Traverso, L.; Fontana, M.; Usai, M.C.; Passolunghi, M.C. Response inhibition and interference suppression in individuals with down syndrome compared to typically developing children. Front. Psychol. 2018, 9, 660. [Google Scholar] [CrossRef] [Green Version]
- Eriksen, B.A.; Eriksen, C.W. Effects of noise letters upon the identification of a target letter in a nonsearch task. Percept. Psychophys. 1974, 16, 143–149. [Google Scholar] [CrossRef] [Green Version]
- Williams, B.R.; Ponesse, J.S.; Schachar, R.J.; Logan, G.D.; Tannock, R. Development of inhibitory control across the life span. Dev. Psychol. 1999, 35, 205. [Google Scholar] [CrossRef] [PubMed]
- Bunge, S.A.; Dudukovic, N.M.; Thomason, M.E.; Vaidya, C.J.; Gabrieli, J.D. Immature frontal lobe contributions to cognitive control in children: Evidence from fMRI. Neuron 2002, 33, 301–311. [Google Scholar] [CrossRef] [Green Version]
- Injoque-Ricle, I.; Calero, A.D.; Alloway, T.P.; Burin, D.I. Assessing working memory in Spanish-speaking children: Automated Working Memory Assessment battery adaptation. Learn. Individ. Differ. 2011, 21, 78–84. [Google Scholar] [CrossRef]
- Shah, P.; Miyake, A. The separability of working memory resources for spatial thinking and language processing: An individual differences approach. J. Exp. Psychol. Gen. 1996, 125, 4. [Google Scholar] [CrossRef]
- Owen, A.M.; McMillan, K.M.; Laird, A.R.; Bullmore, E. N-back working memory paradigm: A meta-analysis of normative functional neuroimaging studies. Hum. Brain Mapp. 2005, 25, 46–59. [Google Scholar] [CrossRef] [Green Version]
- Wang, P.P.; Bellugi, U. Evidence from two genetic syndromes for a dissociation between verbal and visual-spatial short-term memory. J. Clin. Exp. Neuropsychol. 1994, 16, 317–322. [Google Scholar] [CrossRef]
- Miles, S.; Howlett, C.A.; Berryman, C.; Nedeljkovic, M.; Moseley, G.L.; Phillipou, A. Considerations for using the Wisconsin Card Sorting Test to assess cognitive flexibility. Behav. Res. Methods 2021, 53, 2083–2091. [Google Scholar] [CrossRef]
- Thomas, B.; Ciliska, D.; Dobbins, M.; Micucci, S. A process for systematically reviewing the literature: Providing the research evidence for public health nursing interventions. Worldviews Evid.-Based Nurs. 2004, 1, 176–184. [Google Scholar] [CrossRef]
- Armijo-Olivo, S.; Stiles, C.R.; Hagen, N.A.; Biondo, P.D.; Cummings, G.G. Assessment of study quality for systematic reviews: A comparison of the Cochrane Collaboration Risk of Bias Tool and the Effective Public Health Practice Project Quality Assessment Tool: Methodological research. J. Eval. Clin. Pract. 2012, 18, 12–18. [Google Scholar] [CrossRef]
- Evans, N.; Lasen, M.; Tsey, K. Appendix A: Effective public health practice project (EPHPP) quality assessment tool for quantitative studies. In A Systematic Review of Rural Development Research; SpringerBriefs in Public Health: Cham, Switzerland, 2015; pp. 45–55. [Google Scholar]
- Perestelo-Pérez, L. Standards on how to develop and report systematic reviews in Psychology and Health. Int. J. Clin. Health Psychol. 2013, 13, 49–57. [Google Scholar] [CrossRef] [Green Version]
- Meyer, K.N.; Santillana, R.; Miller, B.; Clapp, W.; Way, M.; Bridgman-Goines, K.; Sheridan, M.A. Computer-based inhibitory control training in children with Attention-Deficit/Hyperactivity Disorder (ADHD): Evidence for behavioral and neural impact. PLoS ONE 2020, 15, e0241352. [Google Scholar] [CrossRef] [PubMed]
- Kaga, Y.; Ueda, R.; Tanaka, M.; Kita, Y.; Suzuki, K.; Okumura, Y.; Egashira, Y.; Shirakawa, Y.; Mitsuhashi, S.; Kitamura, Y.; et al. Executive dysfunction in medication-naïve children with ADHD: A multi-modal fNIRS and EEG study. Brain Dev. 2020, 42, 555–563. [Google Scholar] [CrossRef] [PubMed]
- Rajabi, S.; Pakize, A.; Moradi, N. Effect of combined neurofeedback and game-based cognitive training on the treatment of ADHD: A randomized controlled study. Appl. Neuropsychol. Child 2020, 9, 193–205. [Google Scholar] [CrossRef]
- Dobrakowski, P.; Łebecka, G. Individualized neurofeedback training may help achieve long-term improvement of working memory in children with ADHD. Clin. EEG Neurosci. 2020, 51, 94–101. [Google Scholar] [CrossRef]
- McAuliffe, D.; Hirabayashi, K.; Adamek, J.H.; Luo, Y.; Crocetti, D.; Pillai, A.S.; Zhao, Y.; Crone, N.E.; Mostofsky, S.H.; Ewen, J.B. Increased mirror overflow movements in ADHD are associated with altered EEG alpha/beta band desynchronization. Eur. J. Neurosci. 2020, 51, 1815–1826. [Google Scholar] [CrossRef]
- Ogrim, G.; Kropotov, J.D. Event related potentials (ERPs) and other EEG based methods for extracting biomarkers of brain dysfunction: Examples from pediatric attention deficit/hyperactivity disorder (ADHD). JoVE (J. Vis. Exp.) 2020, 12, e60710. [Google Scholar] [CrossRef]
- Lenartowicz, A.; Truong, H.; Salgari, G.C.; Bilder, R.M.; McGough, J.; McCracken, J.T.; Loo, S.K. Alpha modulation during working memory encoding predicts neurocognitive impairment in ADHD. J. Child Psychol. Psychiatry 2019, 60, 917–926. [Google Scholar] [CrossRef]
- Jarczok, T.A.; Haase, R.; Bluschke, A.; Thiemann, U.; Bender, S. Bereitschaftspotential and lateralized readiness potential in children with attention deficit hyperactivity disorder: Altered motor system activation and effects of methylphenidate. Eur. Neuropsychopharmacol. 2019, 29, 960–970. [Google Scholar] [CrossRef]
- Shephard, E.; Tye, C.; Ashwood, K.L.; Azadi, B.; Johnson, M.H.; Charman, T.; Asherson, P.; McLoughlin, G.; Bolton, P.F. Oscillatory neural networks underlying resting-state, attentional control and social cognition task conditions in children with ASD, ADHD and ASD+ ADHD. Cortex 2019, 117, 96–110. [Google Scholar] [CrossRef] [Green Version]
- Chmielewski, W.; Bluschke, A.; Bodmer, B.; Wolff, N.; Roessner, V.; Beste, C. Evidence for an altered architecture and a hierarchical modulation of inhibitory control processes in ADHD. Dev. Cogn. Neurosci. 2019, 36, 100623. [Google Scholar] [CrossRef] [PubMed]
- Altınkaynak, M.; Dolu, N.; Güven, A.; Pektaş, F.; Özmen, S.; Demirci, E.; İzzetoğlu, M. Diagnosis of attention deficit hyperactivity disorder with combined time and frequency features. Biocybern. Biomed. Eng. 2020, 40, 927–937. [Google Scholar] [CrossRef]
- Zamorano, F.; Kausel, L.; Albornoz, C.; Lavin, C.; Figueroa-Vargas, A.; Stecher, X.; Aragón-Caqueo, D.; Carrasco, X.; Aboitiz, F.; Billeke, P. Lateral prefrontal theta oscillations reflect proactive cognitive control impairment in males with attention deficit hyperactivity disorder. Front. Syst. Neurosci. 2020, 14, 37. [Google Scholar] [CrossRef] [PubMed]
- Heinrich, H.; Busch, K.; Studer, P.; Erbe, K.; Moll, G.H.; Kratz, O. Refining the picture of reduced alerting responses in ADHD–A single-trial analysis of event-related potentials. Neurosci. Lett. 2014, 582, 49–53. [Google Scholar] [CrossRef] [PubMed]
- Lim, C.G.; Lee, T.S.; Guan, C.; Fung, D.S.S.; Zhao, Y.; Teng, S.S.W.; Zhang, H.; Krishnan, K.R.R. A brain-computer interface based attention training program for treating attention deficit hyperactivity disorder. PLoS ONE 2012, 7, e46692. [Google Scholar] [CrossRef]
- Ellis, A.J.; Kinzel, C.; Salgari, G.C.; Loo, S.K. Frontal alpha asymmetry predicts inhibitory processing in youth with attention deficit/hyperactivity disorder. Neuropsychologia 2017, 102, 45–51. [Google Scholar] [CrossRef]
- Khoshnoud, S.; Shamsi, M.; Nazari, M.A.; Makeig, S. Different cortical source activation patterns in children with attention deficit hyperactivity disorder during a time reproduction task. J. Clin. Exp. Neuropsychol. 2018, 40, 633–649. [Google Scholar] [CrossRef]
- Bazanova, O.M.; Auer, T.; Sapina, E.A. On the efficiency of individualized theta/beta ratio neurofeedback combined with forehead EMG training in ADHD children. Front. Hum. Neurosci. 2018, 12, 3. [Google Scholar] [CrossRef] [Green Version]
- Chenxi, L.; Chen, Y.; Li, Y.; Wang, J.; Liu, T. Complexity analysis of brain activity in attention-deficit/hyperactivity disorder: A multiscale entropy analysis. Brain Res. Bull. 2016, 124, 12–20. [Google Scholar] [CrossRef]
- Janssen, T.W.; Bink, M.; Geladé, K.; van Mourik, R.; Maras, A.; Oosterlaan, J. A randomized controlled trial into the effects of neurofeedback, methylphenidate, and physical activity on EEG power spectra in children with ADHD. J. Child Psychol. Psychiatry 2016, 57, 633–644. [Google Scholar] [CrossRef] [Green Version]
- Bakhtadze, S.; Beridze, M.; Geladze, N.; Khachapuridze, N.; Bornstein, N. Effect of EEG biofeedback on cognitive flexibility in children with attention deficit hyperactivity disorder with and without epilepsy. Appl. Psychophysiol. Biofeedback 2016, 41, 71–79. [Google Scholar] [CrossRef]
- Zarafshan, H.; Khaleghi, A.; Mohammadi, M.R.; Moeini, M.; Malmir, N. Electroencephalogram complexity analysis in children with attention-deficit/hyperactivity disorder during a visual cognitive task. J. Clin. Exp. Neuropsychol. 2016, 38, 361–369. [Google Scholar] [CrossRef]
- Liao, Y.C.; Guo, N.W.; Lei, S.H.; Fang, J.H.; Chen, J.J.; Su, B.Y.; Chen, S.J.; Tsai, H.F. Electroencephalogram valid rate in simple reaction time task as an easy index of children’s attention functions. Pediatr. Int. 2015, 57, 930–935. [Google Scholar] [CrossRef]
- Israsena, P.; Hemrungrojn, S.; Sukwattanasinit, N.; Maes, M. Development and evaluation of an interactive electro-encephalogram-based neurofeedback system for training attention and attention defects in children. J. Med. Imaging Health Inform. 2015, 5, 1045–1052. [Google Scholar] [CrossRef]
- Sangal, R.B.; Sangal, J.M. Use of EEG beta-1 power and theta/beta ratio over Broca’s area to confirm diagnosis of attention deficit/hyperactivity disorder in children. Clin. EEG Neurosci. 2015, 46, 177–182. [Google Scholar] [CrossRef]
- Moreno-García, I.; Delgado-Pardo, G.; De Rey, C.C.V.; Meneres-Sancho, S.; Servera-Barceló, M. Neurofeedback, pharmacological treatment and behavioral therapy in hyperactivity: Multilevel analysis of treatment effects on electroencephalography. Int. J. Clin. Health Psychol. 2015, 15, 217–225. [Google Scholar] [CrossRef] [Green Version]
- Wang, Z. Neurofeedback training intervention for enhancing working memory function in attention deficit and hyperactivity disorder (ADHD) Chinese students. NeuroQuantology 2017, 15, 277–283. [Google Scholar] [CrossRef]
- Swartwood, J.N.; Swartwood, M.O.; Lubar, J.F.; Timmermann, D.L. EEG differences in ADHD-combined type during baseline and cognitive tasks. Pediatr. Neurol. 2003, 28, 199–204. [Google Scholar] [CrossRef]
- Silva, V.F.d.; Calomeni, M.R.; Borges, C.J.; Militão, A.G.; Freire, I.d.A.; Simões, K.M.; Arêas, N.T.; Silva, P.B.d.; Cabral, P.U.L.; Valentim-Silva, J.R. Children with ADHD shown different alpha, beta and SMR EEG bands during habil motor tasks with high attention demand. Rev. Bras. De Med. Do Esporte 2018, 24, 382–385. [Google Scholar]
- Fabio, R.A.; Tindara, C.; Nasrin, M.; Antonio, G.; Gagliano, A.; Gabriella, M. Frequency bands in seeing and remembering: Comparing ADHD and typically developing children. Neuropsychol. Trends 2018, 24, 97–116. [Google Scholar] [CrossRef] [Green Version]
- Abibullaev, B.; An, J. Decision support algorithm for diagnosis of ADHD using electroencephalograms. J. Med. Syst. 2012, 36, 2675–2688. [Google Scholar] [CrossRef]
- Nazari, M.A.; Wallois, F.; Aarabi, A.; Berquin, P. Dynamic changes in quantitative electroencephalogram during continuous performance test in children with attention-deficit/hyperactivity disorder. Int. J. Psychophysiol. 2011, 81, 230–236. [Google Scholar] [CrossRef]
- Yan, N.; Wang, J.; Liu, M.; Zong, L.; Jiao, Y.; Yue, J.; Lv, Y.; Yang, Q.; Lan, H.; Liu, Z. Designing a brain-computer interface device for neurofeedback using virtual environments. J. Med. Biol. Eng. 2008, 28, 167–172. [Google Scholar]
- Bakhtadze, S.; Dzhanelidze, M.; Khachapuridze, N. Changes in cognitive evoked potentials during non pharmacological treatment in children with attention deficit/hyperactivity disorder. Georgian Med. News 2011, 192, 47–56. [Google Scholar]
- Heinrich, H.; Busch, K.; Studer, P.; Erbe, K.; Moll, G.H.; Kratz, O. EEG spectral analysis of attention in ADHD: Implications for neurofeedback training? Front. Hum. Neurosci. 2014, 8, 611. [Google Scholar] [CrossRef]
- Escolano, C.; Navarro-Gil, M.; Garcia-Campayo, J.; Congedo, M.; Minguez, J. The effects of individual upper alpha neurofeedback in ADHD: An open-label pilot study. Appl. Psychophysiol. Biofeedback 2014, 39, 193–202. [Google Scholar] [CrossRef] [Green Version]
- Kerson, C.; Group, C.N. A proposed multisite double-blind randomized clinical trial of neurofeedback for ADHD: Need, rationale, and strategy. J. Atten. Disord. 2013, 17, 420–436. [Google Scholar] [CrossRef] [PubMed]
- Mazaheri, A.; Coffey-Corina, S.; Mangun, G.R.; Bekker, E.M.; Berry, A.S.; Corbett, B.A. Functional disconnection of frontal cortex and visual cortex in attention-deficit/hyperactivity disorder. Biol. Psychiatry 2010, 67, 617–623. [Google Scholar] [CrossRef]
- Bakhtadze, S.; Janelidze, M. Quantative EEG During Baseline and Various Cognitive Tasks in Children with Attention deficit/hyperactivity Disorder. Georgian Med. 2010, 186, 50. [Google Scholar]
- Halawa, I.F.; El Sayed, B.B.; Amin, O.R.; Meguid, N.A.; Kader, A.A.A. Frontal theta/beta ratio changes during TOVA in Egyptian ADHD children. Neurosci. J. 2017, 22, 287–291. [Google Scholar] [CrossRef] [Green Version]
- Kim, J.W.; Kim, B.N.; Lee, J.; Na, C.; Kee, B.S.; Min, K.J.; Han, D.H.; Kim, J.I.; Lee, Y.S. Desynchronization of theta-phase gamma-amplitude coupling during a mental arithmetic task in children with attention deficit/hyperactivity disorder. PLoS ONE 2016, 11, e0145288. [Google Scholar] [CrossRef] [PubMed]
- Marx, A.M.; Ehlis, A.C.; Furdea, A.; Holtmann, M.; Banaschewski, T.; Brandeis, D.; Rothenberger, A.; Gevensleben, H.; Freitag, C.M.; Fuchsenberger, Y.; et al. Near-infrared spectroscopy (NIRS) neurofeedback as a treatment for children with attention deficit hyperactivity disorder (ADHD)—A pilot study. Front. Hum. Neurosci. 2015, 8, 1038. [Google Scholar] [CrossRef] [PubMed] [Green Version]
- Kóbor, A.; Takács, Á.; Bryce, D.; Szűcs, D.; Honbolygó, F.; Nagy, P.; Csépe, V. Children with ADHD show impairments in multiple stages of information processing in a Stroop task: An ERP study. Dev. Neuropsychol. 2015, 40, 329–347. [Google Scholar] [CrossRef] [Green Version]
- Saville, C.W.; Feige, B.; Kluckert, C.; Bender, S.; Biscaldi, M.; Berger, A.; Fleischhaker, C.; Henighausen, K.; Klein, C. Increased reaction time variability in attention-deficit hyperactivity disorder as a response-related phenomenon: Evidence from single-trial event-related potentials. J. Child Psychol. Psychiatry 2015, 56, 801–813. [Google Scholar] [CrossRef] [PubMed]
- Liu, T.; Chen, Y.; Lin, P.; Wang, J. Small-world brain functional networks in children with attention-deficit/hyperactivity disorder revealed by EEG synchrony. Clin. EEG Neurosci. 2015, 46, 183–191. [Google Scholar] [CrossRef] [PubMed]
- Lenartowicz, A.; Delorme, A.; Walshaw, P.D.; Cho, A.L.; Bilder, R.M.; McGough, J.J.; McCracken, J.T.; Makeig, S.; Loo, S.K. Electroencephalography correlates of spatial working memory deficits in attention-deficit/hyperactivity disorder: Vigilance, encoding, and maintenance. J. Neurosci. 2014, 34, 1171–1182. [Google Scholar] [CrossRef]
- Liechti, M.D.; Maurizio, S.; Heinrich, H.; Jäncke, L.; Meier, L.; Steinhausen, H.C.; Walitza, S.; Drechsler, R.; Brandeis, D. First clinical trial of tomographic neurofeedback in attention-deficit/hyperactivity disorder: Evaluation of voluntary cortical control. Clin. Neurophysiol. 2012, 123, 1989–2005. [Google Scholar] [CrossRef]
- Nazari, M.; Berquin, P.; Missonnier, P.; Aarabi, A.; Debatisse, D.; De Broca, A.; Wallois, F. Visual sensory processing deficit in the occipital region in children with attention-deficit/hyperactivity disorder as revealed by event-related potentials during cued continuous performance test. Neurophysiol. Clin. Neurophysiol. 2010, 40, 137–149. [Google Scholar] [CrossRef]
- Gomarus, H.K.; Wijers, A.A.; Minderaa, R.B.; Althaus, M. Do children with ADHD and/or PDD-NOS differ in reactivity of alpha/theta ERD/ERS to manipulations of cognitive load and stimulus relevance? Clin. Neurophysiol. 2009, 120, 73–79. [Google Scholar] [CrossRef]
- Doehnert, M.; Brandeis, D.; Straub, M.; Steinhausen, H.C.; Drechsler, R. Slow cortical potential neurofeedback in attention deficit hyperactivity disorder: Is there neurophysiological evidence for specific effects? J. Neural Transm. 2008, 115, 1445–1456. [Google Scholar] [CrossRef]
- Okazaki, S.; Ozaki, H.; Maekawa, H.; Futakami, S. Longitudinal change of ERP during cued continuous performance test in child with attention-deficit/hyperactivity disorder. Int. Congr. Ser. 2004, 1270, 254–257. [Google Scholar] [CrossRef]
- Ortega, R.; López, V.; Carrasco, X.; Anllo-Vento, L.; Aboitiz, F. Exogenous orienting of visual-spatial attention in ADHD children. Brain Res. 2013, 1493, 68–79. [Google Scholar] [CrossRef] [PubMed]
- Mohammadi, M.R.; Khaleghi, A.; Nasrabadi, A.M.; Rafieivand, S.; Begol, M.; Zarafshan, H. EEG classification of ADHD and normal children using non-linear features and neural network. Biomed. Eng. Lett. 2016, 6, 66–73. [Google Scholar] [CrossRef]
- Moghaddari, M.; Lighvan, M.Z.; Danishvar, S. Diagnose ADHD disorder in children using convolutional neural network based on continuous mental task EEG. Comput. Methods Programs Biomed. 2020, 197, 105738. [Google Scholar] [CrossRef]
- Güven, A.; Altınkaynak, M.; Dolu, N.; İzzetoğlu, M.; Pektaş, F.; Özmen, S.; Demirci, E.; Batbat, T. Combining functional near-infrared spectroscopy and EEG measurements for the diagnosis of attention-deficit hyperactivity disorder. Neural Comput. Appl. 2020, 32, 8367–8380. [Google Scholar] [CrossRef]
- Aceves-Fernandez, M. Methodology proposal of ADHD classification of children based on cross recurrence plots. Nonlinear Dyn. 2021, 104, 1491–1505. [Google Scholar] [CrossRef]
- Patrick, G.J. Improved neuronal regulation in ADHD: An application of 15 sessions of photic-driven EEG neurotherapy. J. Neurother. 1996, 1, 27–36. [Google Scholar] [CrossRef] [Green Version]
- Kuperman, S.; Johnson, B.; Arndt, S.; Lindgren, S.; Wolraich, M. Quantitative EEG differences in a nonclinical sample of children with ADHD and undifferentiated ADD. J. Am. Acad. Child Adolesc. Psychiatry 1996, 35, 1009–1017. [Google Scholar] [CrossRef]
- Brandeis, D.; van Leeuwen, T.H.; Rubia, K.; Vitacco, D.; Steger, J.; Pascual-Marqui, R.D.; Steinhausen, H.C. Neuroelectric mapping reveals precursor of stop failures in children with attention deficits. Behav. Brain Res. 1998, 94, 111–125. [Google Scholar] [CrossRef]
- Cox, D.J.; Kovatchev, B.P.; Morris, J.B.; Phillips, C.; Hill, R.J.; Merkel, L. Electroencephalographic and psychometric differences between boys with and without Attention-Deficit/Hyperactivity Disorder (ADHD): A pilot study. Appl. Psychophysiol. Biofeedback 1998, 23, 179–188. [Google Scholar] [CrossRef]
- Joyce, M.; Siever, D. Audio-visual entrainment program as a treatment for behavior disorders in a school setting. J. Neurother. 2000, 4, 9–25. [Google Scholar] [CrossRef] [Green Version]
- Carmody, D.P.; Radvanski, D.C.; Wadhwani, S.; Sabo, M.J.; Vergara, L. EEG biofeedback training and attention-deficit/ hyperactivity disorder in an elementary school setting. J. Neurother. 2000, 4, 5–27. [Google Scholar] [CrossRef] [Green Version]
- Kovatchev, B.; Cox, D.; Hill, R.; Reeve, R.; Robeva, R.; Loboschefski, T. A psychophysiological marker of attention deficit/ hyperactivity disorder (ADHD)—Defining the EEG consistency index. Appl. Psychophysiol. Biofeedback 2001, 26, 127–140. [Google Scholar] [CrossRef] [PubMed]
- McGough, J.J.; McCracken, J.T.; Cho, A.L.; Castelo, E.; Sturm, A.; Cowen, J.; Piacentini, J.; Loo, S.K. A potential electroencephalography and cognitive biosignature for the child behavior checklist–dysregulation profile. J. Am. Acad. Child Adolesc. Psychiatry 2013, 52, 1173–1182. [Google Scholar] [CrossRef] [Green Version]
- Kim, S.K.; Yoo, E.Y.; Lee, J.S.; Jung, M.Y.; Park, S.H.; Park, J.H. The effects of neurofeedback training on concentration in children with attention deficit/hyperactivity disorder. Int. J. Bio-Sci. Bio-Technol. 2014, 6, 13–24. [Google Scholar] [CrossRef]
- Baijot, S.; Cevallos, C.; Zarka, D.; Leroy, A.; Slama, H.; Colin, C.; Deconinck, N.; Dan, B.; Cheron, G. EEG dynamics of a go/nogo task in children with ADHD. Brain Sci. 2017, 7, 167. [Google Scholar] [CrossRef] [Green Version]
- Buyck, I.; Wiersema, J.R. Electroencephalographic activity before and after cognitive effort in children with attention deficit/hyperactivity disorder. Clin. EEG Neurosci. 2015, 46, 88–93. [Google Scholar] [CrossRef]
- Lim, C.G.; Poh, X.W.W.; Fung, S.S.D.; Guan, C.; Bautista, D.; Cheung, Y.B.; Zhang, H.; Yeo, S.N.; Krishnan, R.; Lee, T.S. A randomized controlled trial of a brain-computer interface based attention training program for ADHD. PLoS ONE 2019, 14, e0216225. [Google Scholar] [CrossRef] [Green Version]
- Buchmann, J.; Gierow, W.; Reis, O.; Haessler, F. Intelligence moderates impulsivity and attention in ADHD children: An ERP study using a go/nogo paradigm. World J. Biol. Psychiatry 2011, 12, 35–39. [Google Scholar] [CrossRef]
- D’Agati, E.; Hoegl, T.; Dippel, G.; Curatolo, P.; Bender, S.; Kratz, O.; Moll, G.H.; Heinrich, H. Motor cortical inhibition in ADHD: Modulation of the transcranial magnetic stimulation-evoked N100 in a response control task. J. Neural Transm. 2014, 121, 315–325. [Google Scholar] [CrossRef]
- Gomarus, H.K.; Wijers, A.A.; Minderaa, R.B.; Althaus, M. ERP correlates of selective attention and working memory capacities in children with ADHD and/or PDD-NOS. Clin. Neurophysiol. 2009, 120, 60–72. [Google Scholar] [CrossRef] [PubMed]
- Groen, Y.; Wijers, A.A.; Mulder, L.J.; Waggeveld, B.; Minderaa, R.B.; Althaus, M. Error and feedback processing in children with ADHD and children with Autistic Spectrum Disorder: An EEG event-related potential study. Clin. Neurophysiol. 2008, 119, 2476–2493. [Google Scholar] [CrossRef] [PubMed] [Green Version]
- Kropotov, J.D.; Grin-Yatsenko, V.A.; Ponomarev, V.A.; Chutko, L.S.; Yakovenko, E.A.; Nikishena, I.S. Changes in EEG spectrograms, event-related potentials and event-related desynchronization induced by relative beta training in ADHD children. J. Neurother. 2007, 11, 3–11. [Google Scholar] [CrossRef] [Green Version]
- Murias, M.; Swanson, J.M.; Srinivasan, R. Functional connectivity of frontal cortex in healthy and ADHD children reflected in EEG coherence. Cereb. Cortex 2007, 17, 1788–1799. [Google Scholar] [CrossRef] [Green Version]
- Fleischman, M.J.; Othmer, S. Case study: Improvements in IQ score and maintenance of gains following EEG biofeedback with mildly developmentally delayed twins. J. Neurother. 2006, 9, 35–46. [Google Scholar] [CrossRef] [Green Version]
- Xiong, Z.; Shi, S.; Xu, H. A Controlled study of the effectiveness of EEG biofeedback training on children with attention deficit hyperactivity disorder. J. Huazhong Univ. Sci. Technol. Med. Sci. 2005, 25, 368–370. [Google Scholar] [CrossRef]
- Kropotov, J.D.; Grin-Yatsenko, V.A.; Ponomarev, V.A.; Chutko, L.S.; Yakovenko, E.A.; Nikishena, I.S. ERPs correlates of EEG relative beta training in ADHD children. Int. J. Psychophysiol. 2005, 55, 23–34. [Google Scholar] [CrossRef]
- Brown, C.R.; Clarke, A.R.; Barry, R.J.; McCarthy, R.; Selikowitz, M.; Magee, C. Event-related potentials in attention-deficit/hyperactivity disorder of the predominantly inattentive type: An investigation of EEG-defined subtypes. Int. J. Psychophysiol. 2005, 58, 94–107. [Google Scholar] [CrossRef]
- Vollebregt, M.A.; Zumer, J.M.; Ter Huurne, N.; Castricum, J.; Buitelaar, J.K.; Jensen, O. Lateralized modulation of posterior alpha oscillations in children. NeuroImage 2015, 123, 245–252. [Google Scholar] [CrossRef]
- Vollebregt, M.A.; Zumer, J.M.; Ter Huurne, N.; Buitelaar, J.K.; Jensen, O. Posterior alpha oscillations reflect attentional problems in boys with attention deficit hyperactivity disorder. Clin. Neurophysiol. 2016, 127, 2182–2191. [Google Scholar] [CrossRef] [Green Version]
- Bluschke, A.; Mückschel, M.; Roessner, V.; Beste, C. Intact Stimulus–Response Conflict Processing in ADHD—Multilevel Evidence and Theoretical Implications. J. Clin. Med. 2020, 9, 234. [Google Scholar] [CrossRef] [PubMed] [Green Version]
- DeFrance, J.; Smith, S.; Schweitzer, F.; Ginsberg, L.; Sands, S. Topographical analyses of attention disorders of childhood. Int. J. Neurosci. 1996, 87, 41–61. [Google Scholar] [CrossRef] [PubMed]
- Johnstone, S.J.; Watt, A.J.; Dimoska, A. Varying required effort during interference control in children with AD/HD: Task performance and ERPs. Int. J. Psychophysiol. 2010, 76, 174–185. [Google Scholar] [CrossRef]
- Johnstone, S.J.; Barry, R.J.; Markovska, V.; Dimoska, A.; Clarke, A.R. Response inhibition and interference control in children with AD/HD: A visual ERP investigation. Int. J. Psychophysiol. 2009, 72, 145–153. [Google Scholar] [CrossRef] [PubMed]
- Bluschke, A.; Friedrich, J.; Schreiter, M.L.; Roessner, V.; Beste, C. A comparative study on the neurophysiological mechanisms underlying effects of methylphenidate and neurofeedback on inhibitory control in attention deficit hyperactivity disorder. NeuroImage: Clin. 2018, 20, 1191–1203. [Google Scholar] [CrossRef] [PubMed]
- Johnstone, S.J.; Roodenrys, S.; Phillips, E.; Watt, A.J.; Mantz, S. A pilot study of combined working memory and inhibition training for children with AD/HD. ADHD Atten. Deficit Hyperact. Disord. 2010, 2, 31–42. [Google Scholar] [CrossRef]
- Guo, J.; Luo, X.; Wang, E.; Li, B.; Chang, Q.; Sun, L.; Song, Y. Abnormal alpha modulation in response to human eye gaze predicts inattention severity in children with ADHD. Dev. Cogn. Neurosci. 2019, 38, 100671. [Google Scholar] [CrossRef]
- Johnstone, S.J.; Parrish, L.; Jiang, H.; Zhang, D.W.; Williams, V.; Li, S. Aiding diagnosis of childhood attention-deficit/hyperactivity disorder of the inattentive presentation: Discriminant function analysis of multi-domain measures including EEG. Biol. Psychol. 2021, 161, 108080. [Google Scholar] [CrossRef]
- Johnstone, S.J.; Barry, R.J.; Clarke, A.R. Behavioural and ERP indices of response inhibition during a Stop-signal task in children with two subtypes of Attention-Deficit Hyperactivity Disorder. Int. J. Psychophysiol. 2007, 66, 37–47. [Google Scholar] [CrossRef]
- Sushmitha, S.; Devi, B.T.; Mahesh, V.; Geethanjali, B.; Kumar, K.A.; Pavithran, P. Virtual Reality Therapy in Prolonging Attention Spans for ADHD. In Advances in Biomedical Engineering and Technology; Springer: Singapore, 2021; pp. 391–400. [Google Scholar]
- Soysal, Ö.M.; Kiran, F.; Chen, J. Quantifying Brain Activity State: EEG analysis of Background Music in A Serious Game on Attention of Children. In Proceedings of the 2020 4th International Symposium on Multidisciplinary Studies and Innovative Technologies (ISMSIT), Istanbul, Turkey, 22–24 October 2020; pp. 1–7. [Google Scholar]
- Khoshnoud, S.; Nazari, M.A.; Shamsi, M. Source-based Multifractal Detrended Fluctuation Analysis for Discrimination of ADHD Children in a Time Reproduction Paradigm. In Proceedings of the BIOSIGNALS, Valletta, Malta, 24–26 February 2020; pp. 38–48. [Google Scholar]
- Tan, Y.; Zhu, D.; Gao, H.; Lin, T.W.; Wu, H.K.; Yeh, S.C.; Hsu, T.Y. Virtual classroom: An ADHD assessment and diagnosis system based on virtual reality. In Proceedings of the 2019 IEEE International Conference on Industrial Cyber Physical Systems (ICPS), Taipei, Taiwan, 6–9 May 2019; pp. 203–208. [Google Scholar]
- Mercado-Aguirre, I.M.; Gutiérrez-Ruiz, K.; Contreras-Ortiz, S.H. Acquisition and analysis of cognitive evoked potentials using an emotiv headset for ADHD evaluation in children. In Proceedings of the 2019 XXII Symposium on Image, Signal Processing and Artificial Vision (STSIVA), Bucaramanga, Colombia, 24–26 April 2019; pp. 1–5. [Google Scholar]
- Fahimi, F.; Guan, C.; Goh, W.B.; Ang, K.K.; Lim, C.G.; Lee, T.S. Personalized features for attention detection in children with attention deficit hyperactivity disorder. In Proceedings of the 2017 39th Annual International Conference of the IEEE Engineering in Medicine and Biology Society (EMBC), Jeju, Korea, 11–15 July 2017; pp. 414–417. [Google Scholar]
- Gabriel, R.; Spindola, M.M.; Mesquita, A.; Neto, A.Z. Identification of ADHD Cognitive Pattern Disturbances Using EEG and Wavelets Analysis. In Proceedings of the 2017 IEEE 17th International Conference on Bioinformatics and Bioengineering (BIBE), Washington, DC, USA, 23–25 October 2017; pp. 157–162. [Google Scholar]
- Chen, C.L.; Tang, Y.W.; Zhang, N.Q.; Shin, J. Neurofeedback based attention training for children with ADHD. In Proceedings of the 2017 IEEE 8th International Conference on Awareness Science and Technology (iCAST), Taichung, Taiwan, 8–10 November 2017; pp. 93–97. [Google Scholar]
- Blandón, D.Z.; Muñoz, J.E.; Lopez, D.S.; Gallo, O.H. Influence of a BCI neurofeedback videogame in children with ADHD. Quantifying the brain activity through an EEG signal processing dedicated toolbox. In Proceedings of the 2016 IEEE 11th Colombian Computing Conference (CCC), Popayan, Colombia, 27–30 September 2016; pp. 1–8. [Google Scholar]
- Liu, T.; Wang, J.; Chen, Y.; Wang, R.; Song, M. Neurofeedback treatment experimental study for adhd by using the brain-computer interface neurofeedback system. In Proceedings of the World Congress on Medical Physics and Biomedical Engineering, Beijing, China, 26–31 May 2012; Springer: Berlin/Heidelberg, Germany, 2013; pp. 1537–1540. [Google Scholar]
- Lee, S.H.; Abibullaev, B.; Kang, W.S.; Shin, Y.; An, J. Analysis of attention deficit hyperactivity disorder in EEG using wavelet transform and self organizing maps. In Proceedings of the ICCAS 2010, Gyeonggi-do, Korea, 27–30 October 2010; pp. 2439–2442. [Google Scholar]
- Marcano, J.L.L.; Bell, M.A.; Beex, A.L. Classification of ADHD and non-ADHD using AR models. In Proceedings of the 2016 38th Annual International Conference of the IEEE Engineering in Medicine and Biology Society (EMBC), Orlando, FL, USA, 16–20 August 2016; pp. 363–366. [Google Scholar]
- Vahid, A.; Bluschke, A.; Roessner, V.; Stober, S.; Beste, C. Deep learning based on event-related EEG differentiates children with ADHD from healthy controls. J. Clin. Med. 2019, 8, 1055. [Google Scholar] [CrossRef] [Green Version]
- Costa, M.; Goldberger, A.L.; Peng, C.K. Multiscale entropy analysis of biological signals. Phys. Rev. E 2005, 71, 021906. [Google Scholar] [CrossRef] [PubMed] [Green Version]
- Fernández, A.; López-Ibor, M.I.; Turrero, A.; Santos, J.M.; Morón, M.D.; Hornero, R.; Gómez, C.; Méndez, M.A.; Ortiz, T.; López-Ibor, J.J. Lempel–Ziv complexity in schizophrenia: A MEG study. Clin. Neurophysiol. 2011, 122, 2227–2235. [Google Scholar] [CrossRef] [PubMed] [Green Version]
- Hu, J.; Gao, J.; Principe, J.C. Analysis of biomedical signals by the Lempel-Ziv complexity: The effect of finite data size. IEEE Trans. Biomed. Eng. 2006, 53, 2606–2609. [Google Scholar] [PubMed]


| Basic Executive Function | Sub-Executive Function | Main Related Test |
|---|---|---|
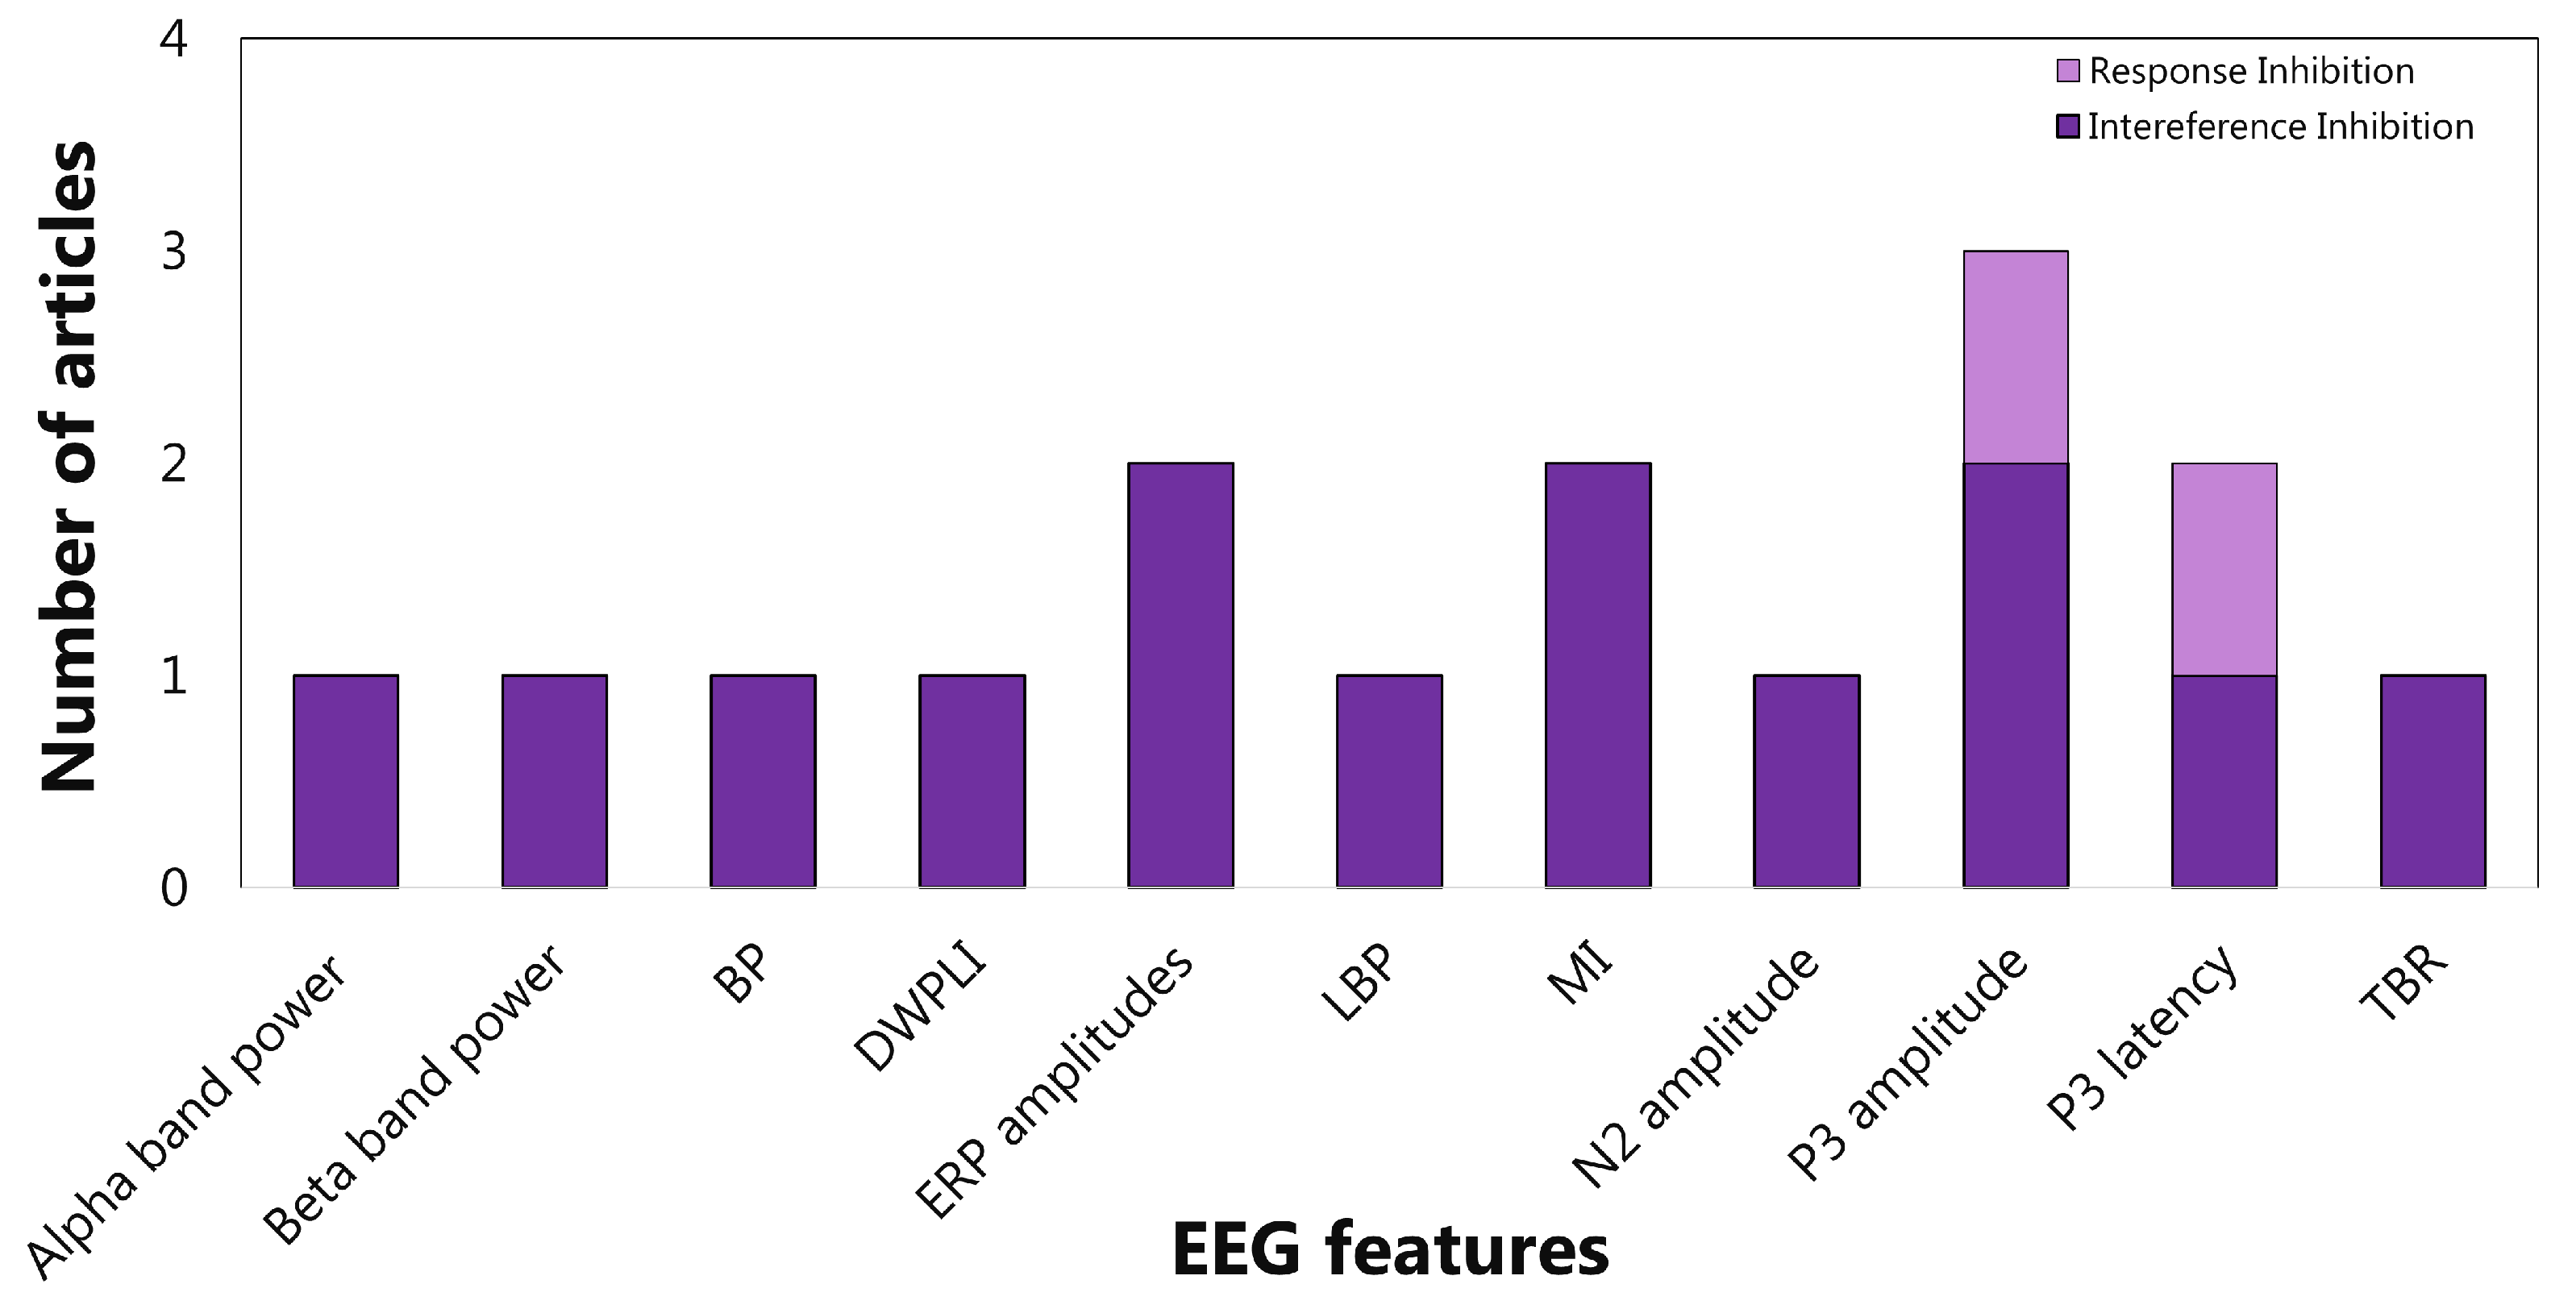
| Inhibition | Response Inhibition | Go/No Go Task [24] |
| Interference Inhibition | Flanker Test [26] | |
| Cognitive Flexibility | - | Wisconsin Card Sorting Task [31] |
| Working Memory | Verbal Working Memory | N-Back Task [29] |
| Visual Spatial Working Memory | Corsi Block Test [30] |
| Articles | Authors | Executive Functions | EEG-Features | Quality Assessment | FWCI |
|---|---|---|---|---|---|
| Computer-based inhibitory control training in children with Attention-Deficit/Hyperactivity Disorder (ADHD): evidence for behavioral and neural impact [36] | Meyer, K.N.; Santillana, R.; Miller, B.; Clapp, W.; Way, M.; Bridgman-Goines, K.; Sheridan, M.A. | inhibition | ERP-N2 | Global QATQS Rating: moderate (score = 1.67); No additional bio-markers; N = 40 | 0.41 |
| Executive dysfunction in medication-naïve children with ADHD: a multi-modal fNIRS and EEG study [37] | Kaga, Y.; Ueda, R.; Tanaka, M.; Kita, Y.; Suzuki, K.; Okumura, Y.; Egashira, Y.; Shirakawa, Y.; Mitsuhashi, S.; Kitamura, Y.; et al. | inhibition | ERP-N2, ERP-P3 | Global QATQS Rating: moderate (score = 1.60); Additional bio-markers; N = 20 | 0.93 |
| Effect of combined neurofeedback and game-based cognitive training on the treatment of ADHD: a randomized controlled study [38] | Rajabi, S.; Pakize, A.; Moradi, N. | working memory | PSD-TBR, PSD-SMR | Global QATQS Rating: strong (score = 1.67); No additional bio-markers; N = 32 | 0.58 |
| Individualized neurofeedback training may help achieve long-term improvement of working memory in children with ADHD [39] | Dobrakowski, P.; Łebecka, G. | working memory | PSD-Beta, PSD-Theta | Global QATQS Rating: strong (score = 1.83); No additional bio-markers; N = 48 | 4.17 |
| Increased mirror overflow movements in ADHD are associated with altered EEG alpha/beta band desynchronization [40] | McAuliffe, D.; Hirabayashi, K.; Adamek, J.H.; Luo, Y.; Crocetti, D.; Pillai, A.S.; Zhao, Y.; Crone, N.E.; Mostofsky, S.H.; Ewen, J.B. | inhibition | PSD-Alpha, PSD-Beta | Global QATQS Rating: strong (score = 2.00); No additional bio-markers; N = 50 | 0.77 |
| Event-related potentials (ERPs) and other EEG based methods for extracting biomarkers of brain dysfunction: examples from pediatric attention deficit/hyperactivity disorder (ADHD) [41] | Ogrim, G.; Kropotov, J.D. | inhibition | ERP | Global QATQS Rating: strong (score = 2.20); No additional bio-markers; N = 128 | 0.00 |
| Alpha modulation during working memory encoding predicts neurocognitive impairment in ADHD [42] | Lenartowicz, A.; Truong, H.; Salgari, G.C.; Bilder, R.M.; McGough, J.; McCracken, J.T.; Loo, S.K. | working memory | PSD-alpha, PSD-Theta, ERP-P2 | Global QATQS Rating: moderate (score = 1.40); No additional bio-markers; N = 119 | 2.24 |
| Bereitschaftspotential and lateralized readiness potential in children with attention deficit hyperactivity disorder: altered motor system activation and effects of methylphenidate [43] | Jarczok, T.A.; Haase, R.; Bluschke, A.; Thiemann, U.; Bender, S. | inhibition | LRP, BP | Global QATQS Rating: moderate (score = 1.67); Additional bio-markers; N = 33 | 0.55 |
| Oscillatory neural networks underlying resting-state, attentional control and social cognition task conditions in children with ASD, ADHD and ASD+ ADHD [44] | Shephard, E.; Tye, C.; Ashwood, K.L.; Azadi, B.; Johnson, M.H.; Charman, T.; Asherson, P.; McLoughlin, G.; Bolton, P.F. | inhibition, working memory | CNV | Global QATQS Rating: moderate (score = 1.40); No additional bio-markers; N = 92 | 0.41 |
| Evidence for an altered architecture and a hierarchical modulation of inhibitory control processes in ADHD [45] | Chmielewski, W.; Bluschke, A.; Bodmer, B.; Wolff, N.; Roessner, V.; Beste, C. | inhibition | ERP-P3, ERP-N2 | Global QATQS Rating: moderate (score = 1.40); Additional bio-markers; N = 50 | 0.80 |
| Diagnosis of attention deficit hyperactivity disorder with combined time and frequency features [46] | Altınkaynak, M.; Dolu, N.; Güven, A.; Pektaş, F.; Özmen, S.; Demirci, E.; İzzetoğlu, M. | inhibition | ERP-P3 | Global QATQS Rating: moderate (score = 1.80); Additional bio-markers; N = 46 | 0.76 |
| Lateral prefrontal theta oscillations reflect proactive cognitive control impairment in males with attention deficit hyperactivity disorder [47] | Zamorano, F.; Kausel, L.; Albornoz, C.; Lavin, C.; Figueroa-Vargas, A.; Stecher, X.; Aragón-Caqueo, D.; Carrasco, X.; Aboitiz, F.; Billeke, P. | inhibition | ERP-P3 | Global QATQS Rating: strong (score = 2.00); No additional bio-markers; N = 54 | 0.42 |
| Refining the picture of reduced alerting responses in ADHD–A single-trial analysis of event-related potentials [48] | Heinrich, H.; Busch, K.; Studer, P.; Erbe, K.; Moll, G.H.; Kratz, O. | inhibition | ERP-P3 | Global QATQS Rating: strong (score = 2.20); No additional bio-markers; N = 43 | 0.21 |
| A brain–computer interface based attention training program for treating attention deficit hyperactivity disorder [49] | Lim, C.G.; Lee, T.S.; Guan, C.; Fung, D.S.S.; Zhao, Y.; Teng, S.S.W.; Zhang, H.; Krishnan, K.R.R. | inhibition | PSD-sum of all bands | Global QATQS Rating: strong (score = 1.80); No additional bio-markers; N = 20 | 1.21 |
| Frontal alpha asymmetry predicts inhibitory processing in youth with attention deficit/hyperactivity disorder [50] | Ellis, A.J.; Kinzel, C.; Salgari, G.C.; Loo, S.K. | inhibition | ERP | Global QATQS Rating: moderate (score = 1.80); No additional bio-markers; N = 50 | 0.58 |
| Different cortical source activation patterns in children with attention deficit hyperactivity disorder during a time reproduction task [51] | Khoshnoud, S.; Shamsi, M.; Nazari, M.A.; Makeig, S. | working memory, inhibition | CNV, ERP-P3, ERP-P5 | Global QATQS Rating: strong (score = 2.00); No additional bio-markers; N = 34 | 1.21 |
| On the efficiency of individualized theta/beta ratio neurofeedback combined with forehead EMG training in ADHD children [52] | Bazanova, O.M.; Auer, T.; Sapina, E.A. | inhibition | PSD-beta, PSD-theta | Global QATQS Rating: strong (score = 2.00); Additional bio-markers; N = 117 | 1.64 |
| Complexity analysis of brain activity in attention-deficit/hyperactivity disorder: a multiscale entropy analysis [53] | Chenxi, L.; Chen, Y.; Li, Y.; Wang, J.; Liu, T. | inhibition | PSD-beta, PSD-theta, PSD-alpha, PSD-beta, PSD-delta, MSE | Global QATQS Rating: strong (score = 2.40); No additional bio-markers; N = 26 | 0.78 |
| A randomized controlled trial into the effects of neurofeedback, methylphenidate, and physical activity on EEG power spectra in children with ADHD [54] | Janssen, T.W.; Bink, M.; Geladé, K.; van Mourik, R.; Maras, A.; Oosterlaan, J. | inhibition | PSD-TBR | Global QATQS Rating: moderate (score = 1.67); No additional bio-markers; N = 112 | 2.75 |
| Effect of EEG biofeedback on cognitive flexibility in children with attention deficit hyperactivity disorder with and without epilepsy [55] | Bakhtadze, S.; Beridze, M.; Geladze, N.; Khachapuridze, N.; Bornstein, N. | flexibility | PSD-SMR, PSD-beta, PSD-gamma | Global QATQS Rating: strong (score = 2.17); No additional bio-markers; N = 69 | 0.76 |
| Electroencephalogram complexity analysis in children with attention-deficit/hyperactivity disorder during a visual cognitive task [56] | Zarafshan, H.; Khaleghi, A.; Mohammadi, M.R.; Moeini, M.; Malmir, N. | working memory | LZC | Global QATQS Rating: strong (score = 2.20); No additional bio-markers; N = 64 | 0.58 |
| Electroencephalogram valid rate in simple reaction time task as an easy index of children’s attention functions [57] | Liao, Y.C.; Guo, N.W.; Lei, S.H.; Fang, J.H.; Chen, J.J.; Su, B.Y.; Chen, S.J.; Tsai, H.F. | inhibition | EEGVR | Global QATQS Rating: strong (score = 2.20); No additional bio-markers; N = 50 | 0.17 |
| Development and evaluation of an interactive electroencephalogram-based neurofeedback system for training attention and attention defects in children [58] | Israsena, P.; Hemrungrojn, S.; Sukwattanasinit, N.; Maes, M. | reasoning | PSD-beta/a, lpha ratio | Global QATQS Rating: strong (score = 2.60); No additional bio-markers; N = 28 | 0.11 |
| Use of EEG beta-1 power and theta/beta ratio over Broca’s area to confirm diagnosis of attention deficit/hyperactivity disorder in children [59] | Sangal, R.B.; Sangal, J.M. | inhibition | PSD-beta, PSD-theta, PSD-TBR | Global QATQS Rating: strong (score = 1.83); No additional bio-markers; N = 86 | 0.68 |
| Neurofeedback, pharmacological treatment and behavioral therapy in hyperactivity: multilevel analysis of treatment effects on electroencephalography [60] | Moreno-García, I.; Delgado-Pardo, G.; De Rey, C.C.V.; Meneres-Sancho, S.; Servera-Barceló, M. | inhibition. working memory | PSD-beta, PSD-theta | Global QATQS Rating: strong (score = 2.00); No additional bio-markers; N = 57 | 1.06 |
| Neurofeedback training intervention for enhancing working memory function in attention deficit and hyperactivity disorder (ADHD) Chinese students [61] | Wang, Z. | working memory | PSD-alpha | Global QATQS Rating: strong (score = 2.33); No additional bio-markers; N = 24 | 0.77 |
| EEG differences in ADHD-combined type during baseline and cognitive tasks [62] | Swartwood, J.N.; Swartwood, M.O.; Lubar, J.F.; Timmermann, D.L. | working memory, inhibition, planning, problem solving | PSD-beta, PSD-alpha, PSD-theta, PSD-delta | Global QATQS Rating: strong (score = 2.33); No additional bio-markers; N = 56 | 0.39 |
| Children with ADHD shown different alpha, beta and SMR EEG bands during habil motor tasks with high attention demand [63] | Silva, V.F.d.; Calomeni, M.R.; Borges, C.J.; Militão, A.G.; Freire, I.d.A.; Simões, K.M.; Arêas, N.T.; Silva, P.B.d.; Cabral, P.U.L.; Valentim-Silva, J.R. | flexibility | PSD-beta, PSD-alpha, PSD-SMR | Global QATQS Rating: strong (score = 2.67); No additional bio-markers; N = 14 | 0.00 |
| Frequency bands in seeing and remembering: comparing ADHD and typically developing children [64] | Fabio, R.A.; Tindara, C.; Nasrin, M.; Antonio, G.; Gagliano, A.; Gabriella, M. | working memory | PSD-beta, PSD-alpha, PSD-theta | Global QATQS Rating: strong (score = 2.20); Additional bio-markers; N = 46 | 3.25 |
| Decision support algorithm for diagnosis of ADHD using electroencephalograms [65] | Abibullaev, B.; An, J. | working memory | PSD-alpha, PSD-theta, PSD-theta, PSD-theta/alpha ratio, PSD-TBR, PSD-relative delta, PSD-relative beta | Global QATQS Rating: strong (score = 2.40); No additional bio-markers; N = 10 | 0.89 |
| Dynamic changes in quantitative electroencephalogram during continuous performance test in children with attention-deficit/hyperactivity disorder [66] | Nazari, M.A.; Wallois, F.; Aarabi, A.; Berquin, P. | working memory | PSD-relative beta, PSD-relative alpha, PSD-relative theta, PSD-relative delta, PSD-relative TBR | Global QATQS Rating: strong (score = 2.17); No additional bio-markers; N = 32 | 1.26 |
| Designing a brain-computer interface device for neurofeedback using virtual environments [67] | Yan, N.; Wang, J.; Liu, M.; Zong, L.; Jiao, Y.; Yue, J.; Lv, Y.; Yang, Q.; Lan, H.; Liu, Z. | working memory | PSD-relative TBR, PSD-relative SMR | Global QATQS Rating: strong (score = 3.00); No additional bio-markers; N = 12 | 0.27 |
| Changes in cognitive evoked potentials during non pharmacological treatment in children with attention deficit/hyperactivity disorder [68] | Bakhtadze, S.; Dzhanelidze, M.; Khachapuridze, N. | inhibition | PSD-relative TBR, PSD-relative SMR, PSD-alpha | Global QATQS Rating: strong (score = 2.33); No additional bio-markers; N = 93 | 0.51 |
| EEG spectral analysis of attention in ADHD: implications for neurofeedback training? [69] | Heinrich, H.; Busch, K.; Studer, P.; Erbe, K.; Moll, G.H.; Kratz, O. | inhibition | PSD-alpha, PSD-beta, PSD-theta | Global QATQS Rating: strong (score = 2.17); No additional bio-markers; N = 43 | 1.79 |
| The effects of individual upper alpha neurofeedback in ADHD: an open-label pilot study [70] | Escolano, C.; Navarro-Gil, M.; Garcia-Campayo, J.; Congedo, M.; Minguez, J. | inhibition | PSD-alpha | Global QATQS Rating: strong (score = 2.50); No additional bio-markers; N = 17 | 1.20 |
| A proposed multisite double-blind randomized clinical trial of neurofeedback for ADHD: need, rationale, and strategy [71] | Kerson, C.; Group, C.N. | inhibition, working memory | PSD-TBR | Global QATQS Rating: strong (score = 2.33); No additional bio-markers; N = 180 | 2.41 |
| Functional disconnection of frontal cortex and visual cortex in attention-deficit/hyperactivity disorder [72] | Mazaheri, A.; Coffey-Corina, S.; Mangun, G.R.; Bekker, E.M.; Berry, A.S.; Corbett, B.A. | inhibition | PSD-alpha, PSD- theta | Global QATQS Rating: strong (score = 2.50); No additional bio-markers; N = 25 | 2.29 |
| Quantative EEG during baseline and various cognitive tasks in children with attention deficit/hyperactivity disorder [73] | Bakhtadze, S.; Janelidze, M. | inhibition, working memory | PSD-alpha, PSD-delta | Global QATQS Rating: strong (score = 2.33); No additional bio-markers; N = 32 | 0.26 |
| Frontal theta/beta ratio changes during TOVA in Egyptian ADHD children [74]. | Halawa, I.F.; El Sayed, B.B.; Amin, O.R.; Meguid, N.A.; Kader, A.A.A. | inhibition | PSD-TBR | Global QATQS Rating: strong (score = 2.20); No additional bio-markers; N = 104 | 0.21 |
| Desynchronization of theta-phase gamma-amplitude coupling during a mental arithmetic task in children with attention deficit/hyperactivity disorder [75] | Kim, J.W.; Kim, B.N.; Lee, J.; Na, C.; Kee, B.S.; Min, K.J.; Han, D.H.; Kim, J.I.; Lee, Y.S. | working memory | PSD-alpha-PSD-delta, PSD- theta, PSD- synchronization index (SI))-theta-gamma | Global QATQS Rating: strong (score = 1.80); No additional bio-markers; N = 97 | 0.66 |
| Near-infrared spectroscopy (NIRS) neurofeedback as a treatment for children with attention deficit hyperactivity disorder (ADHD)—a pilot study [76] | Marx, A.M.; Ehlis, A.C.; Furdea, A.; Holtmann, M.; Banaschewski, T.; Brandeis, D.; Rothenberger, A.; Gevensleben, H.; Freitag, C.M.; Fuchsenberger, Y.; et al. | inhibition, flexibility | SCP | Global QATQS Rating: strong (score = 2.17); Additional bio-markers; N = 27 | 2.73 |
| Children with ADHD show impairments in multiple stages of information processing in a Stroop task: an ERP study [77] | Kóbor, A.; Takács, Á.; Bryce, D.; Szucs, D.; Honbolygó, F.; Nagy, P.; Csépe, V. | inhibition | ERP-N1, ERP-P1, ERP-N450, LRP, SCP | Global QATQS Rating: strong (score = 2.00); Additional bio-markers; N = 24 | 0.61 |
| Increased reaction time variability in attention-deficit hyperactivity disorder as a response-related phenomenon: evidence from single-trial event-related potentials [78] | Saville, C.W.; Feige, B.; Kluckert, C.; Bender, S.; Biscaldi, M.; Berger, A.; Fleischhaker, C.; Henighausen, K.; Klein, C. | working memory | LRP, ERP-P3 | Global QATQS Rating: strong (score = 2.00); No additional bio-markers; N = 45 | 2.70 |
| Small-world brain functional networks in children with attention-deficit/hyperactivity disorder revealed by EEG synchrony [79] | Liu, T.; Chen, Y.; Lin, P.; Wang, J. | inhibition | cluster coefficient C, and characteristic path length L-alpha, beta, theta, delta | Global QATQS Rating: strong (score = 2.40); No additional bio-markers; N = 26 | 1.56 |
| Electroencephalography correlates of spatial working memory deficits in attention-deficit/hyperactivity disorder: vigilance, encoding, and maintenance [80] | Lenartowicz, A.; Delorme, A.; Walshaw, P.D.; Cho, A.L.; Bilder, R.M.; McGough, J.J.; McCracken, J.T.; Makeig, S.; Loo, S.K. | working memory | ERP-P2, PSD-TBR | Global QATQS Rating: strong (score = 2.00); No additional bio-markers; N = 99 | 2.66 |
| First clinical trial of tomographic neurofeedback in attention-deficit/hyperactivity disorder: evaluation of voluntary cortical control [81] | Liechti, M.D.; Maurizio, S.; Heinrich, H.; Jäncke, L.; Meier, L.; Steinhausen, H.C.;Walitza, S.; Drechsler, R.; Brandeis, D. | inhibition | SCP | Global QATQS Rating: strong (score = 2.00); No additional bio-markers; N = 13 | 2.12 |
| Visual sensory processing deficit in the occipital region in children with attention-deficit/hyperactivity disorder as revealed by event-related potentials during cued continuous performance test [82] | Nazari, M.; Berquin, P.; Missonnier, P.; Aarabi, A.; Debatisse, D.; De Broca, A.; Wallois, F. | inhibition | ERP-N2, ERP-P1 | Global QATQS Rating: strong (score = 2.50); No additional bio-markers; N = 30 | 0.72 |
| Do children with ADHD and/or PDD-NOS differ in reactivity of alpha/theta ERD/ERS to manipulations of cognitive load and stimulus relevance? [83] | Gomarus, H.K.; Wijers, A.A.; Minderaa, R.B.; Althaus, M. | working memory, inhibition | ERS, ERD | Global QATQS Rating: strong (score = 2.17); No additional bio-markers; N = 60 | 0.09 |
| Slow cortical potential neurofeedback in attention deficit hyperactivity disorder: is there neurophysiological evidence for specific effects? [84] | Doehnert, M.; Brandeis, D.; Straub, M.; Steinhausen, H.C.; Drechsler, R. | inhibition | CNV | Global QATQS Rating: strong (score = 2.50); No additional bio-markers; N = 26 | 2.13 |
| Longitudinal change of ERP during cued continuous performance test in child with attention-deficit/hyperactivity disorder [85] | Okazaki, S.; Ozaki, H.; Maekawa, H.; Futakami, S. | inhibition | ERP-P3, ERP-N2, ERP-P2 | Global QATQS Rating: strong (score = 2.50); No additional bio-markers; N = 1 | 0.00 |
| Exogenous orienting of visual-spatial attention in ADHD children [86] | Ortega, R.; López, V.; Carrasco, X.; Anllo-Vento, L.; Aboitiz, F. | inhibition | ERP-N1, ERP-P3, ERP-P2, ERP-CNV | Global QATQS Rating: strong (score = 2.17); No additional bio-markers; N = 60 | 0.92 |
| EEG classification of ADHD and normal children using non-linear features and neural network [87] | Mohammadi, M.R.; Khaleghi, A.; Nasrabadi, A.M.; Rafieivand, S.; Begol, M.; Zarafshan, H. | working memory | ApEn, LE, FD | Global QATQS Rating: strong (score = 2.17); No additional bio-markers; N = 60 | 3.06 |
| Diagnose ADHD disorder in children using convolutional neural network based on continuous mental task EEG [88] | Moghaddari, M.; Lighvan, M.Z.; Danishvar, S. | working memory | Amplitude of alpha, theta, beta+low gamma frequency bands | Global QATQS Rating: strong (score = 2.50); No additional bio-markers; N = 61 | 0.64 |
| Combining functional near-infrared spectroscopy and EEG measurements for the diagnosis of attention-deficit hyperactivity disorder [89] | Güven, A.; Altınkaynak, M.; Dolu, N.; İzzetoğlu, M.; Pektaş, F.; Özmen, S.; Demirci, E.; Batbat, T. | inhibition | ERP-P3, LZC, FD | Global QATQS Rating: weak (score = 1.60); Additional bio-markers; N = 44 | 1.20 |
| Methodology proposal of ADHD classification of children based on cross recurrence plots [90] | Aceves-Fernandez, M. | working memory | Recurrence rate, Determinism, Entropy, Laminarity, Trapping Time, Trend | Global QATQS Rating: strong (score = 2.20); No additional bio-markers; N = 121 | 0.00 |
| Improved neuronal regulation in ADHD: an application of 15 sessions of photic-driven EEG neurotherapy [91] | Patrick, G.J. | inhibition | PSD-theta, PSD-SMR | Global QATQS Rating: strong (score = 2.67); No additional bio-markers; N = 25 | 0.57 |
| Quantitative EEG differences in a nonclinical sample of children with ADHD and undifferentiated ADD [92] | M. A. Nazari, F. Wallois, A. Aarabi, P. Berquin, | inhibition | ERP-N1, ERP-P1, ERP-P3 | Global QATQS Rating: strong (score = 2.00); No additional bio-markers; N = 32 | 4.16 |
| Neuroelectric mapping reveals precursor of stop failures in children with attention deficits [93] | Brandeis, D.; van Leeuwen, T.H.; Rubia, K.; Vitacco, D.; Steger, J.; Pascual-Marqui, R.D.; Steinhausen, H.C. | inhibition | ERP-N1, ERP-P1, ERP-P2, ERP-P460, ERP-P550, ERP-P640 | Global QATQS Rating: strong (score = 2.00); No additional bio-markers; N = 15 | 3.76 |
| Electroencephalographic and psychometric differences between boys with and without attention-deficit/hyperactivity disorder (ADHD): a pilot study [94] | Cox, D.J.; Kovatchev, B.P.; Morris, J.B.; Phillips, C.; Hill, R.J.; Merkel, L. | inhibition | PSD-theta, PSD-alpha, PSD-theta | Global QATQS Rating: strong (score = 2.33); No additional bio-markers; N = 8 | 1.06 |
| Audio-visual entrainment program as a treatment for behavior disorders in a school setting [95] | Joyce, M.; Siever, D. | inhibition | PSD-alpha, PSD-beta, PSD-SMR | Global QATQS Rating: strong (score = 2.67); No additional bio-markers; N = 34 | 0.21 |
| EEG biofeedback training and attention-deficit/hyperactivity disorder in an elementary school setting [96] | Carmody, D.P.; Radvanski, D.C.; Wadhwani, S.; Sabo, M.J.; Vergara, L. | inhibition | PSD-beta, PSD-delta, PSD-SMR | Global QATQS Rating: strong (score = 2.67); No additional bio-markers; N = 16 | 0.00 |
| A psychophysiological marker of attention deficit/hyperactivity disorder (ADHD)—defining the EEG consistency index [97] | Kovatchev, B.; Cox, D.; Hill, R.; Reeve, R.; Robeva, R.; Loboschefski, T. | inhibition | CI | Global QATQS Rating: strong (score = 2.20); No additional bio-markers; N = 35 | 0.61 |
| A potential electroencephalography and cognitive biosignature for the child behavior checklist–dysregulation profile [98] | McGough, J.J.; McCracken, J.T.; Cho, A.L.; Castelo, E.; Sturm, A.; Cowen, J.; Piacentini, J.; Loo, S.K. | inhibition | PSD-alpha, PSD-beta, PSD-theta, PSD-delta | Global QATQS Rating: strong (score = 2.00); No additional bio-markers; N = 2 | 0.36 |
| The effects of neurofeedback training on concentration in children with attention deficit/hyperactivity disorder [99] | Kim, S.K.; Yoo, E.Y.; Lee, J.S.; Jung, M.Y.; Park, S.H.; Park, J.H. | inhibition | EEG concentration index | Global QATQS Rating: strong (score = 2.83); No additional bio-markers; N = 3 | 0.31 |
| EEG dynamics of a go/nogo task in children with ADHD [100] | Baijot, S.; Cevallos, C.; Zarka, D.; Leroy, A.; Slama, H.; Colin, C.; Deconinck, N.; Dan, B.; Cheron, G. | inhibition | ERP, ITC | Global QATQS Rating: strong (score = 2.00); No additional bio-markers; N = 14 | 0.68 |
| Electroencephalographic activity before and after cognitive effort in children with attention deficit/hyperactivity disorder [101] | Buyck, I.; Wiersema, J.R. | working memory | PSD-alpha, PSD-beta, PSD-theta, PSD-TBR | Global QATQS Rating: strong (score = 2.33); No additional bio-markers; N = 43 | 0.48 |
| A randomized controlled trial of a brain-computer interface based attention training program for ADHD [102] | Lim, C.G.; Poh, X.W.W.; Fung, S.S.D.; Guan, C.; Bautista, D.; Cheung, Y.B.; Zhang, H.; Yeo, S.N.; Krishnan, R.; Lee, T.S.Buchmann, J.; Gierow, W.; Reis, O.; Haessler, F. | inhibition | PSD-alpha, PSD-beta, PSD-theta, | Global QATQS Rating: strong (score = 2.17); No additional bio-markers; N = 172 | 1.27 |
| Intelligence moderates impulsivity and attention in ADHD children: an ERP study using a go/nogo paradigm [103] | Buchmann, J.; Gierow, W.; Reis, O.; Haessler, F. | inhibition | ERP-P3 | Global QATQS Rating: strong (score = 2.40); No additional bio-markers; N = 15 | 0.90 |
| Motor cortical inhibition in ADHD: modulation of the transcranial magnetic stimulation-evoked N100 in a response control task [104] | D’Agati, E.; Hoegl, T.; Dippel, G.; Curatolo, P.; Bender, S.; Kratz, O.; Moll, G.H.; Heinrich, H. | inhibition | ERP-N1 | Global QATQS Rating: strong (score = 2.17); No additional bio-markers; N = 37 | 0.85 |
| ERP correlates of selective attention and working memory 654 capacities in children with ADHD and/or PDD-NOS [105] | Gomarus, H.K.; Wijers, A.A.; Minderaa, R.B.; Althaus, M. | inhibition, working memory | ERP | Global QATQS Rating: moderate (score = 1.60); No additional bio-markers; N = 60 | 0.59 |
| Error and feedback processing in children with ADHD and children with autistic spectrum disorder: an EEG event-related potential study [106] | Groen, Y.; Wijers, A.A.; Mulder, L.J.; Waggeveld, B.; Minderaa, R.B.; Althaus, M. | working memory | ERP-P3, ERP-P2, ERP-Pe | Global QATQS Rating: moderate (score = 2.00); No additional bio-markers; N = 72 | 2.33 |
| Changes in EEG spectrograms, event-related potentials, and event-related desynchronization induced by relative beta training in ADHD children [107] | Kropotov, J.D.; Grin-Yatsenko, V.A.; Ponomarev, V.A.; Chutko, L.S.; Yakovenko, E.A.; Nikishena, I.S. | inhibition | PSD-relative beta | Global QATQS Rating: strong (score = 2.50); No additional bio-markers; N = 86 | 0.43 |
| Functional connectivity of frontal cortex in healthy and ADHD children reflected in EEG coherence [108] | Murias, M.; Swanson, J.M.; Srinivasan, R. | working memory | PSD, Coherence Power | Global QATQS Rating: strong (score = 2.33); No additional bio-markers; N = 63 | 1.46 |
| Case study: improvements in IQ score and maintenance of gains following EEG biofeedback with mildly developmentally delayed twins [109] | Fleischman, M.J.; Othmer, S. | inhibition | PSD-SMR | Global QATQS Rating: strong (score = 2.50); No additional bio-markers; N = 2 | 0.00 |
| A controlled study of the effectiveness of EEG biofeedback training on children with attention deficit hyperactivity disorder [110] | Zhonggui, X.; Shuhua, S.; Haiqing, X. | working memory, inhibition | PSD-SMR, PSD-theta | Global QATQS Rating: strong (score = 2.50); No additional bio-markers; N = 60 | 0.10 |
| ERPs correlates of EEG relative beta training in ADHD children [111] | Kropotov, J.D.; Grin-Yatsenko, V.A.; Ponomarev, V.A.; Chutko, L.S.; Yakoveuhua, E.A.; Nikishena, I.S. | inhibition | ERP-N1, ERP-P2, late ERP | Global QATQS Rating: strong (score = 2.00); No additional bio-markers; N = 86 | 1.14 |
| Event-related potentials in attention-deficit/hyperactivity disorder of the predominantly inattentive type: an investigation of EEG-defined subtypes [112] | Brown, C.R.; Clarke, A.R.; Barry, R.J.; McCarthy, R.; Selikowitz, M.; Magee, C. | inhibition | ERP-N2, ERP-P3, ERP-N1, ERP-P1, ERP-P2 | Global QATQS Rating: moderate (score = 1.80); Additional bio-markers; N = 81 | 0.17 |
| Lateralized modulation of posterior alpha oscillations in children [113] | Vollebregt, M.A.; Zumer, J.M.; Ter Huurne, N.; Castricum, J.; Buitelaar, J.K.; Jensen, O. | inhibition | MI-alpha | Global QATQS Rating: moderate (score = 1.80); Additional bio-markers; N = 21 | 0.49 |
| Posterior alpha oscillations reflect attentional problems in boys with attention deficit hyperactivity disorder [114] | Vollebregt, M.A.; Zumer, J.M.; Ter Huurne, N.; Buitelaar, J.K.; Jensen, O. | inhibition | MI-alpha | Global QATQS Rating: moderate (score = 1.40); Additional bio-markers; N = 26 | 1.04 |
| Intact stimulus–response conflict processing in ADHD—multilevel evidence and theoretical implications [115] | Bluschke, A.; Mückschel, M.; Roessner, V.; Beste, C. | inhibition | ERP-N1, ERP-P3, ERP-N2, ERP-P1 | Global QATQS Rating: strong (score = 2.00); No additional bio-markers; N = 69 | 0.36 |
| Topographical analyses of attention disorders of childhood [116] | DeFrance, J.; Smith, S.; Schweitzer, F.; Ginsberg, L.; Sands, S. | inhibition | PSD-beta, PSD-alpha, PSD-theta, ERP-P3, ERP-P2, ERP-P5 | Global QATQS Rating: strong (score = 1.80); Additional bio-markers; N = 71 | 0.53 |
| Varying required effort during interference control in children with AD/HD: task performance and ERPs [117] | Johnstone, S.J.; Watt, A.J.; Dimoska, A. | inhibition | ERP-N2, ERP-P3, ERP-P4 | Global QATQS Rating: weak (score = 1.20); Additional bio-markers; N = 52 | 0.69 |
| Response inhibition and interference control in children with AD/HD: a visual ERP investigation [118] | Johnstone, S.J.; Barry, R.J.; Markovska, V.; Dimoska, A.; Clarke, A.R. | inhibition | ERP-N1, ERP-N2, ERP-P3, ERP-P2 | Global QATQS Rating: strong (score = 1.83); Additional bio-markers; N = 40 | 1.58 |
| A comparative study on the neurophysiological mechanisms underlying effects of methylphenidate and neurofeedback on inhibitory control in attention deficit hyperactivity disorder [119] | Bluschke, A.; Friedrich, J.; Schreiter, M.L.; Roessner, V.; Beste, C. | inhibition | ERP-N1, ERP-N2, ERP-P3, ERP-P2 | Global QATQS Rating: strong (score = 2.00); No additional bio-markers; N = 20 | 1.30 |
| A pilot study of combined working memory and inhibition training for children with AD/HD [120] | Johnstone, S.J.; Roodenrys, S.; Phillips, E.;Watt, A.J.; Mantz, S. | inhibition, working memory | ERP-N1, ERP-N2, ERP-P3 | Global QATQS Rating: weak (score = 1.17); Additional bio-markers; N = 40 | 1.91 |
| Abnormal alpha modulation in response to human eye gaze predicts inattention severity in children with ADHD [121] | Guo, J.; Luo, X.; Wang, E.; Li, B.; Chang, Q.; Sun, L.; Song, Y. | inhibition | ERP | Global QATQS Rating: moderate (score = 1.60); No additional bio-markers; N = 108 | 0.13 |
| Aiding diagnosis of childhood attention-deficit/hyperactivity disorder of the inattentive presentation: discriminant function analysis of multi-domain measures including EEG [122] | Johnstone, S.J.; Parrish, L.; Jiang, H.; Zhang, D.W.; Williams, V.; Li, S. | inhibition | PSD-alpha, PSD-beta, PSD-theta, PSD-delta, PSD-TBR | Global QATQS Rating: strong (score = 2.00); No additional bio-markers; N = 214 | 0.00 |
| Behavioural and ERP indices of response inhibition during a stop-signal task in children with two subtypes of attention-deficit hyperactivity Disorder [123] | Johnstone, S.J.; Barry, R.J.; Clarke, A.R. | inhibition | ERP-N1, ERP-N2, ERP-P3, ERP-P2 | Global QATQS Rating: moderate (score = 1.80); No additional bio-markers; N = 38 | 0.79 |
| Virtual reality therapy in prolonging attention spans for ADHD [124] | Sushmitha, S.; Devi, B.T.; Mahesh, V.; Geethanjali, B.; Kumar, K.A.; Pavithran, P. | inhibition, planning | PSD-alpha, PSD-beta, PSD-theta, PSD-delta, PSD-TBR | Global QATQS Rating: strong (score = 2.33); Additional bio-markers; N = 20 | 0.00 |
| Quantifying brain activity state: EEG analysis of background music in a serious game on attention of children [125] | Soysal, Ö.M.; Kiran, F.; Chen, J. | inhibition, planning | PSD-alpha, PSD-beta | Global QATQS Rating: strong (score = 2.50); No additional bio-markers; N = 6 | 0.79 |
| Source-based multifractal detrended fluctuation analysis for discrimination of ADHD children in a time reproduction paradigm [126] | Khoshnoud, S.; Nazari, M.A.; Shamsi, M. | inhibition | ERP-P3- multifractality | Global QATQS Rating: moderate (score = 2.00); Additional bio-markers; N = 34 | 0.00 |
| Virtual classroom: an ADHD assessment and diagnosis system based on virtual reality [127] | Tan, Y.; Zhu, D.; Gao, H.; Lin, T.W.; Wu, H.K.; Yeh, S.C.; Hsu, T.Y. | working memory | PSD-TBR, PSD-alpha, PSD-beta, PSD-theta, PSD-deta | Global QATQS Rating: weak (score = 1.20); Additional bio-markers; N = 100 | 1.45 |
| Acquisition and analysis of cognitive evoked potentials using an emotiv headset for ADHD evaluation in children [128] | Mercado-Aguirre, I.M.; Gutiérrez-Ruiz, K.; Contreras-Ortiz, S.H. | working memory | ERP-P3 | Global QATQS Rating: strong (score = 2.83); No additional bio-markers; N = 19 | 0.50 |
| Personalized features for attention detection in children with attention deficit hyperactivity disorder [129] | Fahimi, F.; Guan, C.; Goh, W.B.; Ang, K.K.; Lim, C.G.; Lee, T.S. | inhibition | PSD, PSD-TAR, PSD-TBAR | Global QATQS Rating: strong (score = 2.33); No additional bio-markers; N = 120 | 1.19 |
| Identification of ADHD cognitive pattern disturbances using EEG and wavelets Analysis [130] | Gabriel, R.; Spindola, M.M.; Mesquita, A.; Neto, A.Z. | inhibition, working memory | Morlet Wavelet Transform - delta, theta, alpha, and beta-power spectrum and amplitude | Global QATQS Rating: strong (score = 2.20); No additional bio-markers; N = 19 | 0.00 |
| Neurofeedback based attention training for children with ADHD [131] | Chen, C.L.; Tang, Y.W.; Zhang, N.Q.; Shin, J. | inhibition, working memory | PSD-alpha, PSD-beta, PSD-theta, PSD-deta | Global QATQS Rating: strong (score = 2.50); Additional bio-markers; N = 10 | n.a. |
| Influence of a BCI neurofeedback videogame in children with ADHD. Quantifying the brain activity through an EEG signal processing dedicated toolbox [132] | Blandón, D.Z.; Muñoz, J.E.; Lopez, D.S.; Gallo, O.H. | inhibition | PSD-alpha, PSD-beta, PSD-delta, PSD-gamma, PSD-TBR | Global QATQS Rating: strong (score = 2.83); No additional bio-markers; N = 9 | 2.64 |
| Neurofeedback treatment experimental study for adhd by using the brain–computer interface neurofeedback system [133] | Liu, T.; Wang, J.; Chen, Y.; Wang, R.; Song, M. | inhibition | PSD-beta, PSD-theta, PSD-TBR, PSD- SMR | Global QATQS Rating: moderate (score = 1.83); Additional bio-markers; N = 22 | 2.63 |
| Analysis of attention deficit hyperactivity disorder in EEG using wavelet transform and self organizing maps [134] | Lee, S.H.; Abibullaev, B.; Kang, W.S.; Shin, Y.; An, J. | working memory | Wavelet Transform-alpha, theta, beta power spectrum | Global QATQS Rating: strong (score = 2.60); No additional bio-markers; N = 39 | 1.09 |
| Classification of ADHD and non-ADHD using AR models [135] | Marcano, J.L.L.; Bell, M.A.; Beex, A.L. | inhibition | PSD-TBR | Global QATQS Rating: weak (score = 3.00); No additional bio-markers; N = 4 | 1.19 |
| Deep learning based on event-related EEG differentiates children with ADHD from healthy controls [136] | Vahid, A.; Bluschke, A.; Roessner, V.; Stober, S.; Beste, C. | inhibition | ERP-P3 | Global QATQS Rating: strong (score = 1.20); Additional bio-markers; N = 28 | 3.44 |
| Article | FWCI | Normalized QATQS Score |
|---|---|---|
| Range [0.00–4.17]; Median = 0.77 | Range [1.17–3.00]; Median = 2.17 | |
| [39] | 4.17 | 1.83 |
| [92] | 4.16 | 2.00 |
| [93] | 3.66 | 2.00 |
| [136] | 3.44 | 1.20 |
| [64] | 3.25 | 2.20 |
| Article | Normalized QATQS Score | FWCI |
|---|---|---|
| Range [1.17–3.00]; Median = 2.17 | Range [0.00–4.17]; Median = 0.77 | |
| [120] | 1.17 | 1.91 |
| [127] | 1.20 | 1.45 |
| [136] | 1.20 | 3.44 |
| [117] | 1.20 | 0.69 |
| [89] | 1.60 | 1.20 |
Publisher’s Note: MDPI stays neutral with regard to jurisdictional claims in published maps and institutional affiliations. |
© 2022 by the authors. Licensee MDPI, Basel, Switzerland. This article is an open access article distributed under the terms and conditions of the Creative Commons Attribution (CC BY) license (https://creativecommons.org/licenses/by/4.0/).
Share and Cite
Arpaia, P.; Covino, A.; Cristaldi, L.; Frosolone, M.; Gargiulo, L.; Mancino, F.; Mantile, F.; Moccaldi, N. A Systematic Review on Feature Extraction in Electroencephalography-Based Diagnostics and Therapy in Attention Deficit Hyperactivity Disorder. Sensors 2022, 22, 4934. https://doi.org/10.3390/s22134934
Arpaia P, Covino A, Cristaldi L, Frosolone M, Gargiulo L, Mancino F, Mantile F, Moccaldi N. A Systematic Review on Feature Extraction in Electroencephalography-Based Diagnostics and Therapy in Attention Deficit Hyperactivity Disorder. Sensors. 2022; 22(13):4934. https://doi.org/10.3390/s22134934
Chicago/Turabian StyleArpaia, Pasquale, Attilio Covino, Loredana Cristaldi, Mirco Frosolone, Ludovica Gargiulo, Francesca Mancino, Federico Mantile, and Nicola Moccaldi. 2022. "A Systematic Review on Feature Extraction in Electroencephalography-Based Diagnostics and Therapy in Attention Deficit Hyperactivity Disorder" Sensors 22, no. 13: 4934. https://doi.org/10.3390/s22134934