
Predicting Fall Counts Using Wearable Sensors: A Novel Digital Biomarker for Parkinson’s Disease

 , ,
, ,
Abstract
:1. Introduction
2. Datasets
2.1. Training Dataset (TD)
2.2. Parkinson’s Disease Dataset 1 (PD1)
2.3. Parkinson’s Disease Dataset 2 (PD2)
3. Methods
QTUG Assessment Protocol
4. Statistical analysis
4.1. Exploratory Analysis
4.2. Predictive Model of Falls Counts
- Using existing trained classifiers to predict falls counts (QTUG FRE and Mobility score models)
- Ensemble model based on elastic net models with Poisson regression
4.2.1. Predicting Falls Counts Using Existing QTUG Risk Estimates (FRE Model)
4.2.2. Predicting Falls Counts Using QTUG Mobility Risk Scores (Mobility Score Model)
4.2.3. Predicting Falls Counts with Elastic Net Regression
- TD-All—All training data
- TD-Fallers—training data excluding non-fallers (number of falls >0)
- TD-PD—PD patients within the training dataset only
- TD-Fallers-PD—PD patients who had experienced at least one fall
- TD-NoPD—training dataset excluding PD patients
- TD-Fallers-NoPD—dataset excluding fallers and patients with PD
4.2.4. Model Performance Metrics
5. Results
5.1. Predictive Model of Falls Counts Using QTUG
5.1.1. Existing QTUG Falls Risk Model
5.1.2. Elastic Net Ensemble Models
Training Falls Count Models Using Cross-Validation
Testing Falls Count Models on Independent PD Datasets
6. Discussion
7. Conclusions
Author Contributions
Funding
Institutional Review Board Statement
Informed Consent Statement
Data Availability Statement
Acknowledgments
Conflicts of Interest
Abbreviations
| Abbreviation | Definition |
| PD | Parkinson’s Disease |
| NumFalls | Number of falls |
| QTUG | Quantitative Timed Up and Go |
| TUG time | Time to complete Timed Up and Go test |
| TD | Training dataset for elastic net Poisson regression models |
| PD1 | Parkinson’s test dataset #1 |
| PD2 | Parkinson’s test dataset #2 |
| UPDRS | Unified Parkinson’s Disease Rating Scale |
| MMSE | Mini Mental State Examination |
| CGA | Comprehensive Geriatric Assessment |
| FREsensor | Inertial sensor-based estimate of falls risk |
| FEsensor | Inertial sensor-based estimate of frailty, based on Fried’s frailty phenotype |
| Mobility scores | Percentile-based scores quantifying mobility across five dimensions (Speed, Transfers, Turning, Variability, Symmetry), using inertial sensors, compared to a large reference dataset |
| FRE model | Negative binomial model of falls counts using TUG time FREsensor and FEsensor |
| Mobility model | Negative binomial model of falls counts using mobility scores |
Appendix A. Anthropomorphic Data

| TD | PD1 | PD2 | |||||||
|---|---|---|---|---|---|---|---|---|---|
| All (N = 1015) | M (N = 344) | F (N = 671) | All (N = 15) | M (N = 10) | F (N = 5) | All (N = 27) | M (N = 17) | F (N = 9) | |
| Age (yrs) | 71.52 ± 11.34 | 69.65 ± 13.75 | 72.48 ± 9.75 | 67.29 ± 7.11 | 67.26 ± 7.06 | 67.33 ± 8.03 | 64.92 ± 7.28 | 64.88 ± 8.86 | 65.00 ± 2.92 |
| Weight (kg) | 74.03 ± 14.22 | 82.11 ± 11.89 | 69.88 ± 13.53 | 80.05 ± 15.64 | 85.81 ± 10.96 | 68.51 ± 18.33 | 74.73 ± 13.55 | 79.06 ± 11.54 | 66.56 ± 13.88 |
| Height (cm) | 165.61 ± 9.37 | 174.25 ± 7.27 | 161.17 ± 6.92 | 172.29 ± 9.77 | 176.94 ± 7.13 | 162.98 ± 7.56 | 171.24 ± 8.27 | 175.54 ± 6.24 | 163.11 ± 4.70 |
| BMI | 26.97 ± 4.70 | 27.05 ± 3.76 | 26.92 ± 5.11 | 26.86 ± 4.37 | 27.34 ± 2.20 | 25.91 ± 7.35 | 25.40 ± 3.79 | 25.63 ± 3.33 | 24.96 ± 4.74 |
| TUG time (s) | 10.77 ± 3.94 | 10.55 ± 3.52 | 10.88 ± 4.14 | 12.60 ± 2.47 | 11.77 ± 2.55 | 14.26 ± 1.23 | 8.60 ± 2.92 | 9.11 ± 3.38 | 7.62 ± 1.47 |
| Mean velocity (cm/s) | 98.90 ± 18.65 | 100.17 ± 19.81 | 98.25 ± 18.01 | 87.50 ± 10.08 | 88.52 ± 11.91 | 85.47 ± 5.33 | 116.03 ± 14.88 | 113.16 ± 16.10 | 121.45 ± 11.11 |
Appendix B. Association of QTUG Parameters with Falls Counts
Appendix B.1. Training Data (TD) Set
| Mann–Whitney | Spearman | Anova | |||||||
|---|---|---|---|---|---|---|---|---|---|
| Parameter Name | Faller (Mean ± Std) | Non-Faller (Mean ± Std) | Rank Sum | ρ(All) | ρ(M) | ρ(F) | F(All) | F(M) | F(F) |
| Turn mid-point time (s) | 5.22 ± 2.44 | 4.12 ± 1.35 | 245,646 * | 0.24 * | 0.21 * | 0.23 * | 14.76 * | 5.31 * | 10.04 * |
| Mean stride length (cm/s) | 123.50 ± 22.03 | 133.67 ± 20.37 | 175,859 * | −0.22 * | −0.19 * | −0.20 * | 12.55 * | 3.64 * | 7.68 * |
| TUG test time (s) | 11.63 ± 4.83 | 10.19 ± 3.07 | 228,827 * | 0.18 * | 0.19 * | 0.18 * | 11.02 * | 2.74 * | 9.09 * |
| Number of gait cycles | 6.56 ± 2.01 | 5.92 ± 1.49 | 232,287 * | 0.19 * | 0.17 * | 0.18 * | 10.71 * | 2.96 * | 7.19 * |
| Mean stride velocity (cm/s) | 94.47 ± 19.24 | 101.89 ± 17.61 | 180,628 * | −0.19 * | −0.20 * | −0.18 * | 10.19 * | 3.31 * | 7.17 * |
| Number of steps | 13.60 ± 4.01 | 12.34 ± 2.97 | 232,030 * | 0.18 * | 0.16 * | 0.16 * | 10.17 * | 2.90 * | 6.78 * |
| Walk time (s) | 9.05 ± 3.86 | 7.90 ± 3.01 | 232,167.5 * | 0.19 * | 0.19 * | 0.19 * | 8.99 * | 2.75 * | 6.64 * |
| Return from turn time (s) | 5.27 ± 2.42 | 4.67 ± 2.16 | 229,265 * | 0.18 * | 0.22 * | 0.16 * | 6.63 * | 2.41 * | 4.56 * |
| Time to Sit (s) | 1.83 ± 1.75 | 2.30 ± 1.42 | 188,460.5 * | 6.07 * | 2.38 * | 5.15 * | |||
| CV Z-axis ang. vel. (%) | 4.46 ± 1.18 | 4.55 ± 1.13 | 192,059 * | −0.11 * | −0.16 * | −0.11 * | 5.46 * | 6.89 * | 2.95 * |
| CV X-axis ang. vel. (%) | 4.47 ± 1.18 | 4.56 ± 1.14 | 194,051 * | −0.10 * | −0.15 * | −0.09 * | 5.36 * | 6.90 * | 2.96 * |
| CV Y-axis ang. vel. (%) | 4.44 ± 1.18 | 4.50 ± 1.12 | 202,533 | −0.04 | −0.08 | −0.03 | 4.97 * | 6.36 * | 2.80 * |
| Number of strides in turn | 2.57 ± 0.99 | 2.35 ± 0.82 | 222,415.5 * | 0.12 * | 0.13 * | 0.09 * | 4.93 * | 1.47 | 3.56 * |
| Min Y-axis ang. vel. × Height (deg·m/s) | −369.35 ± 86.63 | −380.76 ± 85.97 | 215,481 | 0.09 * | 0.06 | 0.10 * | 4.77 * | 1.25 | 4.07 * |
| Min Z-axis ang. vel. x Height (deg·m/s) | −292.71 ± 113.61 | −330.12 ± 127.30 | 230,349 * | 0.16 * | 0.05 | 0.17 * | 4.44 * | 0.12 | 4.84 * |
| CV stride velocity (%) | 3.51 ± 0.93 | 3.51 ± 0.86 | 214,948 | 0.00 | 0.02 | 0.00 | 4.41 * | 6.18 * | 2.90 * |
| Magnitude mean at mid-swing points (deg/s) | 276.85 ± 60.13 | 282.06 ± 50.28 | 202,768 | −0.06 * | −0.07 | −0.10 * | 4.21 * | 1.47 | 3.53 * |
| Max Y-axis ang. vel. × Height (deg·m/s) | 602.28 ± 112.62 | 613.78 ± 111.34 | 201,741 | −0.08 * | −0.05 | −0.09 * | 3.99 * | 0.99 | 3.64 * |
| Min Y-axis ang. vel. (deg/s) | −226.12 ± 53.33 | −228.01 ± 49.32 | 209,191 | 0.05 | 0.03 | 0.08 * | 3.90 * | 1.12 | 3.30 * |
| Turning time (s) | 3.20 ± 1.54 | 2.86 ± 1.55 | 225,713 * | 0.15 * | 0.18 | 0.13 * | 3.82 * | 1.24 | 3.17 * |
| Min Z-axis ang. vel. (deg/s) | −178.46 ± 67.06 | −197.32 ± 74.50 | 227,152 * | 0.13 * | 0.04 | 0.17 * | 3.49 * | 0.10 | 4.34 * |
| Mean X-axis ang. vel. (deg/s) | 47.61 ± 18.02 | 47.69 ± 17.86 | 207,329 | −0.02 | −0.01 | −0.04 | 3.19 * | 0.83 | 3.07 * |
| Mean single support | 0.39 ± 0.05 | 0.40 ± 0.05 | 192,517 * | −0.11 * | −0.08 | −0.11 | 3.14 * | 1.17 | 2.29 * |
| Cadence (steps/min) | 94.55 ± 15.54 | 97.11 ± 14.24 | 198,692 * | −0.09 * | −0.11 | −0.12 | 3.13 * | 1.70 | 3.05 * |
| Min X-axis ang. vel. × Height (deg·m/s) | −705.10 ± 213.10 | −740.84 ± 206.64 | 219,102 * | 0.07 * | 0.04 | 0.09 | 3.12 * | 0.93 | 3.08 * |
| CV stride length (%) | 3.09 ± 0.85 | 3.02 ± 0.81 | 214,948 | −0.01 | 0.00 | 0.01 | 3.10 * | 3.45 * | 2.54 * |
| Mean X-axis ang. vel. × Height (deg·m/s) | 77.82 ± 29.63 | 79.65 ± 30.35 | 203,230 | −0.04 | −0.02 | −0.05 | 3.07 * | 0.77 | 3.17 * |
| Max Y-axis ang. vel. (deg/s) | 368.67 ± 68.29 | 367.82 ± 64.97 | 210,123 | −0.02 | −0.02 | −0.06 | 3.00 * | 0.83 | 2.68 * |
| Time to stand (s) | 1.60 ± 1.52 | 1.17 ± 1.01 | 157,907.5 * | 2.99 * | 2.65 * | 2.01 | |||
| Mean double support | 0.23 ± 0.09 | 0.22 ± 0.07 | 220,289 * | 0.10 * | 0.10 | 0.10 | 2.88 * | 0.93 | 2.53 |
| Single support variability (%) | 2.48 ± 0.81 | 2.41 ± 0.80 | 215,286 | −0.01 | 0.00 | −0.02 | 2.83 * | 2.10 | 2.50 * |
| Max Z-axis ang. vel. (deg/s) | 228.29 ± 78.44 | 219.95 ± 77.33 | 215,623 | 0.00 | 0.00 | −0.01 | 2.75 * | 2.28 * | 2.13 |
| Min X-axis ang. vel. (deg/s) | −431.13 ± 127.99 | −444.08 ± 122.74 | 214,101 | 0.04 | 0.02 | 0.08 * | 2.67 * | 0.83 | 2.64 * |
| Double support variability (%) | 3.40 ± 0.96 | 3.37 ± 0.94 | 212,048 | −0.02 | −0.04 | 0.00 | 2.61 * | 3.69 * | 1.89 |
| Max Z-axis ang. vel. x Height (deg·m/s) | 373.75 ± 131.33 | 367.73 ± 133.24 | 211,979 | −0.03 | −0.01 | −0.02 | 2.61 * | 2.27 * | 2.35 * |
| Mean Y-axis ang. vel. × Height (deg·m/s) | 94.53 ± 33.82 | 96.87 ± 34.56 | 204,249 | −0.05 | −0.04 | −0.05 | 2.44 * | 0.76 | 2.45 * |
| Max X-axis ang. vel. × Height (deg·m/s) | 697.81 ± 229.74 | 737.93 ± 223.70 | 194,870 * | −0.09 * | −0.08 | −0.11 * | 2.39 * | 0.46 | 2.30 * |
| Swing time variability (%) | 2.59 ± 0.88 | 2.57 ± 0.84 | 209,418 | −0.03 | −0.02 | −0.04 | 2.37 * | 3.24 | 1.69 |
| Mean stance time (s) | 0.81 ± 0.18 | 0.78 ± 0.16 | 216,963 * | 0.08 * | 0.10 | 0.09 * | 2.27 * | 1.31 | 2.34 * |
| Mean Y-axis ang. vel. (deg/s) | 57.90 ± 20.70 | 58.05 ± 20.50 | 208,277 | −0.02 | −0.03 | −0.03 | 2.18 | 0.76 | 2.18 * |
| Stride length asymmetry (%) | 2.09 ± 32.69 | 2.70 ± 20.31 | 194,835 | 2.07 | 1.28 | 1.24 | |||
| Stride velocity asymmetry (%) | 1.85 ± 32.40 | 3.68 ± 17.72 | 209,999 | 0.06 | 1.87 | 1.24 | 1.20 | ||
| Mean swing time (s) | 0.49 ± 0.07 | 0.50 ± 0.06 | 195,354 * | −0.07 * | 0.01 | −0.05 | 1.78 | 0.32 | 1.91 |
| Max X-axis ang. vel. (deg/s) | 427.09 ± 140.18 | 442.08 ± 130.96 | 198,781 * | −0.07 * | −0.07 | −0.09 * | 1.77 | 0.33 | 1.94 |
| Mean Z-axis ang. vel. (deg/s) | 28.22 ± 12.35 | 26.72 ± 11.02 | 216,017 | 0.01 | 0.08 | 0.00 | 1.71 | 1.93 | 2.03 |
| Mean stride time (s) | 1.30 ± 0.20 | 1.28 ± 0.18 | 212,414.5 | 0.05 | 0.10 | 0.07 | 1.67 | 1.41 | 1.79 |
| Stance time variability (%) | 3.29 ± 0.99 | 3.23 ± 0.99 | 213,340 | −0.01 | 0.01 | 0.00 | 1.58 | 1.98 | 1.43 |
| Mean Z-axis ang. vel. x Height (deg·m/s) | 46.29 ± 20.84 | 44.75 ± 18.99 | 212,131 | −0.01 | 0.07 | −0.01 | 1.45 | 1.65 | 2.16 |
| Stride time variability (%) | 2.90 ± 0.93 | 2.79 ± 0.92 | 217,195 * | 0.01 | 0.03 | 0.01 | 1.42 | 2.19 | 1.53 |
| Walk ratio | 1.08 ± 0.39 | 1.17 ± 0.52 | 197,637 * | −0.02 | 0.03 | −0.03 | 1.40 | 2.92 * | 0.96 |
| Step time asymmetry (%) | 1.09 ± 25.88 | 0.32 ± 22.55 | 206,480 | 0.06 * | 0.00 | 0.09 * | 1.31 | 1.43 | 1.47 |
| Mean step time (s) | 0.61 ± 0.13 | 0.60 ± 0.09 | 206,948 | 0.02 | 0.00 | 0.06 | 1.25 | 0.38 | 1.56 |
| Step time variability (%) | 2.69 ± 0.96 | 2.61 ± 0.88 | 214,216 | −0.01 | −0.05 | 0.01 | 1.17 | 2.11 | 1.15 |
| Turn magnitude (deg/s) | 87.47 ± 83.66 | 87.56 ± 86.78 | 208,458 | 0.02 | −0.08 | 0.06 | 1.14 | 1.08 | 1.10 |
| Swing time asymmetry (%) | −1.16 ± 18.25 | −1.42 ± 14.54 | 208,523 | 0.02 | 0.03 | 0.01 | 0.98 | 0.36 | 0.84 |
| Stride time asymmetry (%) | 0.62 ± 17.91 | −1.96 ± 15.32 | 216,223.5 | 0.04 | 0.09 | 0.03 | 0.83 | 1.16 | 0.33 |
| Stance time asymmetry (%) | 1.23 ± 27.91 | −1.77 ± 24.76 | 213,976.5 | 0.02 | 0.08 | 0.01 | 0.81 | 0.78 | 0.67 |
| Magnitude range at mid-swing points (deg/s) | 225.93 ± 64.89 | 222.08 ± 66.36 | 212,668 | 0.01 | −0.02 | 0.00 | 0.62 | 0.68 | 0.63 |
| Ratio strides/turning time | 0.88 ± 0.35 | 0.88 ± 0.30 | 204,135.5 | −0.04 | −0.04 | −0.07 | 0.53 | 0.51 | 0.51 |
Appendix B.2. PD1 Dataset
| Mann–Whitney | Spearman | Anova | |||||||
|---|---|---|---|---|---|---|---|---|---|
| Parameter Name | Faller (Mean ± std) | Non-Faller (Mean ± std) | U | ρ(All) | Ρ(M) | ρ(F) | F(All) | F (M) | F(F) |
| Mean step time (s) | 0.62 ± 0.09 | 0.72 ± 0.10 | 42 | −0.43 | −0.19 | −0.50 | 4.07 * | 2.04 | 1.41 |
| Mean stride length (cm/s) | 107.00 ± 24.34 | 126.57 ± 22.17 | 48 | −0.31 | −0.05 | −0.30 | 3.51 | 1.66 | 1.66 |
| Stride time variability (%) | 33.37 ± 12.92 | 22.63 ± 11.32 | 59 | 0.61 * | 0.26 | 0.60 | 3.10 | 0.60 | 200.48 * |
| Walk ratio | 1.09 ± 0.19 | 1.42 ± 0.26 | 42 | −0.62 * | −0.64 * | −0.20 | 2.99 | 1.49 | 7.32 |
| CV stride velocity (%) | 47.41 ± 9.20 | 46.47 ± 4.89 | 51 | 0.10 | −0.27 | 0.80 | 2.36 | 1.62 | 1.25 |
| CV Z-axis ang. vel. (%) | 107.12 ± 8.53 | 106.16 ± 8.00 | 53 | −0.02 | 0.07 | 0.70 | 2.15 | 1.17 | 0.96 |
| Mean swing time (s) | 0.49 ± 0.05 | 0.52 ± 0.10 | 46 | −0.44 | −0.37 | 0.00 | 2.14 | 1.87 | 43.86 * |
| Double support variability (%) | 55.00 ± 23.11 | 34.25 ± 23.59 | 59 | 0.53 * | 0.45 | 0.00 | 2.00 | 2.86 | 6.00 |
| Turn magnitude (deg/s) | 64.87 ± 79.45 | 93.92 ± 121.88 | 52 | −0.20 | 0.19 | −1.00 | 1.90 | 9.22 | 29.05 * |
| Mean stride time (s) | 1.32 ± 0.15 | 1.47 ± 0.20 | 43 | −0.21 | −0.19 | −0.30 | 1.90 | 1.37 | 2.18 |
| Step time asymmetry (%) | −24.30 ± 6.29 | 14.16 ± 22.16 | 36 * | −0.47 | −0.58 | −0.60 | 1.71 | 1.14 | 74.89 * |
| CV Y-axis ang. vel. (%) | 104.85 ± 7.00 | 105.60 ± 2.95 | 47 | −0.19 | −0.49 | 0.70 | 1.59 | 1.21 | 0.63 |
| Swing time variability (%) | 19.06 ± 9.50 | 31.03 ± 14.75 | 45 | −0.54 * | −0.48 | −0.90 | 1.46 | 0.74 | 0.57 |
| Min X-axis ang. vel. × Height (deg·m/s) | −656.15 ± 121.89 | −730.02 ± 178.35 | 54 | 0.06 | −0.09 | −0.10 | 1.44 | 0.69 | 0.28 |
| Time to Sit (s) | 1.90 ± 0.62 | 2.15 ± 0.89 | 48 | −0.37 | −0.41 | 0.70 | 1.39 | 1.18 | 0.81 |
| Single support variability (%) | 18.02 ± 6.83 | 19.3 ± 27.26 | 51 | 0.09 | 0.06 | 0.10 | 1.36 | 3.13 | 4.60 |
| CV stride length (%) | 36.08 ± 8.45 | 33.73 ± 15.52 | 52 | 0.12 | −0.09 | 0.50 | 1.22 | 0.68 | 1.75 |
| Stance time variability (%) | 42.50 ± 20.31 | 40.15 ± 6.90 | 56 | 0.46 | 0.30 | 0.50 | 1.12 | 2.72 | 0.53 |
| Mean stance time (s) | 0.82 ± 0.15 | 0.95 ± 0.18 | 45 | −0.09 | −0.01 | −0.20 | 1.03 | 0.92 | 0.32 |
| Stride time asymmetry (%) | −1.49 ± 12.09 | −2.15 ± 5.26 | 50 | −0.09 | −0.02 | 0.10 | 1.03 | 3.91 | 0.44 |
| Min X-axis ang. vel. (deg/s) | −378.73 ± 61.07 | −422.86 ± 79.94 | 57 | 0.05 | −0.03 | 0.30 | 1.02 | 0.67 | 0.74 |
| Step time variability (%) | 29.14 ± 13.03 | 25.62 ± 18.92 | 56 | 0.32 | 0.16 | 0.70 | 1.01 | 0.76 | 0.72 |
| Mean stride velocity (cm/s) | 80.55 ± 9.46 | 93.03 ± 13.17 | 46 | −0.36 | −0.28 | −0.30 | 0.97 | 0.39 | 2.77 |
| Mean double support | 0.22 ± 0.05 | 0.29 ± 0.09 | 46 | −0.04 | −0.14 | −0.20 | 0.95 | 0.62 | 5.27 |
| Mean Z-axis ang. vel. (deg/s) | 42.11 ± 8.15 | 43.37 ± 2.32 | 53 | −0.04 | −0.02 | −0.10 | 0.95 | 1.28 | 0.73 |
| Number of steps | 13.63 ± 3.12 | 12.25 ± 3.63 | 55 | 0.20 | 0.03 | −0.15 | 0.90 | 0.11 | 5.33 |
| Number of gait cycles | 6.63 ± 1.49 | 6.00 ± 1.87 | 55.5 | 0.20 | 0.07 | −0.26 | 0.83 | 0.13 | 15.20 |
| Cadence (steps/min) | 91.50 ± 8.82 | 85.42 ± 8.77 | 58 | 0.13 | −0.11 | 0.10 | 0.80 | 0.68 | 0.40 |
| Magnitude mean at mid-swing points (deg/s) | 220.23 ± 23.72 | 278.60 ± 47.40 | 40 * | −0.42 | −0.39 | −0.70 | 0.71 | 0.28 | 5.26 |
| Mean Z-axis ang. vel. × Height (deg·m/s) | 72.50 ± 13.64 | 74.14 ± 3.73 | 49 | −0.13 | 0.06 | 0.30 | 0.68 | 1.01 | 0.97 |
| Mean Y-axis ang. vel. × Height (deg·m/s) | 100.46 ± 11.40 | 118.65 ± 8.36 | 40 * | −0.49 | −0.31 | −0.70 | 0.66 | 0.05 | 5.96 |
| Swing time asymmetry (%) | −8.30 ± 9.65 | 9.29 ± 26.40 | 45 | −0.18 | −0.09 | −0.70 | 0.60 | 0.52 | 15.59 |
| Stride length asymmetry (%) | 13.36 ± 21.82 | 4.65 ± 10.97 | 55 | 0.37 | 0.37 | 0.30 | 0.59 | 0.45 | 0.91 |
| Min Z-axis ang. vel. (deg/s) | −212.79 ± 41.74 | −211.98 ± 47.11 | 53 | 0.04 | −0.15 | 0.10 | 0.58 | 0.53 | 4.90 |
| Number of strides in turn | 2.00 ± 0.50 | 2.25 ± 1.09 | 51 | 0.00 | −0.24 | 0.71 | 0.57 | 0.44 | 0.20 |
| Mean Y-axis ang. vel. (deg/s) | 58.07 ± 5.23 | 69.93 ± 10.07 | 41 | −0.50 | −0.37 | −0.90 | 0.54 | 0.08 | 17.40 |
| Max X-axis ang. vel. (deg/s) | 397.95 ± 136.75 | 329.90 ± 139.25 | 57 | 0.33 | 0.18 | 0.70 | 0.52 | 0.30 | 0.38 |
| Max X-axis ang. vel. × Height (deg·m/s) | 690.15 ± 241.87 | 574.03 ± 278.02 | 56 | 0.31 | 0.20 | 0.70 | 0.51 | 0.31 | 0.39 |
| Max Y-axis ang. vel. × Height (deg·m/s) | 522.79 ± 75.12 | 621.04 ± 143.92 | 47 | −0.13 | −0.03 | −0.30 | 0.51 | 0.35 | 3.75 |
| Walk time (s) | 8.94 ± 1.84 | 8.53 ± 2.10 | 54 | 0.18 | 0.10 | −0.30 | 0.50 | 0.02 | 5.61 |
| Turn mid-point time (s) | 5.99 ± 1.43 | 4.84 ± 1.40 | 59. | 0.38 | 0.36 | 0.20 | 0.49 | 0.03 | 5.27 |
| Magnitude range at mid-swing points (deg/s) | 199.31 ± 40.43 | 198.76 ± 119.76 | 54 | 0.30 | 0.28 | 0.00 | 0.48 | 0.07 | 5.69 |
| Return from turn time (s) | 6.34 ± 0.87 | 6.55 ± 0.88 | 48 | −0.06 | −0.16 | 0.00 | 0.47 | 0.33 | 7.80 |
| Ratio strides/turning time | 0.67 ± 0.12 | 0.78 ± 0.43 | 54 | −0.08 | −0.19 | 0.30 | 0.46 | 0.24 | 0.10 |
| Min Z-axis ang. vel. × Height (deg·m/s) | −367.52 ± 74.68 | −363.26 ± 87.86 | 51 | 0.01 | −0.15 | 0.10 | 0.45 | 0.42 | 6.45 |
| Max Z-axis ang. vel. × Height (deg·m/s) | 385.15 ± 86.89 | 434.88 ± 34.78 | 45 | −0.21 | −0.18 | 0.40 | 0.42 | 1.49 | 1.16 |
| Min Y-axis ang. vel. × Height (deg·m/s) | −343.45 ± 72.88 | −437.32 ± 119.89 | 58 | 0.19 | −0.10 | 0.50 | 0.41 | 0.31 | 3.56 |
| Turning time (s) | 2.99 ± 0.54 | 3.00 ± 0.54 | 52 | 0.17 | −0.09 | 0.50 | 0.41 | 0.23 | 0.90 |
| Min Y-axis ang. vel. (deg/s) | −198.00 ± 38.24 | −260.72 ± 90.53 | 58 | 0.11 | −0.07 | 0.50 | 0.35 | 0.33 | 6.17 |
| Time to stand (s) | 2.07 ± 0.69 | 1.17 ± 0.31 | 63.5 | 0.52 * | 0.48 | 0.72 | 0.35 | 0.18 | 0.74 |
| Max Z-axis ang. vel. (deg/s) | 223.24 ± 50.55 | 254.43 ± 21.03 | 45 | −0.21 | −0.18 | 0.00 | 0.33 | 1.55 | 1.87 |
| TUG test time (s) | 12.33 ± 2.11 | 11.39 ± 2.06 | 57 | 0.31 | 0.24 | 0.20 | 0.31 | 0.12 | 8.49 |
| Max Y-axis ang. vel. (deg/s) | 302.00 ± 37.09 | 368.15 ± 109.42 | 46 | −0.08 | −0.14 | −0.30 | 0.25 | 0.23 | 6.58 |
| Mean single support | 0.39 ± 0.02 | 0.37 ± 0.06 | 57 | −0.02 | 0.03 | 0.10 | 0.25 | 0.13 | 8.85 |
| Stride velocity asymmetry (%) | 10.85 ± 17.77 | 8.50 ± 18.30 | 54 | 0.08 | −0.10 | 0.30 | 0.13 | 0.42 | 1.07 |
| CV X-axis ang. vel. (%) | 115.90 ± 8.89 | 117.16 ± 24.26 | 59 | 0.17 | 0.20 | 0.80 | 0.12 | 0.07 | 2.78 |
| Stance time asymmetry (%) | −0.06 ± 18.66 | −6.24 ± 22.11 | 57 | 0.13 | 0.35 | 0.80 | 0.09 | 0.93 | 2.74 |
| Mean X-axis ang. vel. (deg/s) | 54.77 ± 9.19 | 53.40 ± 6.21 | 52 | 0.10 | 0.24 | 0.00 | 0.09 | 0.13 | 0.09 |
| Mean X-axis ang. vel. × Height (deg·m/s) | 94.50 ± 15.62 | 90.80 ± 4.62 | 53 | 0.12 | 0.27 | 0.00 | 0.09 | 0.12 | 0.02 |
Appendix B.3. PD2 Dataset
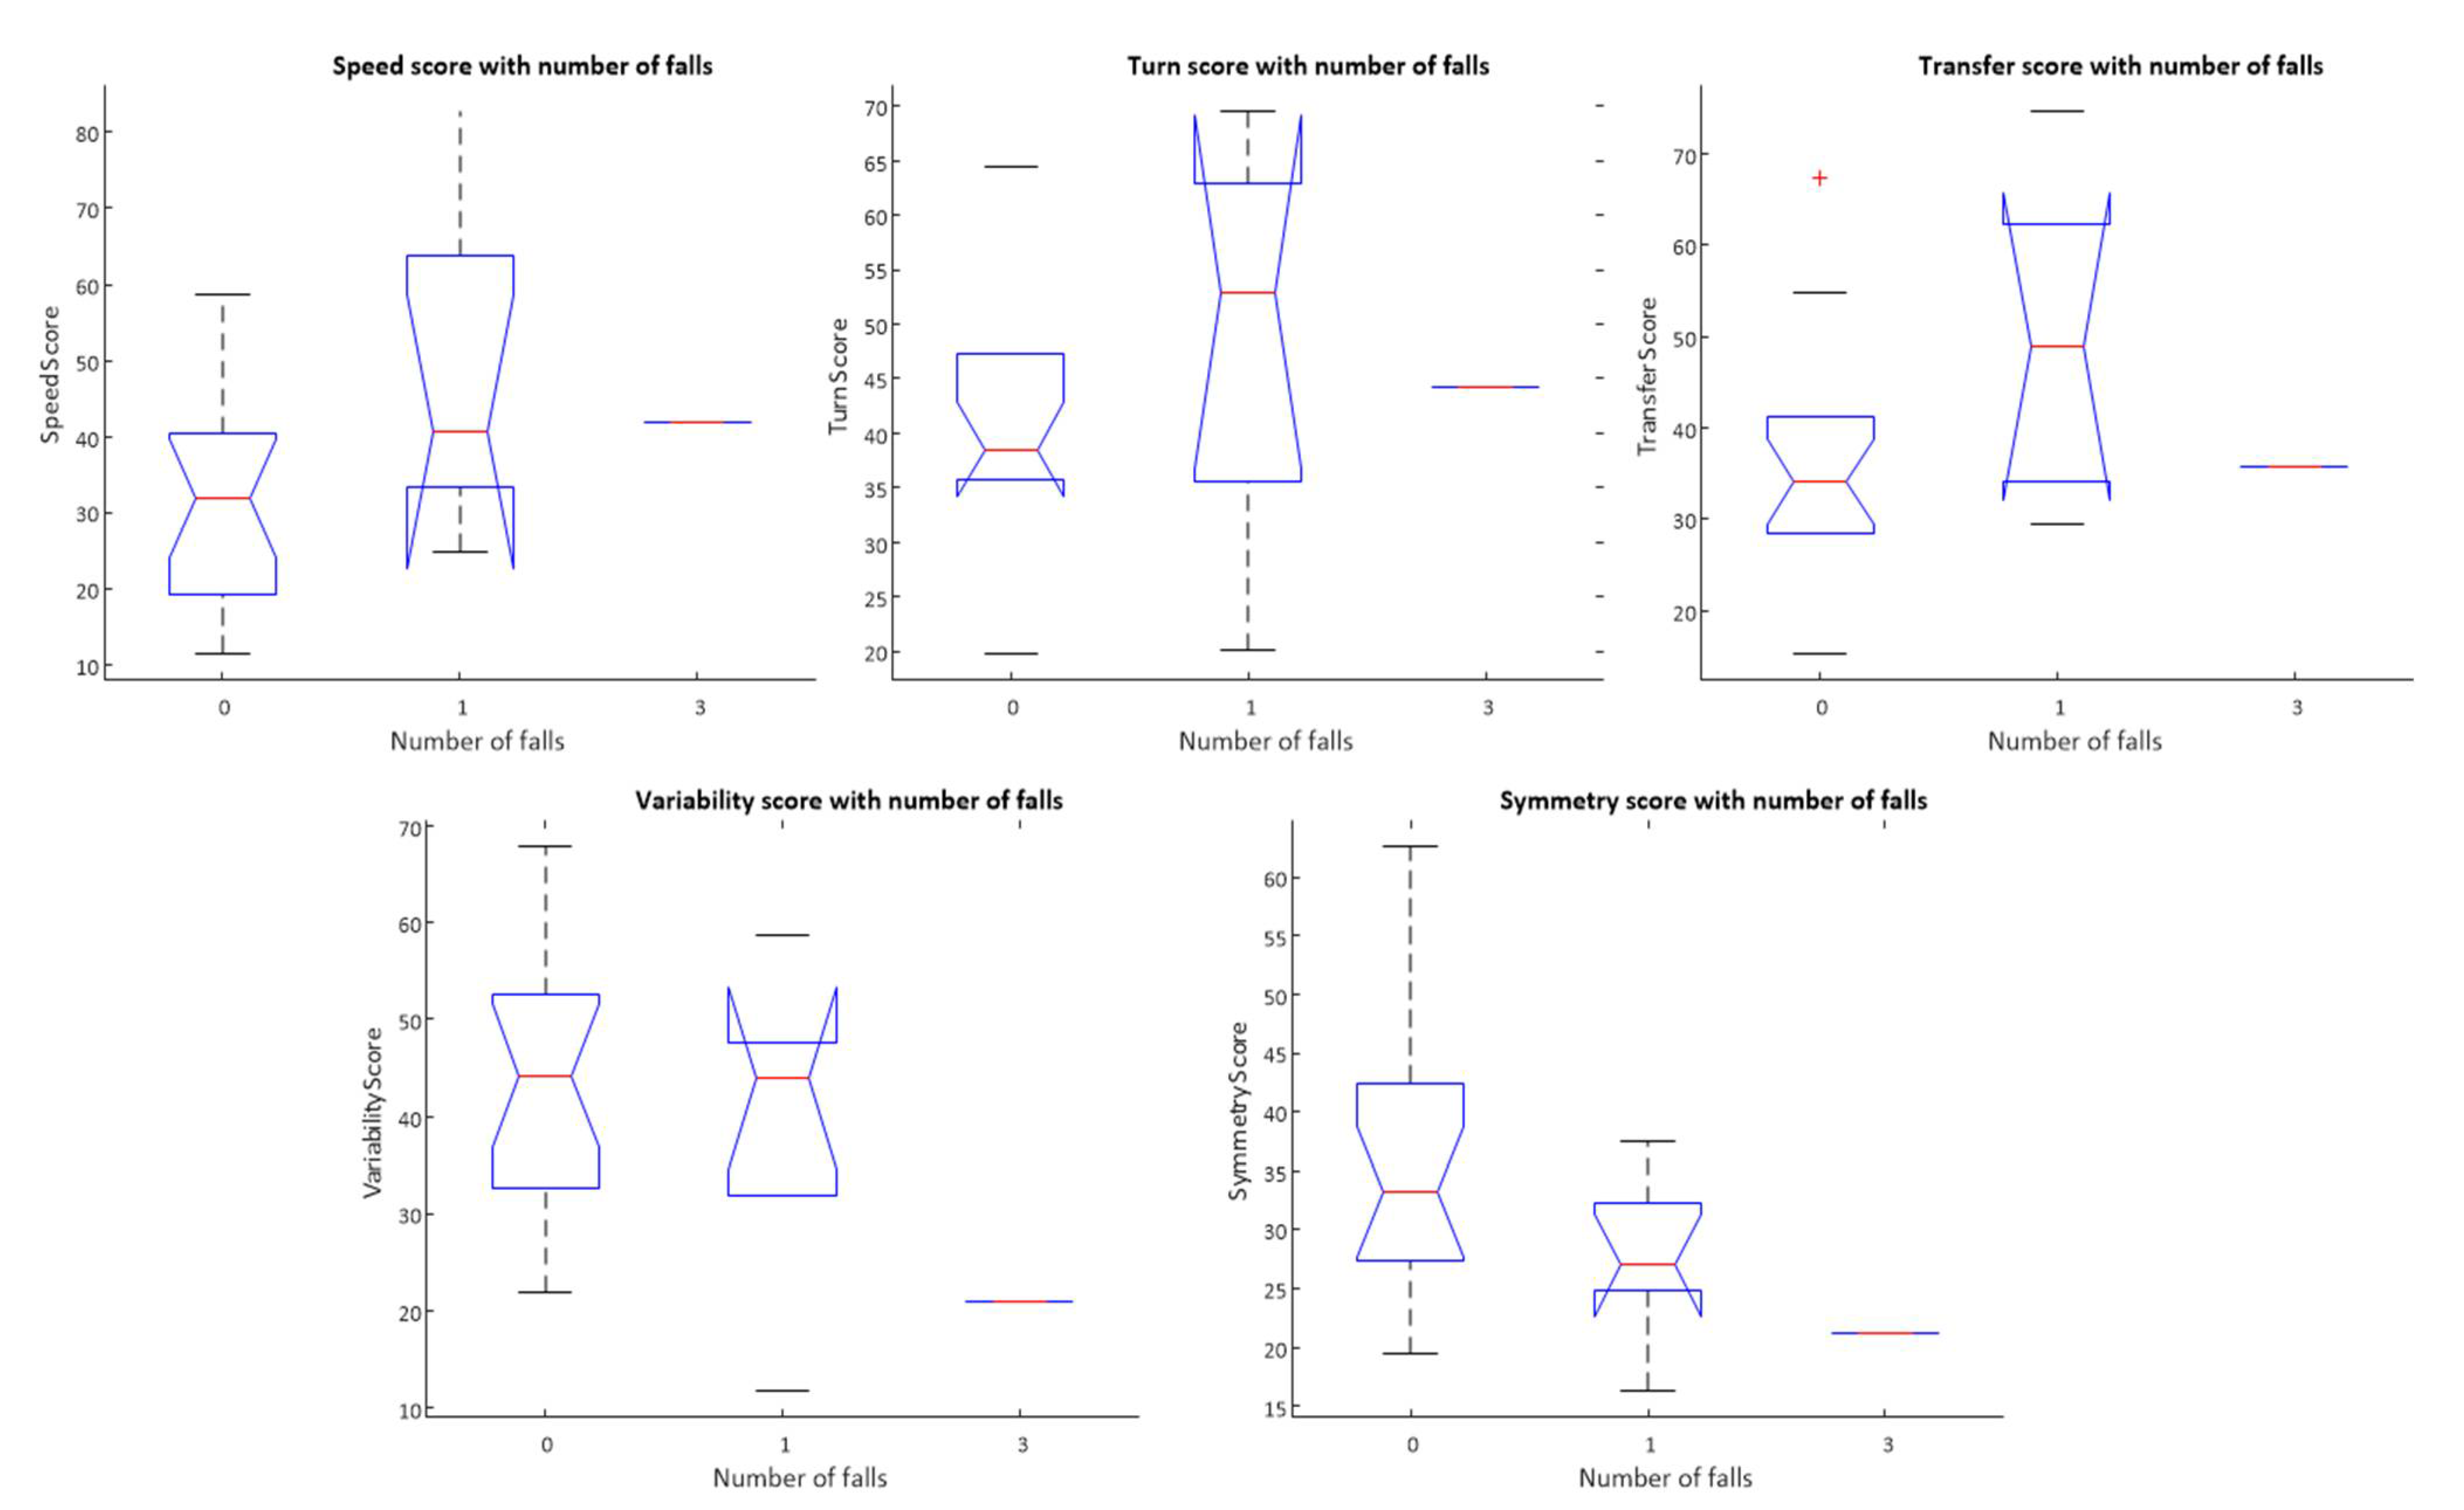
- Speed score, F = 2.09, p = 0.15
- Turn score, F = 0.71, p-value: 0.50
- Transfer score, F = 2.14, p = 0.14
- Variability score, F = 1.3, p = 0.29
- Symmetry score, F = 2.41, p = 0.11

| Mann–Whitney | Spearman | Anova | |||||||
|---|---|---|---|---|---|---|---|---|---|
| Parameter Name | Faller (Mean ± std) | Non-Faller (Mean ± std) | U | ρ (All) | Ρ (M) | ρ (F) | F (All) | F (M) | F (F) |
| Min X-axis ang. vel. (deg/s) | −547.81 ± 150.96 | −565.14 ± 93.27 | 119 | 0.07 | 0.44 | −0.33 | 2.89 | 6.09 * | 1.43 |
| Ratio strides/turning time | 1.36 ± 0.24 | 1.10 ± 0.29 | 142.5 | 0.41 * | 0.39 | 0.40 | 2.81 | 2.87 | 1.08 |
| Number of gait cycles | 6.88 ± 1.45 | 5.39 ± 1.38 | 144.5 * | 0.42 * | 0.43 | 0.47 | 2.75 | 4.96 * | 0.87 |
| Min X-axis ang. vel. × Height (deg·m/s) | −927.44 ± 242.36 | −972.68 ± 174.56 | 122 | 0.11 | 0.38 | −0.33 | 2.66 | 4.28 | 1.60 |
| Mean stride length (cm/s) | 112.10 ± 12.10 | 126.20 ± 14.58 | 71 * | −0.41 * | −0.22 | −0.60 | 2.55 | 1.32 | 1.63 |
| Number of steps | 14.13 ± 3.30 | 11.28 ± 2.66 | 143.5 * | 0.41 * | 0.41 | 0.52 | 2.46 | 5.18 * | 1.05 |
| Time to stand (s) | 1.37 ± 0.37 | 1.00 ± 0.41 | 148 * | 0.45 * | 0.44 | 0.53 | 2.14 | 3.57 | 0.91 |
| Stance time variability (%) | 31.96 ± 16.77 | 41.87 ± 17.52 | 85 | −0.28 | −0.03 | −0.40 | 1.73 | 0.02 | 0.59 |
| Time to Sit (s) | 2.10 ± 1.87 | 1.40 ± 0.46 | 118.5 | 0.08 | 0.60 * | −0.32 | 1.67 | 10.53 * | 0.82 |
| Turn mid-point time (s) | 4.38 ± 1.35 | 3.47 ± 0.98 | 139 | 0.35 | 0.47 | 0.43 | 1.67 | 6.59 * | 1.21 |
| TUG test time (s) | 10.04 ± 3.90 | 7.95 ± 1.93 | 137 | 0.32 | 0.54 * | 0.43 | 1.63 | 9.33 * | 0.35 |
| Cadence (steps/min) | 124.28 ± 14.23 | 114.54 ± 13.54 | 138 | 0.35 | 0.09 | 0.53 | 1.57 | 0.00 | 0.32 |
| Step time asymmetry (%) | −5.28 ± 8.07 | 4.56 ± 15.91 | 85 | −0.23 | −0.44 | 0.16 | 1.52 | 2.77 | 0.17 |
| Double support variability (%) | 44.87 ± 22.83 | 59.47 ± 24.87 | 80 | −0.06 | 1.44 | 0.00 | 1.21 | ||
| Return from turn time (s) | 5.66 ± 2.73 | 4.48 ± 1.05 | 124 | 0.16 | 0.54 * | 0.00 | 1.43 | 8.86 * | 0.04 |
| Single support variability (%) | 14.63 ± 6.29 | 15.72 ± 8.02 | 105 | −0.07 | 0.09 | −0.33 | 1.40 | 0.27 | 1.18 |
| Number of strides in turn | 2.75 ± 0.66 | 2.28 ± 0.65 | 131.5 | 0.30 | 0.51 * | 0.30 | 1.36 | 5.41 * | 1.00 |
| Min Z-axis ang. vel. × Height (deg·m/s) | −344.60 ± 89.50 | −428.51 ± 142.38 | 133 | 0.26 | 0.54 * | −0.05 | 1.35 | 4.26 | 0.09 |
| Mean stride time (s) | 0.99 ± 0.13 | 1.09 ± 0.15 | 75 | −0.38 | −0.16 | −0.48 | 1.29 | 0.05 | 0.23 |
| Min Z-axis ang. vel. (deg/s) | −204.88 ± 60.36 | −248.61 ± 78.34 | 133 | 0.25 | 0.63 * | −0.05 | 1.20 | 5.03 * | 0.04 |
| Mean Z-axis ang. vel. × Height (deg·m/s) | 58.29 ± 21.38 | 73.53 ± 22.58 | 79 | −0.32 | −0.60 * | −0.09 | 1.16 | 5.47 * | 0.23 |
| CV Y-axis ang. vel. (%) | 102.25 ± 12.24 | 99.47 ± 4.61 | 111 | 0.00 | 0.66 * | −0.48 | 1.09 | 26.42 * | 0.33 |
| Max X-axis ang. vel. (deg/s) | 513.96 ± 130.46 | 521.80 ± 115.13 | 108 | 0.04 | −0.13 | 0.26 | 1.08 | 0.24 | 0.99 |
| Mean stance time (s) | 0.54 ± 0.12 | 0.63 ± 0.14 | 84 | −0.27 | −0.06 | −0.17 | 1.05 | 0.12 | 0.06 |
| Max Y-axis ang. vel. × Height (deg·m/s) | 695.89 ± 97.81 | 754.29 ± 87.17 | 87 | −0.24 | −0.28 | −0.21 | 1.02 | 3.30 | 0.31 |
| Mean Z-axis ang. vel. (deg/s) | 34.69 ± 13.72 | 42.57 ± 12.00 | 81 | −0.30 | −0.66 * | −0.02 | 0.97 | 6.72 * | 0.28 |
| Mean Y-axis ang. vel. × Height (deg·m/s) | 151.04 ± 34.21 | 164.50 ± 22.61 | 97 | −0.10 | −0.54 * | 0.00 | 0.95 | 7.95 * | 0.00 |
| Walk time (s) | 6.97 ± 2.05 | 5.96 ± 1.43 | 128 | 0.23 | 0.41 | 0.36 | 0.94 | 5.11 * | 0.36 |
| Mean step time (s) | 0.47 ± 0.05 | 0.50 ± 0.05 | 83 | −0.28 | −0.03 | −0.29 | 0.94 | 0.01 | 0.45 |
| Mean X-axis ang. vel. × Height (deg·m/s) | 123.93 ± 36.45 | 134.50 ± 26.58 | 95 | −0.11 | −0.57 * | 0.24 | 0.91 | 6.50 * | 0.08 |
| Stride time variability (%) | 18.36 ± 10.00 | 24.30 ± 12.92 | 93 | −0.19 | −0.03 | −0.09 | 0.90 | 0.04 | 0.12 |
| Max X-axis ang. vel. × Height (deg·m/s) | 871.44 ± 218.31 | 900.28 ± 220.22 | 100 | −0.05 | −0.09 | 0.26 | 0.88 | 0.12 | 1.13 |
| Mean single support | 0.47 ± 0.06 | 0.44 ± 0.05 | 125 | 0.17 | 0.06 | −0.14 | 0.82 | 0.11 | 0.35 |
| Mean X-axis ang. vel. (deg/s) | 73.60 ± 23.74 | 78.21 ± 14.57 | 99 | −0.07 | −0.60 * | 0.24 | 0.77 | 9.83 * | 0.03 |
| Walk ratio | 1.26 ± 0.28 | 1.32 ± 0.20 | 87 | −0.26 | 0.09 | −0.77 * | 0.76 | 0.63 | 2.77 |
| Mean stride velocity (cm/s) | 110.73 ± 11.71 | 118.38 ± 15.12 | 86 | −0.24 | −0.31 | −0.60 | 0.75 | 1.80 | 1.66 |
| Max Y-axis ang. vel. (deg/s) | 410.66 ± 64.62 | 439.30 ± 46.89 | 100 | −0.10 | −0.41 | −0.28 | 0.73 | 6.76 * | 0.61 |
| Step time variability (%) | 14.55 ± 3.67 | 18.03 ± 7.57 | 93 | −0.16 | −0.16 | 0.05 | 0.69 | 0.72 | 0.04 |
| Mean Y-axis ang. vel. (deg/s) | 89.57 ± 22.92 | 95.83 ± 12.59 | 102 | −0.05 | −0.57 * | −0.16 | 0.67 | 12.42 * | 0.05 |
| Magnitude range at mid-swing points (deg/s) | 231.85 ± 38.68 | 262.60 ± 68.58 | 92 | −0.17 | −0.16 | −0.38 | 0.63 | 0.37 | 0.89 |
| Max Z-axis ang. vel. x Height (deg·m/s) | 370.38 ± 138.85 | 439.48 ± 145.56 | 85 | −0.25 | −0.54 * | −0.09 | 0.57 | 4.23 | 0.48 |
| Mean swing time (s) | 0.45 ± 0.05 | 0.46 ± 0.05 | 92 | −0.20 | 0.06 | −0.47 | 0.51 | 0.04 | 0.97 |
| Swing time asymmetry (%) | −1.15 ± 6.95 | 5.01 ± 15.92 | 93 | −0.17 | −0.25 | −0.12 | 0.50 | 0.76 | 0.04 |
| Mean double support | 0.11 ± 0.06 | 0.15 ± 0.08 | 94 | −0.16 | −0.03 | −0.10 | 0.45 | 0.02 | 0.11 |
| Max Z-axis ang. vel. (deg/s) | 220.89 ± 90.20 | 254.29 ± 77.16 | 88 | −0.22 | −0.57 * | 0.05 | 0.42 | 5.17 * | 0.54 |
| Min Y-axis ang. vel. × Height (deg·m/s) | −448.05 ± 67.60 | −505.38 ± 184.20 | 119 | 0.11 | 0.06 | 0.26 | 0.34 | 0.26 | 0.62 |
| Min Y-axis ang. vel. (deg/s) | −263.50 ± 40.48 | −293.17 ± 98.47 | 119 | 0.11 | 0.06 | 0.46 | 0.32 | 0.41 | 0.90 |
| CV X-axis ang. vel. (%) | 112.51 ± 11.99 | 114.59 ± 8.75 | 107 | −0.04 | 0.25 | −0.12 | 0.25 | 0.58 | 0.01 |
| CV Z-axis ang. vel. (%) | 114.45 ± 10.74 | 116.44 ± 10.80 | 97 | −0.10 | −0.31 | −0.03 | 0.25 | 0.43 | 0.13 |
| Swing time variability (%) | 17.52 ± 7.16 | 19.20 ± 9.93 | 101 | −0.09 | 0.09 | −0.38 | 0.25 | 0.02 | 0.46 |
| Magnitude mean at mid-swing points (deg/s) | 319.85 ± 61.43 | 331.20 ± 33.43 | 111 | 0.03 | −0.35 | −0.09 | 0.22 | 5.54 * | 0.31 |
| Stride length asymmetry (%) | −8.04 ± 14.32 | −8.47 ± 19.78 | 112 | 0.03 | −0.22 | 0.13 | 0.21 | 0.75 | 1.49 |
| Turning time (s) | 2.05 ± 0.41 | 2.10 ± 0.48 | 108 | −0.02 | 0.28 | 0.07 | 0.16 | 0.67 | 0.06 |
| CV stride velocity (%) | 39.37 ± 8.67 | 38.05 ± 12.71 | 119 | 0.11 | 0.31 | −0.15 | 0.11 | 0.63 | 0.06 |
| Stride velocity asymmetry (%) | −5.78 ± 11.33 | −3.46 ± 17.00 | 102 | −0.09 | −0.09 | −0.16 | 0.10 | 0.47 | 0.17 |
| Turn magnitude (deg/s) | 141.09 ± 143.28 | 135.91 ± 104.43 | 101 | −0.09 | −0.44 | 0.05 | 0.09 | 2.61 | 0.37 |
| Stance time asymmetry (%) | −5.88 ± 22.93 | −10.84 ± 29.75 | 116 | 0.09 | 0.09 | 0.05 | 0.09 | 0.25 | 0.09 |
| CV stride length (%) | 31.76 ± 10.14 | 34.03 ± 13.32 | 106 | −0.01 | 0.25 | −0.13 | 0.08 | 0.41 | 1.05 |
| Stride time asymmetry (%) | −4.09 ± 12.40 | −5.59 ± 16.93 | 111 | 0.03 | 0.06 | −0.07 | 0.03 | 0.06 | 0.08 |
Appendix C. Model Training Performance
| All | N | R2 | RMSE | ρ | #Features |
| TD-All | 1015 | 0.08 | 0.46 | 0.29 | 16 |
| TD-Fallers | 347 | 0.03 | 0.51 | 0.19 | 17 |
| TD-PD | 29 | 0.25 | 0.57 | 0.62 | 0 |
| TD-Fallers-PD | 19 | 0.04 | 0.69 | 0.33 | 0 |
| TD-NoPD | 986 | 0.08 | 0.45 | 0.30 | 17 |
| TD-Fallers-NoPD | 328 | 0.04 | 0.49 | 0.21 | 19 |
| Ensemble-TD -PD | 29 | 0.07 | 0.63 | 0.24 | 2 |
| Male | N | R2 | RMSE | ρ | #Features |
| TD -All | 344 | 0.00 | 0.46 | 0.29 | 3 |
| TD-Fallers | 86 | 0.02 | 0.58 | 0.27 | 5 |
| TD-PD | 18 | 0.04 | 0.49 | 0.64 | 3 |
| TD-Fallers-PD | 11 | 0.10 | 0.42 | 0.83 | 10 |
| TD-NoPD | 326 | 0.11 | 0.42 | 0.38 | 19 |
| TD-Fallers-NoPD | 75 | 0.09 | 0.57 | 0.33 | 12 |
| Ensemble-TD-PD | 18 | 0.04 | 0.49 | 0.09 | 2 |
| Female | N | R2 | RMSE | ρ | #Features |
| TD-All | 671 | 0.07 | 0.47 | 0.27 | 11 |
| TD-Fallers | 261 | 0.08 | 0.47 | 0.28 | 17 |
| TD-PD | 11 | 0.03 | 0.78 | 0.76 | 3 |
| TD-Fallers-PD | 8 | 0.63 | 0.52 | 0.85 | 19 |
| TD-NoPD | 660 | 0.05 | 0.46 | 0.26 | 9 |
| TD-Fallers-NoPD | 253 | 0.08 | 0.44 | 0.27 | 16 |
| Ensemble-TD-PD | 18 | 0.23 | 0.70 | 0.50 | 2 |


Appendix D. Model Coefficients
| All | Male | Female | |||
|---|---|---|---|---|---|
| Beta | Features | Beta | Features | Beta | Features |
| 0.268767 | Intercept | −1.43612 | Intercept | −0.48572 | Intercept |
| −0.71395 | single_support | 0.004605 | TurnTime | −0.02719 | single_support |
| −0.00214 | swing_CV | −0.00196 | AV_AP_CV | −0.00117 | swing_CV |
| −0.01688 | AV_ML_CV | −0.00319 | AV_V_CV | 0.035354 | TurnTime |
| 0.049997 | TurnTime | 0.001368 | TurnEndTime | ||
| −0.02888 | AV_AP_CV | −0.00102 | AV_AP_CV | ||
| −0.03023 | AV_V_CV | −0.00245 | AV_V_CV | ||
| 9.38 × 10⁻⁵ | AV_V_min | 0.000345 | AV_V_min | ||
| −0.00293 | MeanVelocity | −0.00183 | MeanVelocity | ||
| −0.00191 | VelocityCV | −0.00354 | MeanStrideLen | ||
| −0.00544 | MeanStrideLen | 0.000317 | AV_V_minByH | ||
| 0.000265 | AV_V_minByH | 0.005656 | ManualTUG | ||
| 0.003158 | ManualTUG | ||||
| All | Male | Female | |||
|---|---|---|---|---|---|
| Beta | Features | Beta | Features | Beta | Features |
| −0.61432 | Intercept | −0.81756 | Intercept | 0.678357 | Intercept |
| −3.9 × 10⁻⁵ | AV_ML_max | 0.000941 | GaitCycles | −0.00501 | single_support |
| 0.000163 | AV_ML_min | −7.5 × 10⁻⁶ | AV_mid_swing_mean | −0.07407 | single_support_CV |
| 0.000448 | GaitCycles | −0.00058 | AV_turn_mag | −0.0037 | swing_CV |
| −7 × 10⁻⁵ | AV_mid_swing_mean | −8 × 10⁻⁵ | MeanVelocity | −0.00023 | Cadence |
| −0.00021 | AV_turn_mag | 0.00018 | ManualTUG | −4.4 Page: 23 × 10−5 | AV_turn_mag |
| −0.00013 | AV_V_max | −0.00302 | AV_V_mean | ||
| −0.00091 | MeanVelocity | −0.00041 | AV_V_max | ||
| −0.00084 | MeanStrideLen | 0.000281 | AV_V_min | ||
| −0.00016 | AV_ML_maxByH | −0.02218 | VelocityCV | ||
| 0.000205 | AV_ML_minByH | −0.00524 | MeanStrideLen | ||
| −6.5 × 10⁻⁵ | AV_V_maxByH | −0.03254 | StrideLenCV | ||
| 0.007641 | ManualTUG | −3.3 × 10⁻⁵ | AV_ML_maxByH | ||
| 0.000551 | AV_ML_minByH | ||||
| −0.0028 | AV_V_meanByH | ||||
| −0.00051 | AV_V_maxByH | ||||
| 0.000429 | AV_V_minByH | ||||
| 0.007744 | ManualTUG | ||||
| All | Male | Female | |||
|---|---|---|---|---|---|
| Beta | Features | Beta | Features | Beta | Features |
| −1.34037 | Intercept | −0.9424 | Intercept | −0.01892 | Intercept |
| −0.15412 | single_support_CV | 0.037872 | stance_CV | −3.2 × 10⁻⁵ | AV_AP_max |
| 0.009744 | stance_CV | 0.067785 | swing_CV | 0.010441 | MeanTurningTime |
| 0.113734 | swing_CV | 6.52 × 10⁻⁵ | AV_ML_maxByH | −4 × 10⁻⁵ | AV_AP_maxByH |
| −0.07459 | step_CV | ||||
| 0.001598 | AV_ML_max | ||||
| 0.093939 | AV_ML_CV | ||||
| −0.00088 | AV_turn_mag | ||||
| −0.02979 | TurnTime | ||||
| 0.081551 | AV_AP_CV | ||||
| −0.00035 | AV_AP_mean | ||||
| −0.00057 | AV_AP_max | ||||
| 0.189167 | AV_V_CV | ||||
| −0.16128 | StrideLenCV | ||||
| 0.055812 | MeanStepsTurn | ||||
| 9.12 × 10⁻⁵ | AV_ML_maxByH | ||||
| −0.0004 | AV_AP_meanByH | ||||
| −0.00035 | AV_AP_maxByH | ||||
| −8.6 × 10⁻⁵ | AV_V_maxByH | ||||
| All | Male | Female | |||
|---|---|---|---|---|---|
| Beta | Features | Beta | Features | Beta | Features |
| −2.00125 | Intercept | −1.3143 | Intercept | 0.241844 | Intercept |
| 0.316766 | AV_V_CV | −0.00523 | single_support_CV | 0.92493 | double_support |
| 0.000114 | AV_ML_minByH | 0.380233 | swing | −0.53451 | single_support |
| 0.000257 | ManualTUG | 0.095187 | swing_CV | −1.63885 | swing |
| −0.00655 | GaitCycles | −0.14224 | step_CV | ||
| −0.00101 | StepNo | 0.000438 | AV_ML_min | ||
| 0.001431 | AV_V_CV | 0.031803 | GaitCycles | ||
| 4.5 × 10⁻⁵ | AV_V_max | 0.00999 | StepNo | ||
| −0.00066 | MeanStepsTurn | −0.00067 | AV_AP_mean | ||
| 4.82 × 10⁻⁵ | AV_V_maxByH | 0.070045 | AV_V_CV | ||
| −0.00479 | ManualTUG | −0.00041 | AV_V_mean | ||
| −0.00155 | MeanStrideLen | ||||
| 0.1255 | MeanTurningTime | ||||
| 0.078945 | MeanStepsTurn | ||||
| 0.115859 | MeanTurnRatio | ||||
| −0.00015 | AV_ML_meanByH | ||||
| 0.000433 | AV_ML_minByH | ||||
| −0.00052 | AV_AP_meanByH | ||||
| −1.4 × 10⁻⁵ | AV_AP_maxByH | ||||
| −0.00048 | AV_V_meanByH | ||||
| All | Male | Female | |||
|---|---|---|---|---|---|
| Beta | Features | Beta | Features | Beta | Features |
| 0.065301385 | Intercept | −0.27568 | Intercept | −0.7974 | Intercept |
| 0.018407619 | double_support | −0.64365 | single_support | 0.000294 | WalkTime |
| −0.636511776 | single_support | 0.012447 | single_support_CV | 0.001582 | GaitCycles |
| −0.019776173 | AV_ML_CV | 0.106376 | stance | 0.027008 | TurnTime |
| −0.000217534 | Cadence | 0.455945 | stride | 0.001196 | TurnEndTime |
| 0.051661245 | TurnTime | −0.07504 | AV_ML_CV | 0.000128 | AV_V_min |
| −0.028394423 | AV_AP_CV | −0.00496 | Cadence | −0.00115 | MeanVelocity |
| −0.030063354 | AV_V_CV | −0.00126 | AV_turn_mag | −0.00228 | MeanStrideLen |
| 1.30698 × 10⁻⁵ | AV_V_min | 0.05316 | TurnTime | 0.00015 | AV_V_minByH |
| −0.00240226 | MeanVelocity | −0.08651 | AV_AP_CV | 0.003563 | ManualTUG |
| −0.000603359 | VelocityCV | −0.0796 | AV_V_CV | ||
| −0.005019106 | MeanStrideLen | 0.005054 | AV_V_mean | ||
| 0.000201194 | AV_V_minByH | 0.000411 | AV_V_max | ||
| 0.003828431 | ManualTUG | −0.0005 | AV_V_min | ||
| −0.00456 | MeanVelocity | ||||
| −0.00429 | MeanStrideLen | ||||
| 0.001651 | AV_V_meanByH | ||||
| 4.84 × 10⁻⁵ | AV_V_maxByH | ||||
| −0.00022 | AV_V_minByH | ||||
| 0.011925 | ManualTUG | ||||
| All | Male | Female | |||
|---|---|---|---|---|---|
| Beta | Features | Beta | Features | Beta | Features |
| −0.360429 | Intercept | −0.58931 | Intercept | 0.636402 | Intercept |
| −0.001329 | stance_CV | −0.52148 | single_support | −0.05248 | single_support_CV |
| −5.32 × 10⁻⁵ | AV_ML_max | −0.1655 | swing | −0.00303 | stride_CV |
| 2.381 × 10⁻⁵ | AV_ML_min | 0.002619 | WalkTime | −0.00172 | Cadence |
| −0.003735 | AV_ML_CV | 0.030711 | GaitCycles | 0.000913 | TurnEndTime |
| 0.001525 | WalkTime | 0.01269 | StepNo | −0.00126 | AV_V_mean |
| 0.0003581 | GaitCycles | −0.00046 | AV_mid_swing_mean | −0.0004 | AV_V_max |
| −0.000813 | Cadence | −0.00163 | AV_turn_mag | 0.000391 | AV_V_min |
| −0.000133 | AV_mid_swing_mean | −6.4 × 10⁻⁵ | AV_AP_mean | −0.03916 | VelocityCV |
| −0.00028 | AV_turn_mag | −0.00157 | MeanVelocity | −0.00515 | MeanStrideLen |
| −0.002004 | AV_AP_CV | −0.01273 | MeanTurnRatio | −0.03979 | StrideLenCV |
| −0.003814 | AV_V_CV | −0.00011 | AV_AP_meanByH | −0.00012 | AV_ML_maxByH |
| −0.000311 | AV_V_max | 0.003843 | ManualTUG | 0.000233 | AV_ML_minByH |
| −0.001205 | MeanVelocity | −0.00161 | AV_V_meanByH | ||
| −0.006212 | VelocityCV | −0.00045 | AV_V_maxByH | ||
| −0.001575 | MeanStrideLen | 0.000453 | AV_V_minByH | ||
| −0.000173 | AV_ML_maxByH | 0.006292 | ManualTUG | ||
| 0.0001248 | AV_ML_minByH | ||||
| −0.000177 | AV_V_maxByH | ||||
| 0.0083301 | ManualTUG | ||||
| All | Male | Female | |||
|---|---|---|---|---|---|
| Beta | Dataset | Beta | Dataset | Beta | Dataset |
| −6.3744604 | TD-NoPD | −2.08471 | TD-NoPD | −7.93649 | TD-NoPD |
| 4.90488203 | TD-Fallers-NoPD | −0.27718 | TD-Fallers-NoPD | 8.236352 | TD-Fallers-NoPD |
References
- De Lau, L.M.L.; Breteler, M.M.B. Epidemiology of Parkinson’s disease. Lancet Neurol. 2006, 5, 525–535. [Google Scholar] [CrossRef]
- Huse, D.M.; Schulman, K.; Orsini, L.; Castelli-Haley, J.; Kennedy, S.; Lenhart, G. Burden of illness in Parkinson’s disease. Mov. Disord. 2005, 20, 1449–1454. [Google Scholar] [CrossRef]
- Kowal, S.L.; Dall, T.M.; Chakrabarti, R.; Storm, M.V.; Jain, A. The current and projected economic burden of Parkinson’s disease in the United States. Mov. Disord. 2013, 28, 311–318. [Google Scholar] [CrossRef]
- Findley, L.J. The economic impact of Parkinson’s disease. Parkinsonism Relat. Disord. 2007, 13, S8–S12. [Google Scholar] [CrossRef] [PubMed]
- Jankovic, J. Parkinson’s disease: Clinical features and diagnosis. J. Neurol. Neurosurg. Psychiatry 2008, 79, 368–376. [Google Scholar] [CrossRef] [Green Version]
- Bloem, B.R.; Hausdorff, J.M.; Visser, J.E.; Giladi, N. Falls and freezing of gait in Parkinson’s disease: A review of two interconnected, episodic phenomena. Mov. Disord. 2004, 19, 871–884. [Google Scholar] [CrossRef]
- Stolze, H.; Klebe, S.; Zechlin, C.; Baecker, C.; Friege, L.; Deuschl, G. Falls in frequent neurological diseases. J. Neurol. 2004, 251, 79–84. [Google Scholar] [CrossRef] [PubMed]
- Kalilani, L.; Asgharnejad, M.; Palokangas, T.; Durgin, T. Comparing the Incidence of Falls/Fractures in Parkinson’s Disease Patients in the US Population. PLoS ONE 2016, 11, e0161689. [Google Scholar] [CrossRef]
- Bloem, B.R.; Grimbergen, Y.A.; Cramer, M.; Willemsen, M.; Zwinderman, A.H. Prospective assessment of falls in Parkinson’s disease. J. Neurol. 2001, 248, 950–958. [Google Scholar] [CrossRef]
- Rudzińska, M.; Bukowczan, S.; Stożek, J.; Zajdel, K.; Mirek, E.; Chwała, W.; Wójcik-Pędziwiatr, M.; Banaszkiewicz, K.; Szczudlik, A. The incidence and risk factors of falls in Parkinson disease: Prospective study. Neurol. Neurochir. Pol. 2013, 47, 431–437. [Google Scholar] [CrossRef]
- Wood, S.J.; Ramsdell, C.D.; Mullen, T.J.; Oman, C.M.; Harm, D.L.; Paloski, W.H. Transient cardio-respiratory responses to visually induced tilt illusions. Brain Res. Bull. 2000, 53, 25–31. Available online: https://pubmed.ncbi.nlm.nih.gov/11033205/ (accessed on 19 December 2021). [CrossRef]
- Neumann, S.; Taylor, J.; Bamford, A.; Metcalfe, C.; Gaunt, D.M.; Whone, A.; Steeds, D.; Emmett, S.R.; Hollingworth, W.; Ben-Shlomo, Y.; et al. Cholinesterase inhibitor to prevent falls in Parkinson’s disease (CHIEF-PD) trial: A phase 3 randomised, double-blind placebo-controlled trial of rivastigmine to prevent falls in Parkinson’s disease. BMC Neurol. 2021, 21, 422. [Google Scholar] [CrossRef]
- Henderson, E.J.; Lord, S.R.; Close, J.C.T.; Lawrence, A.D.; Whone, A.; Ben-Shlomo, Y. The ReSPonD trial—Rivastigmine to stabilise gait in Parkinson’s disease a phase II, randomised, double blind, placebo controlled trial to evaluate the effect of rivastigmine on gait in patients with Parkinson’s disease who have fallen. BMC Neurol. 2013, 13, 188. [Google Scholar] [CrossRef] [Green Version]
- Allen, N.E.; Sherrington, C.; Paul, S.S.; Canning, C.G. Balance and falls in Parkinson’s disease: A meta-analysis of the effect of exercise and motor training. Mov. Disord. 2011, 26, 1605–1615. [Google Scholar] [CrossRef] [PubMed]
- Mirelman, A.; Rochester, L.; Maidan, I.; Del Din, S.; Alcock, L.; Nieuwhof, F.; Rikkert, M.O.; Bloem, B.R.; Pelosin, E.; Avanzino, L.; et al. Addition of a non-immersive virtual reality component to treadmill training to reduce fall risk in older adults (V-TIME): A randomised controlled trial. Lancet 2016, 388, 1170–1182. [Google Scholar] [CrossRef] [Green Version]
- Pickering, R.M.; Grimbergen, Y.A.M.; Rigney, U.; Ashburn, A.; Mazibrada, G.; Wood, B.; Gray, P.; Kerr, G.; Bloem, B.R. A meta-analysis of six prospective studies of falling in Parkinson’s disease. Mov. Disord. 2007, 22, 1892–1900. [Google Scholar] [CrossRef]
- Hoffman, G.J.; Ha, J.; Alexander, N.B.; Langa, K.M.; Tinetti, M.; Min, L.C. Underreporting of Fall Injuries of Older Adults: Implications for Wellness Visit Fall Risk Screening. J. Am. Geriatr. Soc. 2018, 66, 1195–1200. [Google Scholar] [CrossRef]
- Hunter, H.; Rochester, L.; Morris, R.; Lord, S. Longitudinal falls data in Parkinson’s disease: Feasibility of fall diaries and effect of attrition. Disabil. Rehabil. 2018, 40, 2236–2241. [Google Scholar] [CrossRef] [PubMed]
- Aziz, O.; Klenk, J.; Schwickert, L.; Chiari, L.; Becker, C.; Park, E.J.; Mori, G.; Robinovitch, S.N. Validation of accuracy of SVM-based fall detection system using real-world fall and non-fall datasets. PLoS ONE 2017, 12, e0180318. [Google Scholar] [CrossRef] [Green Version]
- Bourke, A.K.; O’Brien, J.V.; Lyons, G.M. Evaluation of a threshold-based tri-axial accelerometer fall detection algorithm. Gait Posture 2007, 26, 194–199. [Google Scholar] [CrossRef]
- Chowdhury, N.; Hildebrand, A.; Folsom, J.; Jacobs, P.; Cameron, M. Are “Gold Standard” Prospective Daily Self-Report Fall Calendars Accurate? A Comparison with a Real-Time Body-Worn Self-Report Device in Multiple Sclerosis (P4.404). Neurology 2018, 90 (Suppl. 15). Available online: https://n.neurology.org/content/90/15_Supplement/P4.404 (accessed on 19 December 2021).
- Greene, B.R.; Caulfield, B.; Lamichhane, D.; Bond, W.; Svendsen, J.; Zurski, C.; Pratt, D. Longitudinal assessment of falls in Parkinson’s disease using inertial sensors and the Timed Up and Go test. Rehabil. Appl. Technol. Eng. 2018, 5. [Google Scholar] [CrossRef]
- Lord, S.; Galna, B.; Yarnall, A.J.; Coleman, S.; Burn, D.; Rochester, L. Predicting first fall in newly diagnosed Parkinson’s disease: Insights from a fall-naïve cohort. Mov. Disord. 2016, 31, 1829–1836. [Google Scholar] [CrossRef]
- Ma, L.; Mi, T.-M.; Jia, Q.; Han, C.; Chhetri, J.K.; Chan, P. Gait variability is sensitive to detect Parkinson’s disease patients at high fall risk. Int. J. Neurosci. 2020, 1–13. [Google Scholar] [CrossRef]
- Nemanich, S.T.; Duncan, R.P.; Dibble, L.E.; Cavanaugh, J.T.; Ellis, T.D.; Ford, M.P.; Foreman, K.B.; Earhart, G.M. Predictors of Gait Speeds and the Relationship of Gait Speeds to Falls in Men and Women with Parkinson Disease. Parkinson’s Dis. 2013, 2013, 141720. [Google Scholar] [CrossRef] [PubMed]
- Lo, C.; Arora, S.; Baig, F.; Lawton, M.A.; El Mouden, C.; Barber, T.R.; Ruffmann, C.; Klein, J.C.; Brown, P.; Ben-Shlomo, Y.; et al. Predicting motor, cognitive & functional impairment in Parkinson’s. Ann. Clin. Transl. Neurol. 2019, 6, 1498–1509. [Google Scholar] [CrossRef]
- Greene, B.R.; McManus, K.; Redmond, S.J.; Caulfield, B.; Quinn, C.C. Digital assessment of falls risk, frailty, and mobility impairment using wearable sensors. NPJ Digit. Med. 2019, 2, 125. [Google Scholar] [CrossRef] [PubMed] [Green Version]
- Weiss, A.; Herman, T.; Giladi, N.; Hausdorff, J.M. Objective Assessment of Fall Risk in Parkinson’s Disease Using a Body-Fixed Sensor Worn for 3 Days. PLoS ONE 2014, 9, e96675. [Google Scholar] [CrossRef] [Green Version]
- Weiss, A.; Herman, T.; Plotnik, M.; Brozgol, M.; Maidan, I.; Giladi, N.; Gurevich, T.; Hausdorff, J.M. Can an accelerometer enhance the utility of the Timed Up & Go Test when evaluating patients with Parkinson’s disease? Med. Eng. Phys. 2010, 32, 119–125. [Google Scholar] [PubMed]
- Del Din, S.; Galna, B.; Godfrey, A.; Bekkers, E.M.J.; Pelosin, E.; Nieuwhof, F.; Mirelman, A.; Hausdorff, J.M.; Rochester, L. Analysis of Free-Living Gait in Older Adults With and Without Parkinson’s Disease and With and Without a History of Falls: Identifying Generic and Disease-Specific Characteristics. J. Gerontol. Ser. A 2017, 74, 500–506. [Google Scholar] [CrossRef] [PubMed]
- Kerr, G.K.; Worringham, C.J.; Cole, M.H.; Lacherez, P.F.; Wood, J.M.; Silburn, P.A. Predictors of future falls in Parkinson disease. Neurology 2010, 75, 116–124. [Google Scholar] [CrossRef]
- Tinetti, M.E.; Franklin Williams, T.; Mayewski, R. Fall risk index for elderly patients based on number of chronic disabilities. Am. J. Med. 1986, 80, 429–434. [Google Scholar] [CrossRef]
- Fasano, A.; Canning, C.G.; Hausdorff, J.M.; Lord, S.; Rochester, L. Falls in Parkinson’s disease: A complex and evolving picture. Mov. Disord. 2017, 32, 1524–1536. [Google Scholar] [CrossRef]
- Hoskovcová, M.; Dušek, P.; Sieger, T.; Brožová, H.; Zárubová, K.; Bezdíček, O.; Šprdlík, O.; Jech, R.; Štochl, J.; Roth, J.; et al. Predicting Falls in Parkinson Disease: What Is the Value of Instrumented Testing in OFF Medication State? PLoS ONE 2015, 10, e0139849. [Google Scholar] [CrossRef]
- Duncan, R.P.; Leddy, A.L.; Cavanaugh, J.T.; Dibble, L.E.; Ellis, T.D.; Ford, M.P.; Foreman, K.B.; Earhart, G.M. Comparative Utility of the BESTest, Mini-BESTest, and Brief-BESTest for Predicting Falls in Individuals With Parkinson Disease: A Cohort Study. Phys. Ther. 2013, 93, 542–550. [Google Scholar] [CrossRef] [Green Version]
- Gerdhem, P.; Ringsberg, K.A.M.; Åkesson, K.; Obrant, K.J. Clinical history and biologic age predicted falls better than objective functional tests. J. Clin. Epidemiol. 2005, 58, 226–232. [Google Scholar] [CrossRef]
- Bogle Thorbahn, L.D.; Newton, R.A. Use of the Berg Balance Test to Predict Falls in Elderly Persons. Phys. Ther. 1996, 76, 576–583. Available online: https://pubmed.ncbi.nlm.nih.gov/8650273/ (accessed on 19 December 2021). [CrossRef] [PubMed]
- Greene, B.R.; Redmond, S.J.; Caulfield, B. Fall risk assessment through automatic combination of clinical fall risk factors and body-worn sensor data. IEEE J. Biomed. Health Inform. 2016, 21, 725–731. [Google Scholar] [CrossRef] [PubMed]
- Greene, B.R.; Doheny, E.P.; O’Halloran, A.; Kenny, R.A. Frailty status can be accurately assessed using inertial sensors and the TUG test. Age Ageing 2014, 43, 406–411. [Google Scholar] [CrossRef] [Green Version]
- Smith, E.; Walsh, L.; Doyle, J.; Greene, B.; Blake, C. The reliability of the quantitative timed up and go test (QTUG) measured over five consecutive days under single and dual-task conditions in community dwelling older adults. Gait Posture 2016, 43, 239–244. [Google Scholar] [CrossRef] [PubMed]
- Greene, B.R.; Doheny, E.P.; Walsh, C.; Cunningham, C.; Crosby, L.; Kenny, R.A. Evaluation of falls risk in community-dwelling older adults using body-worn sensors. Gerontology 2012, 58, 472–480. [Google Scholar] [CrossRef]
- Greene, B.R.; McGrath, D.; Caulfield, B. A comparison of cross-sectional and prospective algorithms for falls risk assessment. In Proceedings of the 2014 36th Annual International Conference of the IEEE Engineering in Medicine and Biology Society, Chicago, IL, USA, 26–28 August 2014; pp. 4527–4530. [Google Scholar]
- Greene, B.R.; Caulfield, B. Objective assessment of functional mobility using the TUG test. In Proceedings of the IEEE Conference on Biomedical and Health Informatics (BHI) 2018 and the IEEE Conference on Body Sensor Networks (BSN) 2018 (BHI-BSN 2018), Las Vegas, NV, USA, 4–7 March 2018. [Google Scholar]
- McManus, K.; McGrath, D.; Greene, B.R.; Lennon, O.; McMahon, L.; Caulfield, B. Impact of Exercise Intervention in Parkinson’s Disease can be Quantified Using Inertial Sensor Data and Clinical Tests. In Proceedings of the 2019 41st Annual International Conference of the IEEE Engineering in Medicine and Biology Society (EMBC), Berlin/Heidelberg, Germany, 23–27 July 2019; pp. 3507–3510. [Google Scholar]
- Greene, B.R.; O’Donovan, A.; Romero-Ortuno, R.; Cogan, L.; Ni Scanaill, C.; Kenny, R.A. Quantitative falls risk assessment using the timed up and go test. IEEE Trans. Biomed. Eng. 2010, 57, 2918–2926. [Google Scholar] [CrossRef]
- Barry, E.; Galvin, R.; Keogh, C.; Horgan, F.; Fahey, T. Is the Timed Up and Go test a useful predictor of risk of falls in community dwelling older adults: A systematic review and meta-analysis. BMC Geriatr. 2014, 1, 14. [Google Scholar] [CrossRef] [PubMed]
- Thrane, G.; Joakimsen, R.; Thornquist, E. The association between timed up and go test and history of falls: The Tromso study. BMC Geriatr. 2007, 7, 1. Available online: https://pubmed.ncbi.nlm.nih.gov/17222340/ (accessed on 19 December 2021). [CrossRef] [PubMed] [Green Version]
- Salarian, A.; Horak, F.B.; Zampieri, C.; Carlson-Kuhta, P.; Nutt, J.G.; Aminian, K. iTUG, a Sensitive and Reliable Measure of Mobility. Neural Syst. Rehabil. Eng. IEEE Trans. 2010, 18, 303–310. [Google Scholar] [CrossRef] [Green Version]
- Mariani, B.; Jiménez, M.C.; Vingerhoets, F.J.G.; Aminian, K. On-Shoe Wearable Sensors for Gait and Turning Assessment of Patients With Parkinson’s Disease. IEEE Trans. Biomed. Eng. 2013, 60, 155–158. [Google Scholar] [CrossRef] [PubMed]
- Creaby, M.W.; Cole, M.H. Gait characteristics and falls in Parkinson’s disease: A systematic review and meta-analysis. Parkinsonism Relat. Disord. 2018, 57, 1–8. [Google Scholar] [CrossRef] [PubMed]
- Latt, M.D.; Lord, S.R.; Morris, J.G.; Fung, V.S. Clinical and physiological assessments for elucidating falls risk in Parkinson’s disease. Mov. Disord. 2009, 24, 1280–1289. [Google Scholar] [CrossRef]
- Schaafsma, J.D.; Giladi, N.; Balash, Y.; Bartels, A.L.; Gurevich, T.; Hausdorff, J.M. Gait dynamics in Parkinson’s disease: Relationship to Parkinsonian features, falls and response to levodopa. J. Neurol. Sci. 2003, 212, 47–53. [Google Scholar] [CrossRef]
- Hausdorff, J.M.; Cudkowicz, M.E.; Firtion, R.; Wei, J.Y.; Goldberger, A.L. Gait variability and basal ganglia disorders: Stride-to-stride variations of gait cycle timing in parkinson’s disease and Huntington’s disease. Mov. Disord. 1998, 13, 428–437. [Google Scholar] [CrossRef]
- Lord, S.; Baker, K.; Nieuwboer, A.; Burn, D.; Rochester, L. Gait variability in Parkinson’s disease: An indicator of non-dopaminergic contributors to gait dysfunction? J. Neurol. 2011, 258, 566–572. [Google Scholar] [CrossRef] [PubMed]
- Hausdorff, J.; Rios, D.; Edelberg, H. Gait variability and fall risk in community-living older adults: A 1-year prospective study. Arch. Phys. Med. Rehabil. 2001, 82, 1050–1056. [Google Scholar] [CrossRef] [PubMed]


| Dataset | TD | PD1 | PD2 |
|---|---|---|---|
| N (M/F) | 1015 (344/671) | 15 (10/5) | 27 (17/9) |
| Population | Community dwelling Control Residential care | Parkinson’s disease | Parkinson’s disease |
| Study type | Cross-sectional Longitudinal | Longitudinal | Cross-sectional |
| Outcomes | Clinically reported falls CGA MMSE | Weekly falls diaries UPRDS | Self-reported falls UPDRS |
| UPDRS part III | - | 15.1 ± 9.6 | 22.56 ± 10.25 |
| Fallers/Non-fallers | 409/606 | 4/11 (12 weeks) 8/7 (24 weeks) | 8/18 |
| Total falls (Falls rate) | 652 (0.64) | 181 (12.1) | 10 (0.37) |
| TUG time (s) | 10.8 ± 3.9 | 12.5 ± 4.3 | 8.6 ± 2.9 |
| Gait velocity (cm/s) | 98.9 ± 18.7 | 89.4 ± 24.5 | 116.0 ± 14.9 |
| Age (yrs) | 72.2 ± 10.9 | 67.3 ± 7.1 | 64.9 ± 7.3 |
| Height (cm) | 166.6 ± 9.8 | 172.9 ± 9.8 | 171.2 ± 8.3 |
| Weight (kg) | 74.6 ± 16.3 | 80.3 ± 15.7 | 74.7 ± 13.6 |
| BMI | 26.97 ± 4.70 | 26.86 ± 4.37 | 25.40 ± 3.79 |
| Dataset | Model | N | R2 | RMSE | Rho | #Features |
|---|---|---|---|---|---|---|
| PD1 (all data) | FRE | 15 | 0.50 | 1.27 | 0.64 | 3 |
| PD1 (outliers excluded) | FRE | 12 | 0.73 | 0.41 | 0.44 | 3 |
| PD1 (0–5+categories) | FRE | 15 | 0.70 | 0.70 | 0.69 | 3 |
| PD2 (all data) | FRE | 26 | 0.13 | 0.42 | 0.15 | 3 |
| PD2 (all data) | Mobility | 26 | 0.48 | 0.33 | 0.55 | 5 |
| PD1 | PD2 | |||||||||
|---|---|---|---|---|---|---|---|---|---|---|
| FRE | N | R2 | RMSE | ρ | #Features | N | R2 | RMSE | ρ | #Features |
| TD-All | 12 | 0.00 | 0.80 | 0.38 | 13 | 26 | 0.00 | 0.45 | 0.16 | 13 |
| TD-Fallers | 12 | 0.00 | 0.62 | 0.34 | 13 | 26 | 0.00 | 0.38 | 0.28 | 13 |
| TD-PD | 12 | 0.00 | ## | −0.31 | 19 | 26 | 0.00 | ## | −0.05 | 19 |
| TD-Fallers-PD | 12 | 0.00 | ## | −0.38 | 4 | 26 | 0.00 | ## | −0.10 | 4 |
| TD-NoPD | 12 | 0.00 | 0.80 | 0.35 | 14 | 26 | 0.00 | 0.45 | 0.15 | 14 |
| TD-Fallers-NoPD | 12 | 0.00 | 0.73 | 0.52 | 20 | 26 | 0.00 | 0.41 | 0.24 | 20 |
| Ensemble-TD-PD | 12 | 0.00 | 1.23 | 0.52 | 2 | 26 | 0.00 | 1.36 | 0.24 | 2 |
| Male | ||||||||||
| TD-All | 9 | 0.00 | 0.54 | 0.07 | 4 | 17 | 0.00 | 0.26 | 0.22 | 4 |
| TD-Fallers | 9 | 0.00 | 0.49 | −0.45 | 6 | 17 | 0.00 | 0.39 | 0.47 | 6 |
| TD-PD | 9 | 0.00 | 18.81 | −0.60 | 4 | 17 | 0.00 | 16.32 | 0.03 | 4 |
| TD-Fallers-PD | 9 | 0.00 | 12.77 | −0.34 | 11 | 17 | 0.00 | 5.44 | 0.06 | 11 |
| TD-NoPD | 9 | 0.00 | 0.61 | −0.07 | 20 | 17 | 0.00 | 0.29 | −0.31 | 20 |
| TD-Fallers-NoPD | 9 | 0.00 | 0.51 | −0.22 | 13 | 17 | 0.00 | 0.33 | 0.60 | 13 |
| Ensemble-TD-PD | 9 | 0.00 | 0.69 | 0.22 | 2 | 17 | 0.00 | 0.84 | −0.60 | 2 |
| Female | ||||||||||
| TD-All | 3 | 0.00 | 0.98 | 0.50 | 12 | 9 | 0.00 | 0.52 | 0.37 | 12 |
| TD-Fallers | 3 | 0.00 | 1.19 | 0.50 | 18 | 9 | 0.00 | 0.63 | 0.47 | 18 |
| TD-PD | 3 | 0.00 | 0.81 | 1.00 | 4 | 9 | 0.00 | 0.67 | −0.21 | 4 |
| TD-Fallers-PD | 3 | 0.00 | 191.41 | −1.00 | 20 | 9 | 0.00 | ## | 0.02 | 20 |
| TD-NoPD | 3 | 0.00 | 0.92 | 0.50 | 10 | 9 | 0.00 | 0.48 | 0.58 | 10 |
| TD-Fallers-NoPD | 3 | 0.00 | 1.19 | 0.50 | 17 | 9 | 0.00 | 0.64 | 0.38 | 17 |
| Ensemble-TD-PD | 3 | 0.00 | 1.19 | 0.50 | 2 | 9 | 0.00 | 0.40 | −0.34 | 2 |
Publisher’s Note: MDPI stays neutral with regard to jurisdictional claims in published maps and institutional affiliations. |
© 2021 by the authors. Licensee MDPI, Basel, Switzerland. This article is an open access article distributed under the terms and conditions of the Creative Commons Attribution (CC BY) license (https://creativecommons.org/licenses/by/4.0/).
Share and Cite
Greene, B.R.; Premoli, I.; McManus, K.; McGrath, D.; Caulfield, B. Predicting Fall Counts Using Wearable Sensors: A Novel Digital Biomarker for Parkinson’s Disease. Sensors 2022, 22, 54. https://doi.org/10.3390/s22010054
Greene BR, Premoli I, McManus K, McGrath D, Caulfield B. Predicting Fall Counts Using Wearable Sensors: A Novel Digital Biomarker for Parkinson’s Disease. Sensors. 2022; 22(1):54. https://doi.org/10.3390/s22010054
Chicago/Turabian StyleGreene, Barry R., Isabella Premoli, Killian McManus, Denise McGrath, and Brian Caulfield. 2022. "Predicting Fall Counts Using Wearable Sensors: A Novel Digital Biomarker for Parkinson’s Disease" Sensors 22, no. 1: 54. https://doi.org/10.3390/s22010054