
Multiphase Identification Algorithm for Fall Recording Systems Using a Single Wearable Inertial Sensor

 , , , and
Abstract
:1. Introduction
2. Materials and Methods
2.1. Background
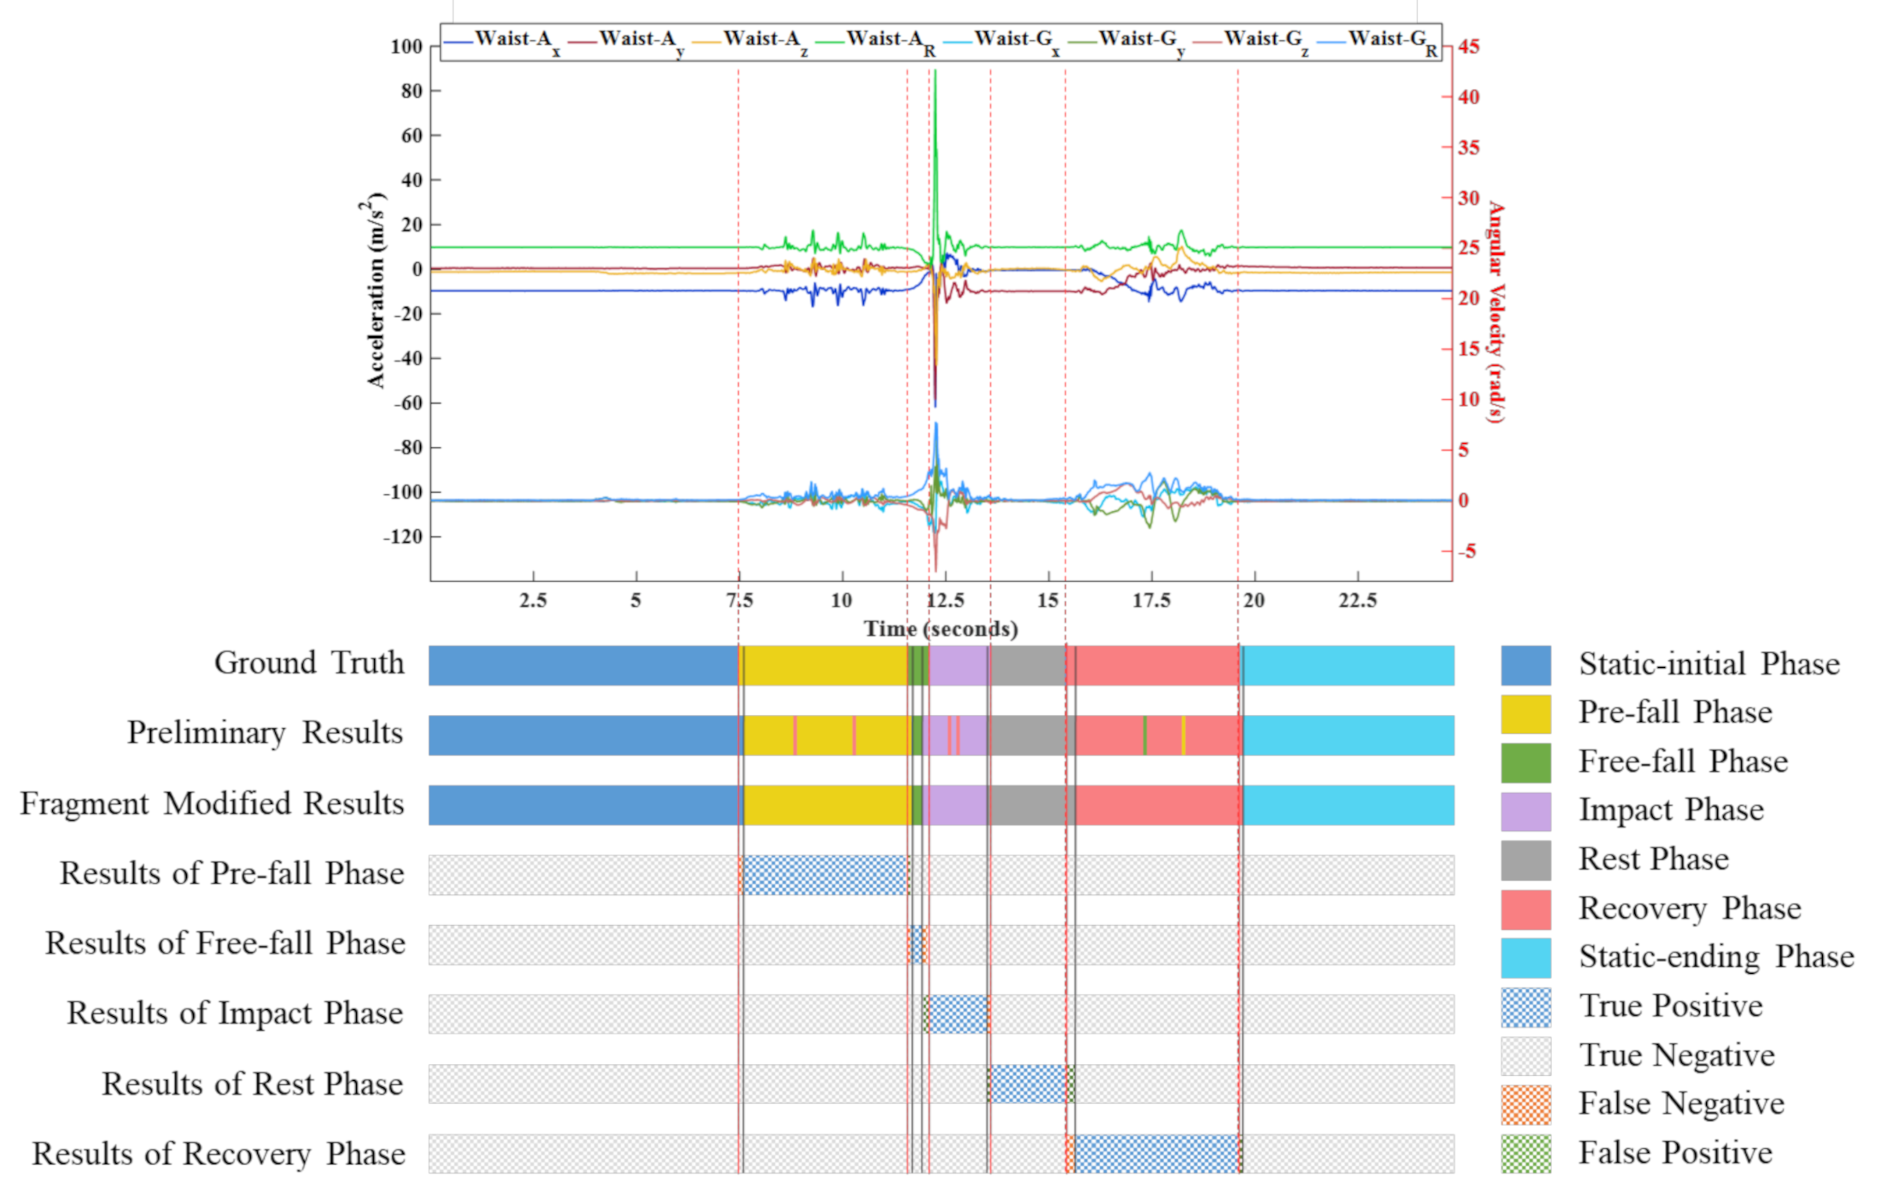
- Pre-fall phase (green area): A pre-fall phase is defined as an activity before losing balance and hitting on the ground such as walking, standing, sit-to-stand, stand-to-sit activities, that may highly impact the fall biomechanics of faller. Through identified pre-fall activities, fallers and caregivers can understand which activity easily leads to fall events.
- Free-fall phase (red area): A free-fall phase is the process of sudden body movement toward the ground. There is no protective strategy that can prevent people from falling in the free-fall phase. The time of free-fall phase depends on the circumstances such as fall direction and fall height.
- Impact phase (yellow area): An impact phase is the process of the person hitting on the ground and can be determined by the abrupt shock of the acceleration signal. This phase is a critical phase for fall detection algorithms and systems. The fall types and directions can be analyzed by the duration of the impact phase and the magnitude of tri-axial acceleration in the impact phase.
- Resting phase (purple area): A resting phase is defined as a faller remaining inactive on the ground after a fall occurred. The injury severity of the fall affects the duration of resting phases. In some fall events, the duration of the resting phase is extremely short when the faller directly picked oneself up. Conversely, the duration of the resting phase may be long or unending if the faller is unable to rise. The situation that the faller cannot get up is identified as long-lie, which means involuntarily remaining on the ground. Then, there is no recovery phase and the fall event ends in the resting phase.
- Recovery phase (blue area): A recovery phase is the last phase of a fall event if the faller has consciousness to get up from the ground. Resting and recovery phases are important to understand the severity of falls and whether the faller has immediate assistance. Previous studies [27,28] have shown the positive correlation between the mortality rates and the waiting time of rescue from falls. Rescuing the faller quickly can reduce the risks of hospitalization and death [23].
2.2. Developments on Multiphase Identification Algorithm
2.2.1. Data Collection and Experimental Protocol
2.2.2. Multiphase Identification
- Support Vector Machine (SVM)
- 2.
- K-Nearest Neighbor (kNN)
- 3.
- Naïve Bayesian (NB)
- 4.
- Decision Tree (DT)
- 5.
- Adaptive Boosting (AdaBoost)
2.2.3. Multiphase Information
| Algorithm 1: Fragment modification algorithm in the multiphase identification stage | |
| Input: | An identified segments sequence , The ith multiphase segment ; total number of segments in the sequence |
| Output: | A modified and identified segments sequence , The ith modified multiphase segment |
| 1: | // is the semantic phase of initial-static. |
| 2: | // is the semantic phase of ending-static. |
| 3: | |
| 4: | |
| 5: | for from 2 to do |
| 6: | if != && == then |
| 7: | = |
| 8: | else if != && != && == then |
| 9: | = |
| 10: | else if != && != && != && == then |
| 11: | = |
| 12: | end if |
| 13: | = |
| 14: | end for |
| 15: | |
| 16: | |
| 17: | |
| 18: | |
| 19: | return |
2.3. Performance Evaluation
3. Results
4. Discussion
5. Conclusions
Author Contributions
Funding
Institutional Review Board Statement
Informed Consent Statement
Data Availability Statement
Acknowledgments
Conflicts of Interest
References
- World Health Organization, Ageing, and Life Course Unit. WHO Global Report on Falls Prevention in Older Age; World Health Organization: Geneva, Switzerland, 2008. [Google Scholar]
- Moreland, B.; Kakara, R.; Henry, A. Trends in nonfatal falls and fall-related injuries among adults aged ≥ 65 years—United States, 2012–2018. Morb. Mortal. Wkly. Rep. 2020, 69, 875. [Google Scholar] [CrossRef]
- Sherrington, C.; Fairhall, N.; Kwok, W.; Wallbank, G.; Tiedemann, A.; Michaleff, Z.A.; Ng, C.A.; Bauman, A. Evidence on physical activity and falls prevention for people aged 65+ years: Systematic review to inform the WHO guidelines on physical activity and sedentary behaviour. Int. J. Behav. Nutr. Phys. Act. 2020, 17, 144. [Google Scholar] [CrossRef]
- Montesinos, L.; Castaldo, R.; Pecchia, L. Wearable inertial sensors for fall risk assessment and prediction in older adults: A systematic review and meta-analysis. IEEE Trans. Neural Syst. Rehabil. Eng. 2018, 26, 573–582. [Google Scholar] [CrossRef] [Green Version]
- Özdemir, A.T.; Barshan, B. Detecting falls with wearable sensors using machine learning techniques. Sensors 2014, 14, 10691–10708. [Google Scholar] [CrossRef]
- Singh, A.; Rehman, S.U.; Yongchareon, S.; Chong, P.H.J. Sensor technologies for fall detection systems: A review. IEEE Sens. J. 2020, 20, 6889–6919. [Google Scholar] [CrossRef]
- Al Nahian, M.J.; Raju, M.H.; Tasnim, Z.; Mahmud, M.; Ahad, M.A.R.; Kaiser, M.S. Contactless fall detection for the elderly. In Contactless Human Activity Analysis; Springer: Berlin/Heidelberg, Germany, 2021; pp. 1–32. [Google Scholar]
- Clemente, J.; Song, W.; Valero, M.; Li, F.; Liy, X. Indoor person identification and fall detection through non-intrusive floor seismic sensing. In Proceedings of the 2019 IEEE International Conference on Smart Computing (SMARTCOMP), Washington, DC, USA, 12–15 June 2019; pp. 417–424. [Google Scholar]
- Shu, F.; Shu, J. An eight-camera fall detection system using human fall pattern recognition via machine learning by a low-cost android box. Sci. Rep. 2021, 11, 2471. [Google Scholar] [CrossRef] [PubMed]
- Chen, W.; Jiang, Z.; Guo, H.; Ni, X. Fall detection based on key points of human-skeleton using openpose. Symmetry 2020, 12, 744. [Google Scholar] [CrossRef]
- Pannurat, N.; Thiemjarus, S.; Nantajeewarawat, E. Automatic fall monitoring: A review. Sensors 2014, 14, 12900–12936. [Google Scholar] [CrossRef] [PubMed] [Green Version]
- Hsieh, C.-Y.; Liu, K.-C.; Huang, C.-N.; Chu, W.-C.; Chan, C.-T. Novel hierarchical fall detection algorithm using a multiphase fall model. Sensors 2017, 17, 307. [Google Scholar] [CrossRef]
- Chelli, A.; Pätzold, M. A machine learning approach for fall detection and daily living activity recognition. IEEE Access 2019, 7, 38670–38687. [Google Scholar] [CrossRef]
- Hussain, F.; Hussain, F.; Ehatisham-ul-Haq, M.; Azam, M.A. Activity-aware fall detection and recognition based on wearable sensors. IEEE Sens. J. 2019, 19, 4528–4536. [Google Scholar] [CrossRef]
- Woolrych, R.; Zecevic, A.; Sixsmith, A.; Sims-Gould, J.; Feldman, F.; Chaudhury, H.; Symes, B.; Robinovitch, S.N. Using video capture to investigate the causes of falls in long-term care. Gerontologist 2015, 55, 483–494. [Google Scholar] [CrossRef] [PubMed] [Green Version]
- Robinovitch, S.N.; Feldman, F.; Yang, Y.; Schonnop, R.; Leung, P.M.; Sarraf, T.; Sims-Gould, J.; Loughin, M. Video capture of the circumstances of falls in elderly people residing in long-term care: An observational study. Lancet 2013, 381, 47–54. [Google Scholar] [CrossRef] [Green Version]
- Becker, C.; Schwickert, L.; Mellone, S.; Bagalà, F.; Chiari, L.; Helbostad, J.; Zijlstra, W.; Aminian, K.; Bourke, A.; Todd, C. Proposal for a multiphase fall model based on real-world fall recordings with body-fixed sensors. Zeitschrift für Gerontologie und Geriatrie 2012, 45, 707–715. [Google Scholar] [CrossRef] [PubMed]
- Garcia, P.A.; Dias, J.; Silva, S.L.; Dias, R.C. Prospective monitoring and self-report of previous falls among older women at high risk of falls and fractures: A study of comparison and agreement. Braz. J. Phys. Ther. 2015, 19, 218–226. [Google Scholar] [CrossRef] [PubMed] [Green Version]
- Hale, W.A.; Delaney, M.J.; Cable, T. Accuracy of patient recall and chart documentation of falls. J. Am. Board Fam. Pract. 1993, 6, 239–242. [Google Scholar]
- Hsieh, C.-Y.; Shi, W.-T.; Huang, H.-Y.; Liu, K.-C.; Hsu, S.J.; Chan, C.-T. Machine learning-based fall characteristics monitoring system for strategic plan of falls prevention. In Proceedings of the 2018 IEEE International Conference on Applied System Invention (ICASI), Chiba, Japan, 13–17 April 2018; pp. 818–821. [Google Scholar]
- Fleming, J.; Brayne, C. Inability to get up after falling, subsequent time on floor, and summoning help: Prospective cohort study in people over 90. BMJ 2008, 337, a2227. [Google Scholar] [CrossRef] [Green Version]
- Zijlstra, A.; Ufkes, T.; Skelton, D.; Lundin-Olsson, L.; Zijlstra, W. Do dual tasks have an added value over single tasks for balance assessment in fall prevention programs? A mini-review. Gerontology 2008, 54, 40–49. [Google Scholar] [CrossRef]
- Noury, N.; Rumeau, P.; Bourke, A.; ÓLaighin, G.; Lundy, J. A proposal for the classification and evaluation of fall detectors. IRBM 2008, 29, 340–349. [Google Scholar] [CrossRef]
- Bai, Y.-W.; Wu, S.-C.; Tsai, C.-L. Design and implementation of a fall monitor system by using a 3-axis accelerometer in a smart phone. IEEE Trans. Consum. Electron. 2012, 58, 1269–1275. [Google Scholar] [CrossRef]
- Wu, Y.; Su, Y.; Feng, R.; Yu, N.; Zang, X. Wearable-sensor-based pre-impact fall detection system with a hierarchical classifier. Measurement 2019, 140, 283–292. [Google Scholar] [CrossRef]
- Putra, I.; Brusey, J.; Gaura, E.; Vesilo, R. An event-triggered machine learning approach for accelerometer-based fall detection. Sensors 2018, 18, 20. [Google Scholar] [CrossRef] [PubMed] [Green Version]
- Wild, D.; Nayak, U.; Isaacs, B. How dangerous are falls in old people at home? Br. Med. J. (Clin. Res. Ed.) 1981, 282, 266–268. [Google Scholar] [CrossRef] [PubMed] [Green Version]
- Gurley, R.J.; Lum, N.; Sande, M.; Lo, B.; Katz, M.H. Persons found in their homes helpless or dead. N. Engl. J. Med. 1996, 334, 1710–1716. [Google Scholar] [CrossRef]
- Alhammad, N.; Al-Dossari, H. Dynamic Segmentation for Physical Activity Recognition Using a Single Wearable Sensor. Appl. Sci. 2021, 11, 2633. [Google Scholar] [CrossRef]
- Nurwulan, N.; Jiang, B.C. Window selection impact in human activity recognition. Int. J. Innov. Technol. Interdiscip. Sci. 2020, 3, 381–394. [Google Scholar]
- Bhattacharya, G.; Ghosh, K.; Chowdhury, A.S. An affinity-based new local distance function and similarity measure for kNN algorithm. Pattern Recognit. Lett. 2012, 33, 356–363. [Google Scholar] [CrossRef]
- Biswas, N.; Chakraborty, S.; Mullick, S.S.; Das, S. A parameter independent fuzzy weighted k-nearest neighbor classifier. Pattern Recognit. Lett. 2018, 101, 80–87. [Google Scholar] [CrossRef]
- Ward, J.A.; Lukowicz, P.; Gellersen, H.W. Performance metrics for activity recognition. ACM Trans. Intell. Syst. Technol. (TIST) 2011, 2, 1–23. [Google Scholar] [CrossRef]
- Sprint, G.; Cook, D.J.; Weeks, D.L. Toward automating clinical assessments: A survey of the timed up and go. IEEE Rev. Biomed. Eng. 2015, 8, 64–77. [Google Scholar] [CrossRef] [PubMed]
- Hsieh, C.-Y.; Huang, H.-Y.; Liu, K.-C.; Chen, K.-H.; Hsu, S.J.-P.; Chan, C.-T. Subtask Segmentation of Timed Up and Go Test for Mobility Assessment of Perioperative Total Knee Arthroplasty. Sensors 2020, 20, 6302. [Google Scholar] [CrossRef] [PubMed]
- Huang, H.-Y.; Hsieh, C.-Y.; Liu, K.-C.; Hsu, S.J.-P.; Chan, C.-T. Fluid Intake Monitoring System Using a Wearable Inertial Sensor for Fluid Intake Management. Sensors 2020, 20, 6682. [Google Scholar] [CrossRef] [PubMed]
- Chang, C.-Y.; Hsieh, C.-Y.; Huang, H.-Y.; Wu, Y.-T.; Chen, L.-C.; Chan, C.-T.; Liu, K.-C. Automatic Functional Shoulder Task Identification and Sub-Task Segmentation Using Wearable Inertial Measurement Units for Frozen Shoulder Assessment. Sensors 2021, 21, 106. [Google Scholar] [CrossRef] [PubMed]


| No. | Type | Direction | Trial |
|---|---|---|---|
| 1 | Fall while standing | Forward, backward, right lateral, and left lateral | 84 |
| 2 | Fall while standing up | Forward, backward, right lateral, and left lateral | 84 |
| 3 | Fall while sitting down | Forward, backward, right lateral, and left lateral | 84 |
| 4 | Fall while stooping down | Forward, backward, right lateral, and left lateral | 84 |
| 5 | Fall while walking | Forward, backward, right lateral, and left lateral | 84 |
| 6 | Fall while jumping | Forward, backward, right lateral, and left lateral | 84 |
| 7 | Fall while walking backward | Backward | 21 |
| Type | Direction | |||
|---|---|---|---|---|
| Forward (s) | Backward(s) | Right Lateral(s) | Left Lateral(s) | |
| Fall while standing | 14.89 ± 2.03 | 14.91 ± 2.53 | 15.58 ± 2.32 | 15.35 ± 1.95 |
| Fall while standing up | 16.66 ± 3.01 | 17.00 ± 2.58 | 17.07 ± 1.83 | 17.33 ± 1.67 |
| Fall while sitting down | 16.44 ± 1.88 | 15.91 ± 1.85 | 15.90 ± 1.85 | 15.69 ± 1.72 |
| Fall while stooping down | 17.68 ± 1.35 | 20.56 ± 2.73 | 18.61 ± 2.13 | 19.07 ± 1.82 |
| Fall while walking | 15.52 ± 1.97 | 16.46 ± 1.93 | 15.65 ± 1.73 | 15.81 ± 1.55 |
| Fall while jumping | 19.04 ± 2.23 | 19.64 ± 2.62 | 19.11 ± 2.41 | 19.02 ± 2.36 |
| Fall while walking backward | -- | 19.17 ± 1.80 | -- | -- |
| Feature Set, F = (f1, f2, …, f64) ϵ R64 | Feature Description |
|---|---|
| f1 ~ f8 | |
| f9 ~ f16 | |
| f17 ~ f24 | |
| f25 ~ f32 | |
| f33 ~ f40 | |
| f41 ~ f48 | |
| f49 ~ f52 | |
| f53 ~ f64 |
| Machine Learning Technique | Evaluation Measure | Window Size | |||||
|---|---|---|---|---|---|---|---|
| 8 Samples (0.0625 s) | 16 Samples (0.125 s) | 24 Samples (0.1875 s) | 32 Samples (0.25 s) | 40 Samples (0.3125 s) | Overall | ||
| AdaBoost | Sensitivity | 73.25 | 75.07 | 77.31 | 78.06 | 77.87 | 76.31 |
| Precision | 83.82 | 85.81 | 86.55 | 85.31 | 83.04 | 84.91 | |
| Jaccard coefficient | 65.23 | 67.35 | 69.73 | 70.26 | 69.83 | 68.48 | |
| Accuracy | 87.85 | 88.57 | 89.30 | 89.54 | 89.77 | 89.00 | |
| SVM | Sensitivity | 72.47 | 74.44 | 75.70 | 77.62 | 78.22 | 75.69 |
| Precision | 78.40 | 76.61 | 77.92 | 79.07 | 79.30 | 78.26 | |
| Jaccard coefficient | 61.81 | 61.44 | 63.05 | 64.91 | 65.37 | 63.32 | |
| Accuracy | 84.45 | 83.83 | 84.80 | 85.86 | 86.22 | 85.03 | |
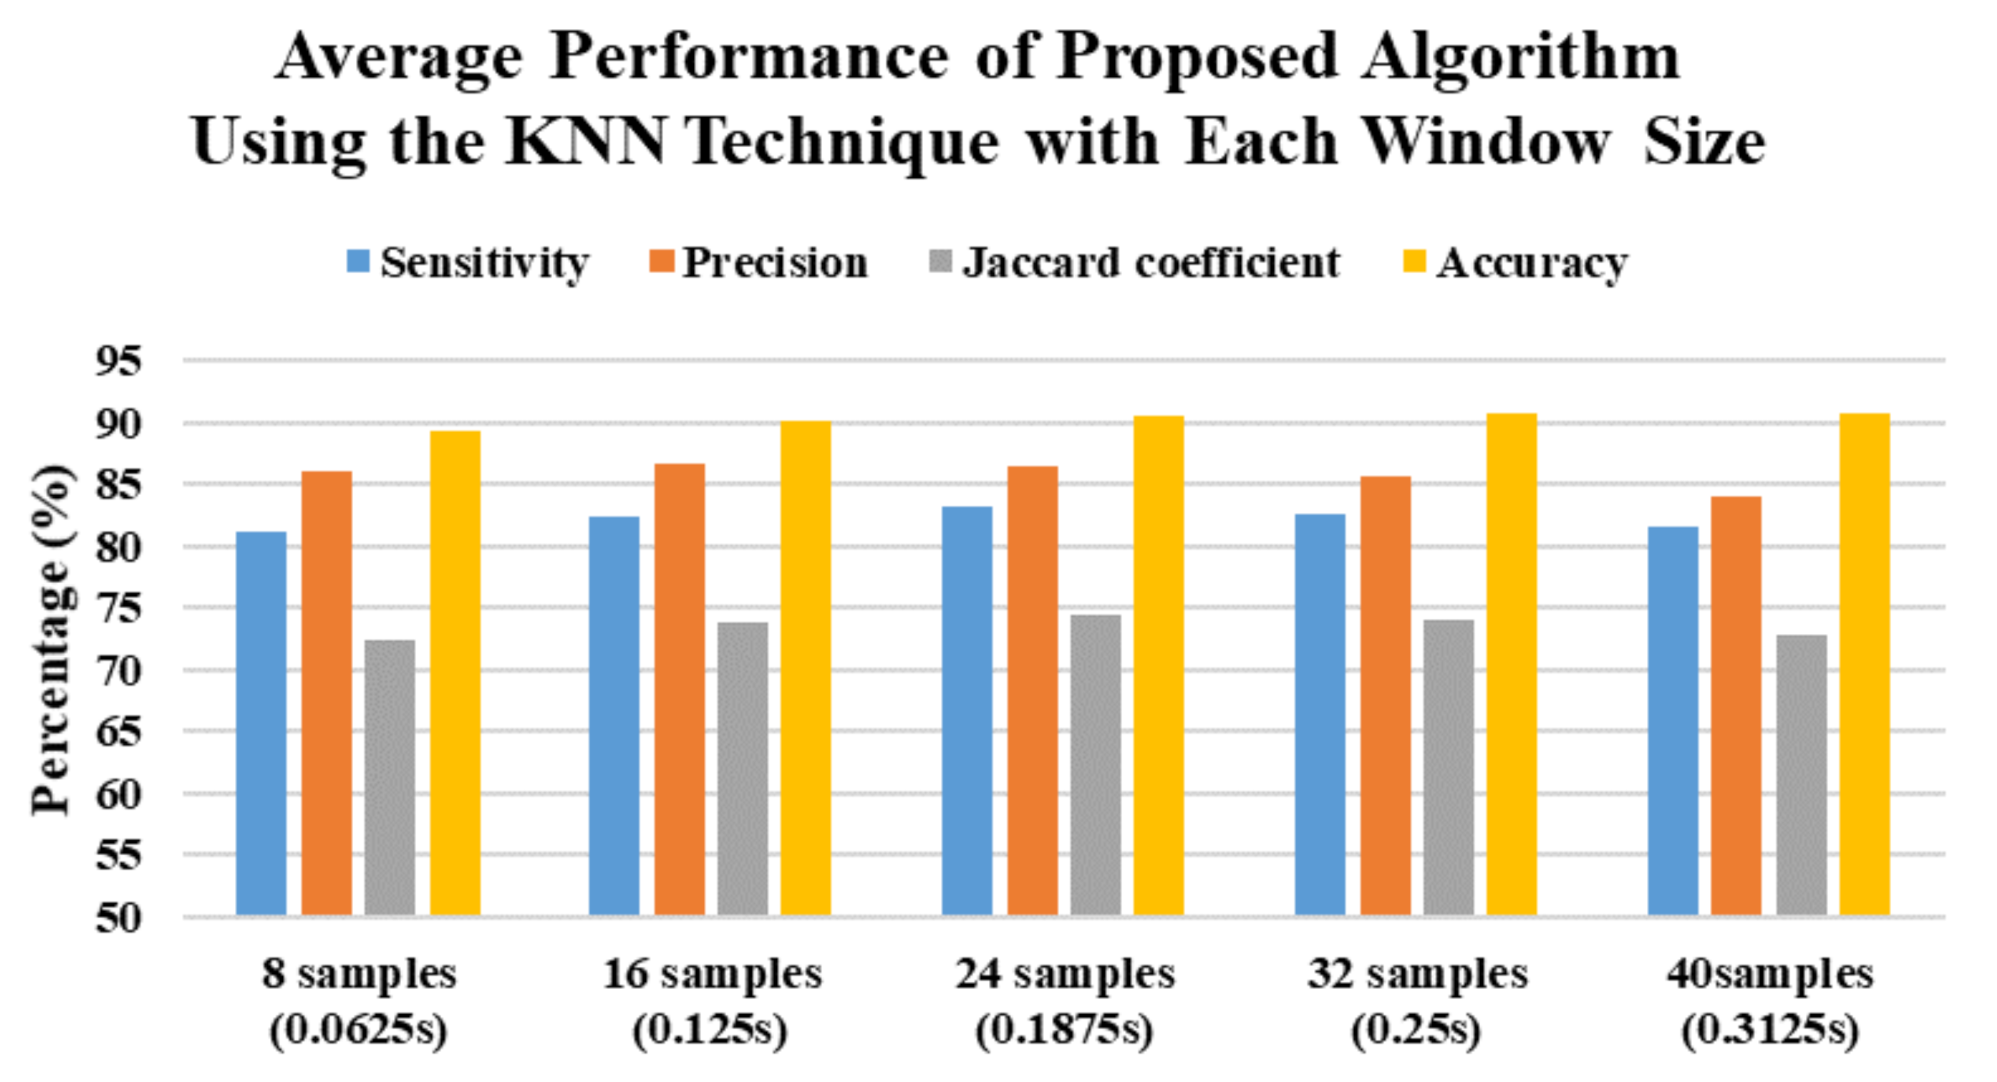
| kNN | Sensitivity | 81.17 | 82.46 | 83.09 | 82.65 | 81.49 | 82.17 |
| Precision | 86.02 | 86.70 | 86.53 | 85.56 | 83.91 | 85.74 | |
| Jaccard coefficient | 72.33 | 73.83 | 74.47 | 74.05 | 72.86 | 73.51 | |
| Accuracy | 89.32 | 90.07 | 90.56 | 90.76 | 90.69 | 90.28 | |
| DT | Sensitivity | 81.84 | 82.42 | 82.84 | 81.61 | 80.92 | 81.93 |
| Precision | 83.57 | 83.33 | 83.51 | 82.19 | 81.28 | 82.78 | |
| Jaccard coefficient | 72.46 | 72.51 | 73.03 | 71.64 | 70.93 | 72.12 | |
| Accuracy | 89.75 | 89.56 | 89.86 | 89.36 | 89.26 | 89.56 | |
| NB | Sensitivity | 65.80 | 67.44 | 68.07 | 66.92 | 64.76 | 66.60 |
| Precision | 72.77 | 73.01 | 73.41 | 73.26 | 71.31 | 72.75 | |
| Jaccard coefficient | 53.55 | 54.93 | 55.64 | 55.56 | 54.36 | 54.81 | |
| Accuracy | 80.76 | 81.24 | 81.50 | 81.72 | 81.67 | 81.38 | |
| Overall | Sensitivity | 74.91 | 76.37 | 77.40 | 77.37 | 76.65 | 76.54 |
| Precision | 80.92 | 81.09 | 81.59 | 81.08 | 79.77 | 80.89 | |
| Jaccard coefficient | 65.08 | 66.01 | 67.19 | 67.28 | 66.67 | 66.45 | |
| Accuracy | 86.42 | 86.65 | 87.20 | 87.45 | 87.52 | 87.05 | |
| Using a kNN technique with a window size of 8 samples (0.0625 s) | ||||||||
| Initial-static | Pre-fall | Free-fall | Impact | Resting | Recovery | Ending-static | Overall | |
| Sensitivity | 99.70 | 62.96 | 51.01 | 79.64 | 96.33 | 80.12 | 98.46 | 81.17 |
| Precision | 90.26 | 93.18 | 67.03 | 87.00 | 84.12 | 88.19 | 92.39 | 86.02 |
| Jaccard coefficient | 90.03 | 60.17 | 40.20 | 71.07 | 81.50 | 72.31 | 91.05 | 72.33 |
| Accuracy | 89.32 | |||||||
| Using a kNN technique with a window size of 16 samples (0.125 s) | ||||||||
| Sensitivity | 99.70 | 64.34 | 54.42 | 81.21 | 96.74 | 82.38 | 98.45 | 82.46 |
| Precision | 91.38 | 94.75 | 67.63 | 86.49 | 86.07 | 87.68 | 92.88 | 86.70 |
| Jaccard coefficient | 91.14 | 62.11 | 42.73 | 71.94 | 83.62 | 73.79 | 91.51 | 73.83 |
| Accuracy | 90.07 | |||||||
| Using a kNN technique with a window size of 24 samples (0.1875 s) | ||||||||
| Sensitivity | 99.54 | 66.02 | 54.89 | 82.07 | 96.98 | 83.80 | 98.33 | 83.09 |
| Precision | 92.50 | 95.73 | 64.50 | 85.12 | 87.31 | 87.52 | 93.03 | 86.53 |
| Jaccard coefficient | 92.12 | 64.10 | 42.08 | 71.68 | 84.97 | 74.81 | 91.55 | 74.47 |
| Accuracy | -- | -- | -- | -- | -- | -- | -- | 90.56 |
| Using a kNN technique with a window size of 32 samples (0.25 s) | ||||||||
| Sensitivity | 99.29 | 67.71 | 49.88 | 81.87 | 96.86 | 84.70 | 98.24 | 82.65 |
| Precision | 93.44 | 96.18 | 57.93 | 82.93 | 88.07 | 87.49 | 92.89 | 85.56 |
| Jaccard coefficient | 92.83 | 65.91 | 37.11 | 70.01 | 85.60 | 75.52 | 91.35 | 74.05 |
| Accuracy | -- | -- | -- | -- | -- | -- | -- | 90.76 |
| Using a kNN technique with a window size of 40 samples (0.3125 s) | ||||||||
| Sensitivity | 99.05 | 68.82 | 41.97 | 80.79 | 96.34 | 85.22 | 98.28 | 81.49 |
| Precision | 94.24 | 96.01 | 48.38 | 80.30 | 88.51 | 87.25 | 92.66 | 83.91 |
| Jaccard coefficient | 93.40 | 66.91 | 29.82 | 67.38 | 85.61 | 75.75 | 91.15 | 72.86 |
| Accuracy | -- | -- | -- | -- | -- | -- | -- | 90.69 |
| Article (Year) [Reference] | Sensor Type | Technique (Method) | Provided Fall-Related Information |
|---|---|---|---|
| Becker et al. (2012) [17] | Inertial sensor | Manual labeling | Starting and ending points of fall phases |
| Robinovitch et al. (2013) [16] | Camera | Manual labeling | Causes of falling; Activities before the fall event. |
| Hsieh et al. (2018) [20] | Inertial sensor | Machine learning (SVM) | Fall directions (97.34% accuracy) |
| Hussain et al. (2019) [14] | Inertial sensor | Machine learning (kNN, SVM and random forest) | Fall types (96.82% accuracy using random forest classifier) |
| Clemente et al. (2019) [8] | Seismic sensor | Machine learning (SVM) | Fall positions (localization error is smaller than 0.28 m) |
| This study | Inertial sensor | Machine learning (SVM, kNN, NB, DT and AdaBoost) | Starting and ending points of fall phases; Duration of fall phases. |
Publisher’s Note: MDPI stays neutral with regard to jurisdictional claims in published maps and institutional affiliations. |
© 2021 by the authors. Licensee MDPI, Basel, Switzerland. This article is an open access article distributed under the terms and conditions of the Creative Commons Attribution (CC BY) license (https://creativecommons.org/licenses/by/4.0/).
Share and Cite
Hsieh, C.-Y.; Huang, H.-Y.; Liu, K.-C.; Liu, C.-P.; Chan, C.-T.; Hsu, S.J.-P. Multiphase Identification Algorithm for Fall Recording Systems Using a Single Wearable Inertial Sensor. Sensors 2021, 21, 3302. https://doi.org/10.3390/s21093302
Hsieh C-Y, Huang H-Y, Liu K-C, Liu C-P, Chan C-T, Hsu SJ-P. Multiphase Identification Algorithm for Fall Recording Systems Using a Single Wearable Inertial Sensor. Sensors. 2021; 21(9):3302. https://doi.org/10.3390/s21093302
Chicago/Turabian StyleHsieh, Chia-Yeh, Hsiang-Yun Huang, Kai-Chun Liu, Chien-Pin Liu, Chia-Tai Chan, and Steen Jun-Ping Hsu. 2021. "Multiphase Identification Algorithm for Fall Recording Systems Using a Single Wearable Inertial Sensor" Sensors 21, no. 9: 3302. https://doi.org/10.3390/s21093302