Article

Marker Placement Reliability and Objectivity for Biomechanical Cohort Study: Healthy Aging in Industrial Environment (HAIE—Program 4)

1
Human Motion Diagnostic Center, Department of Human Movement Studies, University of Ostrava, 70200 Ostrava, Czech Republic
2
Department of Kinesiology and Nutrition Sciences, University of Nevada Las Vegas, Las Vegas, NV 89154, USA
3
Department of Kinesiology, University of Massachusetts, Amherst, MA 01003, USA
4
Department of Mathematics with Didactics, University of Ostrava, 70900 Ostrava, Czech Republic
*
Author to whom correspondence should be addressed.
Sensors 2021, 21(5), 1830; https://doi.org/10.3390/s21051830
Submission received: 27 January 2021 / Revised: 27 February 2021 / Accepted: 1 March 2021 / Published: 5 March 2021
(This article belongs to the Collection Sensors for Human Movement Applications)

Abstract

:
In large cohort studies, due to the time-consuming nature of the measurement of movement biomechanics, more than one evaluator needs to be involved. This may increase the potential occurrence of error due to inaccurate positioning of markers to the anatomical locations. The purpose of this study was to determine the reliability and objectivity of lower limb segments length by multiple evaluators in a large cohort study concerning healthy aging in an industrial environment. A total of eight evaluators performed marker placements on five participants on three different days. Evaluators placed markers bilaterally on specific anatomical locations of the pelvis, thigh, shank and foot. On the right foot, markers were placed in anatomical locations to define a multi-segmental foot model. The position of the marker at the anatomical locations was recorded by a motion capture system. The reliability and objectivity of lower limb segment lengths was determined by the intraclass correlation coefficient of a two-way random model and of the two-way mixed model, respectively. For all evaluators for all segments, the average reliability and objectivity was greater than 0.8, except for the metatarsus segment (0.683). Based on these results, we can conclude that multiple evaluators can be engaged in a large cohort study in the placement of anatomical markers.

1. Introduction

Musculoskeletal health status is one of the main goals of preventive strategies from a healthy aging perspective. These strategies focus on an active lifestyle to reduce the impact of obesity, cardiovascular diseases, malignancy, bone health and diabetes. Musculoskeletal diseases, however, can have adverse effects as they limit the ability of individuals to make changes towards an active lifestyle [1]. The success of the medical system has increased longevity with the result that the general population is living longer with accompanying chronic musculoskeletal diseases [2]. To understand these musculoskeletal health conditions, biomechanics research studies should focus on an epidemiologically reasonable size of the population. In the past decade, prospective studies have utilized approximately 10 to 500 participants when analyzing running [3,4,5] and 10 to 150 when analyzing walking [6,7,8]. Recently, there has been an acceleration in the progress of measurement technologies and data analysis, making it possible to obtain much larger sample sizes for epidemiological research purposes. Correct placement of the anatomical markers is necessary for further biomechanical analysis. However, the main problem persists with the objectivity of marker placement for kinematic movement analysis.
In large cohort studies, it is necessary to involve more than one evaluator due to the time-consuming nature of the motion capture measurement [9]. The project from which these data are taken (HAIE—Program 4, www.4haie.cz, accessed on 20 January 2021) is a large-scale research study and will investigate the potential impact of physical activity in highly polluted air on musculoskeletal health [10]. Unfortunately, the large participant pool has the potential to increase the number of errors caused by inaccurate marker placement when more than one evaluator is involved [11]. It has been shown that the kinematic data of gait is affected by up to 75% due to human error [12]. On the other hand, it has been also shown that the second evaluator does not substantially impact the interclass correlation coefficient or the minimal detectable change values for kinematic and kinetic measures of gait [13]. A key element in motion caption analysis is to identify the length of the segment at the beginning of the measurement [14]. The length of the segment is a parameter in many calculations of the kinematics and kinetics of gait [15]. However, previous methodological studies have focused only on the resulting gait kinematics [9,16,17].
Therefore, investigation into whether the placement of markers by different evaluators can affect reliability and objectivity is necessary. This is especially important in quantitative projects with a large sample size such as the HAIE project (1500 participants). For these large-scale projects, it is common to use more than one evaluator which can lead to an increased chance of human error. Therefore, it is necessary to determine the objectivity to make the measured data relative. The present technique is well known in motion capture systems [9,12,16,18,19,20,21]. Earlier research examined relatively small samples of the population, so there was no need to involve a larger number of examiners in the measurements. With technological advances, such as the automatic identification of markers, did it become financially affordable to carry out measurements on large cohorts. Thus, we need to standardize the potentially largest source of error. We have to point out that this marker placement technique is used in other motion capture system [22,23,24] and also in MRI measurement [25]. The novelty and purpose of this study was to determine the reliability and objectivity of the lower limb segment length on different days by multiple evaluators using a motion capture system. We hypothesized that a value greater than 0.8 for reliability and objectivity for each segment would be found with data from the HAIE project. We also anticipated that the standard error measurement would be less than 5%. The results of this research can be useful in all systems that need to identify significant points of the human body with a multiple number of examiners on different days by retroreflective markers.

2. Methods

2.1. Participants

Three males and two females, who were not part of the HAIE project, were used as participants in this study. They served as models for marker placement. The HAIE project divided the population into active and inactive participants according to a certain criteria [10]. In total, three of them were classified as active and two were classified as inactive. The basic anthropometric data (age, height, weight and body mass index) of the participants were 28.6 ± 9.3 y, 1.77 ± 0.2 m; 79.8 ± 20.6 kg; and 25.6 ± 4.8 kg/m2, respectively.

2.2. Experimental Set-Up

Eight evaluators participated in marker placement within the biomechanical measurement of project HAIE. The evaluators (M1 to M8) had 4 to 6 years’ experience (approximately 50–300 participants) with palpating participants within their research studies. Each evaluator graduated in the human movement analysis field and obtained a license in physiotherapy. Evaluators M2 and M6 were also trained in marker placement and analysis of human movement capture at the Department of Kinesiology, University of Massachusetts, Amherst, MA, USA.
A motion capture system was used to detect retroreflective markers by ten infrared cameras (9× Oqus 700+, 1× Oqus 510+, Qualisys, Inc., Gothenburg, Sweden) located around the lab at a height of 2.5 m. A sampling frequency of 240 Hz was used to record the marker position data. Before each measurement, a global coordinate system was calibrated with a wand calibration kit based on Qualisys recommendation (Qualisys, Inc., Gothenburg, Sweden).

2.3. Protocol

At the beginning of the measurement, participants wore neutral laboratory running shoes (Brooks Launch 5, Brooks Sport Inc., Seattle, WA, USA) predetermined for use in the HAIE project. To determine the reliability and objectivity of marker placement and consequently segment length, each evaluator placed retroreflective markers on five participants on three different days. In total, 32 individual retroreflective markers and four marker cluster plates containing four fixed markers (9.5 mm diameter Pearl Markers) were attached bilaterally to specific anatomical locations of the pelvis, thigh, shank and foot. Each evaluator placed retroreflective calibration and tracking markers on the pelvis bilaterally and on the anterior and posterior superior iliac spines. Markers were placed on the right and left greater trochanters of the femur, the medial and lateral femoral condyles, and the medial and lateral malleoli. Marker cluster plates were also placed on the thigh and shank [26]. On the left foot, markers were placed on the head of the first and fifth metatarsal heads along with three markers placed on the heel. On the right foot, the markers were placed on the most distal and dorsal point of the head of the proximal phalanx of the hallux, the head and base of the first, second and fifth metatarsals, the most medial apex of the tuberosity of the navicular, the most medial apex of the sustenaculum tali, the lateral apex of the peroneal tubercle and triad markers on the heel [27,28]. The participant then stood at a specifically labelled position in the calibration space during which a standing calibration trial was recorded.

3. Data Analysis

Markers in the standing calibration trial were labeled according to the recommendation in Qualisys Track Manager software (Qualisys, Sweden). Visual 3D v6 (C-Motion, Rockville, MD, USA) was used to create a skeletal model of the pelvis and the lower extremity. The pelvis segment was modeled as a cylinder and the foot, thigh, and shank segments as right circular cones [29]. The hip joint center was specified according to the C-Motion recommendation with a radius correction, which was defined as the distance between the hip joint center and the greater trochanter of the femur [30]. The knee joint center position was defined as the mid-point between the medial and lateral femoral epicondyles, while the ankle joint center was defined as the mid-point of the medial and lateral malleoli [31].
Pelvis length was created by calibration and target the markers right and left anterior superior iliac spine, right and left posterior superior iliac spine. Thigh length segment was defined as the distance between the hip joint center and the knee joint center. Shank length segment was defined as the distance between the knee joint center and the ankle joint center. The length of the foot was determined as the distance between the ankle joint center and the mid-point between the head of the first and fifth metatarsals. Two landmarks were created to define the length of the calcaneus. The distal part of the calcaneus was defined as the center between two lower points on the calcaneus (Figure 1 and Figure 2, Table 1). The end of the proximal part was defined as the mid-point between the most medial apex of the sustenaculum tali and the lateral apex of the peroneal tubercle. Mid-foot length was defined as the distance between base of the second metatarsal and the joint center determined by most medial apex of the tuberosity of the navicular and base of the fifth metatarsal. Metatarsus length was determined as the distance between base of the second metatarsal and the joint center created from heads of the first and fifth metatarsals [27,32].

4. Statistical Analysis

Lower limb segment length reliability and objectivity were determined by the intraclass correlation coefficient of the two-way random model (ICC2,1) and the interclass correlation coefficient of the two-way mixed model (ICC3,k), respectively [33,34]. In addition, for reliability and objectivity, the standard error measurement (SEM), the minimal detectable change (MDC), and their percentage of the mean were calculated [33]. For lower limb segment length reliability, the mean, standard deviation (SD), SEM, %SEM, MDC, and %MDC were calculated for each evaluator for each segment from the five participants from three standing calibration trials. The mean, SD, SEM, %SEM, MDC, and %MDC were averaged from 8 evaluators for each segment. For lower limb segment length objectivity, the ICC was calculated from all three standing calibration trials and from each standing calibration trial. The presented mean, SD, SEM, %SEM, MDC, and %MDC were calculated from the average value of individual final values from five participants from 8 evaluators. ICC were interpreted based on the following classifications: less than 0.5 poor, between 0.5 and 0.75 moderate, between 0.75 and 0.9 good, and more than 0.90 excellent [35]. All data were calculated using the IBM SPSS Statistics 24 (IBM SPSS Inc., Chicago, IL, USA).
For the considered data, which are necessary for the computation of the further provided arithmetical averages of evaluators, the testing the normality was consistently obtained always as pα. The achieved p-values can be seen in Table 2. The significance value α was declared as 0.001. For the purposes of the proof of the normality of data, the Shapiro-Wilk test was chosen and applied in the frame of the statistical software SPSS. For data, which fulfills the property of the normal probability distribution, the following determination of the reliability criterion can be suitable expressed by using the z-scores, which can be utilized for the normal distributed data.

5. Results

The average reliability of the lower limb segment length of all evaluators for all segments was greater than 0.8, except for the right metatarsus segment (0.683). Table 3 shows the reliability of the lower limb segment length of individual evaluators. Most of the segments except multi-segmental foot had a reliability greater than 0.9, except for evaluators M1 (left thigh = 0.620), M4 (right thigh = 0.856) and M7 (left thigh = 0.890 and right thigh = 0.815). The lowest ICC were from evaluators M1 and M5 on the right metatarsus (0.402 and 0.318) and from evaluator M4 on the right calcaneus (0.322). The largest %SEM and %MDC of marker placement was 6.26% and 17.35% on the right metatarsus of the multi-segment foot (Table 4).
Lower limb segment length objectivity was greater than 0.8 for all evaluators for all segments. Table 5 presents the objectivity of lower limb segment length in individual rounds. The lowest objectivity score of the lower limb segment length was in the right metatarsus segment, both in single standing calibration trials and for all records (0.694–0.860). The %SEM was less than 4% and the %MDC was less than 9% (Table 6).

6. Discussion

The aim of this study was to assess the importance of marker placement reliability and objectivity using motion analysis data. For a project that deals with a large cohort, where measurements are undertaken by more than one evaluator, it is necessary to determine the reliability and objectivity of the data. It was hypothesized that evaluators with an average of five years of experience would be able to achieve a higher value than 0.8 for reliability and objectivity for each segment. This study confirmed, on average, higher reliability and objectivity values greater than 0.8 for every segment except for the right metatarsus.
The first part of our study was to determine reliability. Although the marker placement was performed on three different days, we achieved high reliability with all evaluators. This finding does not necessarily mean that the results of the resulting kinematic and kinetic data will also be reliable. Nevertheless, based on previous research focused on the reliability of gait analysis, we assume that the position marker data estimated by our evaluators is highly reliable [10,12]. However, we must take into account that the resulting values were influenced by the application of markers, the identification of anatomical landmarks, data processing, the laboratory setting, and especially by the natural variability of human factors [34,35]. In addition, it needs to be emphasized that the segment length is entered as the main parameter for calculating the kinematic and kinetic data of a gait analysis. Hence, we decided to choose only the length of the segment. Therefore, it is of utmost importance to know that similar results can be achieved by repeatedly determining the length of the lower limb segments. According to the result of determining the segment length of individual evaluators, the reliability was between 0.75 and 0.9, signifying ‘good’ reliability [35]. The question remains whether individual evaluators are able to determine the length of the segments similarly.
The results of the second part of objectivity were surprisingly consistent even though eight different evaluators were used in our study which is more than what has been evaluated in previous studies [11]. In the current study, a “strong” objectivity was achieved for every segment except the right metatarsus. Based on previous research that focused on the objectivity of gait analysis [9,11], we can assume that the resulting kinematic and kinetic data would also be highly reliable. Despite the high experience of evaluators with marker placement, meta-tarsal segment had a lower reliability and objectivity, which is probably due to less experience with marker placement at the multi-segment foot. The standard deviation of the calibration is the difference between the actual wand length and the length perceived by the cameras. Therefore, it is best that the standard deviation in the calibration is a very small number. Values of the standard deviation of wand length in our calibrations are in the range of 0.5–0.8 mm. These values are very low and will have a negligible effect on the segment length results than can occur with evaluator error. The obtained data were measured in the Qualisys Track manager (Qualisys, Sweden), which is one of several leading analysis systems in the field of motion capture. According to a comparative study, it is possible to generalize the resulting values for other motion capture systems [36,37,38,39,40].
The main limitation of this study is that we focused on only one parameter (segment length). In this study, we did not analyze the orientation of the segment in the measurement which is another limitation. The limitations of the software and hardware play an integral part of the present data, but it is a negligible factor when comparing of errors caused by the human placement of markers and soft tissue movement. Typical errors of motion capture systems are less than 1 mm [12,38]. Consequently, in repeated measurements of gait analysis capture, we are not able to distinguish the errors between measurement and natural biological variability [41]. On the other hand, the strength of this research is the relatively high number of evaluators and data collected from three different days. Further studies, which take other parameters into account, should be undertaken.

7. Conclusions

Eight different evaluators determined similar segment lengths by repeatedly measuring the size of the segments. We achieved “good” reliability and objectivity of segment length determination at all except one lower extremity segment and moderate reliability and objectivity at the metatarsus segment. From the current study, therefore, it can be concluded that multiple evaluators may be utilized in large cohort motion analysis studies. This work may contribute to the pre data collected phase of large biomechanical studies.

Author Contributions

Conceptualization, J.F.S., D.J. and J.H.; methodology, J.F.S., D.J., J.S., J.M., J.U., and J.H.; formal analysis, J.M. and J.S.; investigation, J.M.; writing—original draft preparation, J.M., J.S. and D.J.; writing—review and editing, J.F.S., J.U., T.B., J.H.; supervision, D.J.; funding acquisition, D.J. All authors have read and agreed to the published version of the manuscript.

Funding

This research was co-funded by European union and Ministry of Education, Youth and Sports of the Czech Republic, grant number CZ.02.1.01/0.0/0.0/16_019/0000798 Program 4 Healthy Aging in Industrial Environment.

Institutional Review Board Statement

The study was conducted according to the guidelines of the Declaration of Helsinki, and approved by the Ethics Committee of University of Ostrava (protocol code OU-87674/90-2018 and date of approval 29 November 2018).

Informed Consent Statement

Informed consent was obtained from all subjects involved in the study.

Acknowledgments

The authors would like to thank Matt Zimmerman for helpful and constructive comments.

Conflicts of Interest

The authors declare no conflict of interest. The funders had no role in the design of the study; in the collection, analyses, or interpretation of the data; in the writing of the manuscript, or in the decision to publish the results.

References

  1. Briggs, A.M.; Cross, M.J.; Hoy, D.G.; Sànchez-Riera, L.; Blyth, F.M.; Woolf, A.D.; March, L. Musculoskeletal Health Conditions Represent a Global Threat to Healthy Aging: A Report for the 2015 World Health Organization World Report on Ageing and Health. Gerontologist 2016, 56, S243–S255. [Google Scholar] [CrossRef] [PubMed] [Green Version]
  2. Joshipura, M.; Mock, C.; Gosselin, R.A. Global burden of musculoskeletal conditions. Glob. Orthop. Caring Musculoskelet. Cond. Inj. Austere Settings 2014, 9–11. [Google Scholar]
  3. Hetsroni, I.; Finestone, A.; Milgrom, C.; Ben Sira, D.; Nyska, M.; Radeva-Petrova, D.; Ayalon, M. A prospective biomechanical study of the association between foot pronation and the incidence of anterior knee pain among military recruits. J. Bone Jt. Surg.-Ser. B 2006, 88, 905–908. [Google Scholar] [CrossRef] [Green Version]
  4. Sancho, I.; Malliaras, P.; Barton, C.; Willy, R.W.; Morrissey, D. Biomechanical alterations in individuals with Achilles tendinopathy during running and hopping: A systematic review with meta-analysis. Gait Posture 2019, 73, 189–201. [Google Scholar] [CrossRef]
  5. Ceyssens, L.; Vanelderen, R.; Barton, C.; Malliaras, P.; Dingenen, B. Biomechanical Risk Factors Associated with Running-Related Injuries: A Systematic Review. Sport. Med. 2019, 49, 1095–1115. [Google Scholar] [CrossRef] [PubMed] [Green Version]
  6. Bahl, J.S.; Nelson, M.J.; Taylor, M.; Solomon, L.B.; Arnold, J.B.; Thewlis, D. Biomechanical changes and recovery of gait function after total hip arthroplasty for osteoarthritis: A systematic review and meta-analysis. Osteoarthr. Cartil. 2018, 26, 847–863. [Google Scholar] [CrossRef] [Green Version]
  7. Buldt, A.K.; Murley, G.S.; Butterworth, P.; Levinger, P.; Menz, H.B.; Landorf, K.B. The relationship between foot posture and lower limb kinematics during walking: A systematic review. Gait Posture 2013, 38, 363–372. [Google Scholar] [CrossRef]
  8. Cheung, A.S.; Gray, H.; Schache, A.G.; Hoermann, R.; Lim Joon, D.; Zajac, J.D.; Pandy, M.G.; Grossmann, M. Androgen deprivation causes selective deficits in the biomechanical leg muscle function of men during walking: A prospective case–control study. J. Cachexia Sarcopenia Muscle 2017, 8, 102–112. [Google Scholar] [CrossRef]
  9. Schwartz, M.H.; Trost, J.P.; Wervey, R.A. Measurement and management of errors in quantitative gait data. Gait Posture 2004, 20, 196–203. [Google Scholar] [CrossRef] [PubMed] [Green Version]
  10. Jandacka, D.; Uchytil, J.; Zahradnik, D.; Farana, R.; Vilimek, D.; Skypala, J.; Urbaczka, J.; Plesek, J.; Motyka, A.; Blaschova, D.; et al. Running and Physical Activity in an Air-Polluted Environment: The Biomechanical and Musculoskeletal Protocol for a Prospective Cohort Study 4HAIE (Healthy Aging in Industrial Environment—Program 4). Int. J. Environ. Res. Public Health 2020, 17, 9142. [Google Scholar] [CrossRef]
  11. McGinley, J.L.; Baker, R.; Wolfe, R.; Morris, M.E. The reliability of three-dimensional kinematic gait measurements: A systematic review. Gait Posture 2009, 29, 360–369. [Google Scholar] [CrossRef]
  12. Gorton, G.E.; Hebert, D.A.; Gannotti, M.E. Assessment of the kinematic variability among 12 motion analysis laboratories. Gait Posture 2009, 29, 398–402. [Google Scholar] [CrossRef]
  13. Wilken, J.M.; Rodriguez, K.M.; Brawner, M.; Darter, B.J. Reliability and minimal detectible change values for gait kinematics and kinetics in healthy adults. Gait Posture 2012, 35, 301–307. [Google Scholar] [CrossRef]
  14. Hamill, J.; Selbie, W.; Kepple, T. Three-dimensional Kinematics. In Research Methods in Biomechanics; Robertson, D., Caldwell, G., Hamill, J., Kamen, G., Whittlesey, S., Eds.; Human Kinetics: Champaign, IL, USA, 2013; pp. 35–60. [Google Scholar]
  15. Robertson, D.G.E.; Caldwell, G.E.; Hamill, J.; Kamen, G.; Whittlesey, S.N. Research Methods in Biomechanics; Human Kinetics: Champaign, IL, USA, 2014; ISBN 9781492595809. [Google Scholar]
  16. Maynard, V.; Bakheit, A.M.O.; Oldham, J.; Freeman, J. Intra-rater and inter-rater reliability of gait measurements with CODA mpx30 motion analysis system. Gait Posture 2003, 17, 59–67. [Google Scholar] [CrossRef]
  17. McGinley, J.; Baker, R.; Wolfe, R. Quantification of kinematic measurement variability in gait analysis. Gait Posture 2006, 24, S55–S56. [Google Scholar] [CrossRef]
  18. Kadaba, M.; Ramakrishnan, H.; Wooten, M.; Gainey, J.; Gorton, G.; Cochran, G.V.B. Repeatability of kinematic, kinetic, and electromyographic data in normal adult gait. J. Orthop. Res. 1989, 7, 849–860. [Google Scholar] [CrossRef] [PubMed]
  19. Ferber, R.; McClay-Davis, I.; Williams, D.; Laughton, C. A comparison of within- and between-day reliability of discrete 3D lower extremity variables in runners. J. Orthop. Res. 1989, 20, 1139–1145. [Google Scholar] [CrossRef]
  20. Ford, K.; Myer, G.; Hewett, T. Reliability of landing 3D motion analysis: Implications for longitudinal analyses. Med. Sci. Sport. Exerc. 2007, 39, 2021–2028. [Google Scholar] [CrossRef]
  21. Besier, T.; Sturnicks, D.; Alderson, J.A.; Lloyd, D.G. Repeatability of gait data using a functional hip joint centre and a mean helical knee axis. J. Biomech. 2003, 36, 1159–1168. [Google Scholar] [CrossRef]
  22. Rast, F.M.; Graf, E.S.; Meichtry, A.; Kool, J.; Bauer, C.M. Between-day reliability of three-dimensional motion analysis of the trunk: A comparison of marker based protocols. J. Biomech. 2016, 49, 807–811. [Google Scholar] [CrossRef]
  23. Noehren, B.; Manal, K.; Davis, I. Improving between-day kinematic reliability using a marker placement device. J. Orthop. Res. 2010, 28, 1405–1410. [Google Scholar] [CrossRef]
  24. Kainz, H.; Hoang, H.; Stockton, C.; Boyd, R.N.; Lloyd, D.G.; Carty, C.P. Accuracy and reliability of marker based approaches to scale the pelvis, thigh and shank segments in musculoskeletal models. J. Appl. Biomech. 2017, in press. [Google Scholar] [CrossRef]
  25. Bishop, C.; Thewlis, D.; Uden, H.; Ogilvie, D.; Paul, G. A radiological method to determine the accuracy of motion capture marker placement on palpable anatomical landmarks through a shoe. Footwear Sci. 2011, 3, 169–177. [Google Scholar] [CrossRef] [Green Version]
  26. Mcclay, I.; Manal, K. Three-dimensional kinetic analysis of running: Significance of secondary planes of motion. Med. Sci. Sport. Exerc. 1999, 31, 1629–1637. [Google Scholar] [CrossRef] [PubMed]
  27. Leardini, A.; Benedetti, M.G.; Berti, L.; Bettinelli, D.; Nativo, R.; Giannini, S. Rear-foot, mid-foot and fore-foot motion during the stance phase of gait. Gait Posture 2007, 25, 453–462. [Google Scholar] [CrossRef] [PubMed]
  28. Portinaro, N.; Leardini, A.; Panou, A.; Monzani, V.; Caravaggi, P. Modifying the Rizzoli foot model to improve the diagnosis of pes-planus: Application to kinematics of feet in teenagers. J. Foot Ankle Res. 2014, 7, 754. [Google Scholar] [CrossRef] [Green Version]
  29. Hanavan, E.P.J. A mathematical model of the human body. Aerosp. Med. Res. Lab. 1964, 1–149. [Google Scholar]
  30. C-motion Tutorial: IOR Gait Full-Body Model. Available online: https://www.c-motion.com/v3dwiki/index.php?title=Tutorial%3A_IOR_Gait_Full-Body_Model&fbclid=IwAR0fv2MbKy1KaYVL99ShLc061bZtKIt6W7zZnPnl5mGtfJ6WwGwG0ywwVRc (accessed on 10 December 2020).
  31. C-motion Tutorial: Building a Model. Available online: https://www.c-motion.com/v3dwiki/index.php?title=Tutorial:_Building_a_Model (accessed on 10 December 2020).
  32. C-motion Tutorial: IOR Foot Model. Available online: https://www.c-motion.com/v3dwiki/index.php?title=Tutorial:_IOR_Foot_Model (accessed on 10 December 2020).
  33. Weir, J.P. Quantifying Test-Retest Reliability Using the Intraclass Correlation Coefficient and the SEM. J. Strength Cond. Res. 2005, 19, 231. [Google Scholar] [CrossRef] [PubMed]
  34. Richard, L. Computing Intraclass Correlations (ICC) as Estimates of Interrater Reliability in SPSS. Winnower 2015, 8, 1–4. [Google Scholar] [CrossRef] [Green Version]
  35. Portney, L.G.; Watkins, M.P. Foundations of Clinical Research: Applications to Practice; Prentice Hall: Upper Saddle River, NJ, USA, 2000. [Google Scholar]
  36. Pourahmadi, M.R.; Takamjani, I.E.; Jaberzadeh, S.; Sarrafzadeh, J.; Sanjari, M.A.; Bagheri, R.; Taghipour, M. Kinematics of the spine during sit-to-stand movement using motion analysis systems: A systematic review of literature. J. Sport Rehabil. 2019, 28, 77–93. [Google Scholar] [CrossRef] [PubMed] [Green Version]
  37. Lempereur, M.; Brochard, S.; Leboeuf, F.; Rémy-Néris, O. Validity and reliability of 3D marker based scapular motion analysis: A systematic review. J. Biomech. 2014, 47, 2219–2230. [Google Scholar] [CrossRef] [PubMed]
  38. Topley, M.; Richards, J.G. A comparison of currently available optoelectronic motion capture systems. J. Biomech. 2020, 106, 109820. [Google Scholar] [CrossRef] [PubMed]
  39. Richards, J.G. The measurement of human motion: A comparison of commercially available systems. Hum. Mov. Sci. 1999, 18, 589–602. [Google Scholar] [CrossRef]
  40. Valevicius, A.M.; Jun, P.Y.; Hebert, J.S.; Vette, A.H. Use of optical motion capture for the analysis of normative upper body kinematics during functional upper limb tasks: A systematic review. J. Electromyogr. Kinesiol. 2018, 40, 1–15. [Google Scholar] [CrossRef] [PubMed]
  41. Hamill, J.; van Emmerik, R.E.; Heiderscheit, B.C.; Li, L. A dynamical systems approach to lower extremity running injuries. Clin. Biomech. 1999, 14, 297–308. [Google Scholar] [CrossRef]
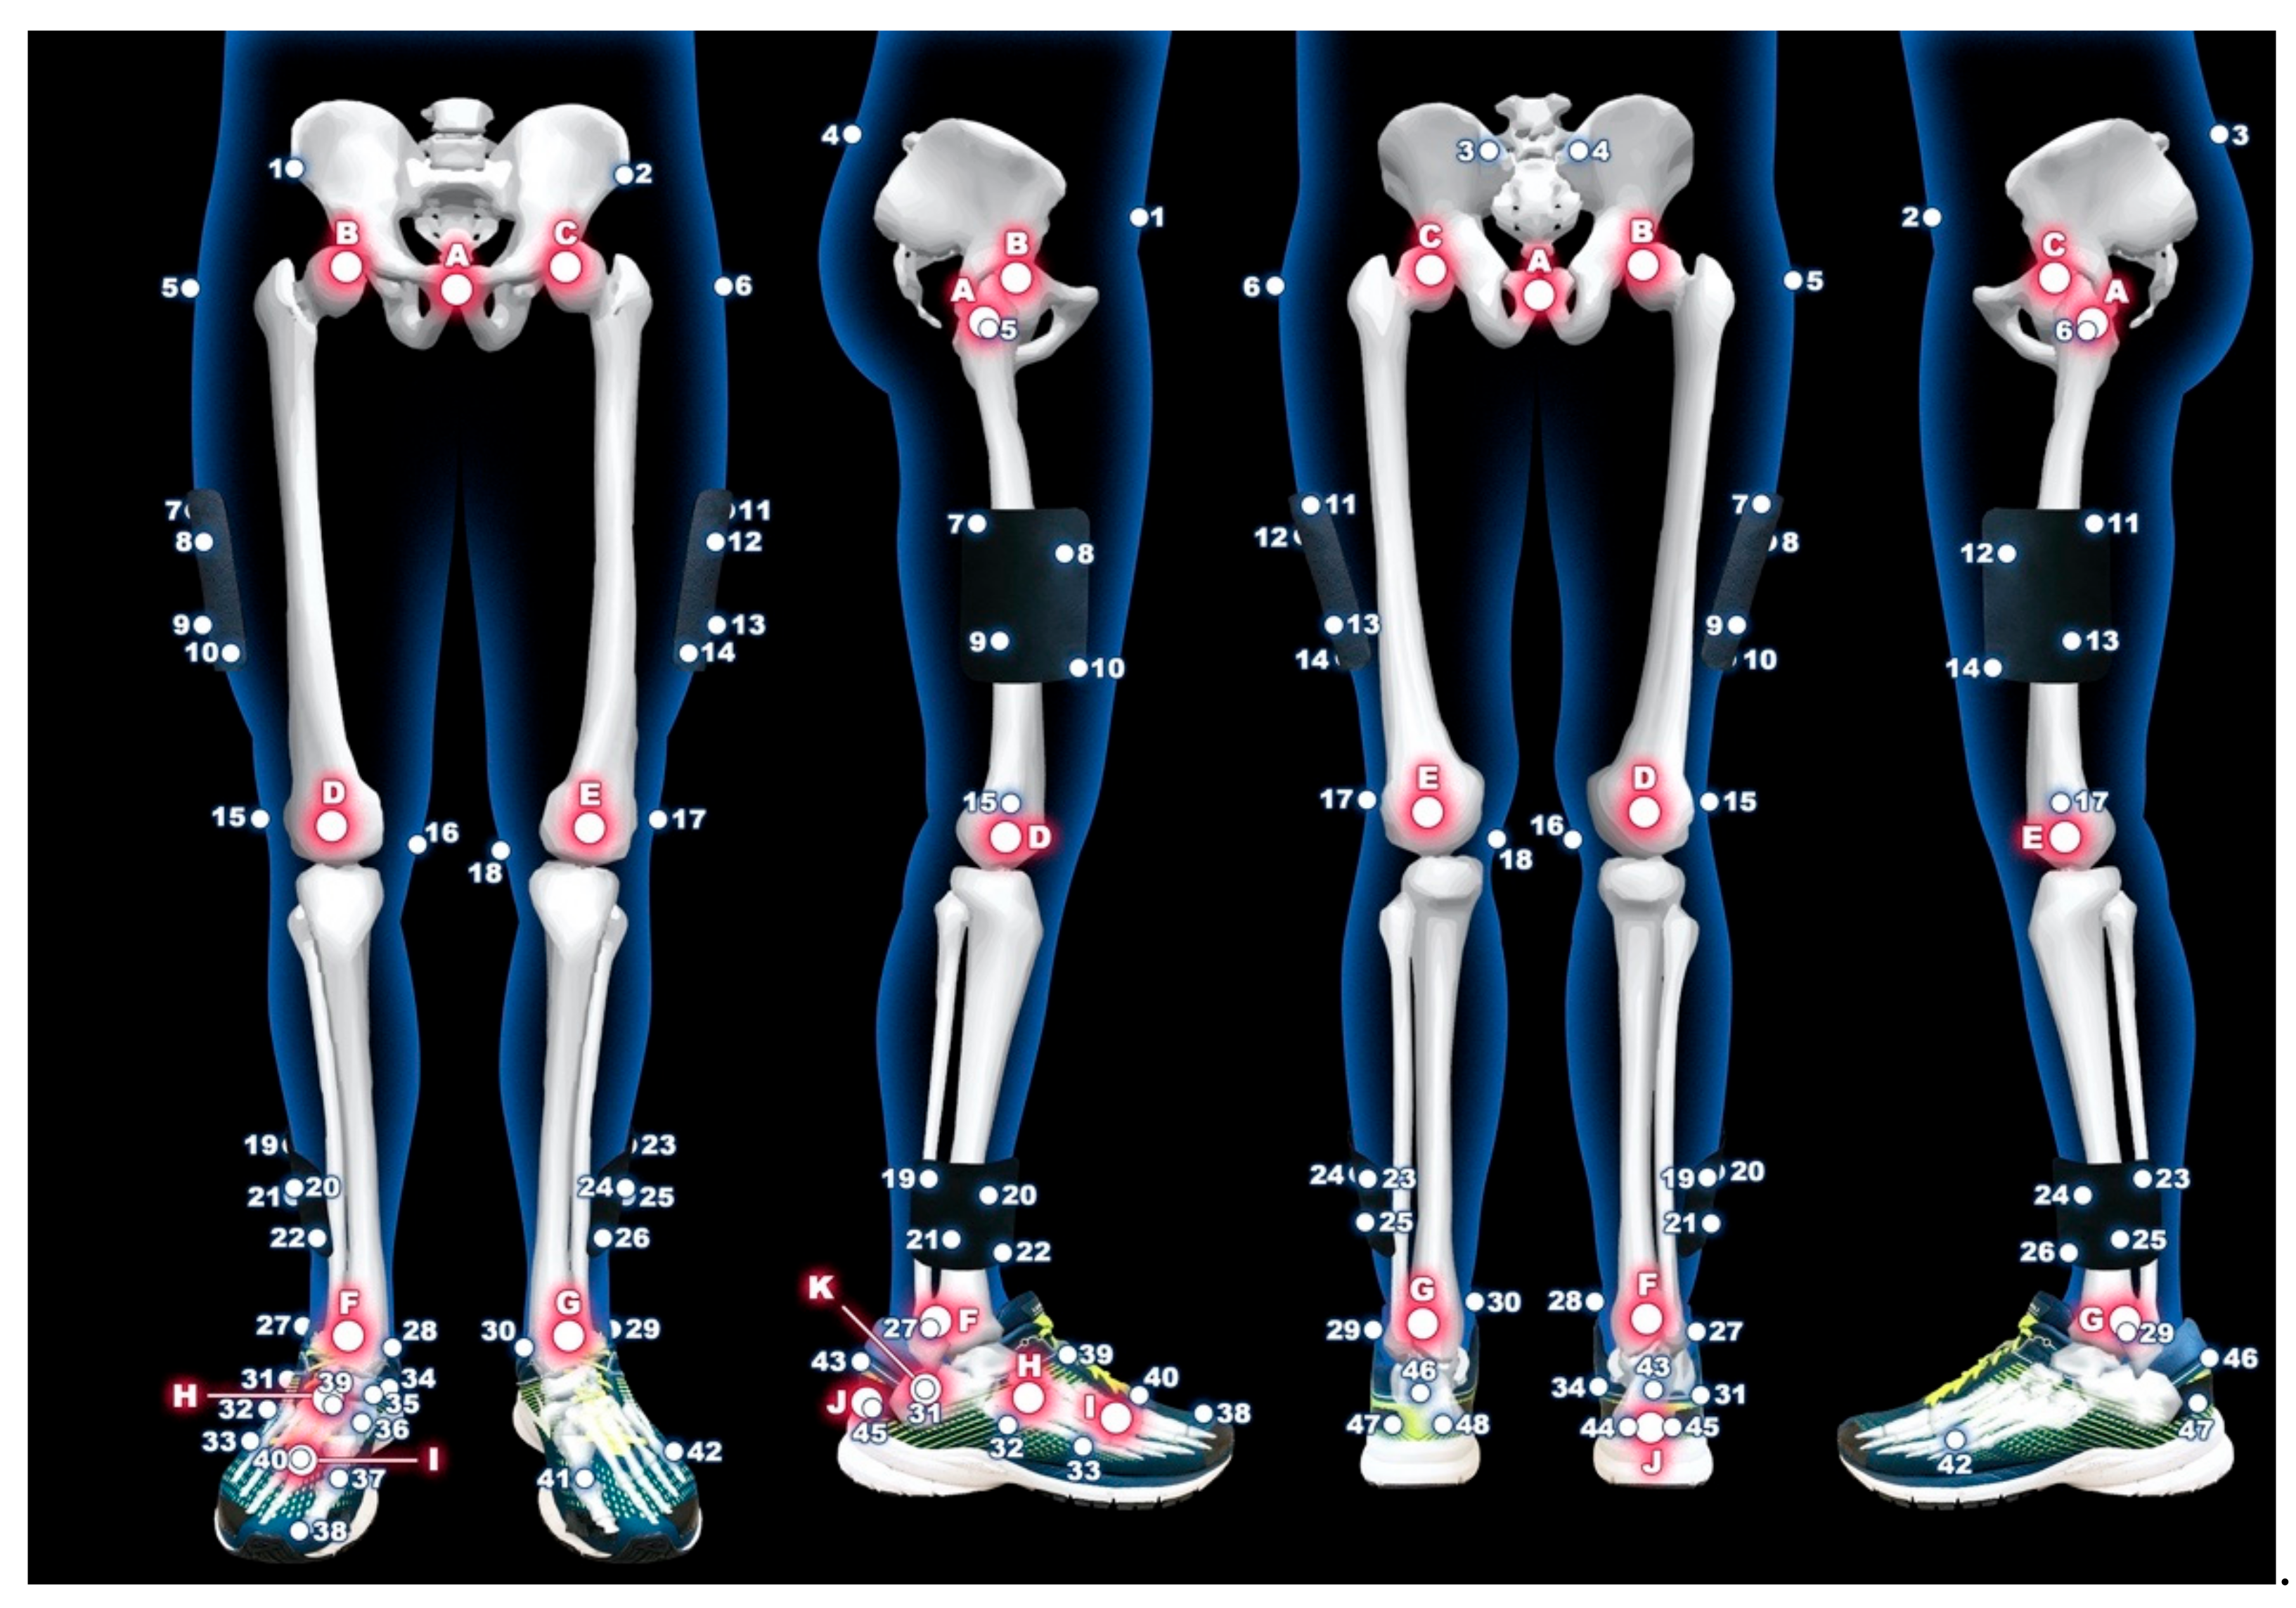
Figure 1. Marker placement model of lower extremities.
Sensors 21 01830 g001
Figure 2. Marker placement multi-segmental model.
Sensors 21 01830 g002
Table 1. The legend for Figure 1 and Figure 2.
NumberAnatomical LocationNumberAnatomical Location
1right anterior superior iliac spine29left lateral malleoli of ankle
2left anterior superior iliac spine30left medial malleoli of ankle
3left posterior superior iliac spine31right lateral apex of the peroneal tubercle
4right posterior superior iliac spine32right base of the fifth metatarsal
5right great trochanter of the femur33right head of the fifth metatarsal
6left great trochanter of the femur34right most medial apex of the sustentaculum tali
7–10right marker cluster plate on the thigh35right most medial apex of the tuberosity of the navicular
11–14left marker cluster plate on the thigh36right base of the first metatarsal
15right lateral femoral condyle of knee37right head of the first metatarsal
16right medial femoral condyle of knee38head of the proximal phalanx of the hallux
17left lateral femoral condyle of knee39right base of the second metatarsal
18left medial femoral condyle of knee40right head of the second metatarsal
19–22right marker cluster plate on the shank41left head of the first metatarsal
23–26left marker cluster plate on the shank42left head of the fifth metatarsal
27right lateral malleoli of ankle43–45triad markers on the right heel
28right medial malleoli of ankle46–48triad markers on the left heel
LetterLandmarkLetterLandmark
Acenter between no.5 and no.6Gleft ankle joint center
Bright hip joint centerHcenter between no.32 and no.35
Cleft hip joint centerIcenter between no.33 and no.37
Dright knee joint centerJcenter between no.44 and no.45
Eleft knee joint centerKcenter between no.31 and no.34
Fright ankle joint center
Table 2. Achieved Results of Testing Normality of Data Using Shapiro-Wilk Test.
p-Values of the Shapiro-Wilk Test
PELRTHLTHRSKLSKRFLFRCRMFRM
M10.2770.8200.1220.0090.3020.4460.3350.1070.5820.274
M20.0950.4850.0740.0130.0340.6910.3050.6190.0390.054
M30.0270.0790.1010.0310.0250.5270.6060.8730.6750.459
M40.0930.2590.1260.0850.0280.2860.6810.8130.0440.525
M50.0250.1090.3200.0320.0090.3470.5120.3560.6070.271
M60.0800.3800.3080.0010.0040.9280.3590.1080.8910.832
M70.0100.2880.0980.0110.1320.2440.4460.6540.6660.568
M80.0670.2220.1250.0050.0510.6130.2020.0970.1280.420
PEL—Pelvis; RTH—Right thigh; LTH—Left Thigh; RSK—Right shank; LSK—Left shank; RF—Right Foot; LF—Left foot; RC—Right calcaneus; RM—Right metatarsus; RMF—Right mid-foot
Table 3. Reliability of lower limb segments length. Mean intraclass correlation computed from all records of each segment by eight evaluators (M1–M8). ICC_mean was calculated from eight evaluators.
SegmentM1_ICCM2_ICCM3_ICCM4_ICCM5_ICCM6_ICCM7_ICCM8_ICCICC_Mean
PEL0.9720.9680.9940.9820.9860.9850.9880.9560.979
RTH0.9310.9590.9830.8560.9910.9720.8150.9830.936
LTH0.6200.9540.9750.9580.9740.9670.8900.9780.915
RSK0.9820.9950.9850.9710.9860.9890.9890.9920.986
LSK0.9790.9770.9860.9770.9860.9750.9920.9840.982
RF0.9570.9820.9880.9860.9950.9800.9950.9820.983
LF0.9820.9800.9810.9850.9930.9860.9840.9870.985
RC0.8510.8820.8970.3220.9140.8550.9360.7710.804
RM0.4020.8180.5410.8480.3180.9240.8390.7700.683
RMF0.9130.8840.9310.6970.9240.9470.8620.9600.890
ICC—Intraclass correlation coefficient; PEL—Pelvis; RTH—Right thigh; LTH—Left Thigh; RSK—Right shank; LSK—Left shank; RF—Right Foot; LF—Left foot; RC—Right calcaneus; RM—Right metatarsus; RMF—Right mid-foot.
Table 4. Reliability of lower limb segments length. Mean (X), standard deviation (SD), standard error measurement (SEM), minimal detectable change (MDC), and their percentage of the mean from eight evaluators.
SegmentX (cm)SD (cm)SEM (cm)MDC (cm)%SEM%MDC
PEL13.521.390.190.541.433.95
RTH43.212.530.541.501.253.46
LTH43.112.550.651.791.494.12
RSK40.932.760.310.870.772.13
LSK40.742.770.361.010.902.48
RF13.801.260.160.431.133.12
LF13.941.260.150.431.103.05
RC6.080.910.361.016.0816.85
RM5.780.710.361.006.2617.35
RMF5.910.590.180.513.148.69
PEL—Pelvis; RTH—Right thigh; LTH—Left Thigh; RSK—Right shank; LSK—Left shank; RF—Right Foot; LF—Left foot; RC—Right calcaneus; RM—Right metatarsus; RMF—Right mid-foot.
Table 5. Objectivity of lower limb segments length. Mean interclass correlation coefficient computed from three single standing calibration trials and from all records of each segment by eight evaluators.
SegmentICC1ICC2ICC3ICC95% Confidence Interval
Lower BoundUpper Bound
PEL0.9900.9900.9900.9950.9840.999
RTH0.9430.9650.9880.9810.9380.998
LTH0.9790.9680.9890.9900.9680.999
RSK0.9940.9910.9910.9960.9871.000
LSK0.9930.9910.9880.9950.9850.999
RF0.9900.9970.9950.9980.9931.000
LF0.9930.9920.9940.9970.9891.000
RC0.9480.9510.9350.9750.9170.997
RM0.8050.7980.6940.8600.5410.984
RMF0.9420.9370.9430.9710.9030.997
ICC—Interclass correlation coefficient; PEL—Pelvis; RTH—Right thigh; LTH—Left Thigh; RSK—Right shank; LSK—Left shank; RF—Right Foot; LF—Left foot; RC—Right calcaneus; RM—Right metatarsus; RMF—Right mid-foot.
Table 6. Objectivity of lower limb segments length. Mean (X), standard deviation (SD), standard error measurement (SEM), minimal detectable change (MDC), and their percentage of the mean from eight evaluators.
SegmentX (cm)SD (cm)SEM (cm)MDC (cm)%SEM%MDC
PEL13.520.390.030.080.200.57
RTH43.211.190.160.450.381.05
LTH43.110.920.090.260.210.59
RSK40.931.070.070.190.160.46
LSK40.740.870.060.170.150.42
RF13.800.230.010.030.080.21
LF13.940.220.010.030.090.24
RC6.080.640.100.281.674.62
RM5.780.470.180.493.038.40
RMF5.910.530.090.251.544.27
PEL—Pelvis; RTH—Right thigh; LTH—Left Thigh; RSK—Right shank; LSK—Left shank; RF—Right Foot; LF—Left foot; RC—Right calcaneus; RM—Right metatarsus; RMF—Right mid-foot.
Publisher’s Note: MDPI stays neutral with regard to jurisdictional claims in published maps and institutional affiliations.

